Abstract
Background:
Epidemiological and observational studies demonstrate a comorbid relationship between hypothyroidism and atherosclerotic cardiovascular disease (ASCVD). The nature and direction of this causal relationship, however, remain unclear.
Objective:
This study aims to elucidate the causal relationship between hypothyroidism and ASCVD using a bidirectional Mendelian randomization approach.
Method:
Single nucleotide polymorphisms (SNPs) associated with hypothyroidism were identified and selected as genetic instrumental variables from aggregated data of genome-wide association studies (GWAS). The outcome of interest, ASCVD, included seven conditions: coronary artery disease (CAD), angina pectoris (AP), myocardial infarction (MI), ischemic stroke (IS), and subtypes IS-large artery atherosclerosis (IS-LAA), IS-small vessels (IS-SV), and peripheral artery disease (PAD). MR analysis employed multiple methods—chiefly inverse variance weighting (IVW), along with MR Egger, weighted median, and weighted mode—to assess causality. Cochrane's Q test was utilized to evaluate heterogeneity in the MR findings. Causal association reliability was assessed using the MR-Egger intercept, MR-PRESSO tests, and leave-one-out analysis. Reverse MR analysis ensued if forward MR identified a positive exposure-outcome association. Moreover, the DAVID database facilitated GO functional and KEGG pathway enrichment analyses of neighboring genes to instrumental variables, exploring potential disease mechanisms.
Result:
GWAS pooled data yielded 122 SNPs as potential instrumental variables for hypothyroidism. Forward MR analysis, using the IVW method, indicated hypothyroidism as a risk factor for CAD (OR = 2.34, 95% CI = 1.39–3.94, P = 0.001), AP (OR = 2.01, 95% CI = 1.28–3.16, P = 0.002), MI (OR = 1.02, 95% CI = 1.01–1.04, P = 0.004), and IS-SV (OR = 6.92, 95% CI = 2.45–19.55, P < 0.001). However, no significant link was found between hypothyroidism and the remaining three diseases, with sensitivity analysis reinforcing result robustness. In contrast, reverse MR analysis did not corroborate a causal link from ASCVD to hypothyroidism. The R package identified 83 neighboring genes as instrumental variables. GO enrichment analysis via the DAVID database yielded 53 entries, predominantly involving cAMP catabolic processes, protein binding, and signal transduction. KEGG analysis identified 31 pathways, notably those related to Th1/Th2 and Th17 cell differentiation, and Herpes simplex virus 1 infection.
Conclusion:
The marked association between hypothyroidism and CAD, AP, MI, and IS suggests that thyroid function assessment could be integral to preventing and diagnosing specific ASCVD types. This underscores the need for individuals with hypothyroidism to be proactive regarding ASCVD risk factors. A balanced Th1/Th2 and Th17/Treg ratio may offer a novel strategy in preventing CAD and enhancing the prognosis for hypothyroid patients.
1 Introduction
1.1 Atherosclerotic cardiovascular disease
ASCVD comprises conditions such as ischemic heart disease, ischemic stroke (IS), and peripheral arterial disease, all of which arise from arterial plaque accumulation. Notably, cardiovascular diseases (CVDs) are increasingly prevalent (1), resulting in approximately 17.9 million deaths each year, or 32% (2) of global mortality. Coronary artery disease (CAD), a form of ASCVD, is particularly significant; it develops from the narrowing of coronary arteries and is a leading cause of death worldwide. IS, primarily presenting as cerebral infarctions, are classified by their etiology: large artery atherosclerosis, small vessel disease, or cardiogenic embolism (3). Such strokes impose a considerable toll on health, especially in terms of morbidity and mortality among middle-aged and elderly populations (4).
1.2 Hypothyroidism
Hypothyroidism is characterized by high concentrations of thyroid-stimulating hormone (TSH) with concomitant low concentrations of thyroid hormones (Clinical Overt primary hypothyroidism) or within the reference range (Subclinical hypothyroidism). As the most common autoimmune disorder in adults, hypothyroidism is marked by mucopolysaccharide accumulation within tissues and the skin, with symptoms including fatigue, constipation, and cold intolerance. Thyroid function generally decreases with age; the prevalence of hypothyroidism is about 5.1% in women between 45 and 64 years, increasing to 12.7% in those over 65 (5).
1.3 Relevance studies
Thyroid hormones significantly influence cardiovascular health, with both clinical and subclinical hypothyroidism heightening CVD risk (6). These hormones affect cardiovascular function by modifying cardiac ion channels (7), altering macrophage inflammatory responses (8), and impacting mitochondrial function (9). Profound hypothyroidism can decrease stroke volume, heart rate, cardiac output, and myocardial contractility. Moreover, hypothyroidism impairs cardiovascular health by affecting left ventricular function and vascular compliance (10). Diminished thyroid hormone levels can lead to elevated homocysteine levels (an independent risk factor for ASCVD), dyslipidemia, especially elevated LDL-C (a major risk factor for atherosclerosis), systolic hypertension (a major cause of stroke), and hypercoagulable state of the blood, which can lead to pathological changes such as vascular endothelial damage and lipid deposition (11). Despite optimal management of known risk factors, residual CVD risk persists (12).
1.4 Mendelian randomization
Randomized controlled trials (RCTs) are the standard for establishing causality, and epidemiological studies seek to determine if risk factors can modify disease severity. However, traditional observational studies often fail to exclude confounding factors. Proposed by Katan in 1986, Mendelian randomization (MR) uses single-nucleotide polymorphisms (SNPs) as instrumental variables to ascertain causality. According to Mendel's laws of inheritance, capitalizing on the natural random assortment of alleles, a process similar to the randomized grouping process in RCTs, known as RCTs “in the state of nature”. This genetic approach minimizes confounding and reverse causation (13), and with the advent of large GWAS datasets, MR has flourished as a method to examine causal links in observational data.
Thus, this study employs MR to explore the causal relationship between hypothyroidism and ASCVD. Our findings provide a robust bioinformatics foundation for understanding the pathophysiology of combined hypothyroidism and ASCVD, and offer new perspectives for clinical prevention and treatment.
2 Data and methods
2.1 Sources of information
The source data for the exposure factor “hypothyroidism” were derived from a GWAS (ID: ukb-b-19732) by Ben Elsworth and colleagues in 2018. This study utilized the UK Biobank (UKB) cohort, comprising 22,687 patients and 440,246 controls, yielding 9,851,867 SNPs associated with hypothyroidism. GWAS data for the outcome factor “ASCVD” were obtained from the IEU OpenGWAS project (https://gwas.mrcieu.ac.uk/). The GWAS for CAD analyzed 29,339 cases and 322,724 controls, identifying 11,027,870 SNPs. The GWAS for AP involved 30,025 cases and 440,906 controls, yielding 24,170,313 SNPs. The MI GWAS comprised 11,081 cases and 473,517 controls, identifying 9,587,836 SNPs. The IS GWAS analyzed 11,929 cases and 472,192 controls, identifying 24,174,314 SNPs. The IS-LAA GWAS included 4,373 cases and 406,111 controls, yielding 7,992,739 SNPs. The IS-SV GWAS included 5,386 cases and 192,662 controls, identifying 6,150,261 SNPs. The PAD GWAS included 7,114 cases and 475,964 controls, identifying 24,186,090 SNPs. The selection criteria for each GWAS were based on the largest sample size and the most recent studies (Table 1). Ethical approvals and informed consent were secured for the original study, eliminating the need for additional ethical clearances.
Table 1
| GWAS ID | Trait | N case | N control | Sample size | N snps | Population | Author | pubmed ID |
|---|---|---|---|---|---|---|---|---|
| ebi-a-GCST90013864 | CAD | 29,339 | 322,724 | 352063 | 11027870 | European | Mbatchou J | 34017140 |
| ebi-a-GCST90018793 | AP | 30,025 | 440,906 | 470931 | 24170313 | European | Ben Elsworth | 34594039 |
| ebi-a-GCST90038610 | MI | 11,081 | 473,517 | 484598 | 9587836 | British | Handan Melike Dönertaş | 33959723 |
| ebi-a-GCST90018864 | IS | 11,929 | 472,192 | 484121 | 24174314 | European | Sakaue S | 34594039 |
| ebi-a-GCST005840 | IS-LAA | 4,373 | 406,111 | 150765 | 7992739 | European | Malik R | 29531354 |
| ebi-a-GCST005841 | IS-SV | 5,386 | 192,662 | 198048 | 6150261 | European | Malik R | 29531354 |
| ebi-a-GCST90018890 | PAD | 7,114 | 475,964 | 483078 | 24186090 | European | Sakaue S | 34594039 |
Details of the GWAS for outcome.
2.2 Research methodology
2.2.1 Selection of instrumental variables
To adhere to the MR criteria for instrumental variables, we: (I) selected SNPs significantly associated with hypothyroidism at P < 5 × 10⁻⁸ from the GWAS data, (II) identified independent SNPs using a linkage disequilibrium threshold of r2 < 0.001 and a 1,000 kb window (Clumping), (III) ensured SNP effect alleles were consistent in both exposure and outcome GWAS (Harmonization), excluding those with ambiguous effect alleles and palindromic SNPs with intermediate allele frequencies, (IV) removed any SNPs linked to confounders for ASCVD utilizing Phenoscanner V2 (http://www.phenoscanner.medschl.cam.ac.uk/) with thresholds set at P < 5 × 10⁻⁸ and r2 > 0.8, (V) excluded SNPs directly associated with ASCVD at P < 5 × 10⁻⁸, and (VI) computed the F-statistic for each instrumental variable, accepting those with F > 10 to avoid weak instrument bias (14), F = beta2/se2. The MR analysis process was conceptualized and illustrated as a directed acyclic graph (Figure 1).
Figure 1
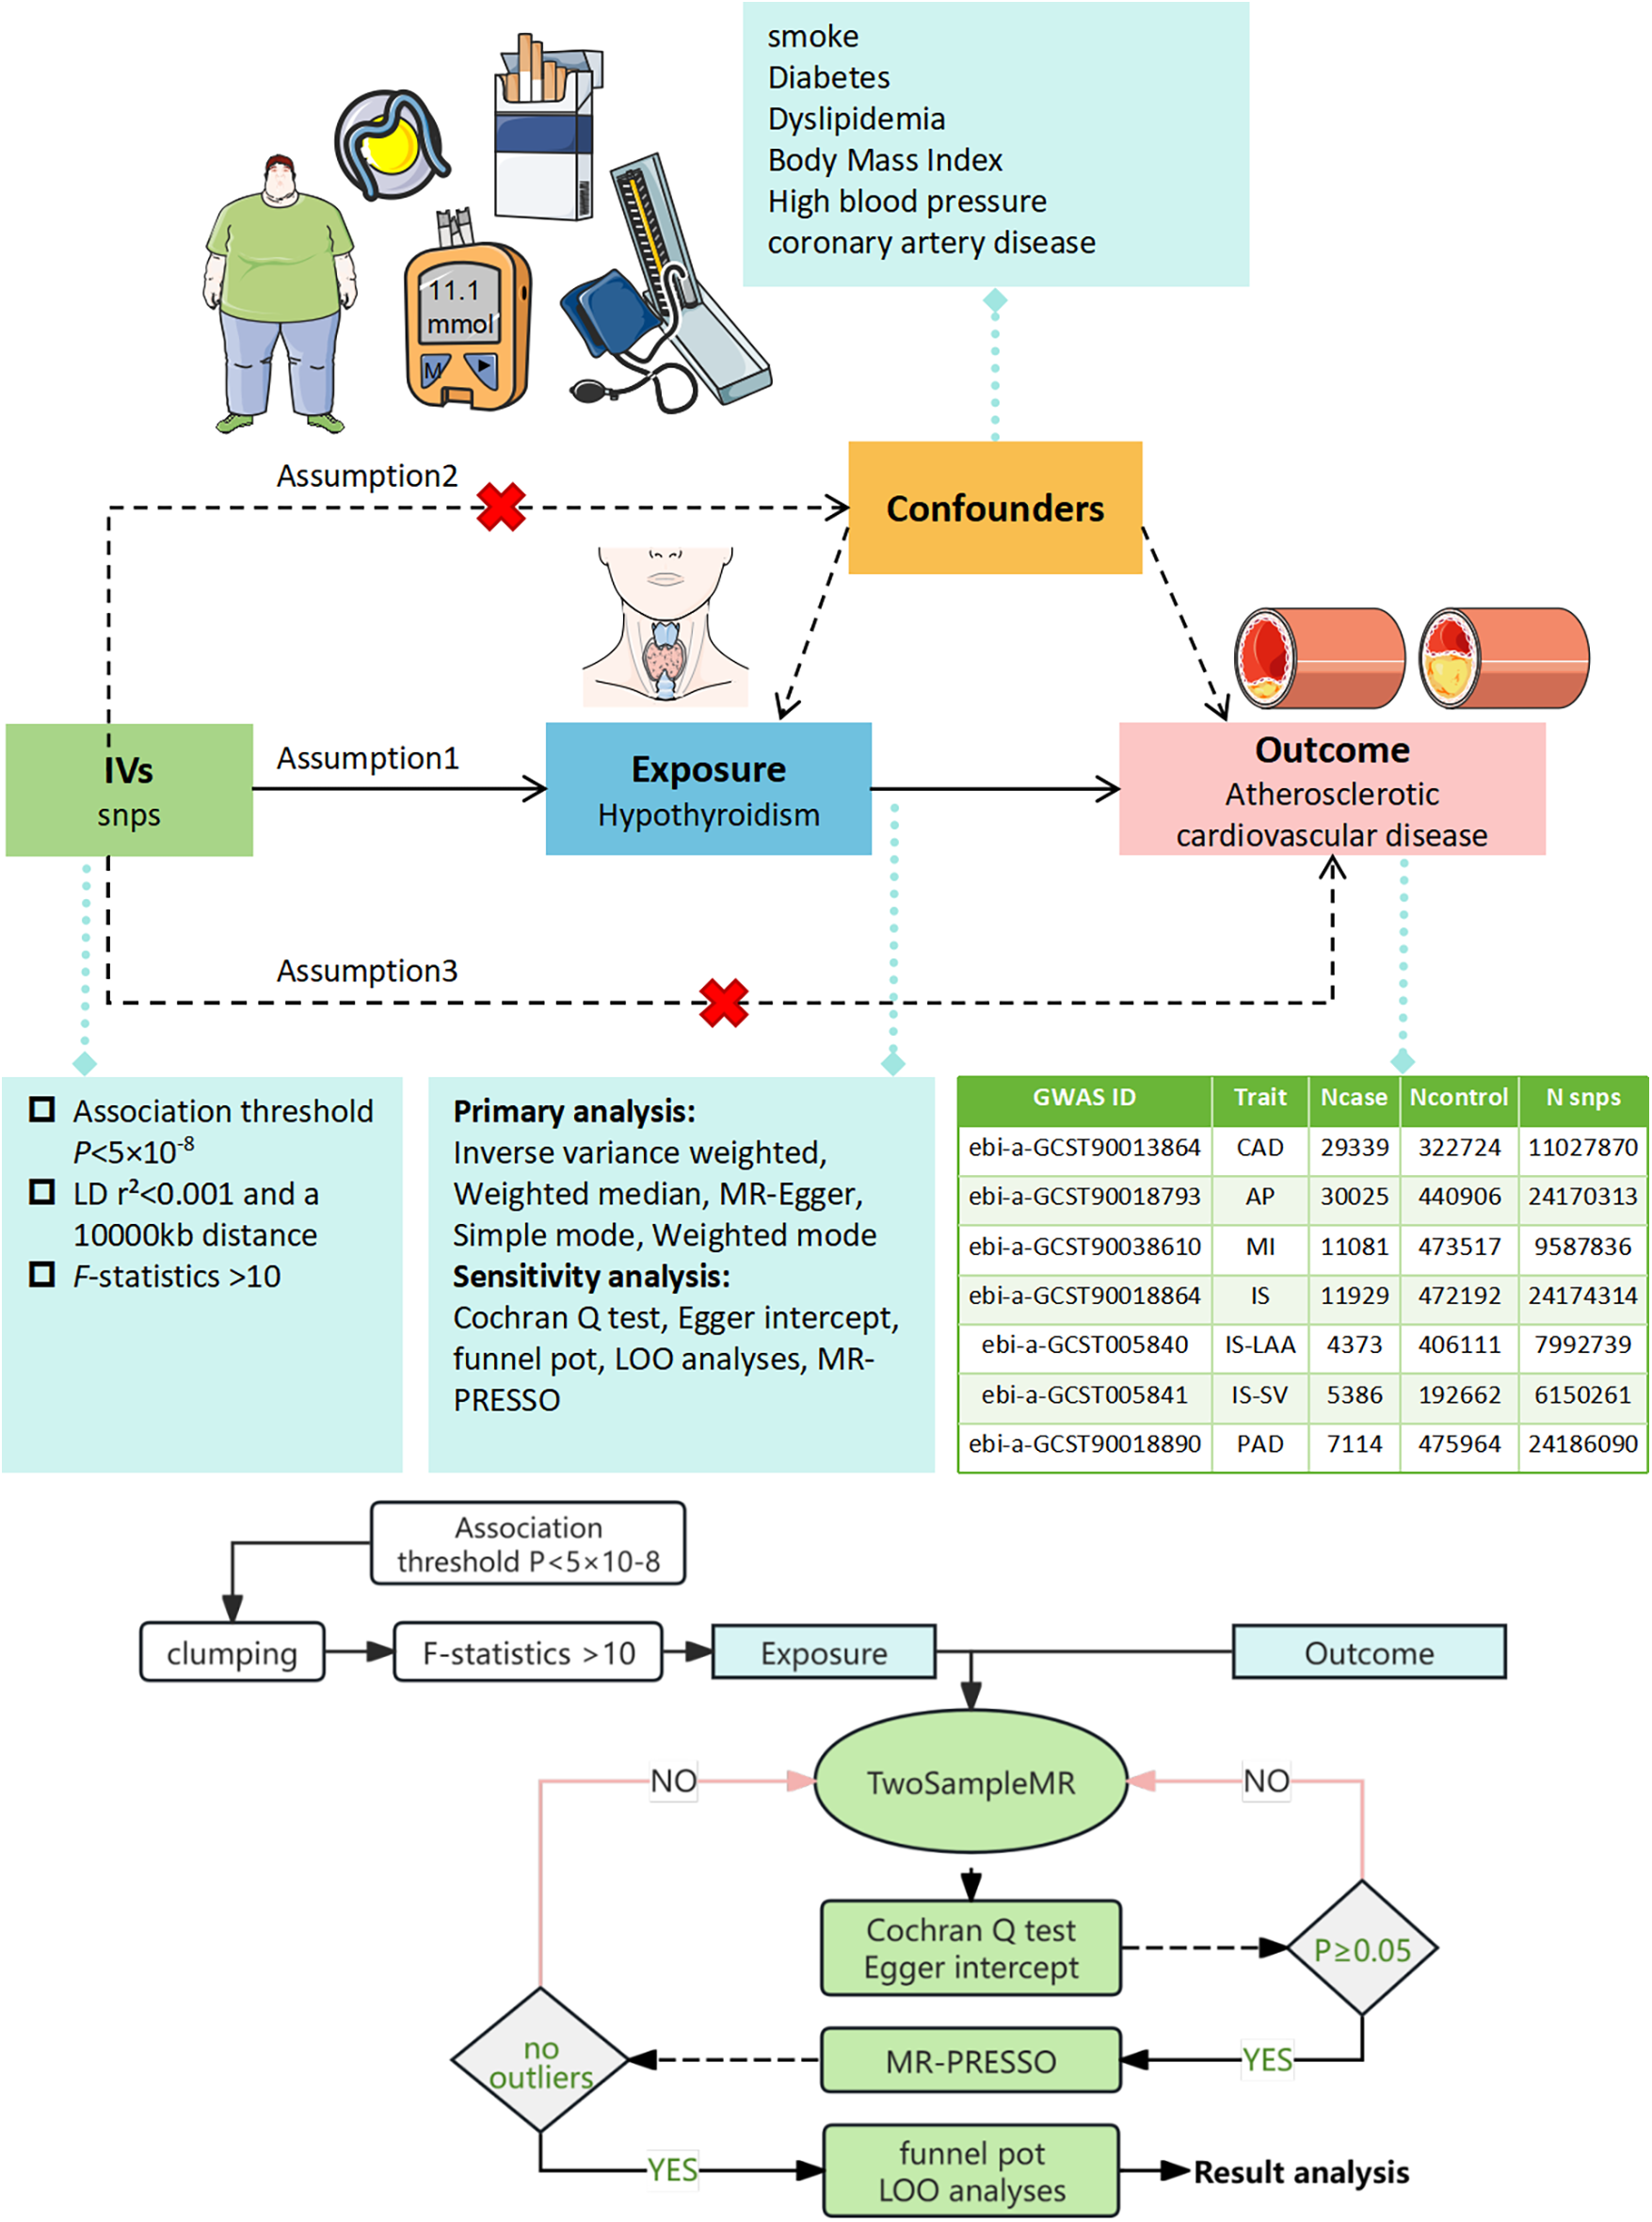
Illustration of the MR Framework for assessing the causal link between hypothyroidism and ASCVD. Assumption 1 posits that genetic variants are strongly associated with the exposure (hypothyroidism). Assumption 2 asserts that these genetic variants are not linked with any confounders. Assumption 3 states that the genetic variants influence the outcome exclusively through the exposure. SNPs, single nucleotide polymorphisms; LD, linkage disequilibrium; LOO, leave-one-out analysis; MR-PRESSO, MR Pleiotropy RESidual Sum and Outlier test.
2.2.2 Two-sample MR analysis
We conducted a two-sample MR analysis to investigate the causal link between hypothyroidism and ASCVD using the “TwoSampleMR” package in R. The analysis applied various methods including MR-Egger, Weighted Median (WM), Inverse Variance Weighted (IVW), Simple Mode, and Weighted Mode, with IVW being the primary method. The IVW method yields precise causal effect estimates when all SNPs are valid instrumental variables (15). The WM method is reliable when over half of the SNPs are valid (16), while MR-Egger is used when there is suspicion that no SNPs are valid (17).
2.2.3 Sensitivity analysis
We assessed heterogeneity using IVW and MR-Egger regression, quantifying it with Cochran's Q statistic and considering heterogeneity significant at P < 0.05, prompting the use of a random effects model (18). Horizontal pleiotropy was evaluated via the MR-Egger regression intercept; a significant non-zero intercept (P < 0.05) indicated its presence, rendering the MR results questionable at that point (16). MR-PRESSO was employed to detect and exclude outlier SNPs, after which the MR analysis was repeated to confirm result robustness (19). A LOO approach was implemented to determine the influence of individual SNPs on the exposure-outcome relationship.
2.2.4 Reverse MR analysis
We conducted a bidirectional MR analysis to explore potential reverse causation. With ASCVD as the exposure and hypothyroidism as the outcome, we re-evaluated the direction of the causal relationship using the same data sources. Subgroup forest plots were used to present the results of these analyses.
2.2.5 Enrichment analysis
To decipher the biological underpinnings of the implicated SNPs, we first identified proximal genes using the “vautils” package. When an SNP corresponded to multiple genes, the closest gene was selected. The list was then analyzed using the DAVID database (https://david.ncifcrf.gov/) for functional annotation, selecting “Homo sapiens” as the species and “official gene symbol” for gene names. Default parameters were applied to retrieve Biological Processes (BP), Molecular Functions (MF), Cellular Components (CC), and Kyoto Encyclopedia of Genes and Genomes (KEGG) pathway enrichment. Finally, the analysis results were visualized as GO function enrichment analysis matrix point plots (20) and KEGG enrichment analysis secondary classification summary plots (20) using an online graphing platform.
3 Result
3.1 Selection of instrumental variables
We identified 23,598 SNPs associated with hypothyroidism at a genome-wide significance level (P < 5 × 10⁻⁸) from a combined GWAS dataset. These associations were displayed in a Manhattan plot (Figure 2). Through linkage disequilibrium clumping, we extracted 122 independent SNPs associated with hypothyroidism, whose chromosomal distribution was visualized using an online mapping tool (20) (Figure 3). The top 20 SNPs with the lowest P-values are listed in Table 2. These SNPs were evaluated for association with seven ASCVDs, and no additional proxy SNPs were sought for any missing data during harmonization. SNPs correlating with confounders such as smoking, body mass index (21), hypertension, dyslipidemia, diabetes mellitus (22), CAD, and age were excluded (e.g., rs3184504, rs174599, rs7090530, rs3087243, rs28418426, rs2921053, rs772920, rs3850765, rs221781, rs2111485, rs731151). After outlier removal via the MR-PRESSO test, instrumental variables were confirmed. F-statistics for all instrumental variables exceeded 29, indicating no weak instrument bias (Table 3).
Figure 2
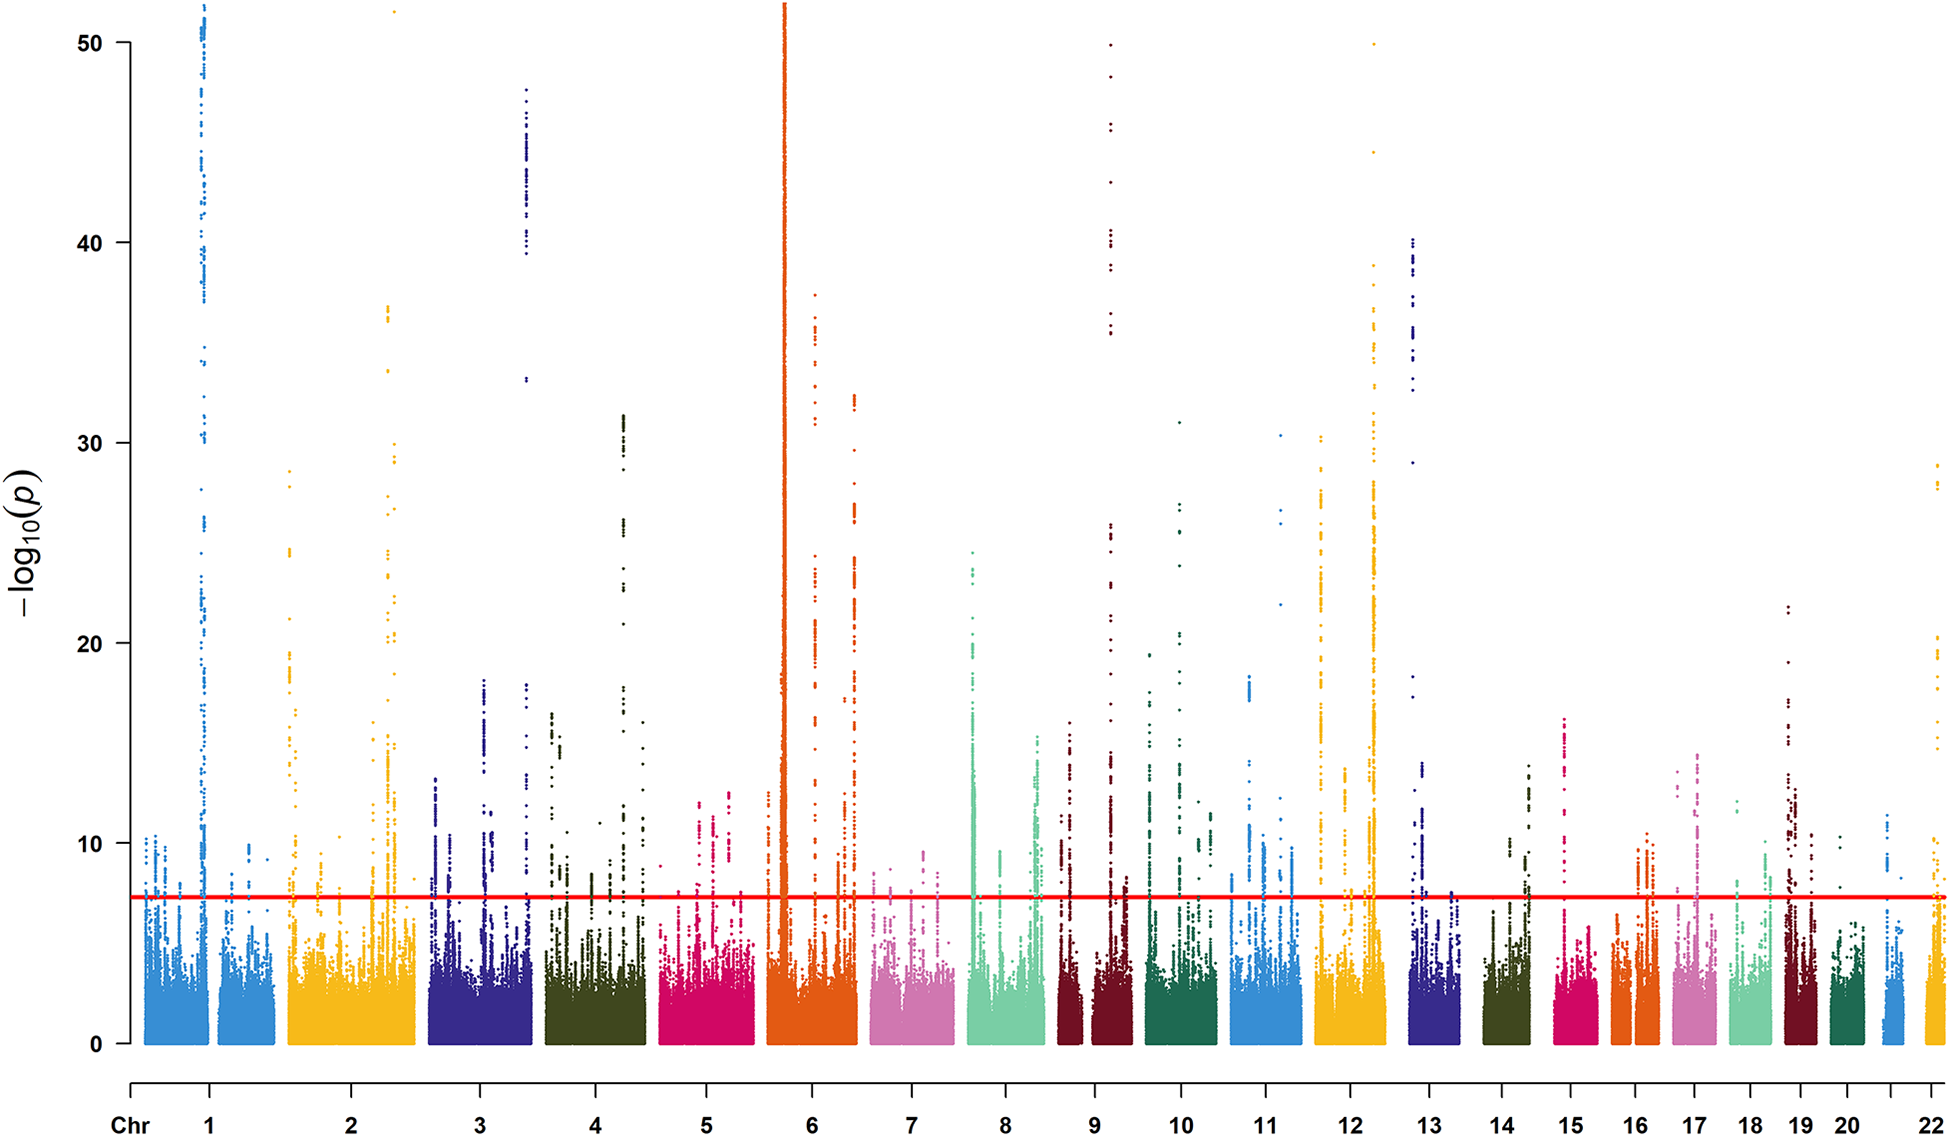
Manhattan plot for SNPs from the GWAS dataset “ukb-b-19732”. The x-axis denotes the chromosome numbers, while the y-axis represents the negative logarithm of each SNP's P-value, illustrating the strength of association with hypothyroidism—the lower the P-value, the higher the point on the plot. The red line indicates the significance threshold (P < 5 × 10⁻⁸).
Figure 3
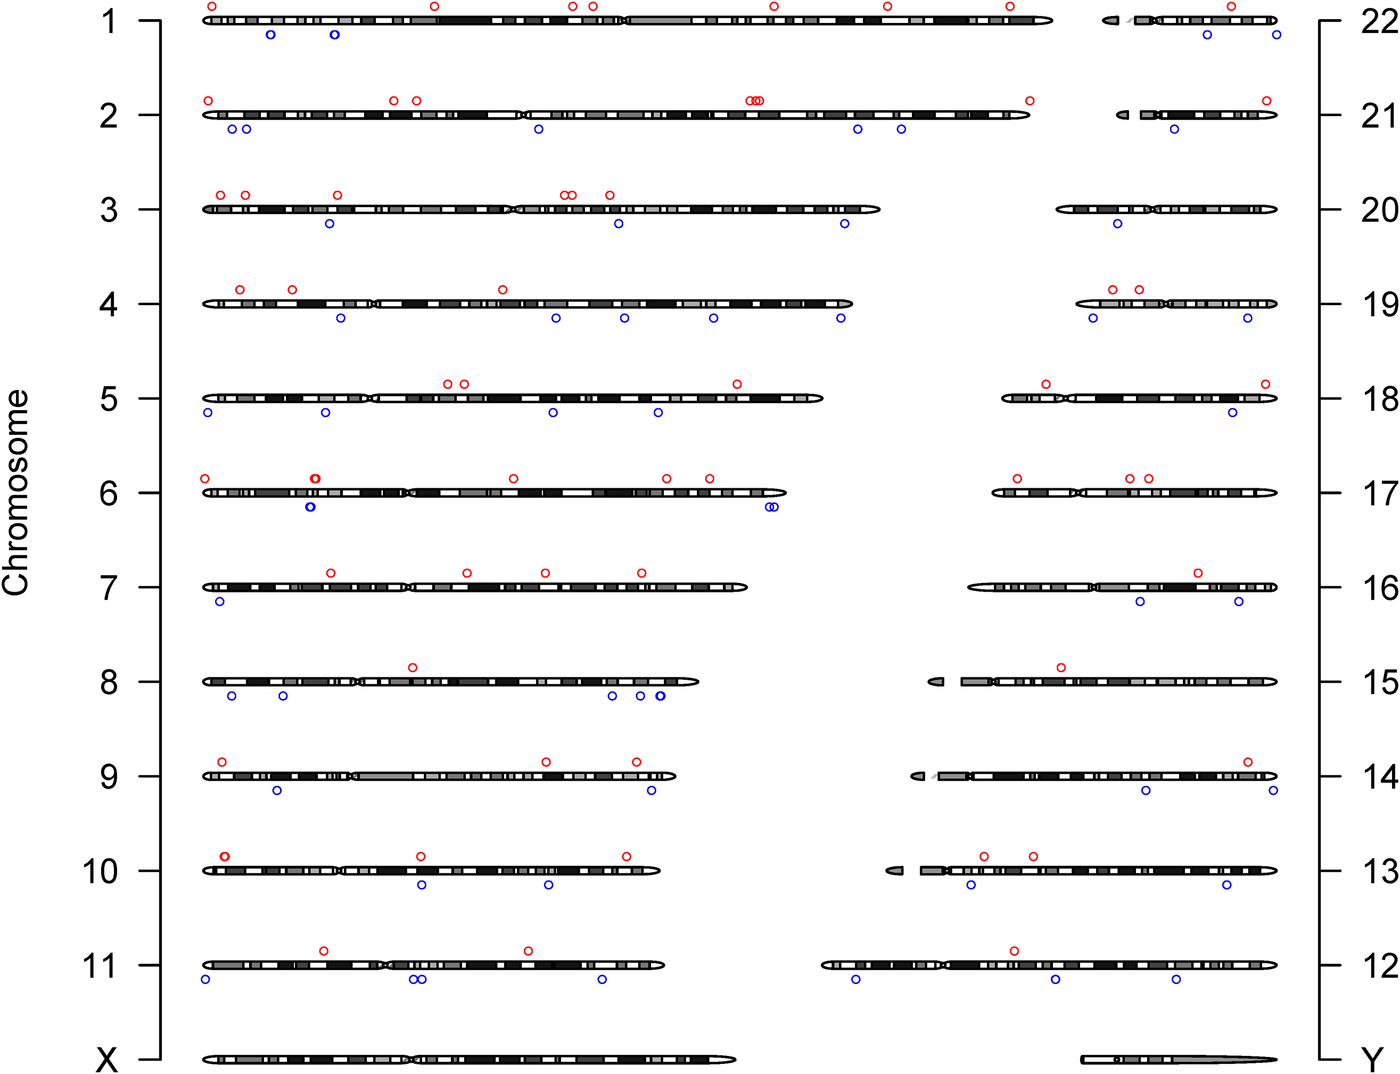
Chromosome distribution of 122 SNPs supporting the primary hypothesis. The y-axis labels the chromosomes. Circles (○) mark the chromosomal positions of SNPs: red○ for SNPs with a beta coefficient (effect value) greater than zero, blue○ for those with a beta less than zero, indicating their respective directional associations with hypothyroidism.
Table 2
| SNP | Chr | Pos | EA | OA | EAF | Beta | SE | P Value | F statistics |
|---|---|---|---|---|---|---|---|---|---|
| rs9272426 | 6 | 32605189 | G | A | 0.4522 | 0.0125 | 0.0005 | 2.60 × 10−168 | 764.6930 |
| rs6679677 | 1 | 114303808 | A | C | 0.1008 | 0.0202 | 0.0007 | 5.11 × 10−167 | 758.7276 |
| rs3184504 | 12 | 111884608 | C | T | 0.5173 | −0.0101 | 0.0004 | 3.00 × 10−116 | 525.3031 |
| rs7850258 | 9 | 100549013 | G | A | 0.6680 | 0.0099 | 0.0005 | 1.90 × 10−98 | 443.4618 |
| rs3087243 | 2 | 204738919 | A | G | 0.4507 | −0.0086 | 0.0004 | 1.70 × 10−82 | 370.1398 |
| rs28418426 | 6 | 32619654 | C | T | 0.5288 | 0.0091 | 0.0005 | 5.80 × 10−79 | 353.9570 |
| rs7768019 | 6 | 31202575 | G | C | 0.2439 | −0.0079 | 0.0005 | 1.20 × 10−53 | 237.7647 |
| rs12634152 | 3 | 188121019 | T | C | 0.5473 | −0.0065 | 0.0004 | 2.40 × 10−48 | 213.5122 |
| rs9511151 | 13 | 24786576 | A | G | 0.3458 | −0.0062 | 0.0005 | 1.10 × 10−40 | 178.4360 |
| rs7754251 | 6 | 90989125 | C | G | 0.5798 | 0.0058 | 0.0004 | 4.20 × 10−38 | 166.5608 |
| rs7582694 | 2 | 191970120 | G | C | 0.7739 | −0.0068 | 0.0005 | 1.60 × 10−37 | 163.9122 |
| rs9347170 | 6 | 167405187 | T | C | 0.3365 | −0.0056 | 0.0005 | 4.30 × 10⁻³³ | 143.6033 |
| rs4835536 | 4 | 149662857 | T | G | 0.2126 | −0.0064 | 0.0005 | 4.30 × 10⁻³² | 139.0354 |
| rs9277569 | 6 | 33058402 | T | C | 0.1095 | 0.0083 | 0.0007 | 7.60 × 10⁻³² | 137.9278 |
| rs71508903 | 10 | 63779871 | T | C | 0.1941 | 0.0066 | 0.0006 | 1.00 × 10⁻³¹ | 137.3601 |
| rs4409785 | 11 | 95311422 | C | T | 0.1726 | 0.0068 | 0.0006 | 4.30 × 10⁻³¹ | 134.4721 |
| rs11052877 | 12 | 9905690 | G | A | 0.3718 | −0.0053 | 0.0005 | 5.00 × 10⁻³¹ | 134.1791 |
| rs229540 | 22 | 37591290 | G | T | 0.4255 | 0.0051 | 0.0004 | 1.30 × 10⁻²⁹ | 127.7641 |
| rs11675342 | 2 | 1407628 | T | C | 0.4235 | 0.0050 | 0.0004 | 2.70 × 10⁻²⁹ | 126.2377 |
| rs2921053 | 8 | 8319963 | C | G | 0.4511 | −0.0046 | 0.0004 | 3.10 × 10⁻²⁵ | 107.6963 |
Basic information on the top 20 differentially significant SNPs strongly associated with hypothyroidism.
Table 3
| Outcome | Heterogeneity | Pleiotropy | Outlier test | ||||||
|---|---|---|---|---|---|---|---|---|---|
| MR Egger | IVW | MR egger intercept | MR Presso | ||||||
| Q-value | P-value | Q-value | P-value | Intercept | SE | P-value | Global test | P-value | |
| CAD | 108.706 | 0.099 | 110.201 | 0.095 | −0.003 | 0.003 | 0.266 | 125.054 | 0.130 |
| AP | 127.709 | 0.065 | 127.720 | 0.074 | −2.23 × 10⁻⁴ | 0.003 | 0.203 | 131.818 | 0.110 |
| MI | 114.361 | 0.250 | 116.635 | 0.226 | −1.13 × 10⁻⁴ | 7.85 × 10⁻⁵ | 0.151 | 120.418 | 0.243 |
| IS | 131.087 | 0.057 | 131.303 | 0.063 | −0.001 | 0.003 | 0.675 | 134.344 | 0.076 |
| IS(LAA) | 113.550 | 0.290 | 116.076 | 0.258 | 0.009 | 0.006 | 0.128 | 120.629 | 0.239 |
| IS(SV) | 96.453 | 0.328 | 97.880 | 0.318 | 0.007 | 0.006 | 0.249 | 101.931 | 0.331 |
| PAD | 126.210 | 0.078 | 128.616 | 0.067 | 0.006 | 0.004 | 0.160 | 131.441 | 0.080 |
Sensitivity analysis.
SNP: single nucleotide polymorphism, CHR: chromosome number, POS: base location, EA: effector allele, OA: non-effector allele, EAF: effector allele frequency, Beta: allele effect size, SE: standard error of β, F-value: weak instrumental variable F-value
3.2 MR analysis results
We visualized the MR analysis results for the relationship between hypothyroidism and ASCVD in subgroup forest plots (Figure 4). Using the IVW method, the forward MR analysis indicated that hypothyroidism is associated with an increased risk of CAD (OR = 2.34, 95%CI = 1.39–3.94, P = 0.001), AP (OR = 2.01, 95%CI = 1.28–3.16, P = 0.002), MI (OR = 1.02, 95%CI = 1.01–1.04, P = 0.004), and IS-SV (OR = 6.92, 95%CI = 2.45–19.55, P < 0.001). Conversely, no association was found between hypothyroidism and overall IS (OR = 1.09, 95%CI = 0.67–1.78, P = 0.730), IS-LAA (OR = 1.76, 95%CI = 0.58–5.36, P = 0.318), or peripheral artery disease (PAD) (OR = 1.47, 95%CI = 0.64–3.36, P = 0.358).
Figure 4
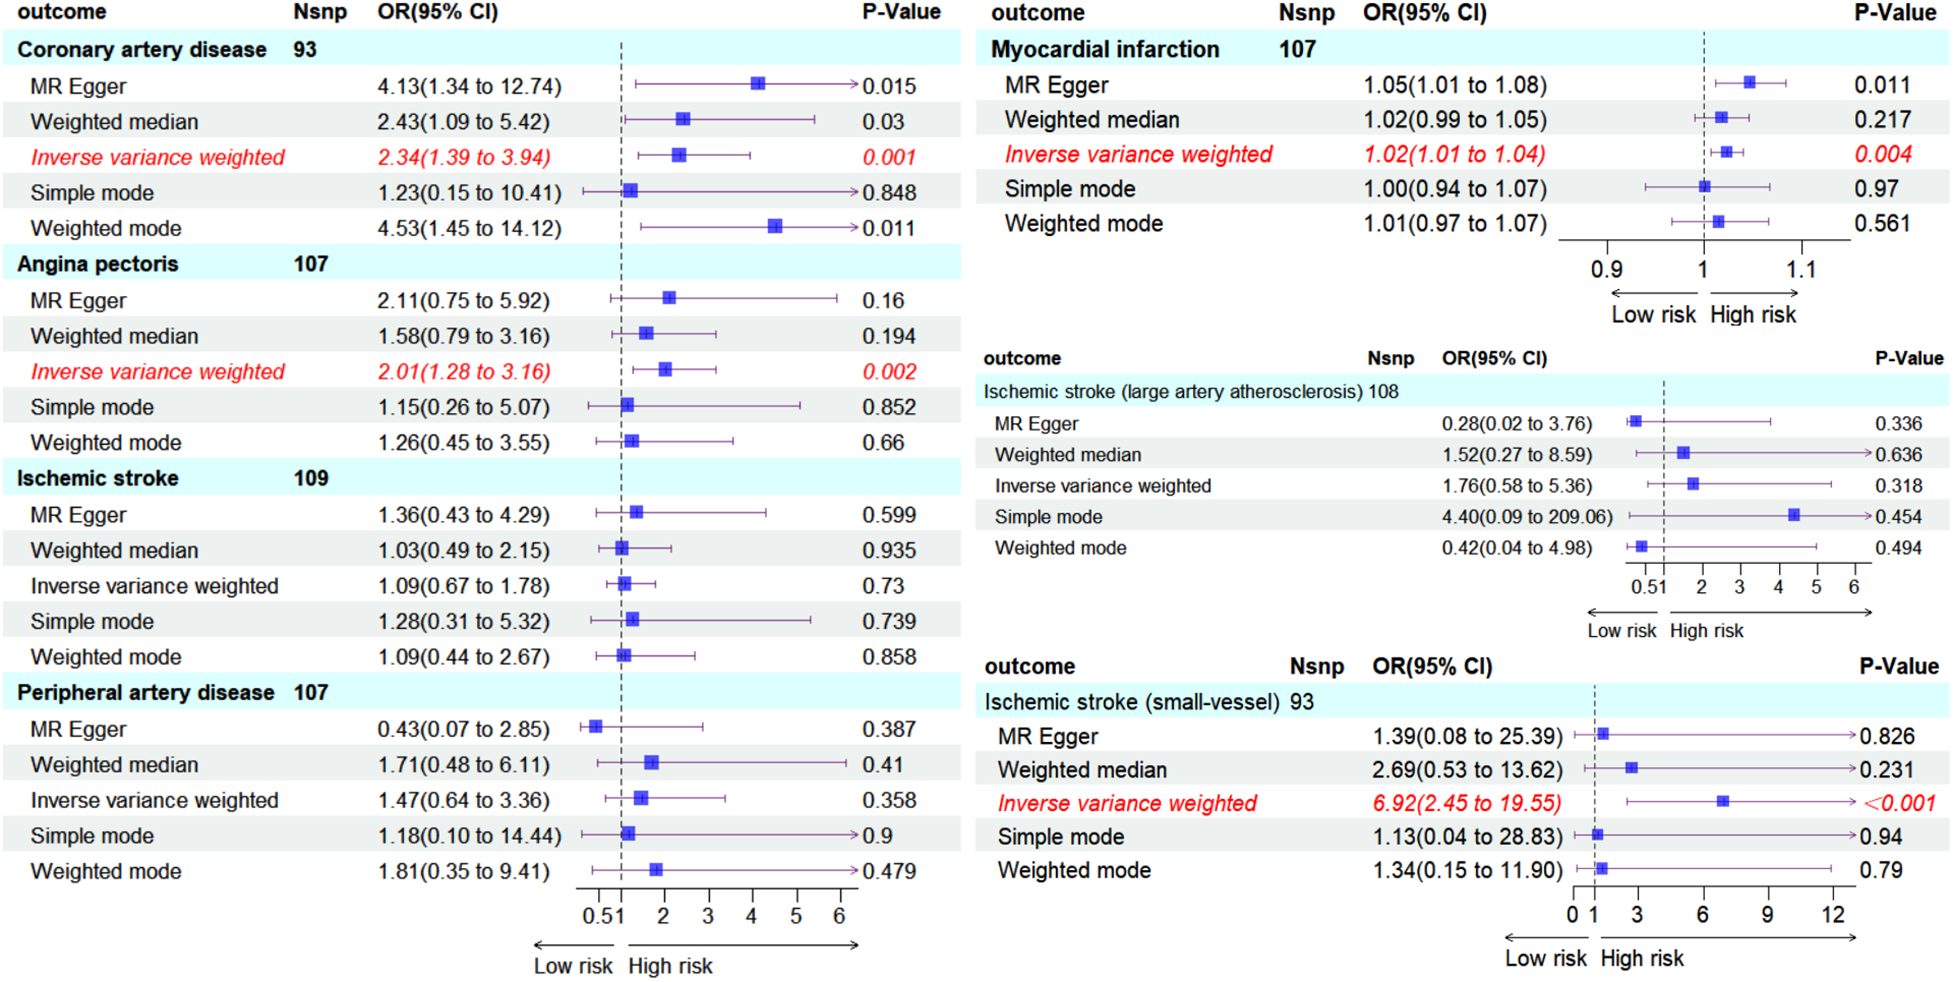
Subgroup forest plot depicting seven ASCVD outcomes and the count of SNPs used in their respective MR analyses, shaded in sky blue. Red italics highlight outcomes where the IVW method suggests a causal effect from hypothyroidism (P < 0.05). The IVW-based forward MR analysis indicates an increased risk of CAD, AP, MI, IS-SV due to hypothyroidism. No causal effect on IS, IS-LAA, PAD was observed.
3.3 Sensitivity analysis
Cochran's Q test to quantify heterogeneity using both MR Egger and IVW method. Horizontal Multiplicity of Test Levels Using MR-Egger Regression with Intercepts (Table 3), revealing no evidence of heterogeneity or pleiotropy (P > 0.05). We represented heterogeneity results for each MR analysis as funnel plots (Figure 5) and positive MR analysis results for CAD, AP, MI, and IS-SV as scatterplots (Figure 6). After repeating the MR-PRESSO global test, no outliers were detected. The “leave-one-out” sensitivity analysis confirmed that no single SNP disproportionately influenced the MR results, as visualized for CAD, AP, MI, and IS-SV (Figure 7). Collectively, these analyses support the robustness of our MR findings.
Figure 5
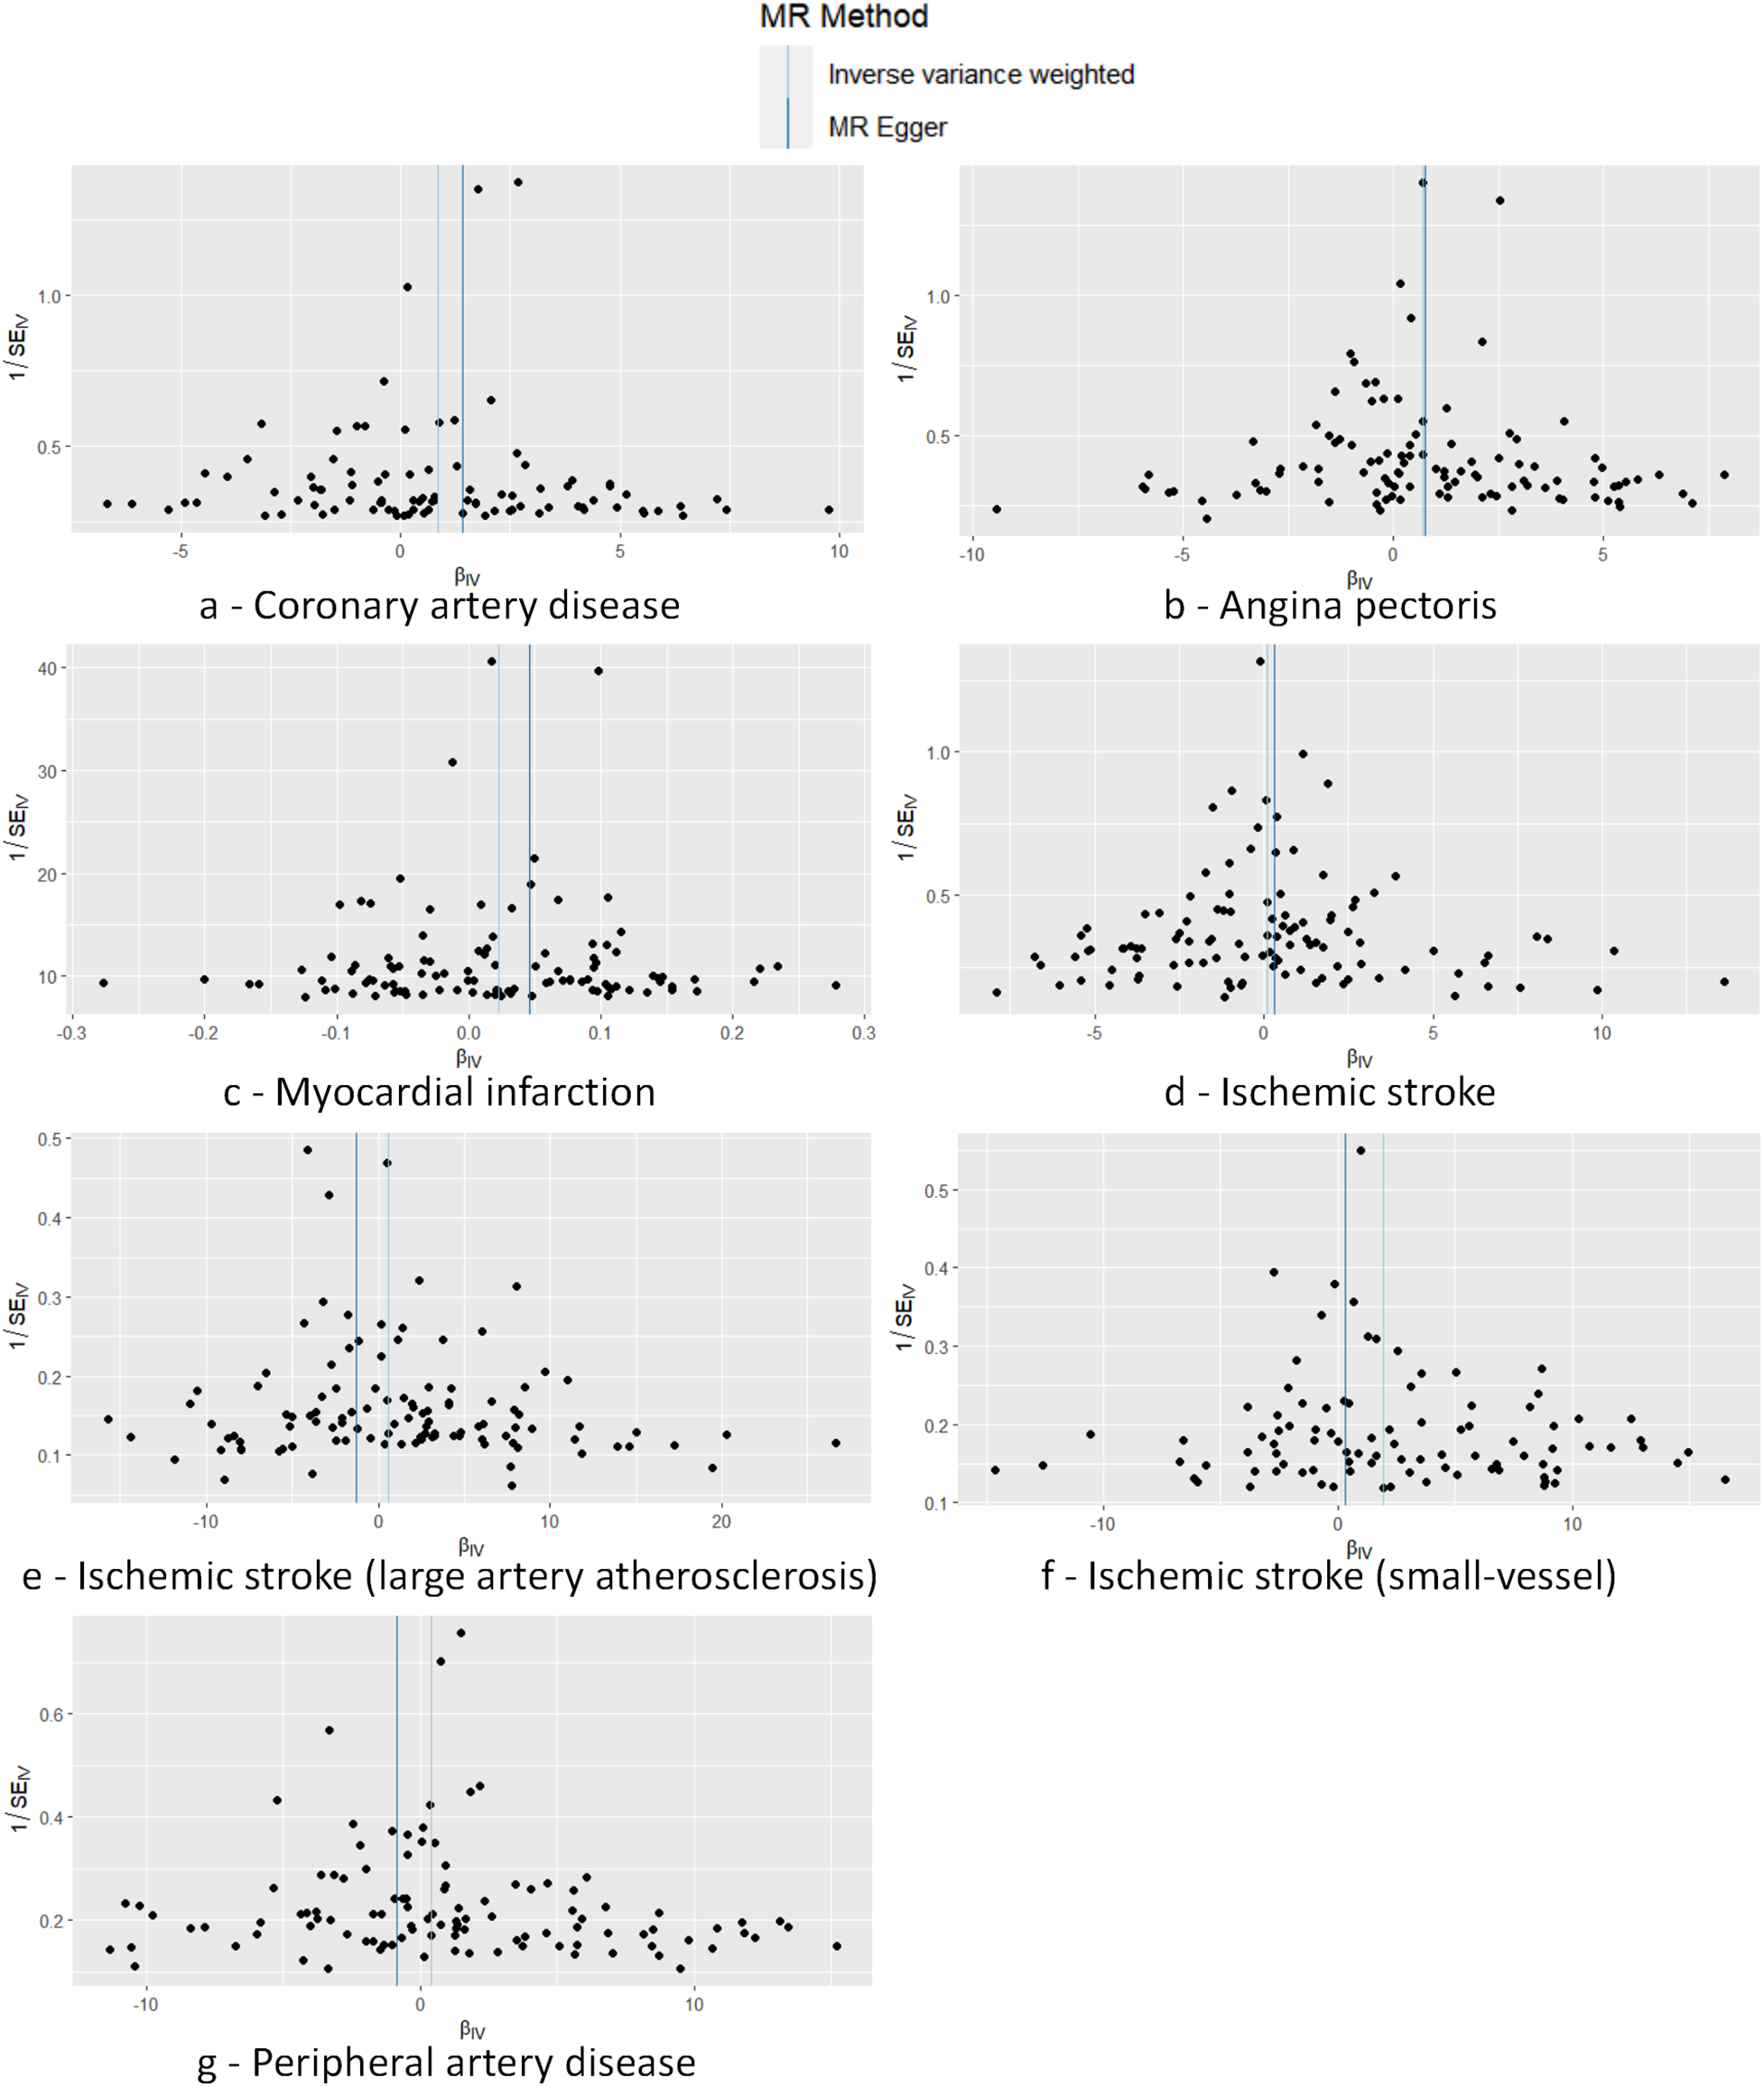
Funnel plot demonstrating symmetry across seven analyses, with no SNPs markedly deviating from the collective distribution. The exposure factors for part labels (a–g) are all hypothyroidism, with the outcome factors being: coronary artery disease (CAD), angina pectoris (AP), myocardial infarction (MI), ischemic stroke (IS), and subtypes including IS-large artery atherosclerosis (IS-LAA), IS-small vessels (IS-SV), and peripheral artery disease (PAD).
Figure 6
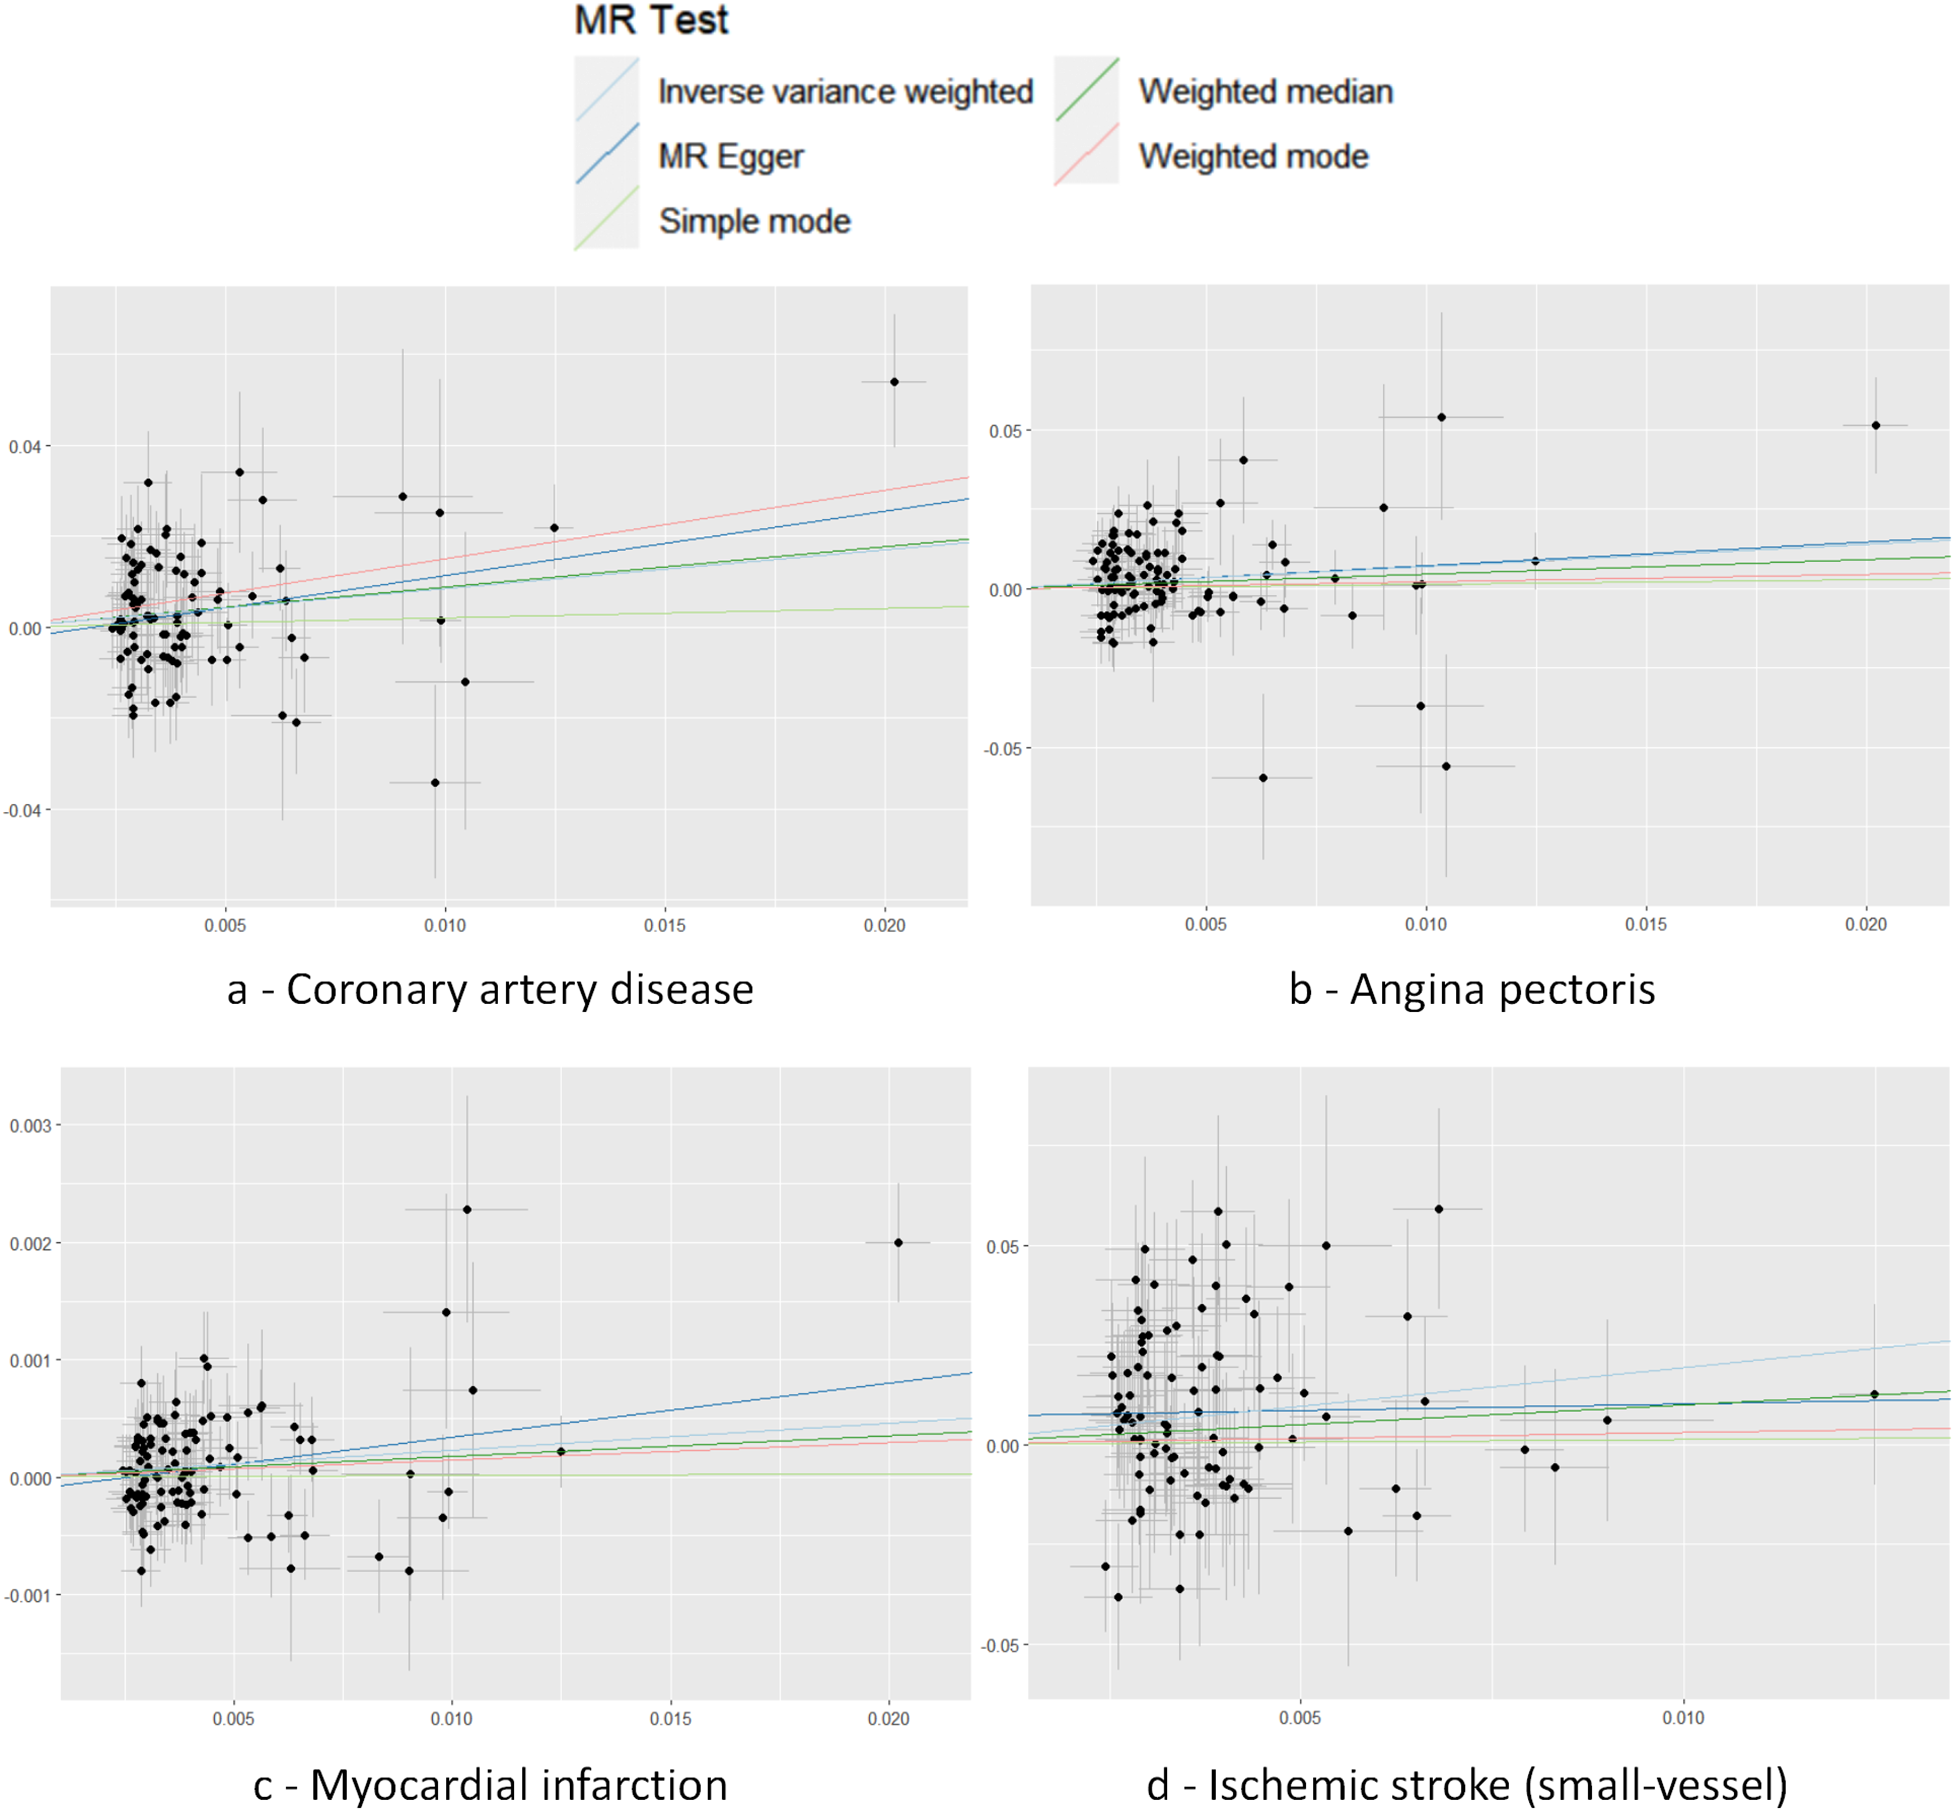
Scatter plot with each point representing an SNP. The accompanying line shows the 95% confidence interval. The x-axis measures the SNP's effect on the exposure, while the y-axis quantifies its effect on the outcome. Colored lines reflect the MR fitting results. The exposure factors for part labels (a–d) are all hypothyroidism, with the outcome factors being: coronary artery disease (CAD), angina pectoris (AP), myocardial infarction (MI), and IS-small vessels (IS-SV).
Figure 7
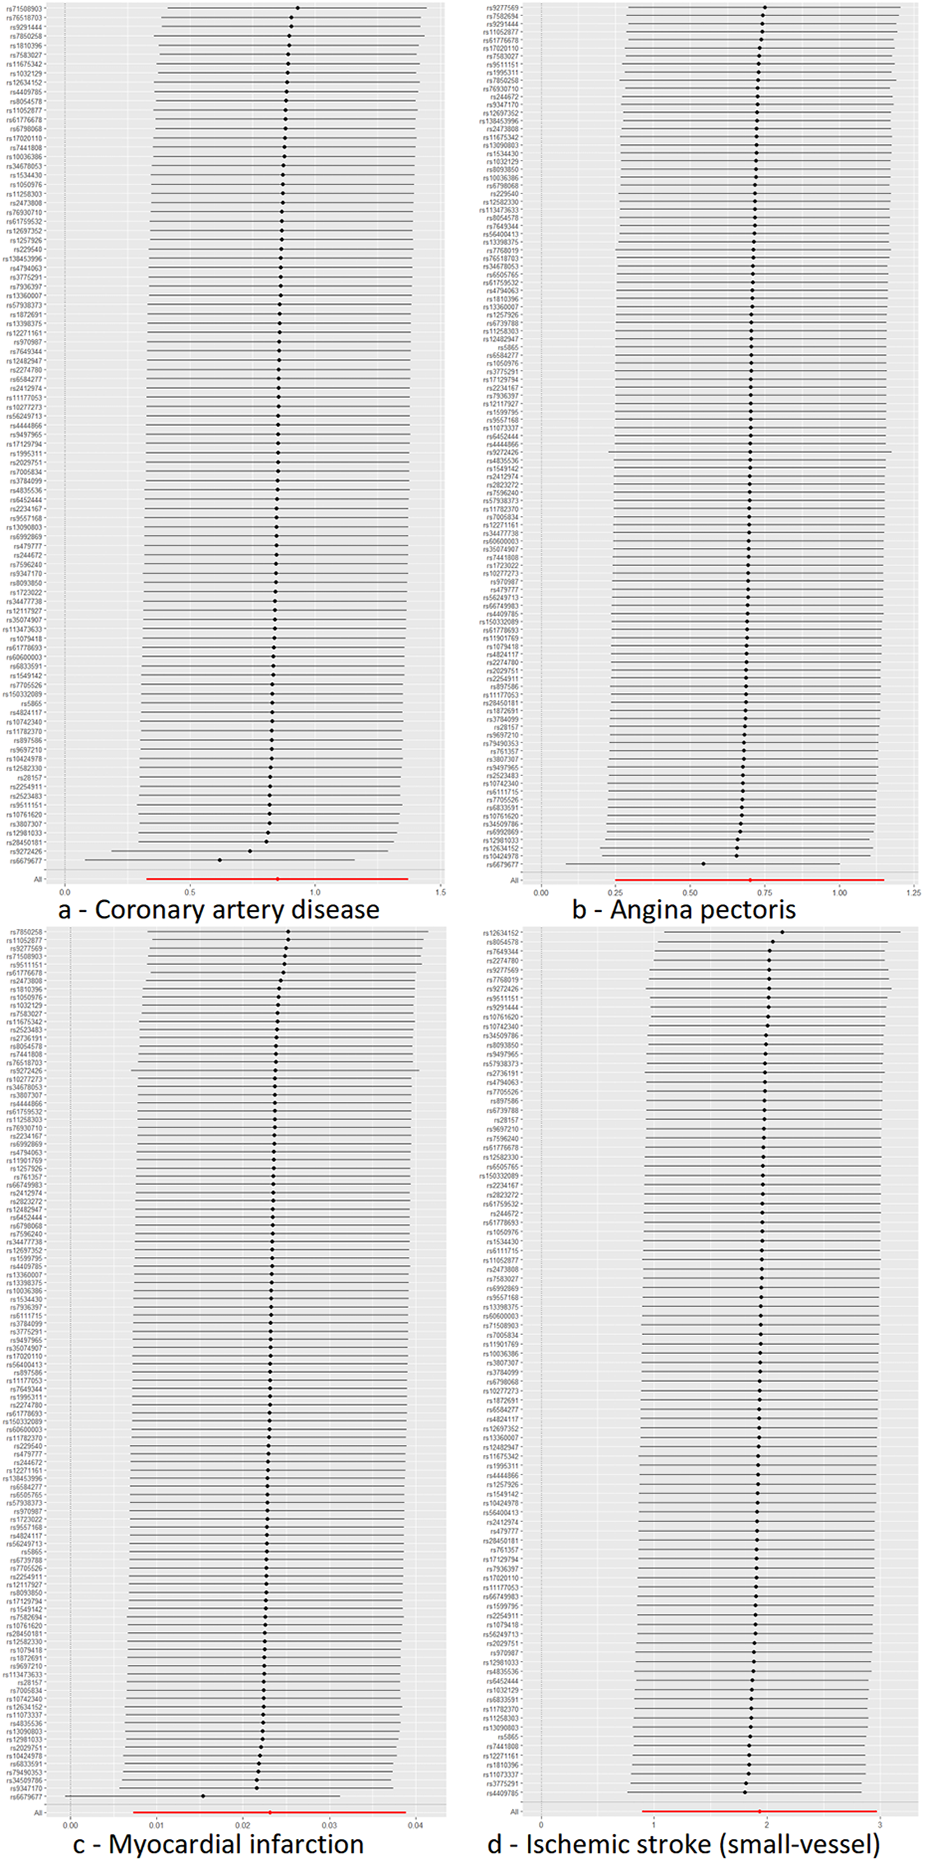
MR leave-one-out sensitivity analysis plot. The y-axis indicates the sequential exclusion of individual SNPs, the x-axis represents the IVW-derived effect estimates. Each horizontal line's points show the beta coefficients, with the lines demarcating their confidence intervals. The red line reflects the aggregate estimate, illustrating that no single SNP disproportionately influences the MR findings, as all betas are to the right of zero. The exposure factors for part labels (a–d) are all hypothyroidism, with the outcome factors being: coronary artery disease (CAD), angina pectoris (AP), myocardial infarction (MI), and IS-small vessels (IS-SV).
3.4 Reverse MR analysis
To explore potential reverse causality, bidirectional MR analyses were conducted. These analyses involved using CAD, AP, MI, and IS-SV as exposures and hypothyroidism as the outcome, without altering the data source. The findings did not indicate any significant effect of these cardiovascular conditions on the risk of developing hypothyroidism, as shown in subgroup forest plots: CAD (OR = 1.002, 95%CI = 1.000–1.004, P = 0.091), AP (OR = 1.001, 95%CI = 0.999–1.004, P = 0.269), MI (OR = 0.998, 95%CI = 0.908–1.097, P = 0.962), IS-SV (OR = 1.002, 95%CI = 0.999–1.004, P = 0.215) (Figure 8).
Figure 8
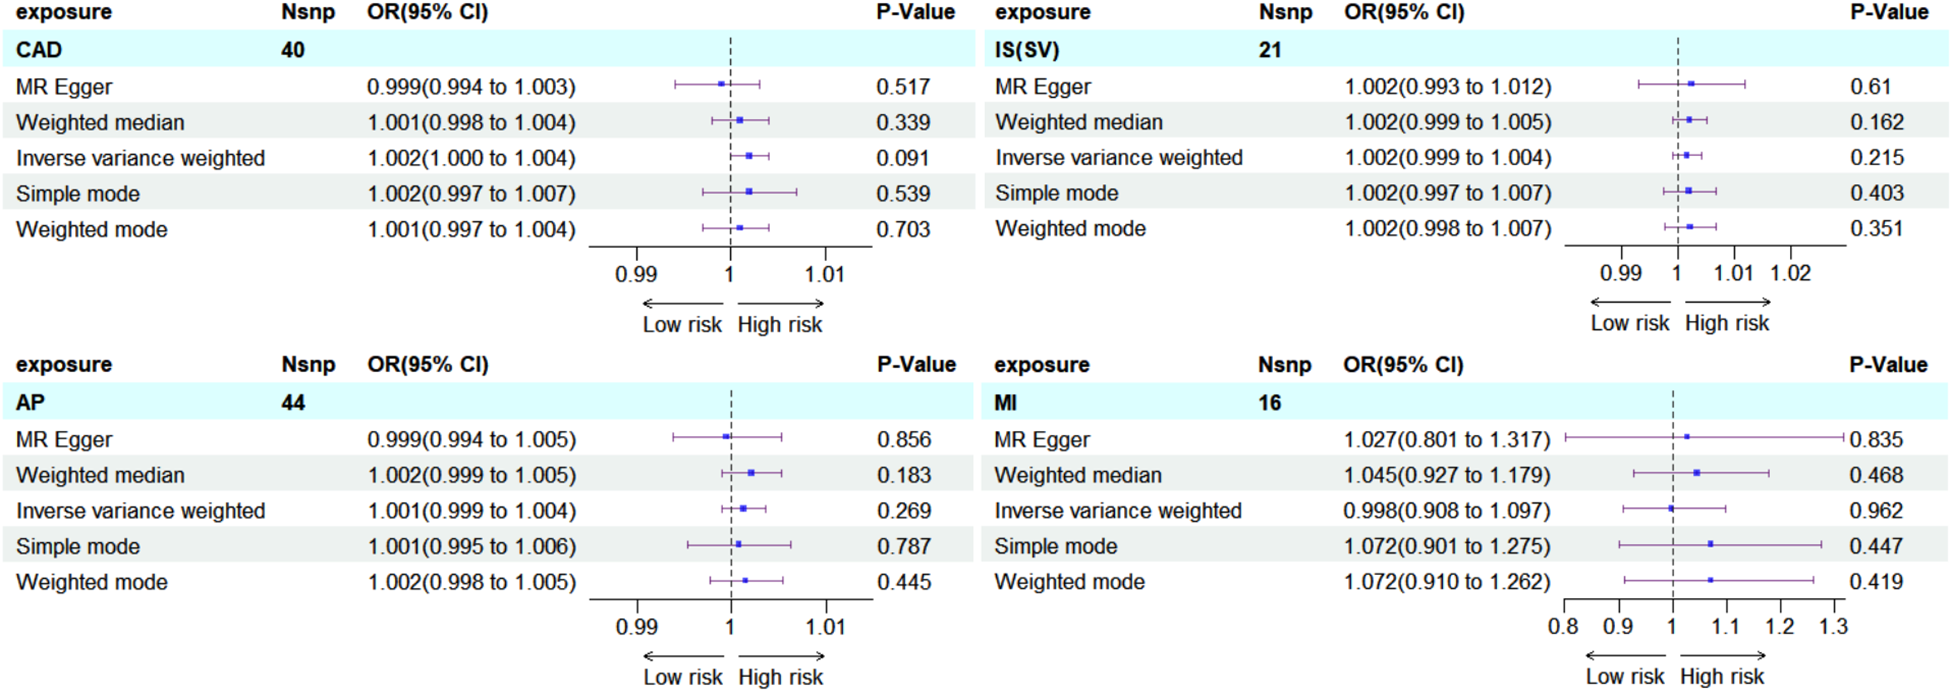
Subgroup forest plot for four exposure factors in reverse MR analysis, with rows shaded sky blue. The findings were consistently negative, reinforcing the unidirectional causal association between hypothyroidism and ASCVD.
3.5 Enrichment analysis
Using the outcome of CAD (where MR analysis showed positive association), we located 205 neighboring genes around the SNPs through the “vautils” R package (setting: flanking = 50 kb, build=“hg19”, collapse = T). In instances of multiple neighboring genes per SNP, the closest one was selected. This resulted in a list of 83 neighboring genes, with an instance of overlap (rs2523483 and rs76518703 both corresponding to gene MIR6891) observed (Table 4). This gene list was analyzed using the DAVID database, selecting “Homo Sapiens” as the species and “official gene symbol” for gene identification. The analyses for GO enrichment in BP, MF, and CC, along with KEGG pathway enrichment, were conducted with default parameter settings. The enrichment analysis revealed that the cAMP catabolic process had the lowest P-value (P = 3.10 × 10⁻⁴), while protein binding had the largest number of enriched genes (count = 47). The GO functional enrichment analysis matrix dot plots (Figure 9) and the KEGG pathway enrichment secondary classification summary plot (Figure 10) displayed the significant findings (P < 0.05), highlighting “Th1 and Th2 cell differentiation” as the pathway with the lowest enrichment P-value (P = 2.20 × 10⁻⁶) and along with “Th17 cell differentiation” and “Herpes simplex virus 1 infection”, having the greatest gene enrichment count (count = 7).
Table 4
| SNP | Chr | POS | GENE | SNP | Chr | POS | GENE |
|---|---|---|---|---|---|---|---|
| rs1995311 | 1 | 19820119 | CAPZB | rs10277273 | 7 | 4785129 | MIR4656 |
| rs12117927 | 1 | 236629134 | EDARADD | rs3807307 | 7 | 128579202 | TNPO3 |
| rs17129794 | 1 | 67794918 | IL12RB2 | rs897586 | 8 | 128193294 | LINC01245 |
| rs2029751 | 1 | 200698286 | LOC101929224 | rs6992869 | 8 | 61395832 | RAB2A |
| rs61778693 | 1 | 38651781 | LOC339442 | rs11782370 | 8 | 23370018 | SLC25A37 |
| rs1723022 | 1 | 167405418 | POU2F1 | rs1810396 | 8 | 133918769 | TG |
| rs2473808 | 1 | 19638883 | PQLC2 | rs1032129 | 8 | 119951900 | TNFRSF11B |
| rs6679677 | 1 | 114303808 | RSBN1 | rs7005834 | 8 | 134214204 | WISP1 |
| rs61776678 | 1 | 38377021 | SF3A3 | rs970987 | 9 | 21585265 | MIR31HG |
| rs2234167 | 1 | 2494330 | TNFRSF14 | rs34477738 | 9 | 5447227 | PLGRKT |
| rs17020110 | 1 | 108354156 | VAV3 | rs2274780 | 9 | 127075021 | PSMB7 |
| rs13398375 | 2 | 8451701 | LINC00299 | rs9697210 | 9 | 131468740 | ZER1 |
| rs1534430 | 2 | 12644736 | LOC100506457 | rs11258303 | 10 | 6405534 | LOC399715 |
| rs7596240 | 2 | 242444173 | STK25 | rs71508903 | 10 | 63779871 | MIR548AV |
| rs11675342 | 2 | 1407628 | TPO | rs6584277 | 10 | 101278055 | NKX2-3 |
| rs5865 | 2 | 98373006 | ZAP70 | rs10761620 | 10 | 64057202 | RTKN2 |
| rs150332089 | 3 | 5011335 | BHLHE40 | rs7936397 | 11 | 577534 | SCT |
| rs2254911 | 3 | 121828837 | CD86 | rs12271161 | 11 | 116979911 | SIK3 |
| rs57938373 | 3 | 39336038 | CX3CR1 | rs10742340 | 11 | 35317712 | SLC1A2 |
| rs12634152 | 3 | 188121019 | LPP | rs479777 | 11 | 64107477 | TRMT112 |
| rs6798068 | 3 | 108162362 | MYH15 | rs11052877 | 12 | 9905690 | CLECL1 |
| rs7649344 | 3 | 37006396 | TRANK1 | rs11177053 | 12 | 68499237 | IFNG |
| rs4444866 | 4 | 40307533 | CHRNA9 | rs76930710 | 12 | 68434459 | IFNG-AS1 |
| rs9291444 | 4 | 10713674 | CLNK | rs12582330 | 12 | 103892941 | LOC101929084 |
| rs6833591 | 4 | 123546282 | IL21-AS1 | rs9511151 | 13 | 24786576 | SPATA13-AS1 |
| rs113473633 | 4 | 103449131 | NFKB1 | rs9557168 | 13 | 99807350 | UBAC2-AS1 |
| rs28450181 | 4 | 87819369 | SLC10A6 | rs34678053 | 14 | 106135271 | MIR8071-2 |
| rs3775291 | 4 | 187004074 | TLR3 | rs3784099 | 14 | 68749927 | RAD51B |
| rs28157 | 5 | 102595837 | C5orf30 | rs1872691 | 16 | 50350210 | MIR6771 |
| rs13360007 | 5 | 156577720 | MED7 | rs138453996 | 16 | 67349478 | SLC9A5 |
| rs10036386 | 5 | 76543603 | PDE8B | rs4794063 | 17 | 45804494 | TBX21 |
| rs6452444 | 5 | 71685736 | PTCD2 | rs61759532 | 17 | 7240391 | YBX2 |
| rs12697352 | 5 | 35837234 | SPEF2 | rs56249713 | 18 | 67533332 | DOK6 |
| rs244672 | 5 | 133419283 | TCF7 | rs8093850 | 18 | 77178302 | NFATC1 |
| rs7705526 | 5 | 1285974 | TERT | rs1549142 | 19 | 18383794 | PDE4C |
| rs9272426 | 6 | 32605189 | HLA-DRB1 | rs35074907 | 19 | 10600418 | S1PR5 |
| rs1050976 | 6 | 408079 | IRF4 | rs10424978 | 19 | 4837557 | TICAM1 |
| rs2523483 | 6 | 31353792 | MIR6891 | rs12981033 | 19 | 50197406 | TSKS |
| rs76518703 | 6 | 31329466 | MIR6891 | rs12482947 | 21 | 43852037 | UBASH3A |
| rs1079418 | 6 | 166047034 | PDE10A | rs2412974 | 22 | 30539821 | HORMAD2 |
| rs9347170 | 6 | 167405187 | RNASET2 | rs4824117 | 22 | 50895133 | SBF1 |
| rs60600003 | 7 | 37382465 | ELMO1 | rs229540 | 22 | 37591290 | SSTR3 |
Neighboring genes of SNPs.
Figure 9
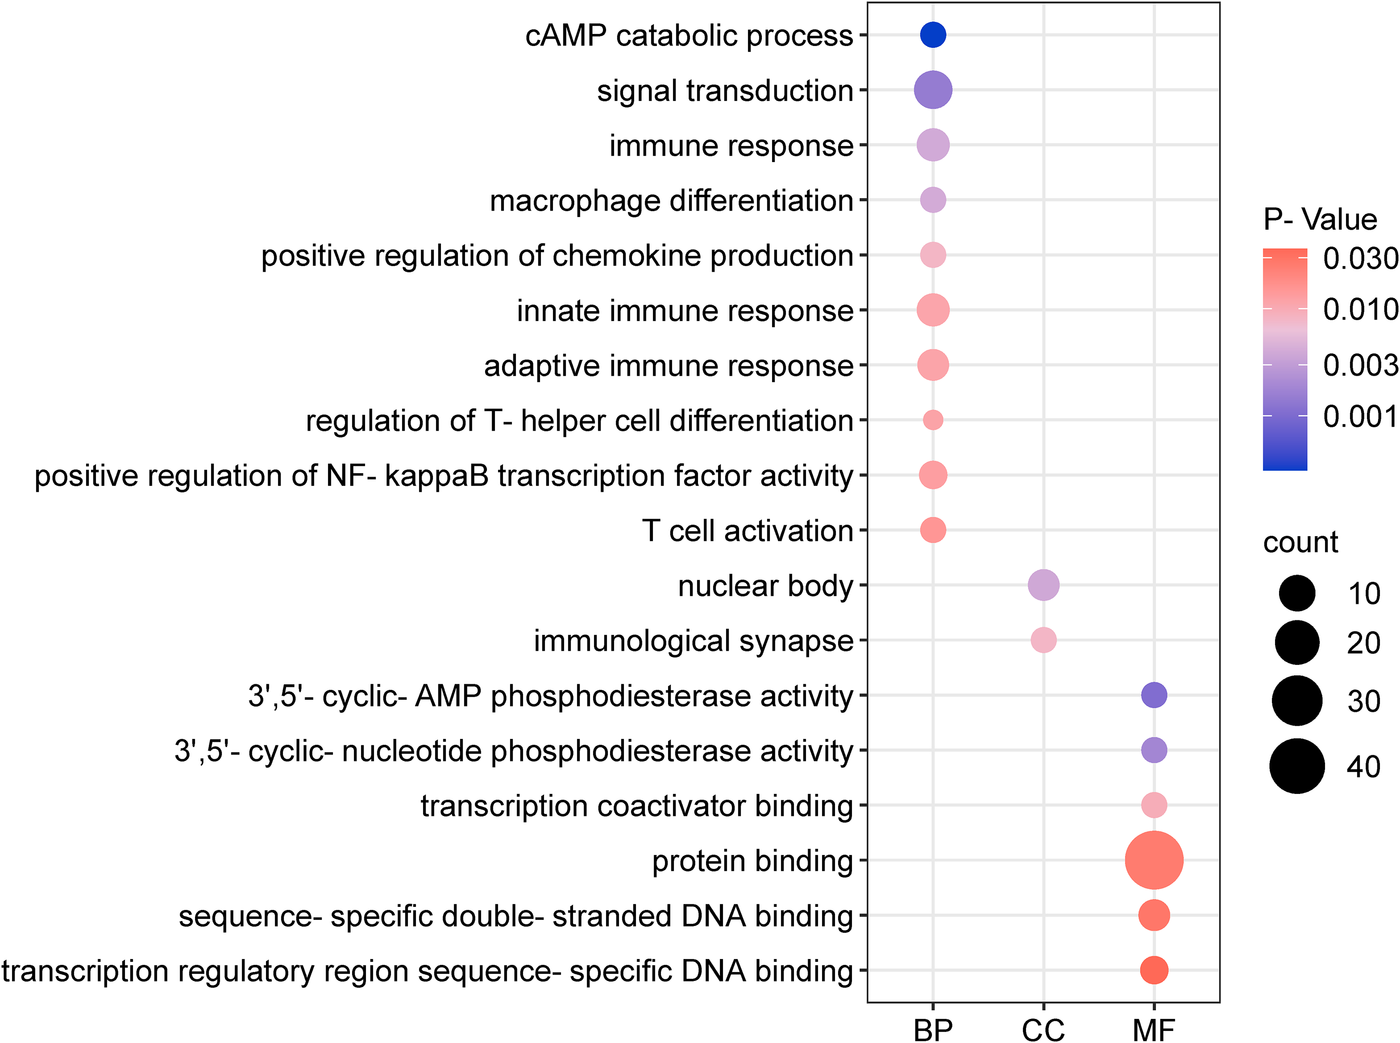
Go function enrichment analysis dot matrix plot. The x-axis categorizes BP, MF, and CC. Dot size depicts the count of enriched genes, and the color gradient represents the magnitude of enrichment P-values.
Figure 10
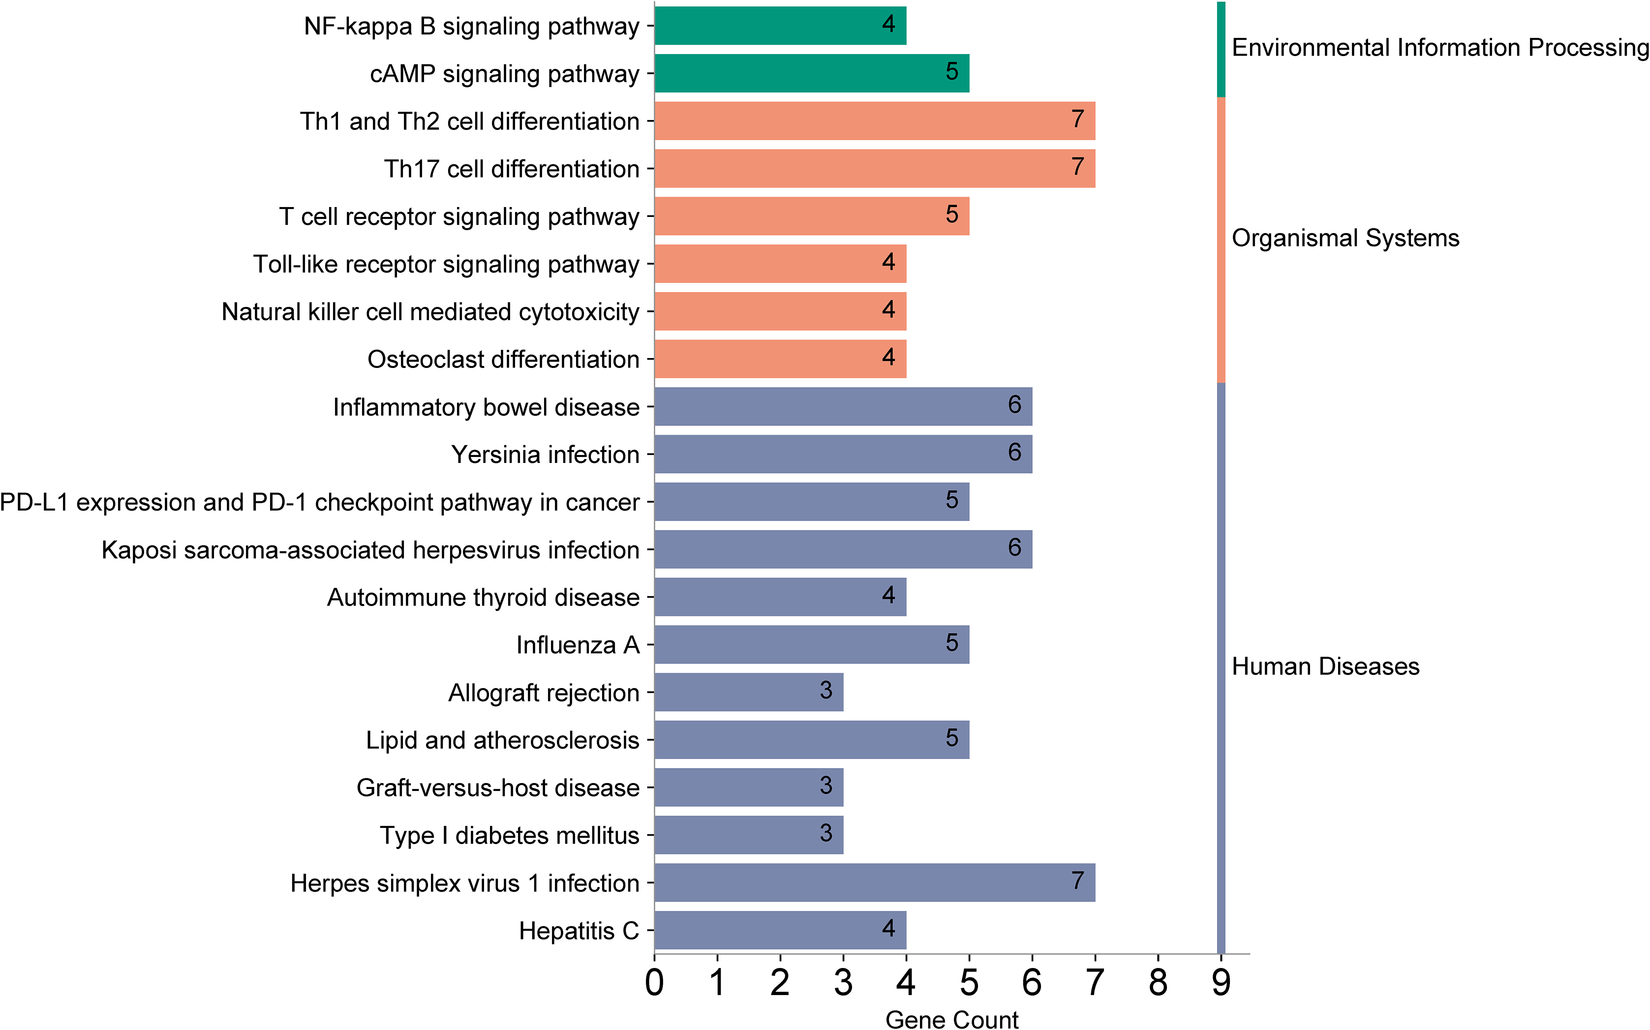
KEGG pathway enrichment analysis summary plot. The left y-axis lists the pathways enriched with genes, and the right y-axis categorizes them into secondary groups (environmental information processing, organismal systems, human diseases). The x-axis counts the number of genes enriched within each pathway.
4 Discussion
4.1 MR analysis
In this study, we employed Two-Sample MR using publicly available GWAS summary data to scrutinize the causal link between hypothyroidism and ASCVD. The findings suggest a genetic underpinning for the causal relationship between hypothyroidism and an increased risk of CAD, AP, MI, and IS-SV, offering novel insights for clinical prevention and therapeutic approaches. Moreover, for those with positive results in the forward Mendelian randomization analysis, a reverse analysis was conducted, which did not find a causal effect of ASCVD on hypothyroidism.
MR is an epidemiological tool that utilizes genetic variations as proxies to estimate the influence of modifiable exposures on disease outcomes, thereby inferring causality (23). We rigorously selected 122 SNPs associated with hypothyroidism and there was no weak instrumental variable bias. The selection criteria for each GWAS were based on the largest sample size and the most recent studies. The primary analysis relied on the IVW method, leveraging the inverse of variance for fitting without an intercept, which minimizes bias (24). In this MR study, the genetic variants used as instrumental variables were derived from multiple GWAS. Given the diversity in outcome definitions across these studies, we acknowledge that this may introduce a degree of heterogeneity. To address this, Cochrane's Q test was utilized to evaluate heterogeneity in the MR findings. Causal association reliability was assessed using the MR-Egger intercept, MR-PRESSO tests, and leave-one-out analysis, suggesting a consistent causal estimate. These analyses confirmed that our findings remain consistent despite potential heterogeneity in outcome definitions.
4.2 Enrichment analysis
GO enrichment analysis indicated the “cAMP catabolic process” had the most significant P-value. cAMP is a critical second messenger involved in cardiovascular regulation, influencing gene expression, cell morphology, and function. Its role is pivotal in modulating the contraction/relaxation of vascular smooth muscle cellsand vascular endothelial permeability (25). Moreover, KEGG enrichment analysis revealed that the “Th1 and Th2 cell differentiation” pathway had the most significant enrichment P-value and the largest number of associated genes. These T cell subsets are crucial for maintaining immunological homeostasis; their imbalance is implicated in autoimmunity and inflammation. Heightened Th1 levels are associated with inflammatory infiltration, vascular endothelial proliferation, platelet aggregation, and accelerated atherosclerosis (26). The “Th17 cell differentiation” pathway was also notable for its gene richness. Th17 cells, through IL-17A secretion, promote platelet adhesion and contribute to AP and CAD progression. Modulating the Th17/Treg ratio may offer a novel intervention to prevent or treat CAD in hypothyroid patients (26).
4.3 Correlation analysis
Clinical evidence positions hypothyroidism as a significant risk factor for ASCVD, correlating with increased all-cause cardiovascular mortality (27). An analysis by Rodondi N et al., encompassing 50,953 euthyroid participants and 3,348 with subclinical hypothyroidism (SCH) across seven countries, found that SCH notably elevates CAD mortality (28), especially with TSH levels ≥10.0 mIU/L. Hypothyroidism prevalence peaks in adults over 45, who concurrently face heightened ASCVD risk. Upon adjusting for confounders such as age, sex, BMI, hypertension, diabetes, and lipid levels, TSH was positively associated with coronary artery lesion severity and involved branches. Clinical studies underscore that cardiovascular risk persists even after optimal management of known risk factors (12), aligning with our findings.
Clinical treatment options remain contentious. BMJ (29) guidelines advise against T4 replacement therapy for subclinical hypothyroidism, barring specific conditions, due to the negligible impact on cardiovascular events. Conversely, a JAMA (10) review suggests T4 therapy for elevated TSH in subclinical hypothyroidism may decrease coronary heart disease mortality. Another study indicate T4 therapy might reduce adverse cardiovascular events post-percutaneous coronary intervention (30). As human genetics and gene and metabolomics, proteomics and transcriptomics data complement each other, the exploration of the causal relationship of the disease seen in this TSMR study will help to discover new biomarkers for predicting the occurrence of ASCVD or cardiovascular events, and to screen for possible therapeutic targets, which will be able to bring new ideas and directions for answering the controversial questions of clinical diagnosis and treatment.
4.4 Strengths and limitations of the study
This investigation first applies MR to delineate a causal association between hypothyroidism and ASCVD, confirming hypothyroidism as a risk factor for CAD, AP, MI, and IS-SV. It contributes significantly to clinical prevention and the management of these conditions. The MR approach mitigates confounding factors, a common issue in observational studies, and stringent criteria for data selection, instrumental variable selection, and sensitivity analyses enhance the study's validity.
However, limitations persist. In our study, we observed a strong causal association between the genetic variants and IS-SV, while the associations with other stroke subtypes were close to zero. This finding may be attributed to potential biological differences between IS-SV and other stroke types, as IS-SV is typically associated with microvascular pathology. It may also be due to chance, arising from the limitations of this type of research. To address this, we conducted sensitivity analyses, including leave-one-out analysis and MR-Egger regression, which confirmed the robustness of the IS-SV association. Future studies should replicate these findings in larger datasets to further validate this potential causal link. Additionally, the MR framework cannot account for socio-environmental factors. The primary reliance on European-derived GWAS data may reduce population stratification bias but limits the applicability of findings across diverse populations. Despite these constraints, the study contributes valuable insights to the field.
5 Conclusion
In our investigation, we employed two-sample MR methods to examine the causal relationship between hypothyroidism and seven types of ASCVD, utilizing aggregated data from GWAS. Our analysis confirms a heightened risk of CAD, AP, MI, and IS-SV associated with hypothyroidism. Given these findings, we advocate for the systematic cardiovascular screening of hypothyroidism patients for CAD, AP, MI, and IS-SV. A comprehensive treatment strategy is imperative to mitigate progression, enhance patients’ quality of life, and improve survival outcomes.
Statements
Data availability statement
The original contributions presented in the study are included in the article/Supplementary Material, further inquiries can be directed to the corresponding author.
Ethics statement
Ethical approval was not required for the study involving humans in accordance with the local legislation and institutional requirements. Written informed consent to participate in this study was not required from the participants or the participants’ legal guardians/next of kin in accordance with the national legislation and the institutional requirements.
Author contributions
JL: Data curation, Formal Analysis, Visualization, Writing – original draft, Writing – review & editing. YW: Conceptualization, Writing – review & editing. XL: Writing – review & editing, Formal Analysis. TM: Visualization, Writing – original draft. CL: Validation, Writing – original draft. JL: Methodology, Writing – review & editing. LD: Funding acquisition, Writing – review & editing.
Funding
The author(s) declare financial support was received for the research, authorship, and/or publication of this article. This work was supported by Harbin City Science and technology self-raised funding project (2023ZCZJNS108).
Acknowledgments
The authors sincerely thank YW and XL for their efforts in the literature search. The authors are truly thankful to TM, CL, and JL for their contributions to data processing, and especially to TM for the assistance in visual analysis. Special thanks to Professor LD for his review and guidance on the article, as well as for providing funding support.
Conflict of interest
The authors declare that the research was conducted in the absence of any commercial or financial relationships that could be construed as a potential conflict of interest.
Publisher’s note
All claims expressed in this article are solely those of the authors and do not necessarily represent those of their affiliated organizations, or those of the publisher, the editors and the reviewers. Any product that may be evaluated in this article, or claim that may be made by its manufacturer, is not guaranteed or endorsed by the publisher.
References
1.
Byrne RA Rossello X Coughlan JJ Barbato E Berry C Chieffo A et al 2023 ESC guidelines for the management of acute coronary syndromes. G Ital Cardiol (Rome). (2024) 25(2 Suppl 2):e1–112. 10.1714/4191.41785
2.
Blaha MJ DeFilippis AP . Multi-ethnic study of atherosclerosis (MESA). J Am Coll Cardiol. (2021) 77(25):3195–216. 10.1016/j.jacc.2021.05.006
3.
Feske SK . Ischemic stroke. Am J Med. (2021) 134(12):1457–64. 10.1016/j.amjmed.2021.07.027
4.
Montaño A Hanley DF Hemphill JC 3rd. , Hemorrhagic stroke. Handb Clin Neurol. (2021) 176:229–48. 10.1016/B978-0-444-64034-5.00019-5
5.
Prados-Torres A Poblador-Plou B Gimeno-Miguel A Calderón-Larrañaga A Poncel-Falcó A Gimeno-Feliú LA et al Cohort profile: the epidemiology of chronic diseases and multimorbidity. The EpiChron cohort study. Int J Epidemiol. (2018) 47(2):382–4f. 10.1093/ije/dyx259
6.
Jabbar A Pingitore A Pearce SH Zaman A Iervasi G Razvi S . Thyroid hormones and cardiovascular disease. Nat Rev Cardiol. (2017) 14(1):39–55. 10.1038/nrcardio.2016.174
7.
De Vito P Incerpi S Pedersen JZ Luly P Davis FB Davis PJ . Thyroid hormones as modulators of immune activities at the cellular level. Thyroid. (2011) 21(8):879–90. 10.1089/thy.2010.0429
8.
Razvi S Jabbar A Pingitore A Danzi S Biondi B Klein I et al Thyroid hormones and cardiovascular function and diseases. J Am Coll Cardiol. (2018) 71(16):1781–96. 10.1016/j.jacc.2018.02.045
9.
Forini F Nicolini G Kusmic C Iervasi G . Protective effects of euthyroidism restoration on mitochondria function and quality control in cardiac pathophysiology. Int J Mol Sci. (2019) 20(14):3377. 10.3390/ijms20143377
10.
Biondi B Cappola AR Cooper DS . Subclinical hypothyroidism: a review. JAMA. (2019) 322(2):153–60. 10.1001/jama.2019.9052
11.
Paschou SA Bletsa E Stampouloglou PK Tsigkou V Valatsou A Stefanaki K et al Thyroid disorders and cardiovascular manifestations: an update. Endocrine. (2022) 75(3):672–83. 10.1007/s12020-022-02982-4
12.
Gencer B Rodondi N . Should we screen for hypothyroidism in patients with cardiovascular disease?Eur Heart J. (2016) 37(26):2066–8. 10.1093/eurheartj/ehv694
13.
Smith GD Hemani G . Mendelian randomization: genetic anchors for causal inference in epidemiological studies. Hum Mol Genet. (2014) 23(R1):R89–98. 10.1093/hmg/ddu328
14.
Bowden J Del Greco MF Minelli C Zhao Q Lawlor DA Sheehan NA et al Improving the accuracy of two-sample summary-data Mendelian randomization: moving beyond the NOME assumption. Int J Epidemiol. (2019) 48(3):728–42. 10.1093/ije/dyy258
15.
Burgess S Bowden J Fall T Ingelsson E Thompson SG . Sensitivity analyses for robust causal inference from Mendelian randomization analyses with multiple genetic variants. Epidemiology. (2017) 28(1):30–42. 10.1097/EDE.0000000000000559
16.
Bowden J Davey Smith G Haycock PC Burgess S . Consistent estimation in Mendelian randomization with some invalid instruments using a weighted median estimator. Genet Epidemiol. (2016) 40(4):304–14. 10.1002/gepi.219655
17.
Bowden J Davey Smith G Burgess S . Mendelian randomization with invalid instruments: effect estimation and bias detection through egger regression. Int J Epidemiol. (2015) 44(2):512–25. 10.1093/ije/dyv080
18.
Zhu J Zhou D Wang J Yang Y Chen D He F et al Frailty and cardiometabolic diseases a bidirectional Mendelian randomization study. Age Ageing. (2022) 51(11):afac256. 10.1093/ageing/afac256
19.
Ong JS MacGregor S . Implementing MR-PRESSO and GCTA-GSMR for pleiotropy assessment in Mendelian randomization studies from a practitioner's perspective. Genet Epidemiol. (2019) 43(6):609–16. 10.1002/gepi.22207
20.
Tang D Chen M Huang X Zhang G Zeng L Zhang G et al SRplot: a free online platform for data visualization and graphing. PLoS One. (2023) 18(11):e0294236. 10.1371/journal.pone.0294236
21.
Harshfield EL Georgakis MK Malik R Dichgans M Markus HS . Modifiable lifestyle factors and risk of stroke. stroke. (2021) 52(3):931–6. 10.1161/STROKEAHA.120.031710
22.
Marx N Federici M Schütt K Müller-Wieland D Ajjan RA Antunes MJ et al 2023 ESC guidelines for the management of cardiovascular disease in patients with diabetes. Eur Heart J. (2023) 44(39):4043–140. 10.1093/eurheartj/ehad192
23.
Long Y Tang L Zhou Y Zhao S Zhu H . Causal relationship between gut microbiota and cancers: a two-sample Mendelian randomisation study. BMC Med. (2023) 21(1):66. 10.1186/s12916-023-02761-6
24.
Burgess S . Sample size and power calculations in Mendelian randomization with a single instrumental variable and a binary outcome. Int J Epidemiol. (2014) 43(3):922–9. 10.1093/ije/dyu005
25.
Barlow CA Rose P Pulver-Kaste RA Lounsbury KM . Excitation-transcription coupling in smooth muscle. J Physiol. (2006) 570(Pt 1):59–64. 10.1113/jphysiol.2005.098426
26.
Huo Y Feng Q Fan J Huang J Zhu Y Wu Y et al Serum brain-derived neurotrophic factor in coronary heart disease: correlation with the T helper (Th)1/Th2 ratio. T:h17./regulatory T (Treg) ratio, and major adverse cardiovascular events. J Clin Lab Anal. (2023) 37(1):e24803. 10.1002/jcla.24803
27.
Ning Y Cheng YJ Liu LJ Sara JD Cao ZY Zheng WP et al What is the association of hypothyroidism with risks of cardiovascular events and mortality? A meta-analysis of 55 cohort studies involving 1,898,314 participants. BMC Med. (2017) 15(1):21. 10.1186/s12916-017-0777-9
28.
Rodondi N den Elzen WP Bauer DC Cappola AR Razvi S Walsh JP et al Subclinical hypothyroidism and the risk of coronary heart disease and mortality. JAMA. (2010) 304(12):1365–74. 10.1001/jama.2010.1361
29.
Bekkering GE Agoritsas T Lytvyn L Heen AF Feller M Moutzouri E et al Thyroid hormones treatment for subclinical hypothyroidism: a clinical practice guideline. Br Med J. (2019) 365:l2006. 10.1136/bmj.l2006
30.
Zhang M Sara JD Matsuzawa Y Gharib H Bell MR Gulati R et al Clinical outcomes of patients with hypothyroidism undergoing percutaneous coronary intervention. Eur Heart J. (2016) 37(26):2055–65. 10.1093/eurheartj/ehv737
Summary
Keywords
hypothyroidism, atherosclerotic cardiovascular disease, Mendelian randomization, enrichment analysis, causal relationship
Citation
Li J, Wang Y, Luo X, Meng T, Li C, Li J and Du L (2024) Causal relationship between hypothyroidism and coronary atherosclerotic cardiovascular disease: a bidirectional two-sample Mendelian randomization. Front. Cardiovasc. Med. 11:1402359. doi: 10.3389/fcvm.2024.1402359
Received
17 March 2024
Accepted
11 October 2024
Published
24 October 2024
Volume
11 - 2024
Edited by
Bo Li, Zibo Central Hospital, China
Reviewed by
Cristina Martín-Arriscado Arroba, Fundación Investigación Biomédica Hospital 12 de Octubre, Spain
Dexter Canoy, Newcastle University, United Kingdom
Updates
Copyright
© 2024 Li, Wang, Luo, Meng, Li, Li and Du.
This is an open-access article distributed under the terms of the Creative Commons Attribution License (CC BY). The use, distribution or reproduction in other forums is permitted, provided the original author(s) and the copyright owner(s) are credited and that the original publication in this journal is cited, in accordance with accepted academic practice. No use, distribution or reproduction is permitted which does not comply with these terms.
* Correspondence: Likun Du dulikun@hljucm.net
Disclaimer
All claims expressed in this article are solely those of the authors and do not necessarily represent those of their affiliated organizations, or those of the publisher, the editors and the reviewers. Any product that may be evaluated in this article or claim that may be made by its manufacturer is not guaranteed or endorsed by the publisher.