Abstract
Objectives:
The study aimed to evaluate the impact of the co-occurrence of hypertension and type 2 diabetes mellitus (T2DM) on the deterioration of left ventricular (LV) structure and function using three-dimensional speckle-tracking imaging (3D-STI), compared to patients with only hypertension.
Methods:
Data from 272 hypertensive patients, including 85 with T2DM and 187 without, along with 45 normal controls, were analyzed. Participant characteristics were assessed before and after propensity score matching (PSM). 3D-STI-derived parameters, including LV function and global strain parameters, were compared among controls and different patient groups. Multivariable linear regression analyses were conducted to determine the impacts of T2DM on LV function and global strain. Additionally, linear mixed-effects regression models were used to evaluate the associations between 3D-STI-derived parameters and T2DM over time in hypertensive patients.
Results:
Significant increases in the E/e' ratio and declines in the LV global radial strain (GRS) were observed across the control group, HTN (T2DM-) group, and HTN (T2DM+) group. After adjusting for various factors using PSM analysis, LV global circumferential strain (GCS) and global area strain (GAS) were also found to be significantly decreased in the HTN (T2DM+) group compared to the HTN (T2DM-) group. Multivariable regression analyses, accounting for various covariates, indicated that T2DM was independently linked to LV strains (LV GAS: β = 0.95, 95% CI: 0.90–1.00, p = 0.029; LV GRS: β = 1.03, 95% CI: 1.01–1.06, p = 0.014) in hypertensive patients. Furthermore, linear mixed-model analysis revealed that LV GCS (β = 1.20, 95% CI: 0.38–2.01, p = 0.004) and GRS (β = −2.82, 95% CI: −4.97–0.68, p = 0.010) deteriorated over the 12-month period.
Conclusions:
T2DM exacerbates the decline in LV global and regional strains in patients with hypertension, and 3D-STI may be a valuable tool for detecting these asymptomatic preclinical abnormalities.
Introduction
Cardiovascular disease is the leading cause of mortality among patients with hypertension (1). Hypertension and T2DM often coexist due to shared lifestyle factors and pathophysiological mechanisms (2). Studies show that about half of individuals with T2DM also have hypertension, with an even higher prevalence among hospitalized patients (3). Both conditions can lead to significant cardiac structural remodeling and dysfunction (4). Hypertension causes adverse changes in cardiac structure and function, such as LV hypertrophy, due to increased afterload (5). Diabetes is associated with a higher risk of heart failure and specific alterations in LV structure and function (6). However, many studies on the relationship between hypertension, diabetes, and cardiovascular disease (CVD) outcomes have not conducted stratified analyses to determine if the associations of diabetes with changes in LV structure and function are independent of hypertension. Therefore, it has been difficult to separate the independent effects of diabetes on cardiac structure and function from those of comorbid hypertension.
Noninvasive imaging techniques have gained significant interest for studying functional changes in the LV across a range of diseases. Evaluation of myocardial contractility using echocardiography has traditionally been performed through volume-based assessment of ejection fraction and estimation of myocardial thickening (7). However, these conventional methods are sensitive to loading conditions and can be variable due to assumptions about geometric modeling and errors from foreshortened echocardiographic views (8). Over the past decade, advancements in cardiac imaging have introduced new echocardiographic techniques, such as two-dimensional (2D) speckle-tracking and 3D echocardiography (9). These techniques enable more accurate quantification of ventricular function. Compared to 2D speckle-tracking imaging (2D-STI), 3D-STI offers higher accuracy and reproducibility in evaluating LV volume and function. It provides a more comprehensive assessment of myocardial motion without out-of-plane speckle loss, offers strain information that is closer to reality, and more reliably evaluates LV myocardial function (10–12). Current research on 3D-STI predominantly focuses on conditions like coronary heart disease, cardiomyopathy, valvular heart disease, and other cardiac disorders (10, 13, 14). This advanced technique holds significant value in accurately evaluating myocardial function, aiding in differential diagnosis, risk stratification, and predicting adverse events.
This study aimed to assess the impact of T2DM on LV structural and functional changes in individuals with hypertension using three-dimensional speckle-tracking imaging (3D-STI). Additionally, the study tracked changes in both risk factors and cardiovascular indices in hypertensive patients over a 12-month period.
Materials and methods
Study population
This prospective study took place at Shanxi Baiqiuen Hospital in Shanxi, China, from November 2020 to April 2022. Figure 1 illustrates the detailed steps of the entire screening process. A total of 421 adult patients with essential hypertension who underwent real-time three-dimensional standard echocardiographic assessment at the hospital were enrolled and categorized into two groups: those with T2DM [HTN (T2DM+)] and those without [HTN (T2DM-)]. Hypertension was defined as a systolic blood pressure (SBP) ≥ 140 mmHg and/or a diastolic blood pressure (DBP) ≥ 90 mmHg at rest, measured on multiple occasions, or the use of antihypertensive medications. The diagnosis of T2DM followed the guidelines of the American Diabetes Association, which includes HbA1c levels ≥6.5% or fasting plasma glucose ≥126 mg/dl.
Figure 1
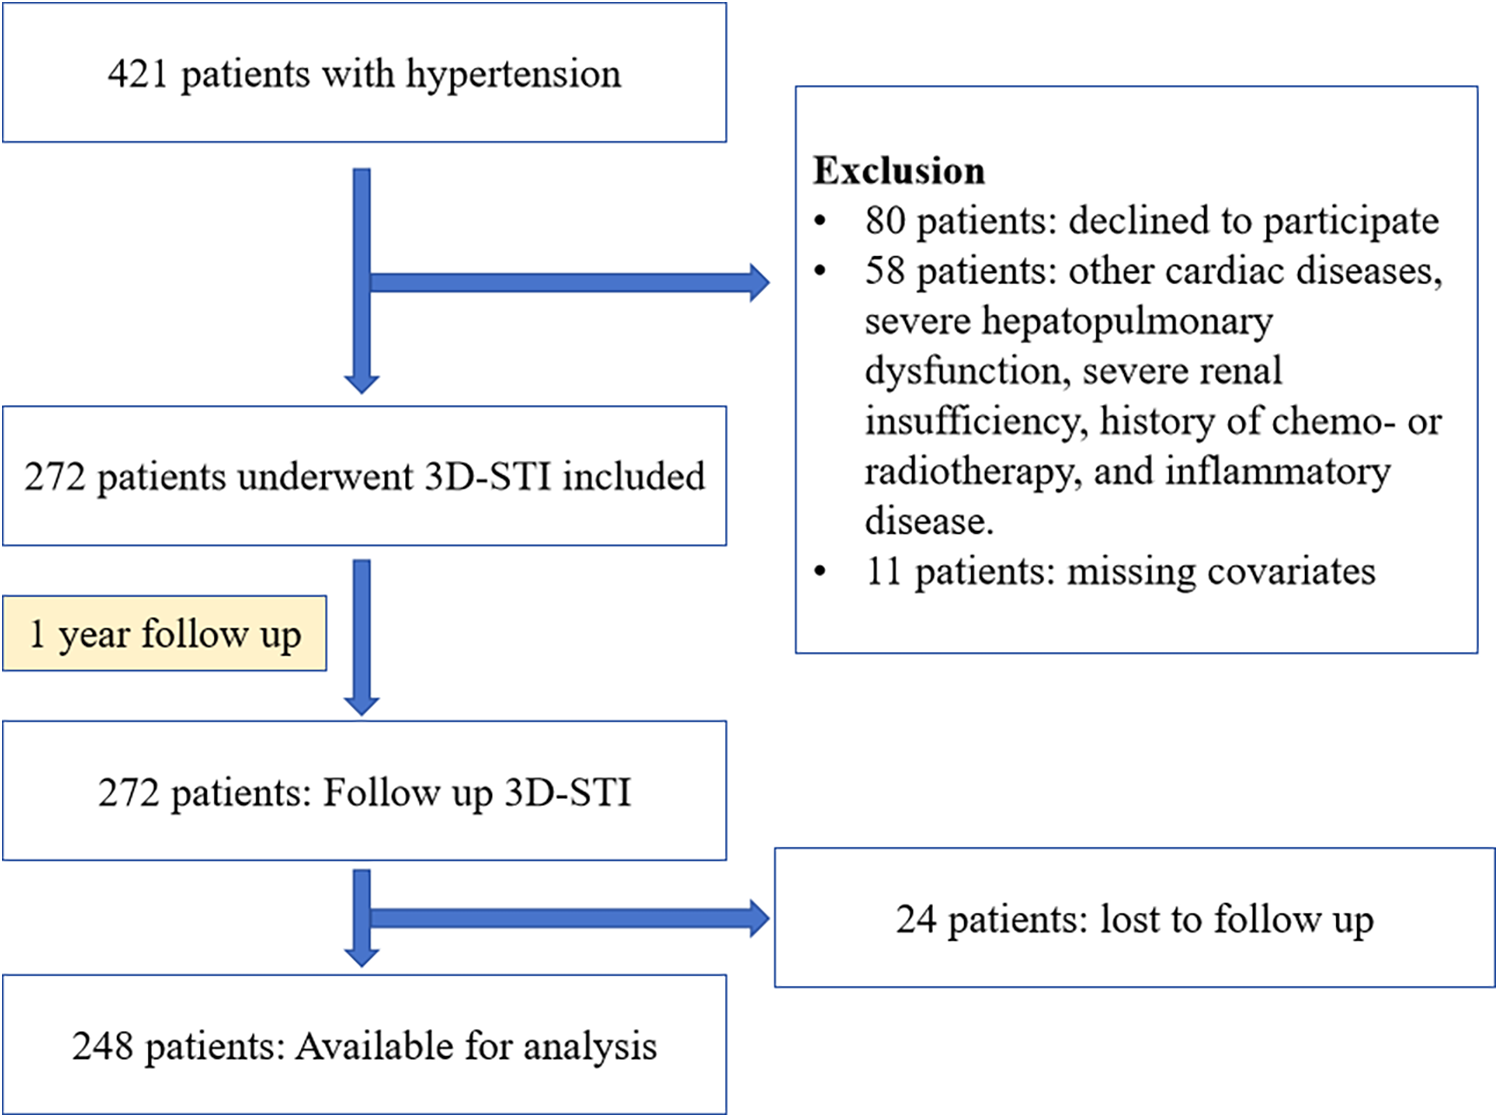
Flowchart of participants throughout the study.
Exclusion criteria were the following: history of coronary heart disease or known cardiopathy (including myocardial infarction, percutaneous coronary intervention, or coronary artery bypass grafting), previous documented diagnosis of cardiac damage or heat failure, left or right ventricular ejection fraction <50%, atrial fibrillation, moderate to severe valvular disease, severe renal insufficiency (eGFR < 30 ml/1.73 mm2) or dialysis, history of chemo- or radiotherapy, congenital heart disease, inflammatory diseases (including rheumatoid arthritis, systemic lupus erythematosus, inflammatory bowel diseases, vasculitis, or any condition associated with acute or chronic systemic inflammation), and myocarditis. Patients missing covariates were also excluded. Ultimately, 272 patients met the eligibility criteria for this study. 45 healthy individuals with no history of impaired glucose tolerance, electrocardiogram (ECG) abnormalities, symptoms of cardiovascular disease or cardiovascular abnormalities detected using 3D echocardiography were included as the control group.
In addition to baseline echocardiography, the hypertension group underwent longitudinal examinations at 12 months to evaluate changes in cardiac indices over time. To enhance retention, participants received regular reminders via phone and email, and small incentives were provided at each follow-up visit. Comprehensive clinical assessments, including physical exams and echocardiography, were conducted, with echocardiograms analyzed by blinded cardiologists using standardized equipment. Linear mixed-effects models were employed for data analysis, and missing data were managed through multiple imputation to ensure robustness in the final results. This study received approval from the Biomedical Research Ethics Committee of Shanxi Baiqiuen Hospital and was conducted in accordance with the Declaration of Helsinki.
Standard echo-Doppler examination
Conventional echocardiography was performed to analyze a range of cardiac parameters. Interventricular septal thickness (IVSd) was measured. Pulsed wave Doppler ultrasound was used to collect transmitral inflow diastolic velocities (E and A). Tissue Doppler imaging was employed to measure mitral annular diastolic velocities (e' and A') at both the septal and lateral mitral annulus (7). The average of these two measurements for e' was used for subsequent analysis. The ratios of E/A, e'/a', and E/e' were then calculated as key indices of diastolic function and left ventricular filling pressure.
Three-dimensional speckle-tracking imaging
Transthoracic echocardiographic examinations were conducted by a skilled echocardiographer using the X5-1 transducer and either an EPIQ 7G or EPIQ Elite ultrasound machine (Philips, Bothell, WA, USA). All measurements adhered to the current guidelines of the American Society of Echocardiography. The examination protocol involved assessing the left ventricle in the standard four-chamber apical view. To achieve a high frame rate, the field of view was optimized by adjusting the sector width and depth and utilizing zoom when necessary.
Speckle-tracking echocardiography was employed to evaluate the global longitudinal strain of the left ventricle, with measurements taken at a rate of 50–70 frames per second. The clips were saved at the original frame rate to an external hard drive and later analyzed offline using QLAB Advanced Quantification software (Philips). The software generated the LV volume-time curve, left ventricular ejection fraction (LVEF), and global and regional strain values in various directions. The 3D routine data and strain parameters included LVEF, left ventricular mass (LVM), left ventricular mass index (LVMi), and left ventricular end-diastolic mass (LVEDMass). Global longitudinal strain (GLS), global circumferential strain (GCS), global area strain (GAS), and global radial strain (GRS) values were determined as the weighted averages of their respective peak strain values using the software.
Statistical analysis
Statistical analysis was conducted using SPSS version 27.0 software. Categorical data are presented as frequencies (percentages) and were compared using the chi-squared test. The normality of continuous variables was assessed using the Shapiro-Wilk test. Due to the non-normal distribution of variables, data were described using interquartile ranges. The Kruskal-Wallis test was utilized to compare baseline clinical characteristics and cardiac measurements. Given the non-randomized study design, we conducted PS matching analysis to compare the cardiac 3D-STI-derived parameters between [HTN (T2DM-)] and [HTN (T2DM+)] patients. Spearman's correlation coefficient was employed to analyze the relationships between 3D-STI-derived LV function and ventricular volumetrics, LV global strains, and regional strains in hypertensive patients. Multiple linear regression analyses were conducted to investigate the association between T2DM and various LV global strains, adjusting for BMI, age, sex, duration of hypertension, systolic blood pressure (SBP), diastolic blood pressure (DBP), heart rate, and use of ACEI/ARB. We matched each patients with diabetes with those without diabetes at a 1:1 ratio using the optimal method, with a caliper width equal to 0.3 of the standard deviation of the logit PS. The balance of baseline features was examined, and a standardized mean difference < 0.1 indicated a negligible difference. Linear mixed-effects models with two random effects (random intercept and random slope) and an unstructured variance-covariance matrix, were used to assess the relationships between 3D-STI-derived parameters and T2DM in the patients with hypertension over time. Statistical significance was set at P < 0.05, and all tests were two-tailed.
Results
Demographic and clinical characteristics of study participants at baseline
Table 1 presents the baseline clinical characteristics of the participants. Both patient groups exhibited significantly higher age, BMI, heart rate, SBP, and DBP compared to the control group (all p < 0.01). The PS matching analysis included 272 patients who had hypertension. After 1:1 PS matching, 170 patients were included in the final analysis. The demographic and clinical parameters at baseline were well balanced, with a standardized mean difference < 0.1 (Table 1). In the HTN (T2DM+) group, fasting blood glucose and plasma triglycerides (p = 0.000) levels were significantly higher than in the HTN (T2DM-) group and controls in both the unmatched and PS-matched cohorts (all p < 0.01). Additionally, LDL levels in the HTN (T2DM+) group were significantly lower than those in the HTN (T2DM-) (p = 0.035) and control groups (p < 0.01).
Table 1
| Parameter | All patients (n = 317) | p value | PS-matched pairs (n = 170) | p value | |||
|---|---|---|---|---|---|---|---|
| Controls (n = 45) | HTN (T2DM-) (n = 187) | HTN (T2DM+) (n = 85) | HTN (T2DM-) (n = 85) | HTN (T2DM+) (n = 85) | |||
| Demographics | |||||||
| Female, n (%) | 21 (46.7) | 102 (54.5) | 51 (60.0) | 0.228 | 47 (55.3) | 51 (60.0) | 0.535 |
| Age (year) | 51.0 (45.5, 54.0) | 65.0 (62.0, 69.0)* | 65.0 (63.0, 68.0)* | 0.000 | 64.0 (62.0, 67.5) | 65.0 (63.0, 68.0) | 0.299 |
| BMI (kg/m2) | 24.0 (22.9, 25.7) | 25.8 (23.9, 27.8)* | 26.0 (24.0, 28.3)* | <0.001 | 26.2 (24.2, 27.8) | 26.0 (24.0, 28.3) | 0.940 |
| BSA (m2) | 1.69 (1.65, 1.77) | 1.70 (1.61, 1.83) | 1.73 (1.58, 1.83) | 0.886 | 1.73 (1.64, 1.83) | 1.73 (1.58, 1.83) | 0.764 |
| Duration of hypertension (year) | 0 | 14.5 (8.2, 21.4) | 11.6 (6.7, 18.4) | 0.015 | 13.0 (7.9, 20.4) | 11.6 (6.7, 18.4) | 0.422 |
| Duration of diabetes (year) | 0 | 0 | 1.2 (0.7, 1.6) | NA | 0 | 1.2 (0.7, 1.6) | NA |
| Laboratory data | |||||||
| Fasting blood glucose (mmol/L) | 4.67 (3.76, 5.41) | 5.34 (4.76, 5.70)* | 6.97 (6.46, 8.07)*,# | 0.000 | 5.33 (4.91, 5.69) | 6.97 (6.46, 8.07)# | 0.000 |
| HbA1c (%) | 5.42 (5.09, 5.94) | 6.22 (6.03, 6.57) | 7.32 (7.14, 8.43) | 0.000 | 6.20 (6.10, 6.64) | 7.32 (7.14, 8.43) | 0.000 |
| Triglycerides (mmol/L) | 1.18 (1.05, 1.37) | 1.50 (1.13, 2.14)* | 1.84 (1.31, 2.47)*,# | 0.000 | 1.70 (1.13, 2.12) | 1.84 (1.31, 2.47)# | 0.023 |
| Total cholesterol (mmol/L) | 4.18 (3.71, 4.50) | 4.44 (3.92, 4.94)* | 4.43 (3.96, 5.10)* | 0.000 | 4.43 (3.89, 4.89) | 4.43 (3.96, 5.10) | 0.506 |
| HDL (mmol/L) | 1.01 (0.86, 1.51) | 2.61 (2.11, 3.08)* | 2.54 (1.98, 3.11)* | 0.000 | 2.63 (2.12, 3.06) | 2.54 (1.98, 3.11) | 0.923 |
| LDL (mmol/L) | 2.80 (2.63, 3.03) | 1.38 (1.22, 1.57)* | 1.36 (1.19, 1.54)*,# | 0.000 | 1.42 (1.25, 1.63) | 1.36 (1.19, 1.54)# | 0.035 |
| Hemodynamic variables | |||||||
| Heart rate (beats/min) | 67.0 (62.0, 71.5) | 74.0 (68.0, 82.0)* | 75.0 (66.8, 83.5)* | <0.001 | 74.0 (67.5, 81.5) | 75.0 (66.8, 83.5) | 0.689 |
| SBP (mmHg) | 118.0 (112.0, 126.5) | 170.0 (160.0, 174.0)* | 169.0 (160.0, 180.0)* | 0.000 | 170.0 (160.0, 176.5) | 169.0 (160.0, 180.0) | 0.912 |
| DBP (mmHg) | 78.0 (72.5, 82.0) | 100.0 (90.0, 110.0)* | 100.0 (90.0, 105.3)* | 0.000 | 100.0 (90.0, 110.0) | 100.0 (90.0, 105.3) | 0.718 |
| Antihypertensive medications | |||||||
| ACEI/ARB, n (%) | 0 | 88 (47.1) | 37 (43.6) | 0.073 | 44 (51.8) | 37 (43.6) | 0.309 |
| Calcium channel blocker, n (%) | 0 | 163 (87.1) | 75 (88.2) | 0.591 | 78 (91.8) | 75 (88.2) | 0.305 |
| Diuretic, n (%) | 0 | 21 (11.2) | 9 (10.6) | 0.825 | 8 (9.4) | 9 (10.6) | 0.798 |
| Hypoglycemic medications | NA | NA | |||||
| Insulin | 0 | 0 | 19 (22.4) | 0 | 19 (22.4) | ||
| Metformin | 0 | 0 | 27 (31.8) | 0 | 27 (31.8) | ||
| Sulfonylureas | 0 | 0 | 10 (11.8) | 0 | 10 (11.8) | ||
| α-Glucosidase inhibitors | 0 | 0 | 33 (38.8) | 0 | 33 (38.8) | ||
Baseline characteristics of the study population.
Values are interquartile ranges, numbers in the brackets are percentage.
BMI, body mass index; HDL, high-density lipoprotein cholesterol; LDL, low–density lipoprotein cholesterol; SBP, systolic blood pressure; DBP, diastolic blood pressure; ACEI, angiotensin converting enzyme inhibitor; ARB, angiotensin II receptor blocker.
p < 0.05 vs. control group.
p < 0.05 vs. HTN (T2DM-) group.
Comparison of the characteristics of the cardiac 3d-STI-derived parameters between HTN (T2dm-) and HTN (T2dm+) group
Table 2 displays the cardiac 3D-STI parameters. Compared to controls, hypertensive patients exhibited higher left ventricular mass (LVM), interventricular septal thickness (p = 0.038), e' velocity (p = 0.000), and E/e' ratio (p < 0.001). The LVMi, E/A ratio (p = 0.000) were lower in the hypertension group compared to controls. LV GLS, GRS, GCS, and GAS decreased progressively from controls through the HTN (T2DM-) group to the HTN (T2DM+) group (all p < 0.01) (Figure 2).
Table 2
| Parameter | All patients (n = 317) | p value | PS-matched Pairs (n = 170) | p value | |||
|---|---|---|---|---|---|---|---|
| Controls (n = 45) | HTN(T2DM-) (n = 187) | HTN(T2DM+) (n = 85) | HTN(T2DM-) (n = 187) | HTN(T2DM+) (n = 85) | |||
| LVM | 136.43 (128.64, 141.61) | 168.32 (147.23, 181.31)* | 162.34 (142.11, 181.38)* | <0.001 | 163.85 (147.21, 180.62) | 162.34 (142.11, 181.38) | 0.828 |
| LVMi (g/m2) | 79.15 (73.98, 83.31) | 96.39 (86.24, 107.63)* | 92.33 (84.60, 103.10)* | <0.001 | 96.02 (84.13, 105.85) | 92.33 (84.60, 103.10) | 0.564 |
| Interventricular septal thickness (mm) | 10.0 (10.0, 10.0) | 10.0 (10.0, 11.0)* | 10.0 (9.0, 11.0)* | 0.038 | 10.0 (10.0, 11.0) | 10.0 (9.0, 11.0) | 0.631 |
| LVEF (%) | 66.74 (65.14, 69.02) | 67.0 (63.0, 70.0) | 68.0 (64.0, 70.0) | 0.725 | 67.0 (64.0, 70.5) | 68.0 (64.0, 70.0) | 0.856 |
| E/A ratio | 1.30 (1.07, 1.47) | 0.76 (0.67, 0.85)* | 0.75 (0.64, 0.84)* | 0.000 | 0.77 (0.69, 0.85) | 0.75 (0.64, 0.84) | 0.157 |
| e’ velocity (cm/s) | 13.87 (12.29, 13.93) | 8.0 (7.0, 9.0)* | 8.0 (6.0, 9.0)* | <0.001 | 8.0 (7.0, 9.0) | 8.0 (6.0, 9.0) | 0.122 |
| E/e’ ratio | 6.44 (5.65, 7.58) | 8.33 (7.00, 10.14)* | 9.25 (7.80, 10.92)*,# | <0.001 | 8.25 (6.95, 9.94) | 9.25 (7.80, 10.92)# | 0.021 |
| LV GLS (%) | −19.9 (−21.6, −18.1) | −10.0 (−13.0, −7.0)* | −9.0 (−12.0, −7.0)* | 0.000 | −11.0 (−13.0, −7.5) | −9.0 (−12.0, −7.0) | 0.103 |
| LV GCS (%) | −19.7 (−24.2, −14.4) | −13.0 (−15.0, −10.0)* | −11.0 (−15.0, −9.0)* | <0.001 | −13.0 (−16.0, −10.0) | −11.0 (−15.0, −9.0)# | 0.022 |
| LV GAS (%) | −33.1 (−38.9, −28.3) | −21.0 (−24.0, −16.0)* | −18.0 (−23.0, −14.0)* | 0.000 | −21.0 (−24.5, −18.0) | −18.0 (−23.0, −14.0)# | 0.008 |
| LV GRS (%) | 46.2 (42.0, 49.4) | 31.0 (23.0, 38.0)* | 26.0 (19.5, 35.5)*,# | 0.000 | 31.0 (26.0, 38.5) | 26.0 (19.5, 35.5)# | 0.004 |
| Spehericity index | 0.38 (0.36, 0.41) | 0.35 (0.31, 0.41)* | 0.37 (0.30, 0.45) | 0.091 | 0.36 (0.32, 0.43) | 0.37 (0.30, 0.45) | 0.924 |
Comparison of 3D-STI-derived LV parameters among groups.
LVM, left ventricular mass; LVMi, left ventricular mass index; LVEF, left ventricular ejection fraction; A, transmitral A velocity; E, transmitral E velocity; e’, e’ velocity of mitral annulus; GLS, global longitudinal strain; GCS, global circumferential strain; GAS, global area strain; GRS, global radial strain; EDmass, end-diastolic mass index.
p < 0.05 vs. control group.
p < 0.05 vs. HTN (T2DM-) group.
Figure 2
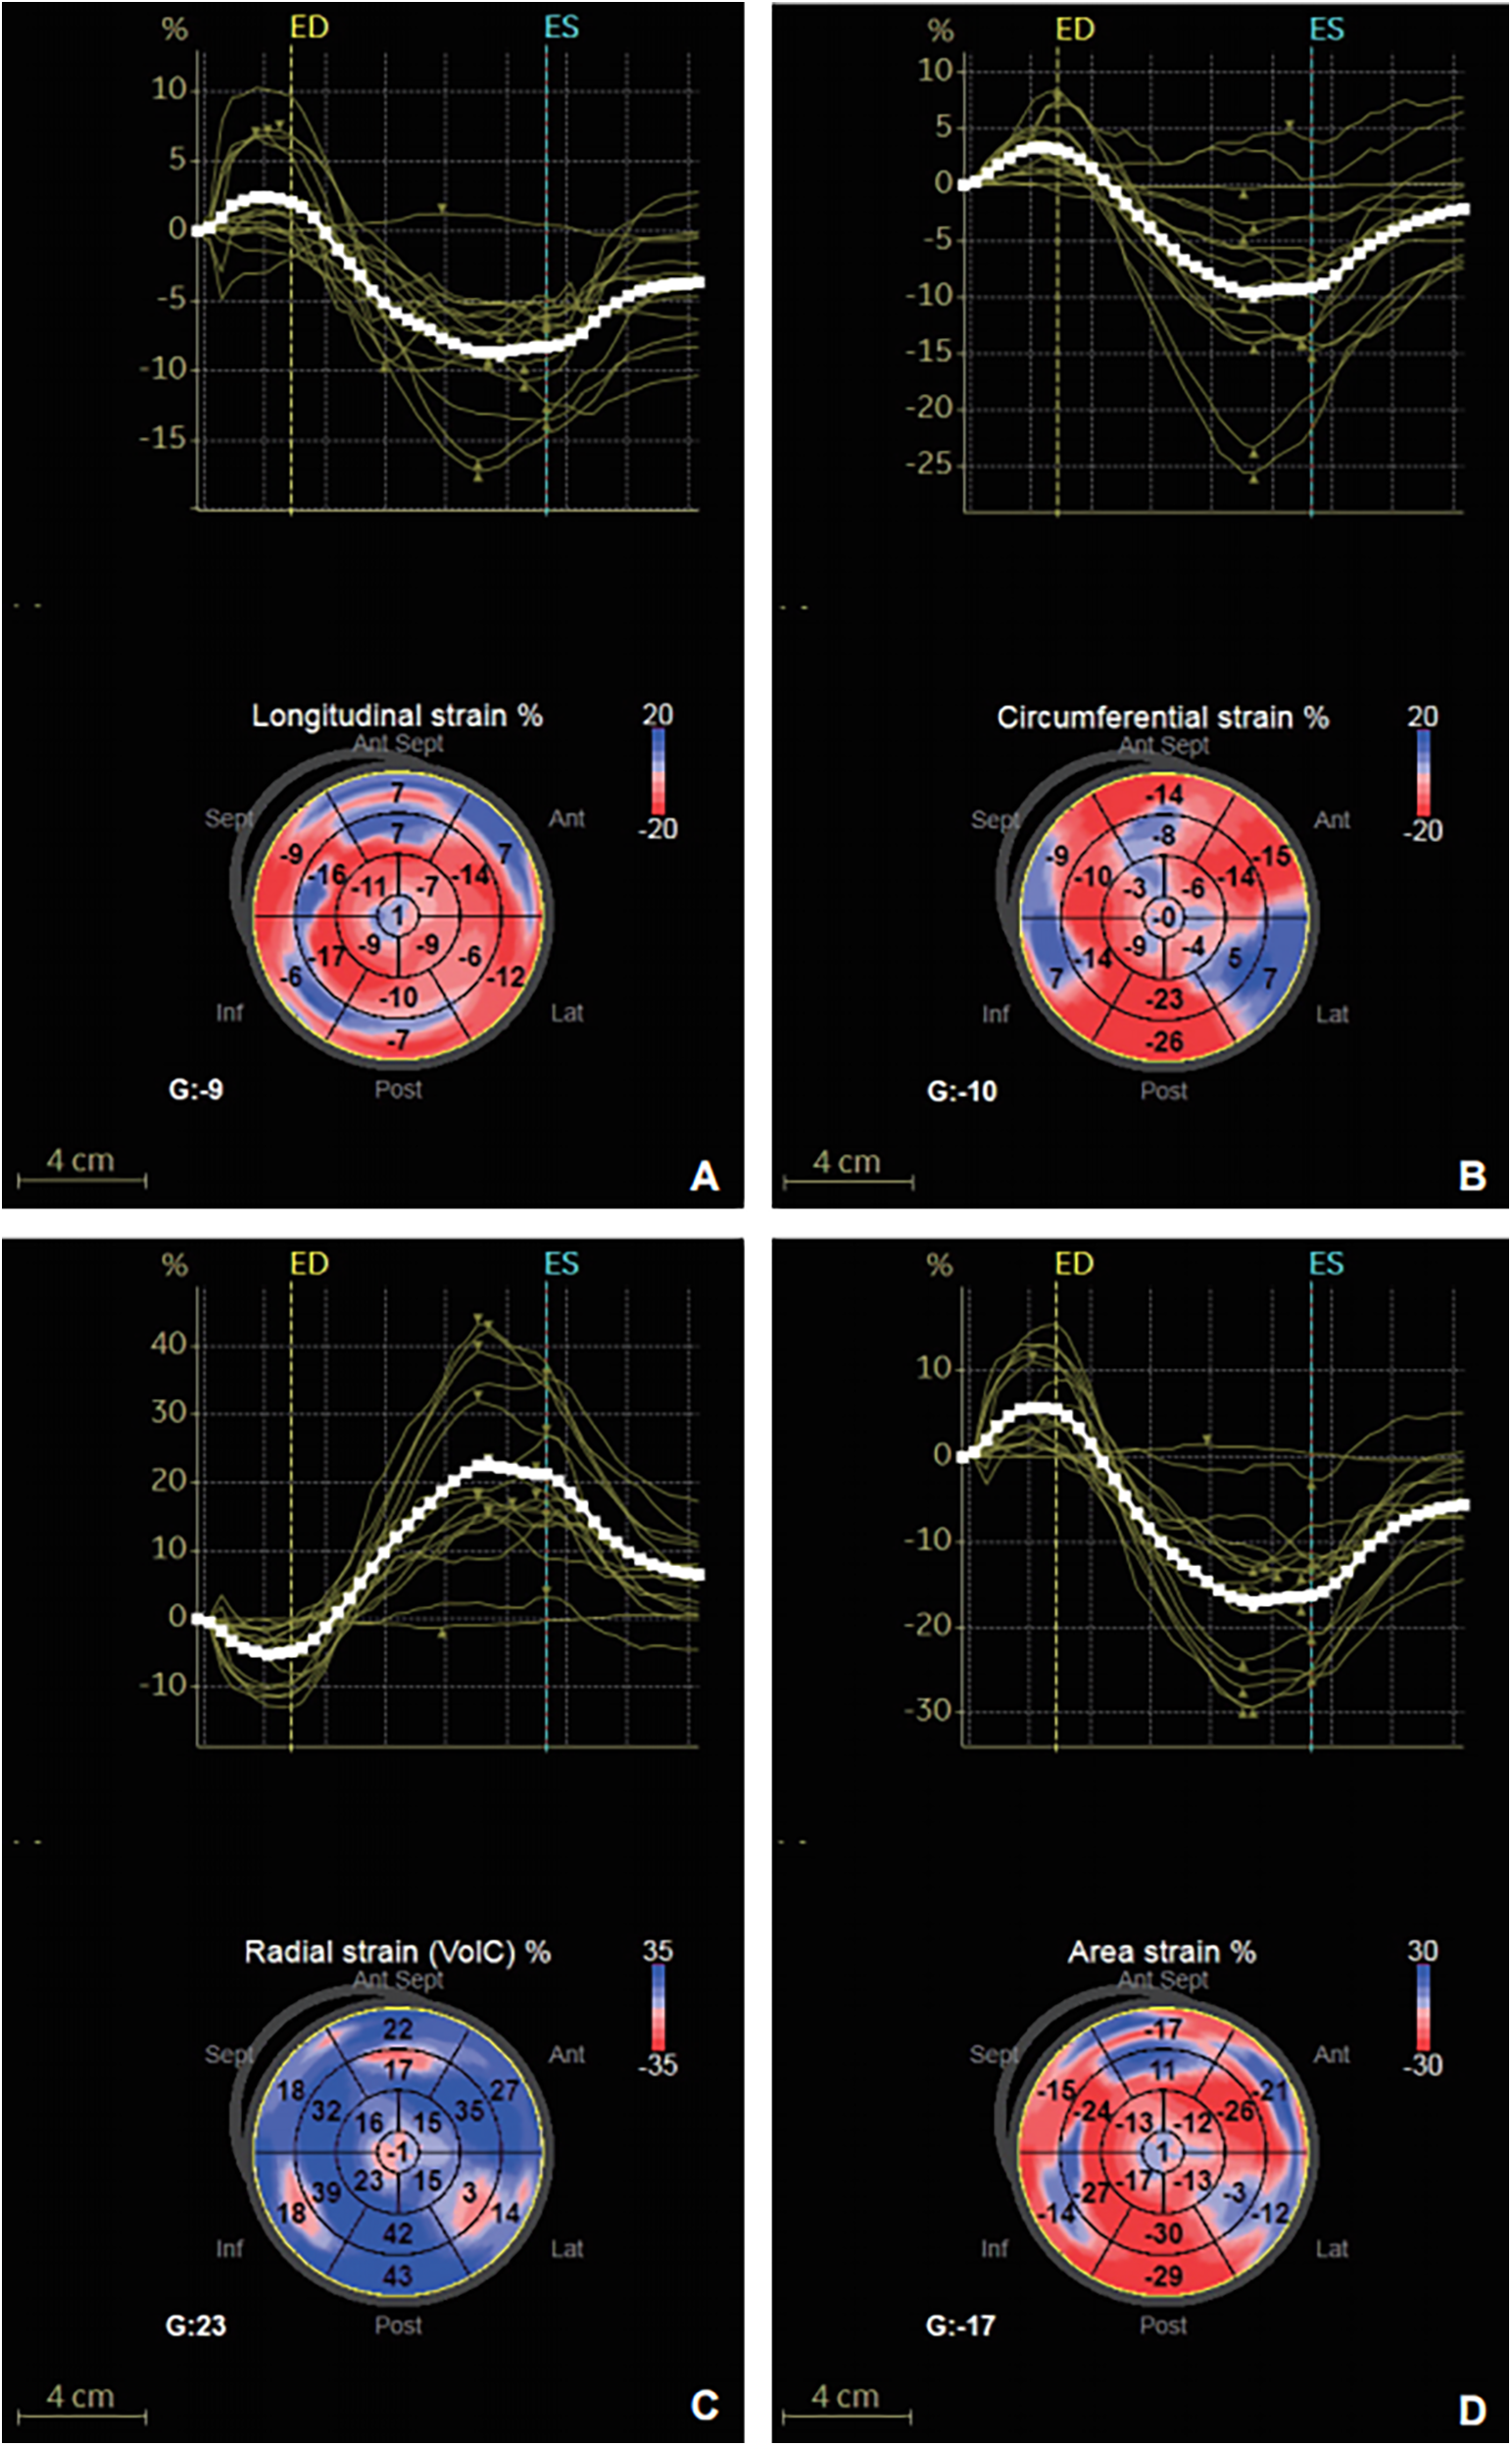
Strain-time curve and peak global systolic strain values were evaluated using the software in a 63-year-old hypertensive patients with T2DM. (A) GLS. (B) GCS. (C) GRS. (D) GAS.
The HTN (T2DM+) group demonstrated an increased E/e' ratio (p = 0.042) and a decreased LV GRS (p = 0.032) compared to the HTN (T2DM-) group. There were no significant differences in LVM, LVMi, interventricular septal thickness, LVEF) E/A ratio, e’ velocity, LVED mass, LV GLS, GCS, and GAS between the HTN (T2DM-) and HTN (T2DM+) groups (all p > 0.05). After PS matching, the duration of hypertension was comparable between HTN (T2DM-) and HTN (T2DM+) groups. In the PS-matched cohort, the HTN (T2DM+) group consistently exhibited higher E/e' ratio and lower LV GRS compared to the HTN (T2DM-) group. In addition, LV GCS (p = 0.022) and GAS (p = 0.008) were observed lower in the HTN (T2DM+) group compared to the HTN (T2DM-) group (see Table 2).
Correlation analysis of cardiac 3D-STI derived parameters among hypertension patients
In patients with hypertension (Table 3), the E/A ratio was significantly correlated with LV GCS (r = −0.138, p = 0.022), GAS (r = −0.151, p = 0.013), and GRS (r = 0.164, p = 0.007), but not GLS (r = −0.084, p = 0.166). Additionally, the E/e' ratio showed the strongest association with GCS (r = −0.130, p = 0.033) (see Table 3).
Table 3
| GLS (p-value) | GCS (p-value) | GAS (p-value) | GRS (p-value) | |
|---|---|---|---|---|
| BMI | 0.125 (0.039) | 0.111 (0.067) | 0.141 (0.020) | −0.125 (0.040) |
| SBP | −0.055 (0.370) | −0.004 (0.952) | −0.029 (0.639) | 0.015 (0.808) |
| DBP | −0.024 (0.697) | 0.015 (0.811) | −0.023 (−0.700) | 0.024 (0.693) |
| LVEF | 0.100 (0.100) | −0.089 (0.142) | 0.018 (0.766) | −0.024 (0.697) |
| LVM | 0.035 (0.561) | −0.057 (0.347) | 0.010 (0.868) | 0.001 (0.988) |
| LVMi | −0.088 (0.146) | −0.074 (0.224) | −0.065 (0.288) | 0.067 (0.274) |
| E/A ratio | −0.084 (0.166) | −0.138 (0.022) | −0.151 (0.013) | 0.164 (0.007) |
| e’ velocity | −0.111 (0.069) | 0.000 (0.998) | −0.075 (0.218) | 0.105 (0.084) |
| E/e’ ratio | −0.037 (0.542) | −0.130 (0.033) | −0.094 (0.122) | 0.073 (0.234) |
Correlation between 3D-derived LV components in the patients with hypertension (r coefficient and significance).
BMI, body mass index; SBP, systolic blood pressure; DBP, diastolic blood pressure; LVEF, left ventricular ejection fraction; LVM, left ventricular mass; LVMi, left ventricular mass index; A, transmitral A velocity; E, transmitral E velocity; e’, e’ velocity of mitral annulus.
Multivariate regression analyses of T2DM with LV strains in patients with hypertension
The univariable analysis revealed that age, BMI, sex, SBP, DBP, and heart rate were all significantly associated with LV strains (all p < 0.05; see Table 4). In the multivariable analysis, increases in age, BMI, sex, SBP, DBP, and heart rate remained independent determinants of reduced LV strains among all patients (all p < 0.05). Variables with a p-value < 0.10 in the univariable model were included in the multivariable model to evaluate the impact of T2DM on LV strain in patients with hypertension. After adjusting for BMI, age, sex, duration of hypertension, SBP, DBP, and heart rate, multivariable regression analyses of the patients with hypertension showed that T2DM was independently associated with LV GAS (β = 0.949, 95% CI: 0.905-0.995, p = 0.031) and GRS (β = 1.033, 95% CI: 1.006–1.060, p = 0.014), but not with LV GLS or GCS. In addition, after adjusting for the above covariates and ACEI/ARB use, T2DM was independently correlated with LV GAS (β = 0.949, 95%CI: 0.904–0.995, p = 0.029) and GRS (β = 1.033, 95%CI: 1.007–1.061, p = 0.014) (see Table 5).
Table 4
| GLS | GCS | GAS | GRS | |||||||||||||
|---|---|---|---|---|---|---|---|---|---|---|---|---|---|---|---|---|
| Univariable | p-value | Multivariable | p-value | Univariable | p-value | Multivariable | p-value | Univariable | p-value | Multivariable | p-value | Univariable | p-value | Multivariable | p-value | |
| β | β | β | β | β | β | β | β | |||||||||
| Age (year) | −0.39 (−0.45, 0.32) | <0.001 | 0.25 (−0.83, 0.99) | 0.866 | −0.23 (−0.30, −0.15) | <0.001 | −0.10 (−0.19, −0.01) | 0.028 | −0.51 (−0.61, −0.42) | <0.001 | −0.33 (−0.45, −0.22) | <0.001 | −0.55 (−0.71, −0.38) | <0.001 | −0.26 (−0.46, −0.05) | 0.013 |
| BMI (kg/m2) | −0.31 (−0.49, −0.13) | <0.001 | −0.18 (−0.32, −0.04) | 0.014 | −0.24 (−0.42, −0.07) | 0.006 | −0.14 (−0.30, 0.02) | 0.088 | −0.52 (−0.77, −0.27) | <0.001 | −0.35 (−0.56, −0.14) | 0.001 | −0.64 (−1.04, −0.24) | 0.002 | −0.43 (−0.80, −0.06) | 0.024 |
| Sex | 0.13 (−1.02, 1.29) | 0.823 | 1.20 (0.08, 2.32) | 0.036 | 1.15 (0.12, 2.18) | 0.029 | −0.58 (−2.23, 1.08) | 0.494 | 0.63 (−1.97, 3.24) | 0.634 | ||||||
| SBP (mmHg) | −0.13 (−0.16, −0.11) | <0.001 | −0.06 (−0.09, −0.03) | <0.001 | −0.10 (−0.12, −0.07) | <0.001 | −0.05 (−0.09, −0.02) | 0.004 | −0.18 (−0.21, −0.14) | <0.001 | −0.07 (−0.11, −0.02) | 0.006 | −0.21 (−0.27, −0.16) | <0.001 | −0.11 (−0.20, −0.03) | 0.007 |
| DBP (mmHg) | −0.16 (−0.20, −0.12) | <0.001 | −0.05 (−0.09, −0.00) | 0.036 | −0.12 (−0.17, −0.08) | <0.001 | −0.05 (−0.10, 0.00) | 0.066 | −0.21 (−0.27, −0.15) | <0.001 | −0.06 (−0.13, 0.00) | 0.066 | −0.26 (−0.36, −0.16) | <0.001 | −0.06 (−0.17, 0.06) | 0.349 |
| Heart rate (beats/min) | −0.11 (−0.15, −0.06) | <0.001 | −0.05 (−0.09, −0.01) | 0.021 | −0.07 (−0.12, −0.02) | 0.004 | −0.03 (−0.08, 0.01) | 0.154 | −0.16 (−0.23, −0.09) | <0.001 | −0.08 (−0.14, −0.02) | 0.008 | −0.25 (−0.36, −0.15) | <0.001 | −0.17 (−0.28, −0.07) | 0.001 |
| ACEI/ARB | 0.26 (−0.66, 1.17) | 0.557 | 0.78 (−0.19, 1.74) | 0.114 | 0.54 (−0.80, 1.88) | 0.426 | −1.46 (−3.99, 1.07) | 0.256 | ||||||||
Determinants of LV strains in patients with hypertension.
BMI, body mass index; SBP, systolic blood pressure; DBP, diastolic blood pressure; ACEI, angiotensin converting enzyme inhibitor; ARB, angiotensin II receptor blocker; GLS, global longitudinal strain; GCS, global circumferential strain; GAS, global area strain; GRS, global radial strain.
Values are unstandardized estimate coeffcients (B) and 95% confdent interval (CI).
Table 5
| GLS | GCS | GAS | GRS | |||||
|---|---|---|---|---|---|---|---|---|
| Coefficient (95% CI) | p value | Coefficient (95% CI) | p value | Coefficient (95% CI) | p value | Coefficient (95% CI) | p value | |
| Model1 | 0.96 (0.90, 1.03) | 0.226 | 0.94 (0.88, 1.01) | 0.076 | 0.95 (0.91, 1.00) | 0.031 | 1.03 (1.01, 1.06) | 0.014 |
| Model2 | 0.96 (0.90, 1.03) | 0.222 | 0.94 (0.88, 1.01) | 0.070 | 0.95 (0.90, 1.00) | 0.029 | 1.03 (1.01, 1.06) | 0.014 |
Associations between T2DM and the LV strains among hypertensive patients in multivariable analysis.
GLS, global longitudinal strain; GCS, global circumferential strain; GAS, global area strain; GRS, global radial strain.
Model 1. adjusted for BMI, age, duration of hypertension, SBP, DBP, sex, and heart rate.
Model 2. adjusted for BMI, age, duration of hypertension, SBP, DBP, sex, heart rate and ACEI/ARB use.
Values are unstandardized estimate coeffcients (B) and 95% confdent interval (CI).
12 Months later findings in hypertensive patients with diabetes
Univariate linear mixed-model analysis demonstrated a notable decrease in LV strains, specifically LV GCS (β = 1.20, 95% CI: 0.38-2.01, p = 0.004) and GRS (β = −2.82, 95% CI: −4.97–0.68, p = 0.010), at the 12-month follow-up. The findings indicated a significant longitudinal association between T2DM and LV strains (see Table 6).
Table 6
| Mean changes between baseline and 12 months | p value | |
|---|---|---|
| LVM | −2.05 (−8.43, 4.33) | 0.528 |
| LVMi (g/m2) | −0.83 (−4.31, 2.65) | 0.639 |
| Interventricular septal thickness (mm) | −0.13 (−0.29, 0.03) | 0.114 |
| LVEF (%) | −0.10 (−0.92, 0.73) | 0.820 |
| E/A ratio | −0.03 (−0.07, 0.02) | 0.215 |
| e’ velocity (cm/s) | −0.38 (−0.77, 0.00) | 0.052 |
| E/e’ ratio | 0.55 (−0.08, 1.17) | 0.084 |
| LV GLS (%) | 0.30 (−0.45, 1.06) | 0.431 |
| LV GCS (%) | 1.20 (0.38, 2.01) | 0.004 |
| LV GAS (%) | 1.29 (0.09, 2.49) | 0.036 |
| LV GRS (%) | −2.82 (−4.97, −0.68) | 0.010 |
| Spehericity index | 0.01 (−0.01, 0.03) | 0.461 |
Changes in 3D-STI-derived parameters during the 12-months follow-up in patients co-occurrence hypertension and diabetes.
LVM, left ventricular mass; LVMi, left ventricular mass index; LVEF, left ventricular ejection fraction; A, transmitral A velocity; E, transmitral E velocity; e’, e’ velocity of mitral annulus; GLS, global longitudinal strain; GCS, global circumferential strain; GAS, global area strain; GRS, global radial strain; EDmass, end-diastolic mass index.
Values in parentheses are 95% CI. Analysis was performed using linear mixed models.
Discussion
Our study aimed to assess the impact of diabetes on LV structure and function in hypertensive patients using 3D-STI. The results, adjusted for BMI, age, sex, duration of hypertension, SBP, DBP, and heart rate, showed that patients with both diabetes and hypertension exhibited an increased E/e' ratio, and decreased LV GCS, LV GAS, and LV GRS compared to those without diabetes. Furthermore, multivariable analysis indicated that diabetes may influence LV GAS and GRS in hypertensive patients. Assessment after 12 months revealed a deterioration in cardiac indices (LV GCS and GRS) in hypertensive patients.
The defining features of structural and functional cardiac impairment in individuals with hypertension
Recent studies have utilized two-dimensional speckle tracking echocardiography to assess various components of myocardial deformation in hypertensive patients. This technique has highlighted longitudinal strain as the initial component of systolic deformation to be altered in untreated hypertensive patients (15). These changes are particularly noticeable in the presence of LV hypertrophy (16). The modification in longitudinal strain in hypertensive patients has been linked to LV diastolic abnormalities, potentially attributed to variations in collagen turnover and the emergence of myocardial fibrosis (17). Technological advancements in 3D-STI have led to the development of software that tracks speckle motion regardless of direction, enabling a homogeneous spatial distribution of all three components of the myocardial displacement vector (10). This innovative approach confirms the increase in LV mass detectable by standard echocardiography and enables reliable detection of early myocardial deformation abnormalities (7). Specifically, these abnormalities involve GLS, GRS, and GAS, even in hypertensive patients without LV hypertrophy, exhibiting only minor changes in LV geometry and normal ejection fraction (7). However, the reduction in LV GCS presents a discrepancy. Previous studies have shown that in hypertensive patients, GLS is impaired while GCS remains preserved or compensatorily improved (7, 18). Hypertension can lead to left ventricular hypertrophy and interstitial fibrosis, resulting in longitudinal functional impairment represented by GLS (19–21). However, our findings suggest a more comprehensive impairment of myocardial function, with both GLS and GCS deteriorating concurrently. This phenomenon could be attributed to several underlying mechanisms. First, the progressive hypertrophic and fibrotic remodeling of the left ventricle associated with chronic hypertension may directly compromise both longitudinal and circumferential myocardial contractility, resulting in a concurrent decline in both strain parameters (22–24). Second, prolonged or poorly controlled hypertension may overwhelm the heart's compensatory mechanisms, particularly in patients with advanced or long-standing disease, where the expected compensatory enhancement of GCS fails to occur (25–27). Nevertheless, prior studies did not utilize 3D-STI to conduct stratified analyses to ascertain if the associations of diabetes with changes in LV structure and function are independent of hypertension.
The structural and functional alterations of the LV in individuals with co-occurring diabetes and hypertension
Around half of patients with hypertension experience insulin resistance, a disturbance in insulin metabolism increasingly linked to hypertension and related cardiovascular diseases (4). Recent analysis of data by Yang et al. demonstrated that individuals diagnosed with both hypertension and diabetes face a higher risk of cardiovascular disease events compared to those with hypertension alone (18). The cardiomyopathy associated with T2DM and hypertension is characterized by pathological changes in the left ventricular myocardium, initially manifesting as diastolic dysfunction with preserved systolic function (4, 28, 29). With disease progression, there is a risk of developing left ventricular systolic dysfunction, which can lead to heart failure with reduced ejection fraction and, in severe cases, mortality (30). A study utilizing cardiac magnetic resonance (CMR) tissue tracking revealed that in patients with hypertension and coexisting T2DM, global and regional strains of the right ventricle were reduced compared to those without diabetes. This suggests that the presence of T2DM exacerbates right ventricular systolic dysfunction in hypertensive patients (18).
Herein, we found that hypertensive patients with diabetes exhibited significantly elevated cardiac functional indices, including the E/e' ratio. Previous research has demonstrated that in individuals with type 2 diabetes, the E/e' ratio provides independent and incremental prognostic information for predicting cardiovascular morbidity and mortality (31). Therefore, the increased E/e' ratio can serve as a valuable indicator of elevated LV filling pressure in diabetes, providing insights into the severity of diastolic dysfunction or heart failure, and potentially indicating the presence of diabetic cardiomyopathy (32). After accounting for other risk factors, diabetes was identified as an independent factor contributing to decreased LV GAS and GRS in hypertensive patients. These findings suggest that the coexistence of diabetes may exacerbate the reduction in LV global strain and the progression of LV remodeling in hypertensive patients. Prior studies have indicated that LV remodeling in hypertension is characterized by distinct cardiac changes, including progressive LV hypertrophy, fibrosis, and myocardial edema, which typically precede diastolic LV dysfunction and are associated with a poorer prognosis (33–37). The deterioration of LV booster strain in individuals with diabetes may result from a combination of more severe metabolic abnormalities, neurohumoral influences, and an increased inflammatory response and immune cell trafficking, all of which contribute to myocardial fibrosis (18, 38–42). Our study provides new insights into the altered LV strain patterns in this population.
Furthermore, our study found that hypertensive patients with diabetes exhibit a significant reduction in LV GRS, while GLS remains largely unchanged, indicating a differential impact of diabetes on myocardial function. The reduction in GRS suggests that diabetes significantly impairs the radial thickening of the myocardium, likely due to metabolic and structural changes such as fibrosis or microvascular damage, which compromise overall myocardial contractility (43–47). Conversely, the stable GLS implies that the longitudinal function of subendocardial fibers may be less affected or more resilient to the combined effects of hypertension and diabetes, potentially due to the preservation of subendocardial fiber function until more advanced myocardial damage occurs (48, 49). This highlights the importance of GRS as a more sensitive marker for detecting myocardial impairment in diabetic hypertensive patients, suggesting that multiple strain parameters should be used for a comprehensive assessment of myocardial function in this population.
Another important and novel finding of this study is the evidence of impaired GAS in patients with hypertension and coexisting T2DM. GAS, derived from 3D-STI, represents the percentage change in myocardial dimensions from their original size, enabling a relatively operator-independent, quantitative assessment of both global and regional LV function (7). Regional strain has been shown to outperform visual assessments in detecting regional wall motion abnormalities and correlates strongly with ejection fraction and the wall motion score index (50–52). Furthermore, GAS can identify mechanical dyssynchrony and respond to cardiac resynchronization therapy (53). A reduction in GAS may be associated with LV remodeling, a common occurrence in patients with hypertension and diabetes, contributing to a decline in overall cardiac function. Importantly, a decrease in GAS can serve as an early marker of subclinical LV dysfunction. In the absence of overt clinical symptoms, changes in GAS can facilitate the early detection of potential myocardial damage, providing an opportunity for timely clinical intervention.
In our study of hypertensive patients, those with concurrent diabetes exhibited decreased LV global strains. Diabetes was found to independently contribute to the reduction in LV GAS and GRS, indicating that T2DM exacerbates the decrease in LV strains in hypertensive patients. These findings underscore the significance of managing blood glucose levels in individuals with hypertension, as diabetes emerges as a significant predictor of alterations in cardiac structure and function.
Strengths and limitations
The study's primary strengths lie in its utilization of novel echocardiographic modalities to characterize LV function and accurately assess changes in LV mass. Additionally, the longitudinal cardiac monitoring of patients with concurrent hypertension and diabetes, employing linear mixed models to track cardiac remodeling at baseline and after 12 months, enhances the stud's robustness and ability to capture dynamic changes over time.
This study has several limitations. Firstly, due to the relatively small sample size and potential selection bias, the generalizability of our findings may be limited. Future multicenter studies with larger and more diverse samples are needed to validate our results and improve their applicability. Secondly, the impact of hypertension on left atrial structure and function was not assessed, preventing the evaluation of potential increases in left ventricular preload and its effects on LV function, which requires further investigation. Thirdly, we did not account for the differences in glycemic control among diabetic patients, specifically regarding the quality of glycemic control (i.e., HbA1c levels). Although diabetes status was considered, the varying levels of HbA1c may have influenced the left ventricular strain values and clinical outcomes, as suggested by previous studies (54). The lack of a more detailed analysis of HbA1c levels and its correlation with cardiovascular outcomes in this population limits the comprehensiveness of our findings. We recommend future studies include a finer stratification of HbA1c levels to better understand the role of glycemic control in heart failure patients with comorbidities. Additionally, while we adjusted for the use of hypoglycemic treatments, differences in the effects of various treatments (e.g., insulin vs. oral medications) on HbA1c and cardiovascular outcomes were not considered in our analysis, which could be another confounding factor. Fourthly, the study did not account for the age difference between the hypertensive patient group and the healthy control group. Lastly, the lack of animal studies and the investigation of relevant pathological mechanisms in future research is another limitation that should be addressed to improve our understanding of the underlying mechanisms of hypertension-related left ventricular dysfunction.
Statements
Data availability statement
The datasets presented in this article will be made available by the authors without undue reservation. Any further enquiries can be directed to yangqm222@163.com.
Ethics statement
The studies involving humans were approved by Ethics Committee of Shanxi Bethune Hospital approved the study (SBQLL-2024-140). The studies were conducted in accordance with the local legislation and institutional requirements. The participants provided their written informed consent to participate in this study.
Author contributions
YQ: Conceptualization, Data curation, Formal Analysis, Methodology, Project administration, Supervision, Writing – original draft, Writing – review & editing. CX: Data curation, Formal Analysis, Methodology, Writing – original draft, Writing – review & editing. FJ: Data curation, Formal Analysis, Methodology, Writing – original draft, Writing – review & editing.
Funding
The author(s) declare that no financial support was received for the research, authorship, and/or publication of this article.
Acknowledgments
We would like to thank all those who helped with this study.
Conflict of interest
The authors declare that the research was conducted in the absence of any commercial or financial relationships that could be construed as a potential conflict of interest.
Publisher’s note
All claims expressed in this article are solely those of the authors and do not necessarily represent those of their affiliated organizations, or those of the publisher, the editors and the reviewers. Any product that may be evaluated in this article, or claim that may be made by its manufacturer, is not guaranteed or endorsed by the publisher.
Abbreviations
LV, left ventricular; T2DM, type 2 diabetes mellitus; 3D-STI, three-dimensional speckle-tracking imaging; LVEF, left ventricle ejection fraction; LVMi, LV mass index; GLS, global longitudinal strain; GCS, global circumferential strain; GAS, global area strain; GRS, global radial strain; CVD, cardiovascular disease; 2D, two-dimensional; IVSd, interventricular septal thickness; LVM, LV mass; LVMi, LV mass index; RV, right ventricle; CMR, cardiac magnetic resonance; PSM, propensity-score matching.
References
1.
Wu W Chen G Wu K Zheng H Chen Y Wang X et al Cumulative exposure to high remnant-cholesterol concentrations increases the risk of cardiovascular disease in patients with hypertension: a prospective cohort study. Cardiovasc Diabetol. (2023) 22(1):258. (Eng). 10.1186/s12933-023-01984-4
2.
Ruthirakuhan M Swardfager W Xiong L MacIntosh BJ Rabin JS Lanctôt KL et al Investigating the impact of hypertension with and without diabetes on Alzheimer’s disease risk: a clinico-pathological study. Alzheimers Dement. (2024) 20(4):2766–78. (Eng). 10.1002/alz.13717
3.
Lin CH Wei JN Fan KC Fang CT Wu WC Yang CY et al Different cutoffs of hypertension, risk of incident diabetes and progression of insulin resistance: a prospective cohort study. J Formos Med Assoc. (2022) 121(1 Pt 1):193–201. (Eng). 10.1016/j.jfma.2021.02.022
4.
Shi R Jiang YN Qian WL Guo YK Gao Y Shen LT et al Assessment of left atrioventricular coupling and left atrial function impairment in diabetes with and without hypertension using CMR feature tracking. Cardiovasc Diabetol. (2023) 22(1):295. (Eng). 10.1186/s12933-023-01997-z
5.
Soeding P Steel A Wong J Hoy G . Left ventricular hypertrophy in beach chair surgery-an echocardiography study of athletes and hypertensive patients. J Am Soc Echocardiogr. (2020) 33(6):772–5. (Eng). 10.1016/j.echo.2020.01.004
6.
Koehler F Koehler J Bramlage P Vettorazzi E Wegscheider K Lezius S et al Impact of telemedical management on hospitalization and mortality in heart failure patients with diabetes: a post-hoc subgroup analysis of the TIM-HF2 trial. Cardiovasc Diabetol. (2024) 23(1):198. (Eng). 10.1186/s12933-024-02285-0
7.
Galderisi M Esposito R Schiano-Lomoriello V Santoro A Ippolito R Schiattarella P et al Correlates of global area strain in native hypertensive patients: a three-dimensional speckle-tracking echocardiography study. Eur Heart J Cardiovasc Imaging. (2012) 13(9):730–8. (Eng). 10.1093/ehjci/jes026
8.
Chen M Chen X Huang H Wei Y Wang L Huang X . Left ventricular function in patients on maintenance hemodialysis: a three-dimensional speckle-tracking imaging study. Cardiorenal Med. (2023) 13(1):248–58. (Eng). 10.1159/000531711
9.
Company Calabuig AM Nunez E Georgiopoulos G Nicolaides KH Charakida M De Paco Matallana C . Three-dimensional echocardiography and strain cardiac imaging in women with pre-eclampsia with follow-up to 6 months postpartum. Ultrasound Obstet Gynecol. (2023) 62(6):852–9. (Eng). 10.1002/uog.27442
10.
Azzam M Wasef M Khalaf H Al-Habbaa A . 3D-based strain analysis and cardiotoxicity detection in cancer patients received chemotherapy. BMC cancer. (2023) 23(1):760. (Eng). 10.1186/s12885-023-11261-y
11.
Elias P Lapointe A Wintermark P Moore SS Villegas Martinez D Simoneau J et al Left ventricular function and dimensions are altered early in infants developing brain injury in the setting of neonatal encephalopathy. J Pediatr. (2023) 261:113585. (Eng). 10.1016/j.jpeds.2023.113585
12.
Nemes A . Speckle-tracking echocardiography-derived left ventricular global longitudinal strain - 2D, 3D, manual or automated?Int J Cardiol. (2024) 406:132096. (Eng). 10.1016/j.ijcard.2024.132096
13.
Lembo M Manzi MV Mancusi C Morisco C Rao MAE Cuocolo A et al Advanced imaging tools for evaluating cardiac morphological and functional impairment in hypertensive disease. J Hypertens. (2022) 40(1):4–14. (Eng). 10.1097/HJH.0000000000002967
14.
Liu S Wang Y Li J Li G Kong F Mu L et al Incremental value of three-dimensional speckle-tracking echocardiography for evaluating left ventricular systolic function in patients with coronary slow flow. Curr Probl Cardiol. (2022) 47(9):100928. (Eng). 10.1016/j.cpcardiol.2021.100928
15.
Galderisi M Lomoriello VS Santoro A Esposito R Olibet M Raia R et al Differences of myocardial systolic deformation and correlates of diastolic function in competitive rowers and young hypertensives: a speckle-tracking echocardiography study. J Am Soc Echocardiogr. (2010) 23(11):1190–8. (Eng). 10.1016/j.echo.2010.07.010
16.
Kouzu H Yuda S Muranaka A Doi T Yamamoto H Shimoshige S et al Left ventricular hypertrophy causes different changes in longitudinal, radial, and circumferential mechanics in patients with hypertension: a two-dimensional speckle tracking study. J Am Soc Echocardiogr. (2011) 24(2):192–9. (Eng). 10.1016/j.echo.2010.10.020
17.
Kang SJ Lim HS Choi BJ Choi SY Hwang GS Yoon MH et al Longitudinal strain and torsion assessed by two-dimensional speckle tracking correlate with the serum level of tissue inhibitor of matrix metalloproteinase-1, a marker of myocardial fibrosis, in patients with hypertension. J Am Soc Echocardiogr. (2008) 21(8):907–11. (Eng). 10.1016/j.echo.2008.01.015
18.
Li XM Yan WF Jiang L Shi K Ren Y Han PL et al Impact of T2DM on right ventricular systolic dysfunction and interventricular interactions in patients with essential hypertension: evaluation using CMR tissue tracking. Cardiovasc Diabetol. (2022) 21(1):238. (Eng). 10.1186/s12933-022-01678-3
19.
Mannina C Jin Z Russo C Homma S Elkind MS Rundek T et al Effect of hypertension and diabetes on subclinical left ventricular systolic dysfunction in a predominantly elderly population-based cohort. Eur J Prev Cardiol. (2020) 27(19):2173–5. (Eng). 10.1177/2047487319872571
20.
Zhang G Shi K Yan WF Li XM Li Y Guo YK et al Effects of diabetes mellitus on left ventricular function and remodeling in hypertensive patients with heart failure with reduced ejection fraction: assessment with 3.0 T MRI feature tracking. Cardiovasc Diabetol. (2022) 21(1):69. (Eng). 10.1186/s12933-022-01504-w
21.
Camici PG Tschöpe C Di Carli MF Rimoldi O Van Linthout S . Coronary microvascular dysfunction in hypertrophy and heart failure. Cardiovasc Res. (2020) 116(4):806–16. (Eng). 10.1093/cvr/cvaa023
22.
Zhao K Zhu Y Chen X Yang S Yan W Yang K et al Machine learning in hypertrophic cardiomyopathy: nonlinear model from clinical and CMR features predicting cardiovascular events. JACC Cardiovasc Imaging. (2024) 17(8):880–93. (Eng). 10.1016/j.jcmg.2024.04.013
23.
Yang Z Zhang TY Gui FD Yao FY Long YT Wen M et al Hypertension and its association to phenotype on left ventricular function in hypertrophic cardiomyopathy patients assessed by cardiovascular magnetic resonance imaging. Clin Radiol. (2024) 79(12):941–9. (Eng). 10.1016/j.crad.2024.08.028
24.
Tadic M Filipovic T Suzic J Majstorovic A Pencic B Vukomanovic V et al The predictive value of global longitudinal and circumferential strains in hypertensive patients: 10-year follow-up. J Clin Med. (2024) 13(19). (Eng). 10.3390/jcm13195799
25.
Zhang G Shi R Li XM Yan WF Xu HY Li Y et al Impact of diabetes mellitus on right ventricular dysfunction and ventricular interdependence in hypertensive patients with heart failure with reduced ejection fraction assessed via 3.0 T cardiac MRI. Cardiovasc Diabetol. (2024) 23(1):375. (Eng). 10.1186/s12933-024-02472-z
26.
Chadalavada S Fung K Rauseo E Lee AM Khanji MY Amir-Khalili A et al Myocardial strain measured by cardiac magnetic resonance predicts cardiovascular morbidity and death. J Am Coll Cardiol. (2024) 84(7):648–59. (Eng). 10.1016/j.jacc.2024.05.050
27.
Yu SQ Shi K Li Y Wang J Gao Y Shi R et al The impact of diabetes mellitus on cardiac function assessed by magnetic resonance imaging in patients with hypertrophic cardiomyopathy. Cardiovasc Diabetol. (2024) 23(1):293. (Eng). 10.1186/s12933-024-02384-y
28.
Ji H Ebinger JE Kwan AC Reue K Sullivan JC Shyy J et al Early-onset hypertension and sex-specific residual risk for cardiovascular disease in type 2 diabetes. Diabetes Care. (2024) 47(6):1028–31. (Eng). 10.2337/dc23-2275
29.
Wu L Gao J Zhuang J Wu M Chen S Wang G et al Hypertension combined with atherosclerosis increases the risk of heart failure in patients with diabetes. Hypertens Res. (2024) 47(4):921–33. (Eng). 10.1038/s41440-023-01529-y
30.
Karwi QG Ho KL Pherwani S Ketema EB Sun Q Lopaschuk GD . Concurrent diabetes and heart failure: interplay and novel therapeutic approaches. Cardiovasc Res. (2022) 118(3):686–715. (Eng). 10.1093/cvr/cvab120
31.
Chen S Chen C Zheng L Cheng W Bu X Liu Z . Assessment of new-onset heart failure prediction in a diabetic population using left ventricular global strain: a prospective cohort study based on UK biobank. Front Endocrinol (Lausanne). (2024) 15:1365169. (Eng). 10.3389/fendo.2024.1365169
32.
Pua CJ Loo G Kui M Moy WL Hii AA Lee V et al Impact of diabetes on myocardial fibrosis in patients with hypertension: the REMODEL study. Circ Cardiovasc Imaging. (2023) 16(7):545–53. (Eng). 10.1161/CIRCIMAGING.123.015051
33.
Burns AT La Gerche A Prior DL MacIsaac AI . Reduced and delayed untwisting of the left ventricle in patients with hypertension and left ventricular hypertrophy: a study using two-dimensional speckle tracking imaging. Eur Heart J. (2008) 29(6):825. author reply 825–6. (Eng). 10.1093/eurheartj/ehn004
34.
Ran H Ma XW Wan LL Ren JY Zhang JX Zhang PY et al Myocardial work measurement with functional capacity evaluation in primary systemic hypertension patients: comparison between left ventricle with and without hypertrophy. J Thorac Imaging. (2024) 39(3):137–45. (Eng). 10.1097/RTI.0000000000000690
35.
Takajo D Przybycien TS Balakrishnan PL Natarajan G Singh GK Aggarwal S . Left ventricle hypertrophy and re-modeling in children with essential hypertension: does the race matter?Cardiol Young. (2024) 34(4):906–13. (Eng). 10.1017/S1047951123003840
36.
Takeuchi M Borden WB Nakai H Nishikage T Kokumai M Nagakura T et al Reduced and delayed untwisting of the left ventricle in patients with hypertension and left ventricular hypertrophy: a study using two-dimensional speckle tracking imaging. Eur Heart J. (2007) 28(22):2756–62. (Eng). 10.1093/eurheartj/ehm440
37.
Tubek S . Selected zinc metabolism parameters and left ventricle mass in echocardiographic examination in primary arterial hypertension. Biol Trace Elem Res. (2007) 118(2):138–45. (Eng). 10.1007/s12011-007-0021-0
38.
Chen H Brunner FJ Özden C Wenzel UO Neumann JT Erley J et al Left ventricular myocardial strain responding to chronic pressure overload in patients with resistant hypertension evaluated by feature-tracking CMR. Eur Radiol. (2023) 33(9):6278–89. (Eng). 10.1007/s00330-023-09595-z
39.
Hu Y Lin L Zhang L Li Y Cui X Lu M et al Identification of circulating plasma proteins as a mediator of hypertension-driven cardiac remodeling: a mediation Mendelian randomization study. Hypertension. (2024) 81(5):1132–44. (Eng). 10.1161/HYPERTENSIONAHA.123.22504
40.
Li XM Shi R Shen MT Yan WF Jiang L Min CY et al Impact of type 2 diabetes mellitus on left atrioventricular coupling and left atrial deformation in patients with essential hypertension: an MRI feature tracking study. J Magn Reson Imaging. (2025) 61(1):321–34. (Eng). 10.1002/jmri.29427
41.
Wang ZF Su LL Li S Li HZ Feng TH Xue JP et al Evaluation of right heart function changes in patients with pulmonary hypertension via two-dimensional speckle tracking imaging: a retrospective study. Ann Med. (2023) 55(2):2272711. (Eng). 10.1080/07853890.2023.2272711
42.
Yan WF Gao Y Zhang Y Guo YK Wang J Jiang L et al Impact of type 2 diabetes mellitus on left ventricular diastolic function in patients with essential hypertension: evaluation by volume-time curve of cardiac magnetic resonance. Cardiovasc Diabetol. (2021) 20(1):73. (Eng). 10.1186/s12933-021-01262-1
43.
Baumgartner H Hung J Bermejo J Chambers JB Edvardsen T Goldstein S Lancellotti P et al Recommendations on the echocardiographic assessment of aortic valve stenosis: a focused update from the European association of cardiovascular imaging and the American society of echocardiography. J Am Soc Echocardiogr. (2017) 30(4):372–92. (Eng). 10.1016/j.echo.2017.02.009
44.
Babu-Narayan SV Giannakoulas G Valente AM Li W Gatzoulis MA . Imaging of congenital heart disease in adults. Eur Heart J. (2016) 37(15):1182–95. (Eng). 10.1093/eurheartj/ehv519
45.
Sudevan R Allison M . Diabetes and cardiovascular risk - the ever evolving scenario. Eur J Prev Cardiol. (2024) zwae266. (Eng). 10.1093/eurjpc/zwae266
46.
Wang W Qiao J Zhang L Zhang J Luo J Chen C et al Prevalence of very high cardiovascular disease risk in patients with type 2 diabetes mellitus: a population-based cross-sectional screening study. Diabetes Obes Metab. (2024) 26(10):4251–60. (Eng). 10.1111/dom.15763
47.
Xu Z Liu D Zhai Y Tang Y Jiang L Li L et al Association between the oxidative balance score and all-cause and cardiovascular mortality in patients with diabetes and prediabetes. Redox Biol. (2024) 76:103327. (Eng). 10.1016/j.redox.2024.103327
48.
Mizuguchi Y Oishi Y Miyoshi H Iuchi A Nagase N Oki T . The functional role of longitudinal, circumferential, and radial myocardial deformation for regulating the early impairment of left ventricular contraction and relaxation in patients with cardiovascular risk factors: a study with two-dimensional strain imaging. J Am Soc Echocardiogr. (2008) 21(10):1138–44. (Eng). 10.1016/j.echo.2008.07.016
49.
Li T Li Z Guo S Jiang S Sun Q Wu Y et al The value of using left ventricular pressure-strain loops to evaluate myocardial work in predicting heart failure with improved ejection fraction. Int J Cardiol. (2024) 394:131366. (Eng). 10.1016/j.ijcard.2023.131366
50.
Saito K Okura H Watanabe N Hayashida A Obase K Imai K et al Comprehensive evaluation of left ventricular strain using speckle tracking echocardiography in normal adults: comparison of three-dimensional and two-dimensional approaches. J Am Soc Echocardiogr. (2009) 22(9):1025–30. (Eng). 10.1016/j.echo.2009.05.021
51.
Kleijn SA Aly MF Terwee CB van Rossum AC Kamp O . Three-dimensional speckle tracking echocardiography for automatic assessment of global and regional left ventricular function based on area strain. J Am Soc Echocardiogr. (2011) 24(3):314–21. (Eng). 10.1016/j.echo.2011.01.014
52.
Thebault C Donal E Bernard A Moreau O Schnell F Mabo P et al Real-time three-dimensional speckle tracking echocardiography: a novel technique to quantify global left ventricular mechanical dyssynchrony. Eur J Echocardiogr. (2011) 12(1):26–32. (Eng). 10.1093/ejechocard/jeq095
53.
Tatsumi K Tanaka H Tsuji T Kaneko A Ryo K Yamawaki K et al Strain dyssynchrony index determined by three-dimensional speckle area tracking can predict response to cardiac resynchronization therapy. Cardiovasc Ultrasound. (2011) 9(11). (Eng). 10.1186/1476-7120-9-11
54.
Hajdu M Knutsen MO Vértes V Vorobcsuk-Varga N Molnár G Wittmann I et al Quality of glycemic control has significant impact on myocardial mechanics in type 1 diabetes mellitus. Sci Rep. (2022) 12(1):20180. (Eng). 10.1038/s41598-022-24619-2
Summary
Keywords
hypertension, type 2 diabetes, left ventricle, train, three-dimensional speckle-tracking imaging, systolic dysfunction
Citation
Qingmei Y, Xiaoyan C and Jianxiu F (2025) The impact of type 2 diabetes on left ventricular function in hypertensive patients: a three-dimensional speckle-tracking imaging study. Front. Cardiovasc. Med. 11:1453809. doi: 10.3389/fcvm.2024.1453809
Received
24 June 2024
Accepted
31 December 2024
Published
24 January 2025
Volume
11 - 2024
Edited by
Attila Kardos, Milton Keynes University Hosptal, United Kingdom
Reviewed by
Réka Faludi, University of Pécs, Hungary
Giovanni Corrado, Valduce Hospital, Italy
Jolanta Justina Vaskelyte, Lithuanian University of Health Sciences, Lithuania
Updates
Copyright
© 2025 Qingmei, Xiaoyan and Jianxiu.
This is an open-access article distributed under the terms of the Creative Commons Attribution License (CC BY). The use, distribution or reproduction in other forums is permitted, provided the original author(s) and the copyright owner(s) are credited and that the original publication in this journal is cited, in accordance with accepted academic practice. No use, distribution or reproduction is permitted which does not comply with these terms.
* Correspondence: Yang Qingmei yangqm222@163.com
ORCID Yang Qingmei orcid.org/0009-0004-7908-4354
Disclaimer
All claims expressed in this article are solely those of the authors and do not necessarily represent those of their affiliated organizations, or those of the publisher, the editors and the reviewers. Any product that may be evaluated in this article or claim that may be made by its manufacturer is not guaranteed or endorsed by the publisher.