Abstract
Background:
Coronary artery disease is a global health concern that necessitates treatments, such as percutaneous coronary intervention (PCI) with drug-eluting stents (DES). Recent advancements in biodegradable polymer-coated DES have improved long-term outcomes by reducing neointimal hyperplasia. Superior long-term outcomes in patients with ultrathin-strut sirolimus-eluting Orsiro stent (BP-SES) compared with those with thick-strut biolimus-eluting BioMatrix stent (BP-BES) have been shown. This study aimed to explore the mechanisms underlying these differences by using quantitative coronary angiography (QCA) and optical coherence tomography (OCT).
Methods:
This sub-analysis of the BIODEGRADE trial, a prospective, randomized, multi-center study, compared BP-SES and BP-BES in patients who underwent PCI between July 2014 and September 2017. Patients with positive stress test results, ischemic symptoms, or those who consented to routine follow-up angiography were included. QCA and OCT were used to evaluate the lumen diameter, cross-sectional areas and stent apposition or coverage. OCT images were analyzed at 1 mm intervals within 5 mm proximal and distal to the stented segment.
Results:
Of the 2,341 patients, 689 underwent follow-up angiography between 18- and 36-months post-PCI, and 929 stents were analyzed via QCA. OCT images of 61 participants were available. The BP-SES group exhibited a significantly larger minimal lumen diameter and reduced late lumen loss compared to the BP-BES group (0.34 ± 0.45 mm vs. 0.42 ± 0.44 mm, P = 0.005). OCT analysis showed significantly less neointimal hyperplasia in the BP-SES group (0.04 ± 0.4 mm2 vs. 0.64 ± 0.54 mm2, P < 0.001), with no significant differences in stent strut coverage or inflammation markers, than in the BP-BES group.
Conclusions:
QCA and OCT analyses revealed less neointimal growth with BP-SES than with BP-BES, without delayed healing or increased inflammation. These findings underscore the importance of stent design characteristics and suggest that thinner struts may enhance clinical success by reducing restenosis and improving long-term vessel patency.
Clinical Trial Registration:
https://clinicaltrials.gov/study/NCT02299011 (NCT02299011).
1 Introduction
Coronary artery disease (CAD) remains a significant cause of morbidity and mortality worldwide and requires effective treatment, such as percutaneous coronary intervention (PCI) with drug-eluting stents (DES) (1, 2). The evolution of drug-eluting stent (DES) technology has enhanced long-term clinical outcomes by reducing neointimal hyperplasia (NIH), a key determinant of restenosis (3, 4). Among the various DES available, biodegradable polymer (BP)-coated DES, such as the thick-strut biolimus-eluting BioMatrix stent (BP-BES; Biosensors Inc., Newport Beach, CA) and ultrathin-strut sirolimus-eluting Orsiro stent (BP-SES; BIOTRONIK, Bulach, Switzerland) have been used as third-generation DES.
We previously reported a multicenter, randomized, open-label study comparing thick-strut BP-BES and ultrathin-strut BP-SES for CAD treatment, which provided valuable insights into the performance of these stents (5). The results of this study revealed that patients receiving ultrathin-strut BP-SES exhibited superior long-term clinical outcomes during the 36-month follow-up period than the thick strut BP-BES. This observation highlights the potential superiority of the ultrathin-strut thickness of the stent in retaining a larger vessel lumen area, similar to a previous report comparing stents with different strut thicknesses in the era of bare metal stents (6).
Given the compelling evidence suggesting a differential impact of these stents on the clinical outcomes associated with target lesion failure, further exploration and understanding of the underlying mechanisms are warranted. Therefore, this study aimed to investigate and elucidate the mechanisms contributing to the observed disparity between these stents by conducting quantitative coronary angiography (QCA) and optical coherence tomography (OCT) analyses in patients requiring PCI with DES.
2 Material and methods
2.1 Study design and participants
This study was a sub-analysis of the BIODEGRADE trial, a prospective, randomized, multi-center trial comparing the performance of the ultrathin-strut BP-SES and thick-strut BP-BES in patients who required PCI with DES implantation between July 2014 and September 2017 (5). We obtained angiography or OCT images in patients who had positive stress test results, experienced ischemic symptoms, or who consented to routine follow-up angiography between 18 and 36 months after the index PCI at the time of enrollment. QCA and OCT analyses were performed on these patients.
The study complied with the Declaration of Helsinki and was approved by the Institutional Review Board of Seoul National University Bundang Hospital (B-1403-244-002) and all participating centers. All patients provided written informed consent to participate in the trial and underwent imaging analysis using angiography or OCT before randomization.
2.2 QCA and OCT imaging and analysis
QCA examination using a conventional system (CAAS workstation 7.4, Pie Medical Imaging, The Netherlands) and OCT imaging assessments were performed using Dragonfly® image catheter and C7-XR™ OCT system (Abbott, USA) after an intra-coronary injection of nitroglycerine. From the OCT images, the cross-sectional area (CSA) of the coronary artery and stent strut apposition or coverage were evaluated using a dedicated imaging analysis program (OPTIS™ Imaging Systems software, Abbott Korea, Seoul, Korea). QCA and OCT image analysis was conducted by a single, experienced researcher from the core lab specializing in image analysis. The intraobserver variability of this researcher's analysis demonstrated an intraclass correlation coefficient (ICC) of over 0.9, indicating a very high level of reliability and also,this researcher has participated in numerous imaging studies previously conducted by our institution, ensuring reliable and consistent data (7, 8). Cross-sections at 1 mm intervals within 5 mm proximal and distal to the stented segment were analyzed. In each cross-section, lumen contours were drawn using a semi-automated detection algorithm and additional manual corrections when needed. For serial comparison, total stent length was measured post-procedure and on follow-up angiography; unchanged stent length was confirmed in all lesions. Inadequate images including noncircumferential CSA, poor quality or mismatched images, and cross sections with major side branches (diameter ≥2.0 mm) were excluded from the analysis.
In this analysis, neointimal thickness was measured as the perpendicular distance from the outer edge of the stent strut to the lumen surface, where a positive value indicated neointimal proliferation extending beyond the strut, reflecting endothelialization and tissue healing. Stent strut coverage was assessed by categorizing struts based on the neointimal thickness. Struts were considered fully covered embedded if the neointima completely enveloped the strut surface, covered protruded when more than 50% of the strut thickness was covered but not fully enveloped, uncovered when less than 50% of the strut thickness was covered with direct lumen contact, and malapposed if the struts were not in contact with the vessel wall, with a gap exceeding the expected strut thickness (Supplementary Figure S1). Coverage classification thresholds were applied based on stent type and size as follows: for Orsiro stents with ≤3.0 mm diameter (60 μm strut thickness), covered embedded struts were defined as those with a neointimal thickness ≥0 μm, covered protruded between −30 μm to 0 μm, uncovered between −60 μm to −30 μm, and malapposed at <−60 μm; for Orsiro stents >3.0 mm (80 μm strut thickness), covered embedded struts had a neointimal thickness ≥0 μm, covered protruded between −40 μm to 0 μm, uncovered between −80 μm to −40 μm, and malapposed at <−80 μm; and for BioMatrix stents (120 μm strut thickness), covered embedded struts were defined at ≥0 μm, covered protruded between −60 μm to 0 μm, uncovered between −120 μm to −60 μm, and malapposed at <−120 μm. Thrombus was identified as a signal-rich mass with high backscattering and an irregular surface protruding into the lumen, indicating possible attachment to the stent strut or vessel wall and disrupting the smooth lumen contour. Peri-strut low-intensity area (PLIA) was defined as a low-intensity, homogeneous region surrounding the stent strut without signal attenuation on OCT, suggestive of inflammation or fibrin deposition, and was distinguished from lipid-rich plaques or necrotic cores by the absence of signal drop-out and its circumferential distribution around the strut.
2.3 Statistical analysis
The baseline characteristics of the study population were summarized as frequencies and percentages for categorical variables and as means and standard deviations for continuous variables. Continuous variables were compared between treatment groups using the two-sample t-test or Mann–Whitney U-test, depending on whether the data followed a normal distribution. The distributions of categorical variables were analyzed with the chi-squared (χ2) test. An empirical cumulative distribution function was estimated to represent the proportion of neointimal growth that was less than or equal to each value. To account for repeated measures within patients and potential covariates, generalized estimating equations was applied to determine the magnitude and statistical significance of the difference in neointimal growth between the two stent groups. This statistical method provides robust estimates by adjusting for intra-patient variability and covariates, ensuring accurate modeling of the relationships between variables (9). Statistical significance was set at a two-sided P-value of <0.05. Statistical analyses were performed using R version 3.1.0 (R Foundation for Statistical Computing, Vienna, Austria).
3 Results
3.1 Baseline characteristics
Among the 2,341 patients in the original study, 689 patients from six participating centers underwent angiography between 18 and 36 months after the index PCI, and 929 stents were analyzed for QCA (Figure 1). The OCT images of 61 participants from the two centers were available for analysis. Table 1 presents the baseline characteristics of the study population. No significant differences were observed between the two stent groups. However, there were significant differences in several characteristics between the groups that underwent follow-up angiography and those that did not (Supplementary Table S1). The group that underwent angiography had a lower mean age (62.55 ± 10.65 vs. 63.91 ± 10.96, P = 0.006), current smokers (24.2% vs. 28.3%, P < 0.001), and patients with atrial fibrillation (2.9% vs. 3.8%, P = 0.042), and a significantly higher prevalence of dyslipidemia (60.7% vs. 49.8%, P < 0.001) and a history of previous PCI (15.5% vs. 10.7%, P = 0.001). Regarding the clinical diagnoses, the angiography group had a higher percentage of patients with silent ischemia and stable angina, and a lower proportion of patients with unstable angina. For further analysis of the OCT group compared with the QCA group that did not undergo OCT, aside from the differences in the lower proportion of patients with ST-segment-elevation myocardial infarction in the OCT group, there were no significant differences in the baseline characteristics of patients (Supplementary Table S2).
Figure 1
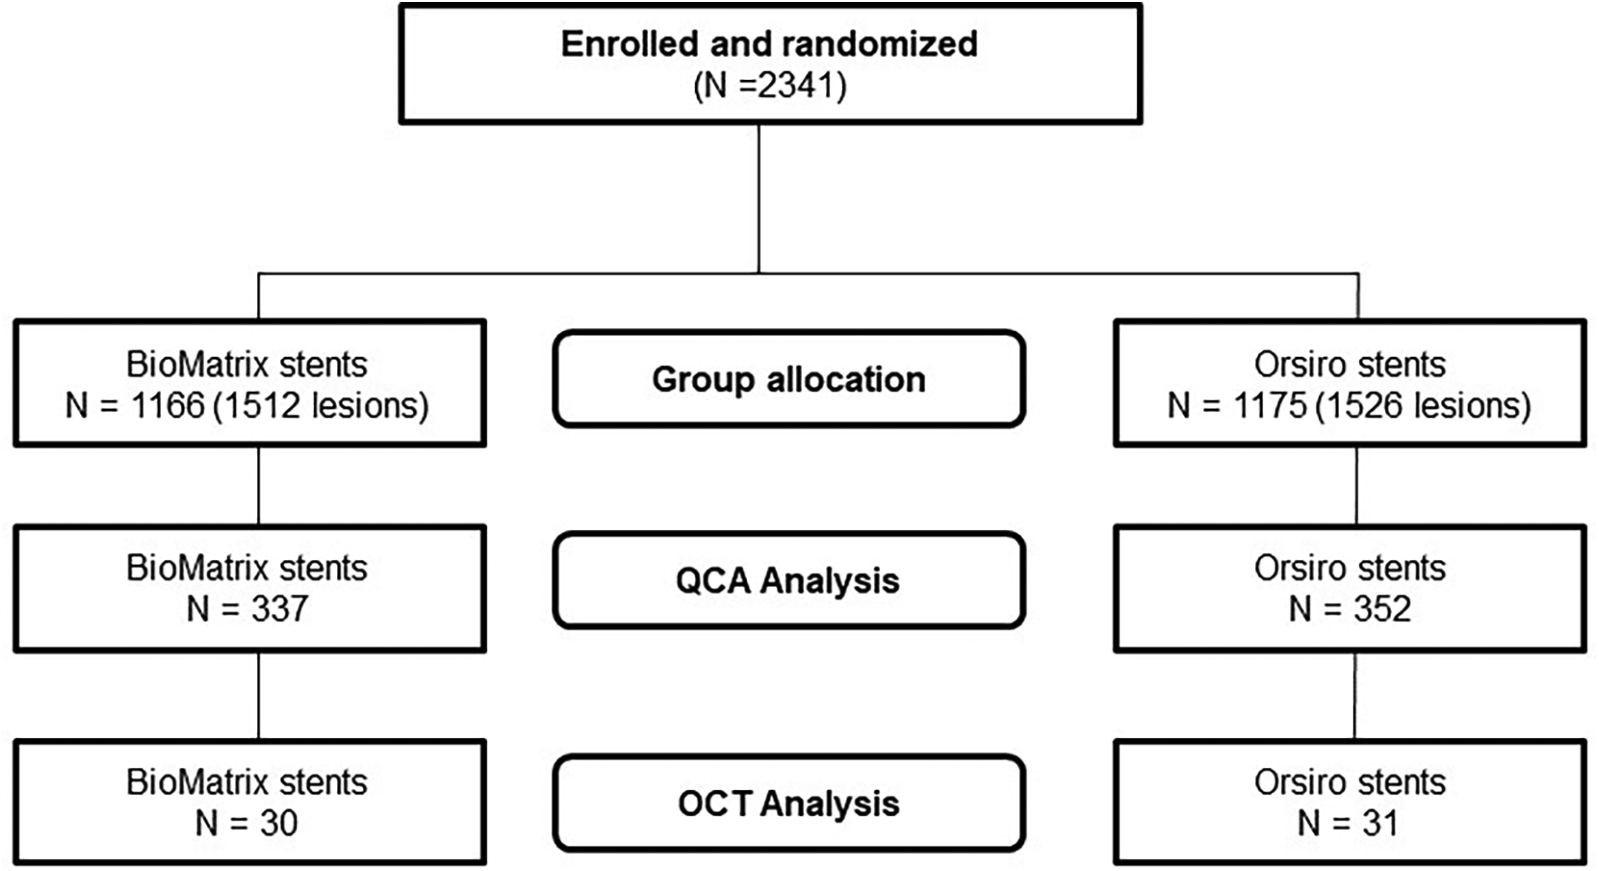
Flowchart representing the study design.
Table 1
| Variables | QCA analysis | OCT analysis | ||||
|---|---|---|---|---|---|---|
| Total (N = 689) |
Orsiro (N = 352) |
BioMatrix (N = 337) |
Total (N = 61) |
Orsiro (N = 31) |
BioMatrix (N = 30) |
|
| Age (years) | 62.55 ± 10.65 | 62.47 ± 10.77 | 62.63 ± 10.54 | 61.18 ± 10.47 | 62.71 ± 10.54 | 59.60 ± 10.32 |
| Men | 514 (74.6) | 254 (72.2) | 260 (77.2) | 43 (70.5) | 21 (67.7) | 22 (73.3) |
| Body mass index (kg/m2) | 25.3 ± 3.23 | 25.29 ± 3.22 | 25.31 ± 3.24 | 25.34 ± 2.52 | 24.82 ± 2.77 | 25.87 ± 2.15 |
| Diabetes mellitus | 218 (31.6) | 110 (31.2) | 108 (32.0) | 19 (31.1) | 11 (35.5) | 8 (26.7) |
| Arterial hypertension | 416 (60.4) | 209 (59.4) | 207 (61.4) | 39 (63.9) | 24 (77.4) | 15 (50.0) |
| Current smoker | 167 (24.2) | 84 (23.9) | 83 (24.6) | 14 (23.0) | 7 (22.6) | 7 (23.3) |
| Dyslipidemia | 418 (60.7) | 211 (59.9) | 207 (61.4) | 40 (65.6) | 20 (64.5) | 20 (66.7) |
| Previous percutaneous coronary intervention | 107 (15.5) | 54 (15.3) | 53 (15.7) | 10 (16.4) | 8 (25.8) | 2 (6.7) |
| Previous coronary artery bypass grafting | 6 (0.9) | 3 (0.9) | 3 (0.9) | 0 (0.0) | 0 (0.0) | 0 (0.0) |
| Previous myocardial infarction | 44 (6.6) | 26 (7.4) | 18 (5.3) | 5 (8.2) | 4 (12.9) | 1 (3.3) |
| Previous cerebrovascular accident | 41 (6.0) | 21 (6.0) | 20 (5.9) | 5 (8.2) | 2 (6.5) | 3 (10.0) |
| Atrial fibrillation | 20 (2.9) | 6 (1.7) | 14 (4.2) | 0 (0.0) | 0 (0.0) | 0 (0.0) |
| Clinical diagnosis for percutaneous coronary intervention | ||||||
| Silent ischemia | 56 (8.1) | 23 (6.6) | 33 (9.8) | 2 (3.3) | 0 (0.0) | 2 (6.7) |
| Stable angina | 221 (32.1) | 113 (32.2) | 108 (32.0) | 22 (36.1) | 11 (35.5) | 11 (36.7) |
| Unstable angina | 199 (28.9) | 111 (31.6) | 88 (26.1) | 17 (27.9) | 11 (35.5) | 6 (20.0) |
| Non-ST-segment-elevation myocardial infarction | 147 (21.4) | 70 (19.9) | 77 (22.8) | 20 (32.8) | 9 (29.0) | 11 (36.7) |
| ST-segment-elevation myocardial infarction | 65 (9.4) | 34 (9.7) | 31 (9.2) | 0 (0.0) | 0 (0.0) | 0 (0.0) |
| Medication at discharge | ||||||
| Aspirin | 685 (99.4) | 350 (99.4) | 335 (99.4) | 61 (100.0) | 31 (100.0) | 30 (100.0) |
| Clopidogrel | 560 (81.3) | 287 (81.5) | 273 (81.0) | 46 (75.4) | 23 (74.2) | 23 (76.7) |
| Ticagrelor | 87 (12.6) | 42 (11.9) | 45 (13.4) | 11 (18.0) | 5 (16.1) | 6 (20.0) |
| Prasugrel | 36 (5.2) | 20 (5.7) | 16 (4.7) | 4 (6.6) | 3 (9.7) | 1 (3.3) |
| Renin-angiotensin system inhibitors | 203 (29.5) | 97 (27.6) | 106 (31.5) | 12 (19.7) | 4 (12.9) | 8 (26.7) |
| Beta-blocker | 435 (63.1) | 220 (62.5) | 215 (63.8) | 35 (57.4) | 20 (64.5) | 15 (50.0) |
| Statin | 657 (95.4) | 340 (96.6) | 317 (94.1) | 60 (98.4) | 30 (96.8) | 30 (100.0) |
Baseline characteristics of the study population.
Table 2 provides information on the characteristics of the target lesions and procedures. A total of 466 lesions treated with BP-SES and 463 lesions treated with BP-BES were included in the analysis. Except for a higher prevalence of chronic total occlusion lesions in the BP-SES group, no significant differences were observed between the two groups. When comparing the lesion characteristics analyzed by QCA to those of the group that did not undergo QCA, there were several significant differences (Supplementary Table S3). The proportions of lesion type C, chronic total occlusion, bifurcation lesions, and longer lesions were higher in the QCA group than in the non-QCA group. In addition, the QCA group had a higher number of stents per patient, greater total stent length per patient, lower proportion of cases in which direct stenting was used, and lower maximal pressure during the procedure. There were also several significant differences in the lesion characteristics between the OCT and non-OCT groups (Supplementary Table S4). Target vessels were located in the left main artery (11.8% vs. 4.2%, P = 0.007) and less located in the right coronary artery (11.8% vs. 29.0%, P = 0.002). The average stent diameter was longer, and a higher maximal pressure was applied in the OCT group.
Table 2
| Variables | QCA analysis | OCT analysis | ||||
|---|---|---|---|---|---|---|
| Total (N = 929) |
Orsiro (N = 466) |
BioMatrix (N = 463) |
Total (N = 61) |
Orsiro (N = 31) |
BioMatrix (N = 30) |
|
| Target vessel location | ||||||
| Left main artery (%) | 45 (4.8) | 19 (4.1) | 26 (5.6) | 6 (9.8) | 4 (12.9) | 2 (6.7) |
| Left anterior descending (%) | 443 (47.7) | 222 (47.6) | 221 (47.7) | 49 (80.3) | 26 (83.9) | 23 (76.7) |
| Left circumflex artery (%) | 225 (24.2) | 118 (25.3) | 107 (23.1) | 8 (13.1) | 4 (12.9) | 4 (13.3) |
| Right coronary artery (%) | 256 (27.6) | 124 (26.6) | 132 (28.5) | 5 (8.2) | 2 (6.5) | 3 (10.0) |
| Lesion type | ||||||
| A | 33 (3.6) | 22 (4.7) | 11 (2.4) | 0 (0.0) | 0 (0.0) | 0 (0.0) |
| B1 | 221 (23.8) | 111 (23.8) | 110 (23.8) | 14 (230) | 7 (22.6) | 7 (23.3) |
| B2 | 253 (27.2) | 133 (28.5) | 120 (25.9) | 21 (34.4) | 13 (41.9) | 8 (26.7) |
| C | 422 (45.4) | 200 (42.9) | 222 (47.9) | 26 (42.6) | 11 (35.5) | 15 (50.0) |
| Chronic total occlusion | 69 (7.4) | 43 (9.2) | 26 (5.6) | 3 (4.9) | 1 (3.2) | 2 (6.7) |
| Bifurcation lesion | 166 (17.9) | 74 (15.9) | 92 (19.9) | 13 (21.3) | 8 (25.8) | 5 (16.7) |
| Lesion length (mm) | 22.33 ± 10.66 | 22.27 ± 10.90 | 22.40 ± 10.42 | 24.79 ± 12.88 | 25.69 ± 14.64 | 23.87 ± 10.94 |
| Direct stenting | 52 (5.6) | 25 (5.4) | 27 (5.8) | 3 (4.9) | 2 (6.5) | 1 (3.3) |
| Number of stents per patient | 1.53 ± 0.77 | 1.51 ± 0.78 | 1.54 ± 0.76 | 1.16 ± 0.45 | 1.19 ± 0.54 | 1.13 ± 0.35 |
| Number of stents per lesion | 1.13 ± 0.38 | 1.14 ± 0.39 | 1.12 ± 0.38 | 1.16 ± 0.45 | 1.19 ± 0.54 | 1.13 ± 0.35 |
| Total stent length per patient lesion | 36.89 ± 22.00 | 36.07 ± 22.35 | 37.73 ± 21.62 | 29.89 ± 14.72 | 30.94 ± 15.60 | 28.80 ± 13.94 |
| Total stent length per lesion | 27.36 ± 13.24 | 27.25 ± 13.33 | 27.46 ± 13.17 | 29.89 ± 14.72 | 30.94 ± 15.60 | 28.80 ± 13.94 |
| Sum of stent length per lesion (mm) | ||||||
| <35 | 734 (79.0) | 364 (78.1) | 370 (79.9) | 45 (73.8) | 23 (74.2) | 22 (73.3) |
| ≥35 | 195 (21.0) | 102 (21.9) | 93 (20.1) | 16 (26.2) | 8 (25.8) | 8 (26.7) |
| Average stent diameter (mm) | 3.01 ± 0.43 | 3.01 ± 0.44 | 3.00 ± 0.43 | 3.18 ± 0.39 | 3.20 ± 0.39 | 3.17 ± 0.40 |
| Minimum stent diameter per lesion (mm) | ||||||
| <3 | 391 (42.1) | 196 (42.1) | 195 (42.1) | 13 (21.3) | 6 (19.4) | 7 (23.3) |
| ≥3 | 538 (57.9) | 270 (57.9) | 268 (57.9) | 48 (78.7) | 25 (80.6) | 23 (76.7) |
| Maximal pressure (atm) | 9.72 ± 3.23 | 10.36 ± 3.07 | 9.07 ± 3.27 | 10.52 ± 3.98 | 11.19 ± 3.94 | 9.83 ± 3.97 |
| Acute gain (mm) | 2.07 ± 0.6 | 2.10 ± 0.61 | 2.04 ± 0.60 | 2.15 ± 0.58 | 2.18 ± 0.60 | 2.13 ± 0.56 |
Lesion and procedure characteristics.
3.2 Intracoronary artery image analysis
Table 3 summarizes representative follow-up QCA and OCT data. There was no difference in the minimal lumen diameter between the two groups post-PCI; however, BP-SES showed a significantly larger minimal lumen diameter than BP-BES at follow-up. As a result, the BP-SES exhibited significantly reduced late lumen loss compared to the BP-BES (0.34 ± 0.45 mm vs. 0.42 ± 0.44 mm, P = 0.005). The cumulative probability distribution of in-stent late lumen loss measured using QCA clearly showed a lower late lumen loss in the BP-SES group than in the BP-BES group (Figure 2). However, no statistically significant difference in the in-segment late lumen loss was observed between the two stent types (Table 3 and Figure 2).
Table 3
| Variables | Post | Follow-up | Post | Follow-up | Post | Follow-up |
|---|---|---|---|---|---|---|
| QCA | Orsiro (N = 466) | BioMatrix (N = 463) | P | P | ||
| In Stent | ||||||
| Minimal lumen diameter (mm) | 2.69 ± 0.56 | 2.34 ± 0.60 | 2.63 ± 0.56 | 2.21 ± 0.62 | 0.156 | 0.001 |
| Late loss (mm) | – | 0.34 ± 0.45 | 12.59 ± 8.27 | 0.42 ± 0.44 | 0.811 | 0.005 |
| Diameter stenosis (%) | 12.72 ± 8.05 | 17.77 ± 14.2 | 2.38 ± 0.61 | 20.66 ± 15.1 | 0.211 | 0.003 |
| In Segment | ||||||
| Minimal lumen diameter (mm) | 2.43 ± 0.60 | 2.18 ± 0.60 | 20.36 ± 9.07 | 2.09 ± 0.59 | 0.423 | 0.027 |
| Late loss (mm) | – | 0.25 ± 0.47 | 0.29 ± 0.44 | 0.227 | ||
| Diameter stenosis (%) | 19.90 ± 8.39 | 22.95 ± 13.95 | 23.91 ± 13.87 | 0.294 | ||
| OCT | Orsiro (N = 31) | BioMatrix (N = 30) | P | P | ||
| Mean lumen CSA (mm2) | 8.04 ± 2.25 | 7.86 ± 2.24 | 7.88 ± 2.04 | 6.75 ± 2.5 | 0.765 | 0.072 |
| Mean stent CSA (mm2) | 7.63 ± 2.14 | 7.9 ± 2.2 | 7.33 ± 1.97 | 7.39 ± 2.34 | 0.566 | 0.38 |
| Mean NIH CSA (mm2) | 0.04 ± 0.4 | 0.64 ± 0.54 | <.001 | |||
| Covered embedded (%) | 89.78 ± 16.16 | 94.83 ± 8.67 | 0.106 | |||
| Covered protruded (%) | 4.32 ± 7.17 | 3.78 ± 6.50 | 0.360 | |||
| Uncovered (%) | 3.07 ± 5.95 | 1.00 ± 2.01 | 0.056 | |||
| Malapposed (%) | 12.69 ± 8.60 | 2.83 ± 3.96 | 6.55 ± 7.27 | 0.39 ± 1.01 | <.001 | <.001 |
OCT and QCA lesion analysis.
Values are presented as n (%) or mean ± standard deviation.
OCT, optical coherence tomography; QCA, quantitative coronary analysis; CSA, cross-sectional area; NIH, neointimal hyperplasia.
Figure 2
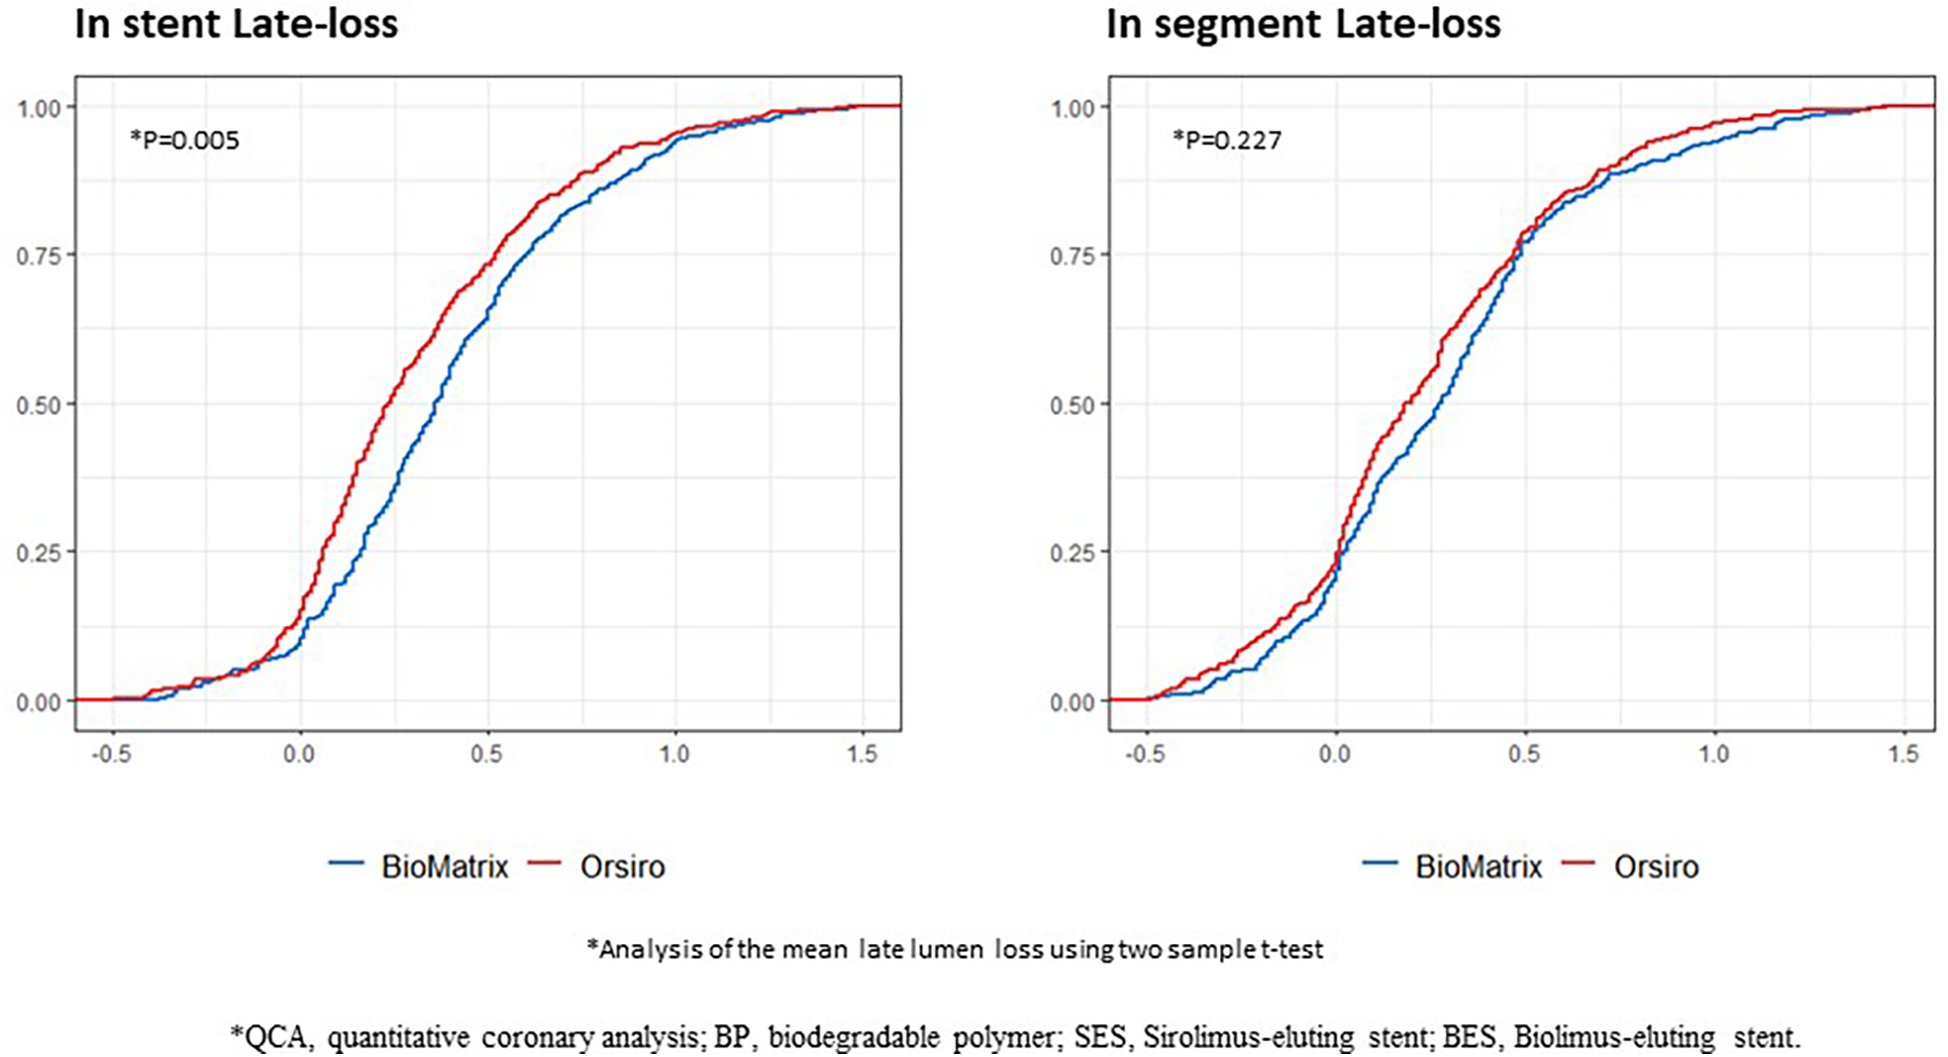
Cumulative probability distribution of the QCA results between the BP-SES and BP-BES. QCA, quantitative coronary analysis; BP, biodegradable polymer; SES, Sirolimus-eluting stent; BES, Biolimus-eluting stent; X-axis represents the area (mm2), and the Y-axis represents the rate.
In the OCT analysis, the BP-SES group tended to have a larger mean lumen area (7.86 ± 2.24 mm2 vs. 6.75 ± 2.50 mm2, P = 0.072), and significantly lower mean NIH than those in the thick-strut BP-BES group (0.04 ± 0.4 mm2 vs. 0.64 ± 0.54 mm2, P < 0.001). Figure 3 clearly illustrates the cumulative probability distribution graph showing a lower mean NIH with the BP-SES than with the BP-BES; the estimated difference between the two stent types was −0.568 mm2 (P < 0.001), indicating a statistically significant decrease in NIH with the ultrathin-strut stent. Furthermore, per-cross section analysis revealed that the mean NIH CSA was also significantly lower in the BP-SES group compared to the BP-BES group (0.04 ± 0.4 mm2 vs. 0.64 ± 0.54 mm2, P < 0.001) (Supplementary Table S5). Representative cases demonstrating changes in the neointimal coverage are shown in Figure 3.
Figure 3
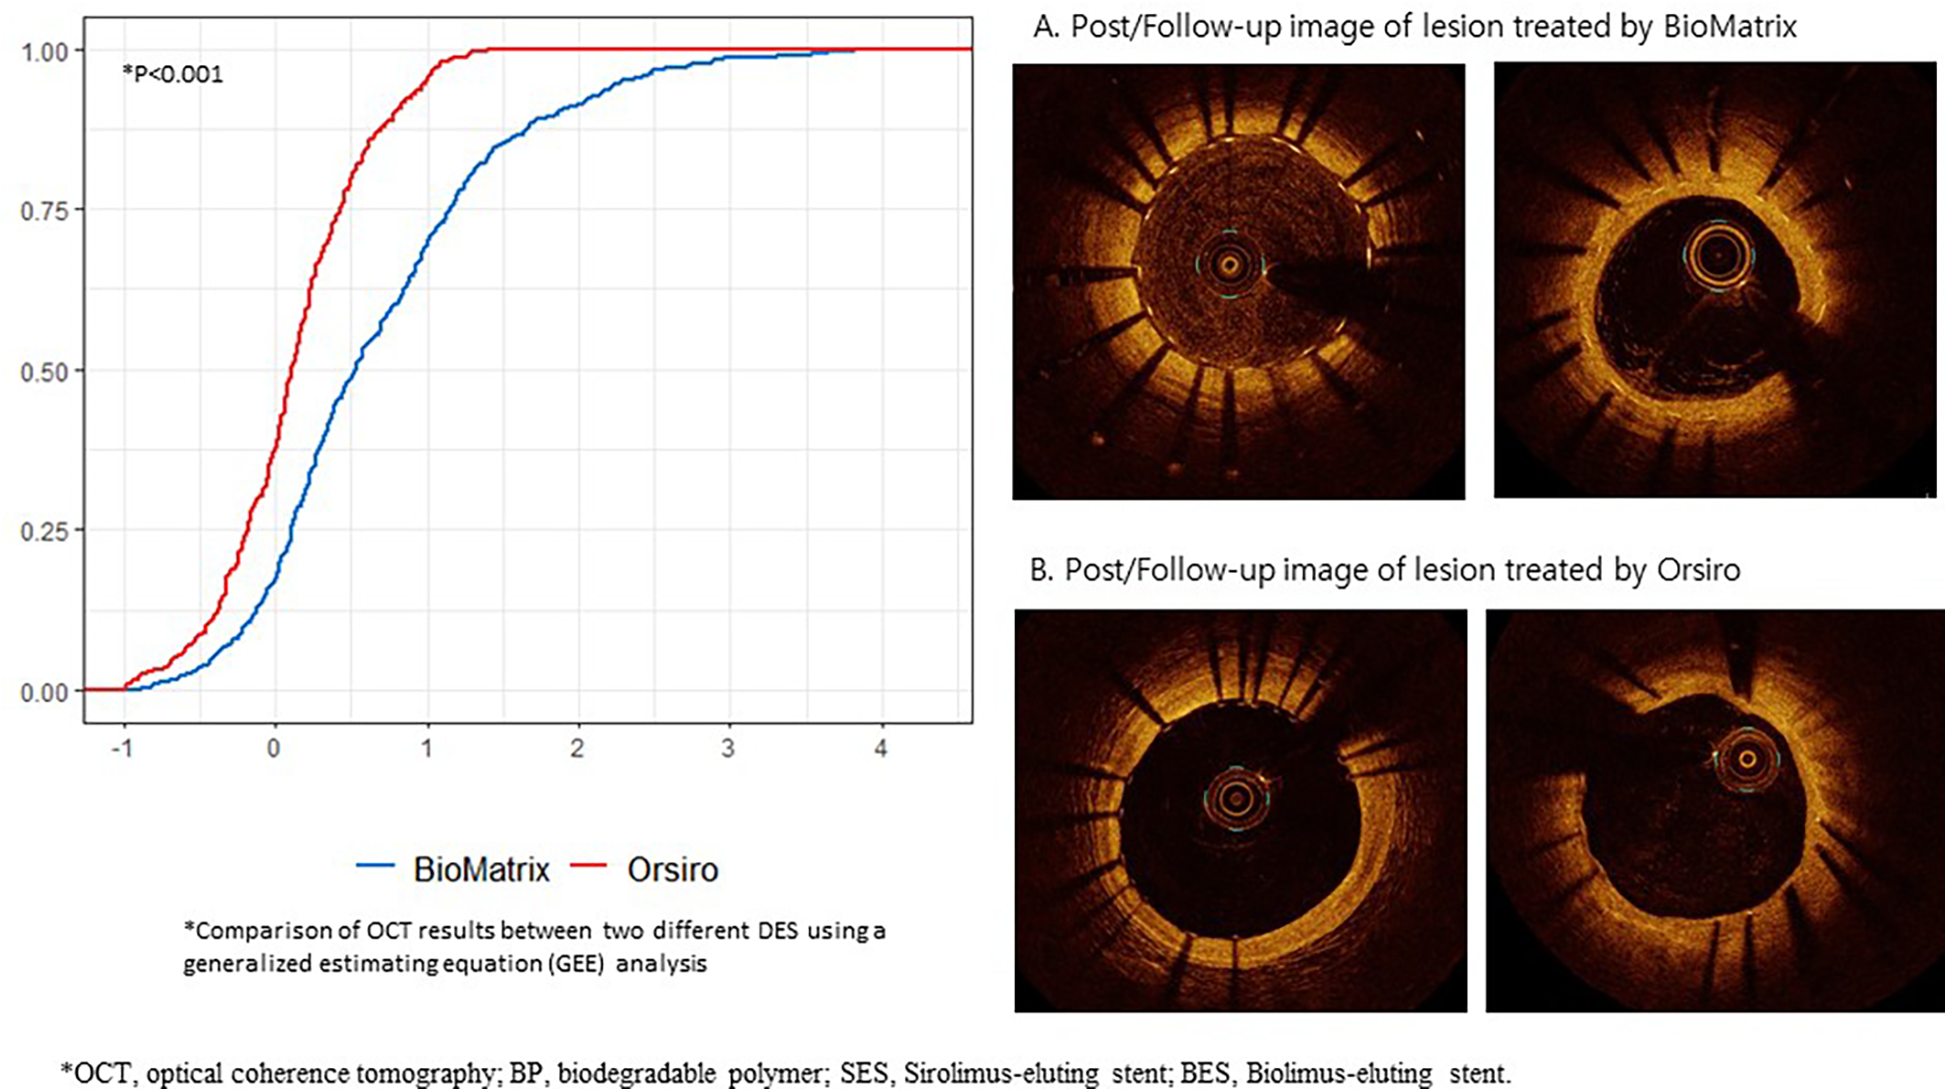
Cumulative probability distribution of the OCT results between the BP-SES and BP-BES, and their representative cases of neointimal change. OCT, optical coherence tomography; BP, biodegradable polymer; SES, Sirolimus-eluting stent; BES, Biolimus-eluting stent; X-axis represents the area (mm2), and the Y-axis represents the rate.
The analysis of strut apposition and coverage revealed that the proportion of malapposed struts was significantly higher in the BP-SES group at post-PCI and follow-up (12.69 ± 19.2% and 2.75 ± 8.64%) than the BP-BES group (6.55 ± 7.27% vs. 0.39 ± 1.01%) (P < 0.001, respectively) (Table 3). In addition, this trend persisted when analyzed at both the per-cross section and per-strut levels (Supplementary Tables S5 and S6). However, the proportion of covered embedded, covered protruded and uncovered struts was not significantly different between the BP-SES and the BP-SES group at follow-up (Table 3). At the per-cross section and per-strut level, the BP-SES group had a significantly lower number of covered embedded struts and higher uncovered struts compared to the BP-BES group (Supplementary Tables S5 and S6). We also reviewed the OCT images to compare the two stent groups in terms of subclinical stent thrombosis, presence of macrophages, and PLIA. There were no cases of PLIA, or subclinical stent thrombosis observed in either group, indicating no significant differences in delayed healing or inflammation after stenting.
3.3 Clinical outcomes
When comparing ultrathin BP-SES to thick BP-BES in the angiography follow-up group, there were no significant differences in the clinical outcomes (Table 4). However, when comparing the angiography follow-up group with the group that did not undergo follow-up (Supplementary Table S5), there was a significantly lower proportion of deaths, including all-cause, cardiac, and non-cardiac deaths. Any myocardial infarction, ischemia-driven target lesion/vessel revascularization, or any repeat revascularization was higher in the angiography follow-up group. No target lesion failure was observed in the OCT group (Supplementary Table S6).
Table 4
| Variables | Orsiro (N = 352) |
BioMatrix (N = 337) |
P (χ2 test) | Hazard ratio (95% confidence interval) | P |
|---|---|---|---|---|---|
| Target lesion failure | 11 (3.1) | 17 (5.0) | 0.279 | 0.61 (0.29–1.31) | 0.207 |
| Death | |||||
| All-cause death | 6 (1.7) | 3 (0.9) | 0.506 | 1.92 (0.48–7.66) | 0.357 |
| Cardiac death | 1 (1.1) | 2 (0.6) | 0.687 | 1.92 (0.35–10.46) | 0.453 |
| Noncardiac death | 2 (0.6) | 1 (0.3) | >0.999 | 1.92 (0.17–21.15) | 0.595 |
| Target vessel-related myocardial infarction | 2 (0.6) | 1 (0.3) | >0.999 | 1.92 (0.17–21.17) | 0.594 |
| Any myocardial infarction | 7 (2.0) | 2 (0.6) | 0.178 | 3.39 (0.70–16.31) | 0.128 |
| Ischemia-driven target lesion revascularization | 8 (2.3) | 14 (4.2) | 0.235 | 0.54 (0.23–1.29) | 0.168 |
| Ischemia-driven target vessel revascularization | 14 (4.0) | 24 (7.1) | 0.101 | 0.55 (0.29–1.07) | 0.080 |
| Any repeat revascularization | 28 (8.0) | 38 (11.3) | 0.177 | 0.70 (0.43–1.15) | 0.158 |
| Stent thrombosisa | 1 (0.3) | 0 (0.0) | >0.999 | ||
| Patient-oriented composite endpoint | 34 (9.7) | 40 (11.9) | 0.416 | 0.82 (0.52–1.29) | 0.383 |
| Bleeding | 11 (3.1) | 8 (2.4) | 0.712 | 1.33 (0.53–3.30) | 0.544 |
Clinical outcomes.
Stent thrombosis: one definite subacute stent thrombosis leading to myocardial infarction; two definite late stent thromboses causing unstable angina and myocardial infarction; one definite very late stent thrombosis leading to myocardial infarction.
4 Discussion
In this study, we aimed to investigate the intravascular characteristics of thick-strut BP-BES and ultrathin-strut BP-SES to gain insights into the differences in clinical outcomes between the two groups. BP-SES showed less neointimal growth than BP-BES, and there was no evidence of delayed healing or inflammation in either group.
Previous studies have demonstrated that ultrathin-strut DES exhibit superior clinical outcomes (5, 10, 11). However, the specific reason for this remains unclear. To address this gap, we performed QCA and intravascular imaging using OCT to obtain detailed insights into the underlying mechanisms contributing to these differences.
Our findings contribute to the understanding of the clinical superiority of ultrathin-strut BP-SES over thick-strut BP-BES. QCA allowed us to examine the differences in lumen narrowing caused by different strut thicknesses, and the OCT images further explored the nature of neointimal growth and vessel healing characteristics in a comprehensive manner. We observed significantly less NIH in the ultrathin-strut BP-SES group but no difference in vascular healing characteristics in terms of subclinical stent thrombosis, presence of macrophages, or peri-strut low-intensity area. These findings align with previous studies demonstrating the benefits of the ultrathin-strut BP-SES in reducing inflammation and neointimal growth while maintaining favorable vascular healing characteristics (12–14). Moreover, the stent strut malapposition was observed more frequently in the BP-SES group. Although previous studies have reported an association between malapposition and stent thrombosis in the first-generation DES (15, 16), no differences in clinical outcomes were observed with the ultrathin-strut Orsiro stent in this study.
To the best of our knowledge, no previous studies have presented detailed comparisons between ultrathin-strut BP-SES and thick-strut BP-BES using intravascular imaging. Our study fills this gap by providing a comprehensive analysis and quantification of the NIH. The reduced NIH observed in the ultrathin-strut group can be attributed to several factors related to its design characteristics. The unique design of Orsiro BP-SES, which combines an ultrathin cobalts-chromium platform (60 μm for ≤3.0 mm stents or 80 μm for >3.0 mm stents) with a thin passive coating of amorphous silicon carbide may reduce the disturbance of blood flow and improve endothelization (17). In addition, it contributes to minimal endothelial damage and reduces long-term inflammation at the vessel interface (18).
Our findings have several significant clinical implications. The lower neointimal growth in BP-DES suggests a potentially reduced risk of restenosis and target lesion revascularization without an increased risk of stent thrombosis (19, 20). These improved target lesion-related outcomes have important implications for long-term clinical success and patient prognosis; hence, this study has significant implications for the future development of DES, highlighting the importance of design characteristics in stent performance, wherein the thinner the stent, the better.
4.1 Limitations
Despite the limitations posed by the high cost and invasive nature of OCT, enrolling a large number of patients in this study was challenging. Performing invasive angiography in asymptomatic patients without evident clinical indications revealed further difficulties. Although the sample size was relatively small, this study is valuable because it incorporates OCT analysis, which was previously lacking in comparative studies of thick-strut vs. ultrathin-strut DES. The inclusion of QCA and OCT provides a unique perspective on the mechanisms underlying the observed differences in clinical outcomes. The scarcity of previous publications that incorporated detailed comparisons using QCA and OCT strengthened the significance of this study. In addition, there were some differences in the baseline and lesion characteristics, and several clinical outcomes between the selected angiography follow-up group and the group that did not undergo follow-up. Overall, angiography follow-up was more frequent in event-free patients. Thus, conducting an analysis between these groups could have potentially led to an underestimated result. Because the majority of follow-up angiography was conducted in agreed-upon patients, randomization was difficult to implement. In addition, the nature of the follow-up analysis, which focused on the surviving patients, inevitably led to these results.
Moreover, the selection process for follow-up examinations introduces a high probability of selection bias. Patients who consented to follow-up angiography may inherently differ in clinical or demographic characteristics from those who did not, potentially influencing the study outcomes. This selection bias could limit the generalizability of the findings and lead to an underestimation or overestimation of adverse events or clinical benefits.
Despite these challenges, it is important to note that the comparison of lesion characteristics between the stent groups was relatively balanced, even with the inclusion of patients with more anatomical challenges in the follow-up group. This suggests that the results were not biased towards a more favorable outcome for the follow-up angiography group, and the comparison was conducted as fairly as possible, given the limitations. To address these potential issues, a randomized approach with a larger sample size would be beneficial in future studies.
4.2 Conclusion
QCA and OCT showed less neointimal growth in ultrathin-strut BP-SES than in thick-strut BP-BES without any evidence of delayed healing or inflammation. These results provide insights into the clinical outcomes of BP-SES.
Statements
Data availability statement
The raw data supporting the conclusions of this article will be made available by the authors, without undue reservation.
Ethics statement
The studies involving humans were approved by Institutional Review Board of Seoul National University Bundang Hospital (B-1403-244-002). The studies were conducted in accordance with the local legislation and institutional requirements. The participants provided their written informed consent to participate in this study.
Author contributions
J-SK: Data curation, Formal analysis, Writing – original draft, Writing – review & editing. JP: Data curation, Investigation, Writing – review & editing. Si-HK: Data curation, Formal analysis, Project administration, Visualization, Writing – review & editing. Su-HK: Data curation, Formal analysis, Methodology, Validation, Visualization, Writing – review & editing. C-HY: Conceptualization, Data curation, Funding acquisition, Methodology, Project administration, Resources, Supervision, Validation, Writing – review & editing. J-WS: Project administration, Resources, Supervision, Writing – review & editing. T-JY: Project administration, Validation, Writing – review & editing. KC: Project administration, Validation, Writing – review & editing. S-HL: Project administration, Validation, Writing – review & editing. B-KH: Project administration, Supervision, Validation, Writing – review & editing. S-WR: Methodology, Project administration, Validation, Writing – review & editing. WK: Investigation, Methodology, Project administration, Validation, Writing – review & editing. I-HC: Funding acquisition, Project administration, Resources, Supervision, Validation, Writing – review & editing.
Funding
The author(s) declare financial support was received for the research, authorship, and/or publication of this article. This work was supported by grants from the Korea Medical Device Development Fund funded by the Korean Government (Ministry of Science and ICT, Ministry of Trade, Industry and Energy, Ministry of Health & Welfare, and Ministry of Food and Drug Safety; project number: 1711137971 and KMDF_RS-2020-KD000033), and by grants from BIOTRONIKS KOREA (Seoul, Republic of Korea) and DIO KOREA (Seoul, Korea).
Acknowledgments
We thank Ms. Moon Ju Kim for the data collection and statistical analyses.
Conflict of interest
The authors declare that the research was conducted in the absence of any commercial or financial relationships that could be construed as a potential conflict of interest.
Publisher’s note
All claims expressed in this article are solely those of the authors and do not necessarily represent those of their affiliated organizations, or those of the publisher, the editors and the reviewers. Any product that may be evaluated in this article, or claim that may be made by its manufacturer, is not guaranteed or endorsed by the publisher.
Supplementary material
The Supplementary Material for this article can be found online at: https://www.frontiersin.org/articles/10.3389/fcvm.2025.1491607/full#supplementary-material
Abbreviations
CAD, coronary artery disease; PCI, percutaneous coronary intervention; DES, drug-eluting stent; BP, biodegradable polymer; BES, biolimus-eluting stent; ICC, intraclass correlation coefficient; SES, sirolimus-eluting stent; QCA, quantitative coronary angiography; OCT, optical coherence tomography; CSA, cross sectional area; NIH, neointimal hyperplasia; PLIA, peri-strut low-intensity area.
References
1.
Tsao CW Aday AW Almarzooq ZI Alonso A Beaton AZ Bittencourt MS et al Heart disease and stroke statistics-2022 update: a report from the American Heart Association. Circulation. (2022) 145:e153–639. 10.1161/CIR.0000000000001052
2.
Bhatnagar P Wickramasinghe K Wilkins E Townsend N . Trends in the epidemiology of cardiovascular disease in the UK. Heart. (2016) 102:1945–52. 10.1136/heartjnl-2016-309573
3.
Moses JW Leon MB Popma JJ Fitzgerald PJ Holmes DR O’Shaughnessy C et al Sirolimus-eluting stents versus standard stents in patients with stenosis in a native coronary artery. N Engl J Med. (2003) 349:1315–23. 10.1056/NEJMoa035071
4.
de Waha A Stefanini GG King LA Byrne RA Serruys PW Kufner S et al Long-term outcomes of biodegradable polymer versus durable polymer drug-eluting stents in patients with diabetes a pooled analysis of individual patient data from 3 randomized trials. Int J Cardiol. (2013) 168:5162–6. 10.1016/j.ijcard.2013.07.263
5.
Yoon CH Kwun JS Choi YJ Park JJ Kang SH Kim SH et al Biomatrix versus Orsiro stents for coronary artery disease: a multicenter, randomized, open-label study. Circ Cardiovasc Interv. (2023) 16:e012307. 10.1161/CIRCINTERVENTIONS.122.012307
6.
Kastrati A Mehilli J Dirschinger J Dotzer F Schühlen H Neumann FJ et al Intracoronary stenting and angiographic results: strut thickness effect on restenosis outcome (ISAR-STEREO) trial. Circulation. (2001) 103:2816–21. 10.1161/01.cir.103.23.2816
7.
Hahn D Lee D Hyun W Cho Y Yoon CH Jeon KH et al Faster smooth muscle cell coverage in ultrathin-strut drug-eluting stent leads to earlier re-endothelialization. Front Bioeng Biotechnol. (2023) 11:1207858. 10.3389/fbioe.2023.1207858
8.
Yoon CH Jang J Hur SH Lee JH Han SH Hong SJ et al Osstem cardiotec centum stent versus Xience alpine stent for de novo coronary artery lesion: a multicenter, randomized, parallel-designed, single blind test. Korean Circ J. (2022) 52(5):354. 10.4070/kcj.2021.0198
9.
Liang KY Zeger SL . Longitudinal data analysis using generalized linear models. Biometrika. (1986) 73(1):13–22. 10.1093/biomet/73.1.13
10.
Kandzari DE Koolen JJ Doros G Garcia-Garcia HM Bennett J Roguin A et al Ultrathin bioresorbable-polymer sirolimus-eluting stents versus thin durable-polymer everolimus-eluting stents for coronary revascularization: 3-year outcomes from the randomized BIOFLOW V trial. JACC Cardiovasc Interv. (2020) 13:1343–53. 10.1016/j.jcin.2020.02.019
11.
Jensen LO Maeng M Raungaard B Kahlert J Ellert J Jakobsen L et al Randomized comparison of the polymer-free biolimus-coated biofreedom stent with the ultrathin strut biodegradable polymer sirolimus-eluting orsiro stent in an all-comers population treated with percutaneous coronary intervention: the SORT OUT IX trial. Circulation. (2020) 141:2052–63. 10.1161/CIRCULATIONAHA.119.040241
12.
Koppara T Joner M Bayer G Steigerwald K Diener T Wittchow E . Histopathological comparison of biodegradable polymer and permanent polymer based sirolimus eluting stents in a porcine model of coronary stent implantation. Thromb Haemostasis. (2012) 107(06):1161–71. 10.1160/th12-01-0043
13.
Otsuka F Cheng Q Yahagi K Acampado E Sheehy A Yazdani SK et al Acute thrombogenicity of a durable polymer everolimus-eluting stent relative to contemporary drug-eluting stents with biodegradable polymer coatings assessed ex vivo in a swine shunt model. КАРДИОЛОГИЯ УЗБЕКИСТАНА. (2015) 8(9):1248–60. 10.1016/j.jcin.2015.03.029
14.
Secco GG Mattesini A Fattori R Parisi R Castriota F Vercellino M et al Time-related changes in neointimal tissue coverage of a novel sirolimus eluting stent. Cardiovasc Revasc Med. (2015) 17(1):38–43. 10.1016/j.carrev.2015.12.001
15.
Cook S Wenaweser P Togni M Billinger M Morger C Seiler C et al Incomplete stent apposition and very late stent thrombosis after drug-eluting stent implantation. Circulation. (2007) 115(18):2426–34. 10.1161/circulationaha.106.658237
16.
Koskinas KC Chatzizisis YS Antoniadis AP Giannoglou GD . Role of endothelial shear stress in stent restenosis and thrombosis. J Am Coll Cardiol. (2012) 59(15):1337–49. 10.1016/j.jacc.2011.10.903
17.
Iglesias JF Roffi M Degrauwe S Secco GG Aminian A Windecker S et al Orsiro cobalt-chromium sirolimus-eluting stent: present and future perspectives. Expert Rev Med Devices. (2017) 14:773–88. 10.1080/17434440.2017.1378091
18.
Forrestal BJ Case BC Yerasi C Garcia-Garcia HM Waksman R . The Orsiro ultrathin, bioresorbable-polymer sirolimus-eluting stent: a review of current evidence. Cardiovasc Revasc Med. (2020) 21:540–8. 10.1016/j.carrev.2019.12.039
19.
Kornowski R Hong MK Tio FO Bramwell O Wu H Leon MB . In-stent restenosis: contributions of inflammatory responses and arterial injury to neointimal hyperplasia. J Am Coll Cardiol. (1998) 31:224–30. 10.1016/s0735-1097(97)00450-6
20.
Otsuka F Finn AV Yazdani SK Nakano M Kolodgie FD Virmani R . The importance of the endothelium in atherothrombosis and coronary stenting. Nat Rev Cardiol. (2012) 9:439–53. 10.1038/nrcardio.2012.64
Summary
Keywords
ultrathin-strut drug-eluting stent, quantitative coronary analysis, optical coherence tomography, percutaneous coronary intervention, coronary artery disease
Citation
Kwun J-S, Park JJ, Kang S-H, Kim S-H, Yoon C-H, Suh J-W, Youn T-J, Cha KS, Lee S-H, Hong B-K, Rha S-W, Kang WC and Chae I-H (2025) Interpreting clinical outcomes using different strut thickness in coronary artery disease: insights from vascular imaging analysis. Front. Cardiovasc. Med. 12:1491607. doi: 10.3389/fcvm.2025.1491607
Received
05 September 2024
Accepted
17 February 2025
Published
04 March 2025
Volume
12 - 2025
Edited by
Antonios Karanasos, General University Hospital of Patras, Greece
Reviewed by
Li Liang, Xuzhou Medical University, China
Tetsumin Lee, Musashino Red Cross Hospital, Japan
Updates
Copyright
© 2025 Kwun, Park, Kang, Kim, Yoon, Suh, Youn, Cha, Lee, Hong, Rha, Kang and Chae.
This is an open-access article distributed under the terms of the Creative Commons Attribution License (CC BY). The use, distribution or reproduction in other forums is permitted, provided the original author(s) and the copyright owner(s) are credited and that the original publication in this journal is cited, in accordance with accepted academic practice. No use, distribution or reproduction is permitted which does not comply with these terms.
* Correspondence: Chang-Hwan Yoon changhwanyoon@gmail.com
Disclaimer
All claims expressed in this article are solely those of the authors and do not necessarily represent those of their affiliated organizations, or those of the publisher, the editors and the reviewers. Any product that may be evaluated in this article or claim that may be made by its manufacturer is not guaranteed or endorsed by the publisher.