Abstract
Background:
Currently, heart failure has become one of the major complications in the advanced stages of various cardiovascular diseases. Numerous predictive models have been developed to estimate the mortality rate of heart failure patients; however, these models often require the measurement of multiple indicators and the inclusion of various scoring systems. Critically ill patients are often unsuitable for extensive diagnostic tests, and many primary care hospitals lack comprehensive diagnostic equipment. In contrast, blood tests are not only simpler but also reflect the overall health status of the body. Therefore, using simpler methods to predict mortality in intensive care unit (ICU) patients has become the focus of this study.
Method:
A total of 5,383 cases from the eICU database were utilized for model development, while 530 cases from the MIMIC-IV database were employed for external testing. The patients were primarily diagnosed with heart failure, and the data included demographic information, blood oxygen saturation, white blood cells, red blood cells, platelets, hemoglobin, electrolytes, lactate, glucose, and other biochemical and physiological indicators collected during the ICU stay. Enhance the accuracy of data analysis and improve the universality of the model, all data underwent rigorous preprocessing prior to training, combined with data standardization. We utilized a variety of machine learning algorithms for modeling purposes, including Logistic Regression (LR), Support Vector Machine (SVM), Decision Trees, Random Forests, Gradient Boosting Machines (GBM), XGBoost, and Neural Networks. The performance of the model was assessed through cross-validation and evaluated using the F1-score.
Conclusion:
Through feature selection, 15 key variables were ultimately identified. Among the nine machine learning models evaluated, the Multilayer Perceptron (MLP) demonstrated the best overall performance. In predicting mortality (i.e., the deceased population), the MLP achieved an F1 score of 0.54, a recall of 0.71, and a precision of 0.44. The relatively high F1 score of the MLP highlights its potential clinical application value.
Introduction
Heart failure (HF) is a significant cardiovascular condition with a high prevalence and mortality rate worldwide (1). With an aging population and the increasing prevalencerefere of heart disease, the number of heart failure patients continues to rise, positioning HF as a significant global public health concern (2, 3). Approximately 64 million individuals worldwide are currently affected by heart failure (HF), and this figure is anticipated to rise in the coming decades, particularly in low- and middle-income countries (3–5). HF imposes significant health and economic burdens on patients and their families, while also presenting a considerable challenge to healthcare systems. In the Intensive Care Unit (ICU), heart failure patients often present with more complex and critical conditions. HF is often associated with a range of comorbidities, including hypertension, coronary artery disease, chronic obstructive pulmonary disease, and chronic kidney disease (6, 7). As a result, ICU physicians must manage a vast array of clinical data, such as patient medical history, laboratory test results, imaging data, medication use, and real-time vital sign monitoring. The diversity and complexity of this data make it challenging for physicians to rapidly extract key clinical information, increasing the risk of misdiagnosis and treatment delays (8). To address this challenge, the medical field has increasingly adopted artificial intelligence (AI) and big data technologies to assist ICU physicians (9–11).
Materials and methods
Data sources and outcomes
This study presents a retrospective cohort analysis utilizing data extracted from the MIMIC-IV 3.1 and eICU databases. MIMIC-IV 3.1 is derived from data collected from patients in the Emergency Department and Intensive Care Unit (ICU) at Beth Israel Deaconess Medical Center in Boston (12). This hospital is equipped with extensive clinical resources and a comprehensive electronic medical record system, offering a large volume of real and detailed patient data. The database includes demographic data (age, gender, race, admission type, and admission source) as well as clinical data (heart rate, blood pressure, body temperature, respiratory rate) and laboratory results (complete blood count, blood biochemistry, coagulation function). It also records medical orders (medications, surgical procedures, diagnostic tests) and nursing records (fluid intake and output, such as infusion volume, urine output, and drainage volume). The eICU (2.0) database is a widely used multicenter database for critical care research, collecting clinical data from more than 200 ICUs across the United States (13). It encompasses hospitals of various regions, sizes, and types, including both teaching and community hospitals. This multicenter data source significantly enhances the diversity and representativeness of the data, making research conclusions more broadly applicable (14, 15). This study primarily aims to predict in-ICU mortality in HF patients.
Patient research and definition
Patients in the MIMIC-IV and eICU database were screened based on the following criteria: aged over 18 years, admitted to the ICU for the first time, and diagnosed with heart failure as the primary condition. Since the mortality rate of heart failure varies significantly based on comorbidities, patients with other acute conditions were excluded from this study (16).
Data collection, variable extraction, and missing value handling
Data from the two databases were extracted using SQL for 61 independent variables, including age, gender, minimum, maximum, and mean values of various biomarkers and physiological indicators (e.g., SpO2, wbc, rbc, platelet count, hemoglobin, sodium, lactate, glucose, creatinine, albumin, ALT, total bilirubin, troponin I, BNP, heart rate, respiratory rate, blood pressure, temperature, sapsii and sofa). The response variable was defined as in-hospital mortality, as it provides a direct measure of the patient's vital status during hospitalization.
The data processing strategy was as follows: Columns with more than 30% missing values were excluded from the analysis, while those with less than 30% missing data were imputed using multiple imputation (17–20).
The flowchart is presented in Figure 1.
Figure 1
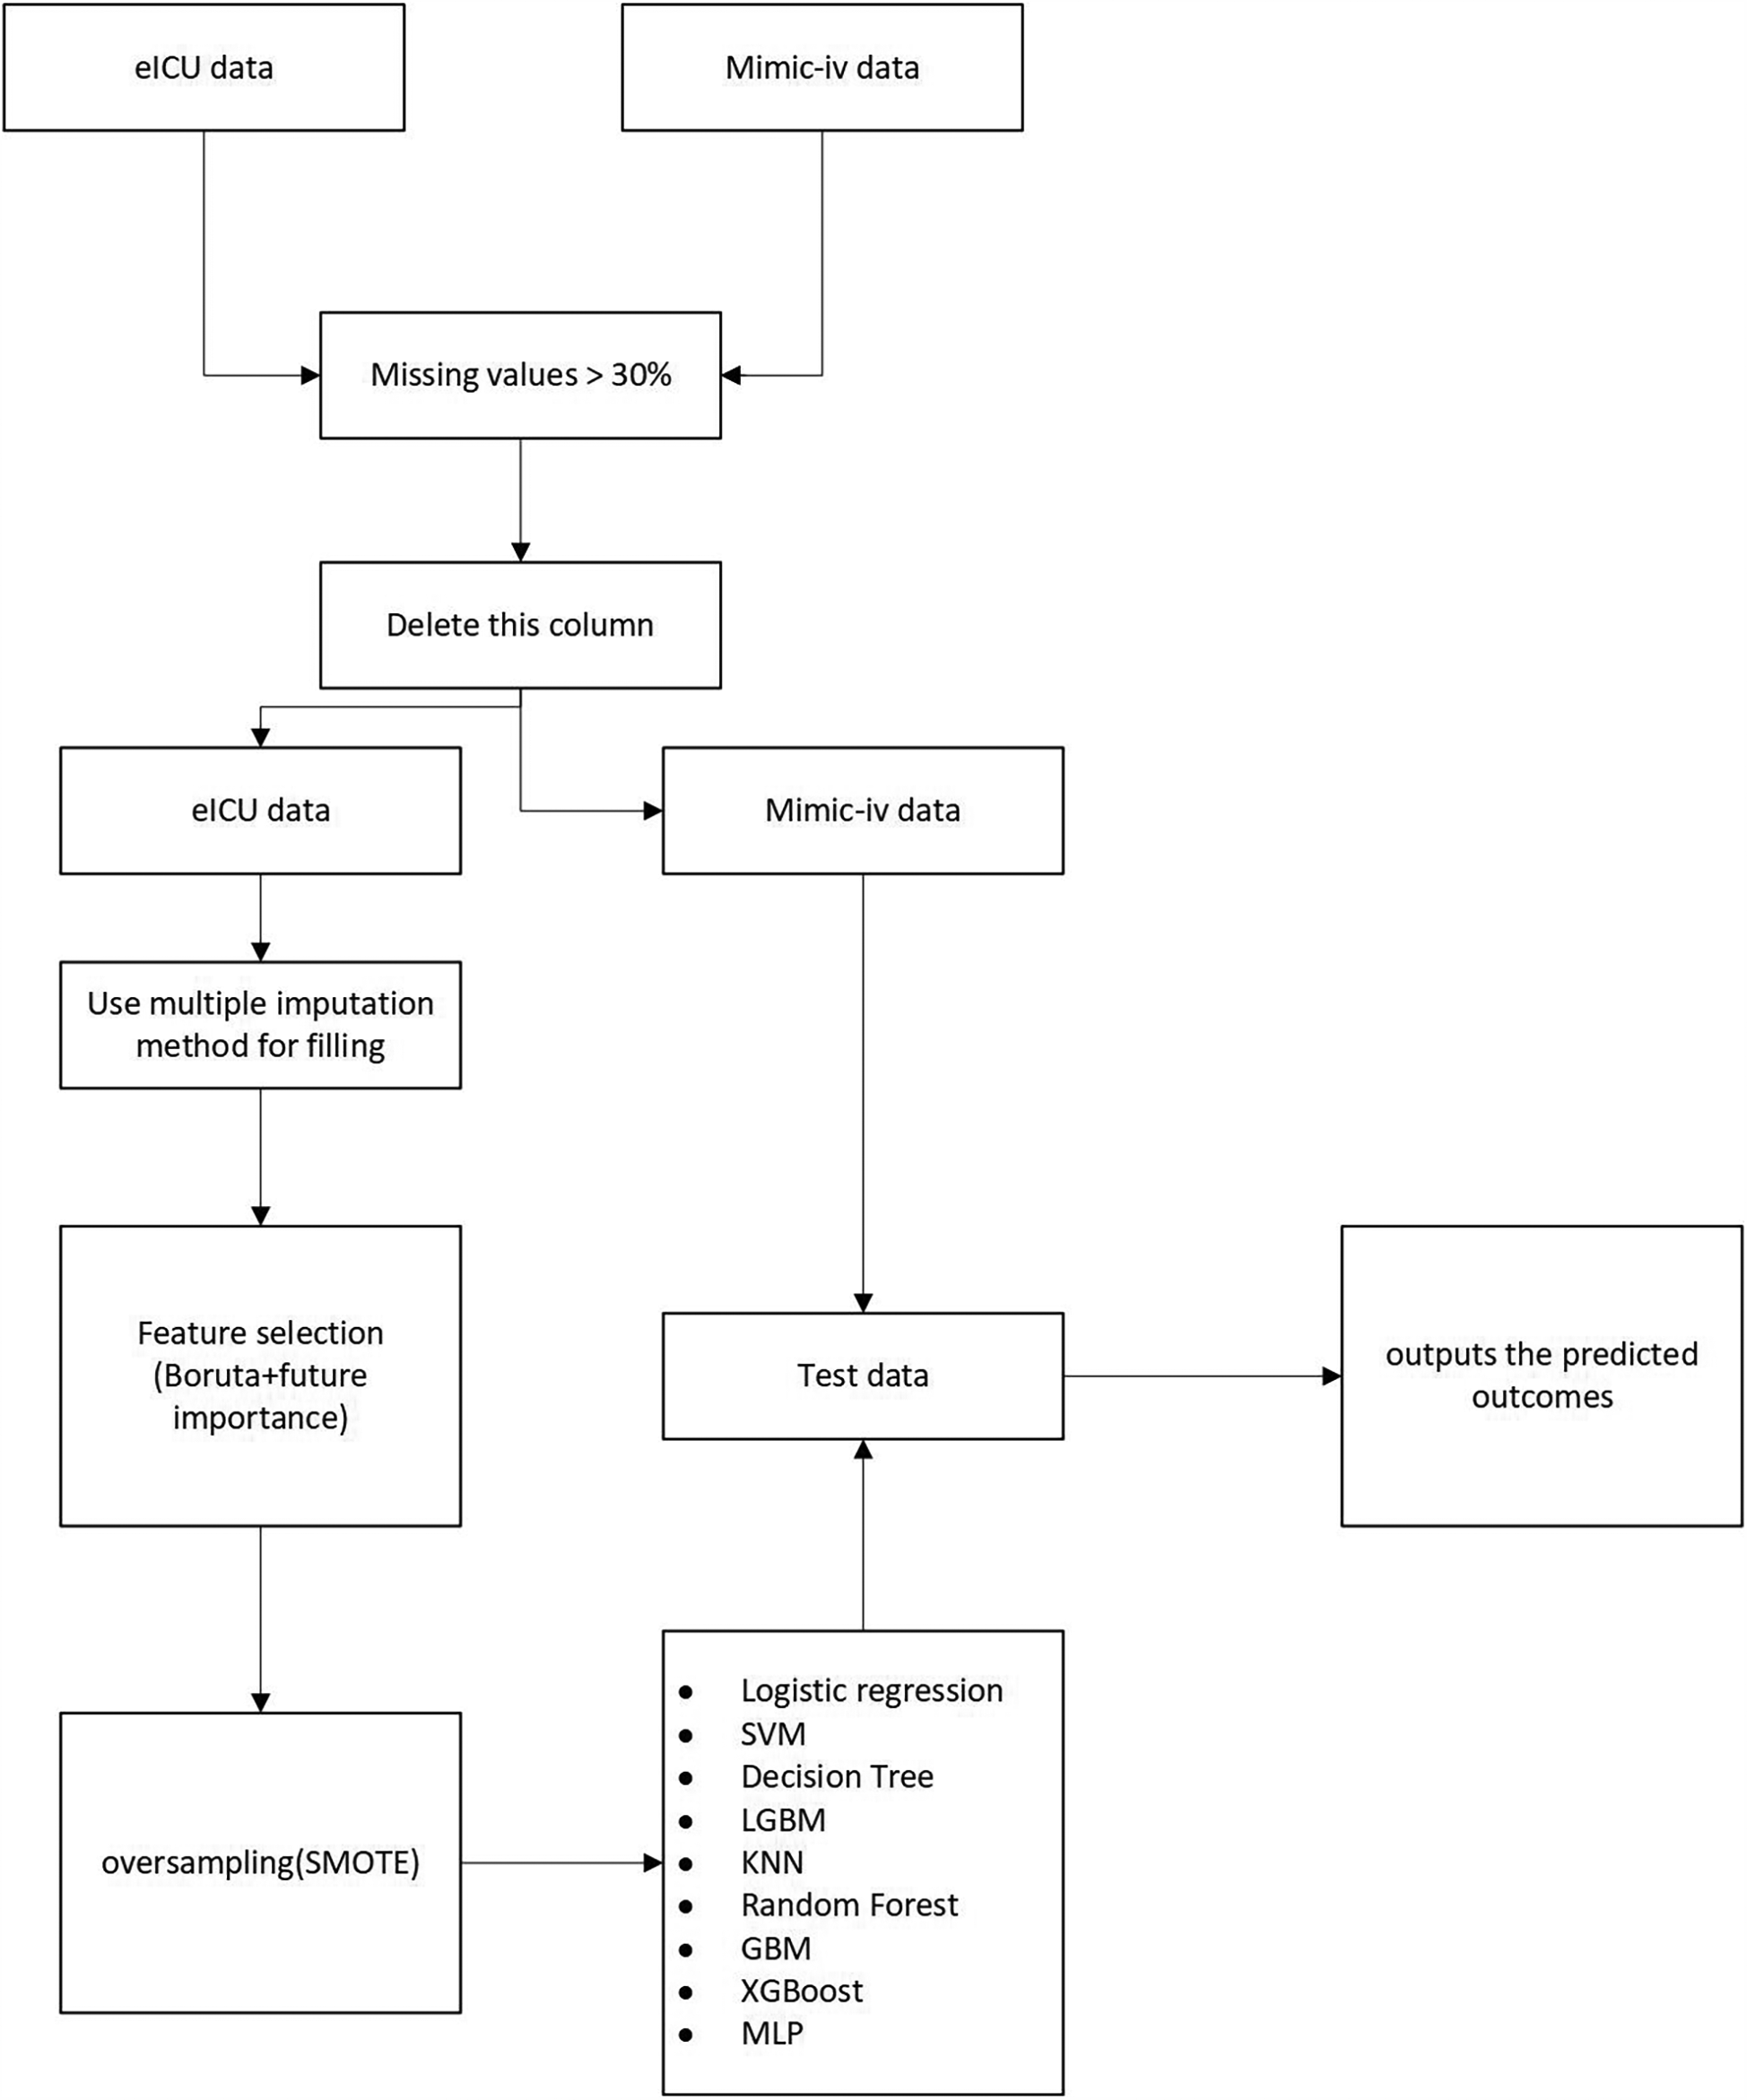
Flowchart of this research.
Machine learning model construction
Regression models (LR), Support Vector Machines (SVM), Decision Trees (DT), LightGBM (LGBM), K-Nearest Neighbors (KNN), Random Forest (RF), Gradient Boosting Machines (GBM), eXtreme Gradient Boosting (XGBoost) and Multilayer Perceptron (MLP) were employed for prediction. Random search combined with 5-fold cross-validation was employed for model development. Random search optimizes performance and accelerates the process, but it may become trapped in local optima. In contrast, grid search requires enumerating all possible combinations to obtain the theoretically optimal solution, which is computationally expensive. Therefore, the advantages of random search generally outweigh its disadvantages (21–23).
Model evaluation
The final model was evaluated using various metrics derived from the confusion matrix, including accuracy, F1-score, recall, the area under the receiver operating characteristic (ROC) curve (AUC) (24, 25). Given that model accuracy ranges from 80% to 90%, tuning efforts primarily focused on the F1-score, with an emphasis on optimizing predictive performance for the minority class. The F1-score was also used as the scoring criterion during cross-validation.
Statistical analysis
As the model was developed using the eICU dataset, patients were categorized into two groups based on their survival status during ICU hospitalization. Subsequently, the median, first quartile (Q1), and third quartile (Q3) were calculated for each variable. Categorical and continuous variables were analyzed using the chi-square test and the Wilcoxon rank-sum test, respectively. To reduce the risk of false positives due to multiple comparisons, the Benjamini-Hochberg (BH) correction method was applied (26). Model performance was evaluated using the F1-score during model development with the training dataset.
Result
Baseline characteristics and features
As shown in the Table 1, a total of 5,383 patients with a primary diagnosis of heart failure were identified from the eICU database, among whom 286 died and 5,097 survived. The figure summarizes the baseline characteristics, vital signs, laboratory parameters, and SAPS II and SOFA scores of the survival and non-survival groups. Among non-survivors, variables such as SAPS II, SOFA score, minimum SpO2, mean SpO2, minimum white blood cell (WBC) count, maximum WBC, mean WBC, minimum red blood cell (RBC) count, mean RBC, minimum platelet count, minimum hemoglobin (HGB), mean HGB, maximum anion gap, mean anion gap, minimum sodium, maximum potassium, mean potassium, minimum bicarbonate, maximum bicarbonate, mean bicarbonate, minimum calcium, mean calcium, minimum blood urea nitrogen (BUN), maximum BUN, mean BUN, maximum creatinine, mean creatinine, minimum albumin, maximum albumin, mean albumin, minimum alanine aminotransferase (ALT/SGPT), maximum ALT, mean ALT, minimum total bilirubin, maximum total bilirubin, mean total bilirubin, minimum heart rate (HR), maximum HR, mean HR, minimum respiratory rate (RR), maximum RR, mean RR, minimum systolic blood pressure (SBP), maximum SBP, mean SBP, minimum diastolic blood pressure (DBP), mean DBP, minimum temperature, and maximum temperature showed statistically significant differences compared to the survival group (p < 0.05). In contrast, variables such as sex, age, maximum SpO2, maximum RBC, mean platelet count, maximum HGB, minimum anion gap, maximum sodium, mean sodium, minimum glucose, maximum glucose, mean glucose, minimum potassium, mean chloride, maximum calcium, minimum creatinine, and mean temperature showed no statistically significant differences between the survival and non-survival groups (p > 0.05).
Table 1
| Variable | Total (n = 5,383) | Survival (n = 5,097) | Death (n = 286) | p |
|---|---|---|---|---|
| Gender, n (%) | ||||
| 0 | 2,559 (47.5) | 2,423 (47.5) | 136 (47.6) | 1 |
| 1 | 2,824 (52.5) | 2,674 (52.5) | 150 (52.4) | |
| Sapsii score, median (Q1, Q3) | 16.0 (12.0–18.0) | 16.0 (12.0–18.0) | 18.0 (15.0–22.0) | <0.001 |
| Sofa score, median (Q1, Q3) | 2.0 (1.0–3.0) | 1.0 (0.0–3.0) | 3.0 (1.0–5.0) | <0.001 |
| Age, median (Q1, Q3) | 71.0 (61.0–79.0) | 71.0 (61.0–79.0) | 74.0 (65.0–81.0) | 0.15477 |
| Min SpO2, median (Q1, Q3) | 83.0 (74.0–89.0) | 84.0 (75.0–89.0) | 59.0 (38.8–73.0) | <0.001 |
| Max SpO2, median (Q1, Q3) | 100.0 (100.0–100.0) | 100.0 (100.0–100.0) | 100.0 (100.0–100.0) | 1 |
| Mean SpO2, median (Q1, Q3) | 96.3 (94.9–97.7) | 96.4 (95.0–97.7) | 95.1 (92.7–96.7) | <0.001 |
| Min WBC, median (Q1, Q3) | 7.2 (5.6–9.3) | 7.2 (5.6–9.2) | 8.4 (6.3–10.8) | <0.001 |
| Max WBC, median (Q1, Q3) | 11.6 (8.6–15.4) | 11.5 (8.5–15.1) | 15.9 (11.7–21.9) | <0.001 |
| Mean WBC, median (Q1, Q3) | 9.3 (7.2–11.8) | 9.2 (7.2–11.6) | 12.2 (9.1–14.8) | <0.001 |
| Min RBC, median (Q1, Q3) | 3.5 (2.9–4.1) | 3.5 (3.0–4.1) | 3.2 (2.7–3.9) | <0.001 |
| Max RBC, median (Q1, Q3) | 4.0 (3.5–4.6) | 4.1 (3.5–4.6) | 3.9 (3.4–4.5) | 0.34971 |
| Mean RBC, median (Q1, Q3) | 3.7 (3.2–4.3) | 3.7 (3.2–4.3) | 3.5 (3.0–4.0) | 0.00317 |
| Min platelets, median (Q1, Q3) | 176.0 (132.0–226.2) | 177.0 (133.0–227.0) | 151.0 (103.0–208.0) | <0.001 |
| Max platelets, median (Q1, Q3) | 240.0 (186.0–307.0) | 240.0 (186.0–306.0) | 242.0 (184.0–316.0) | 1 |
| Mean platelets, median (Q1, Q3) | 205.0 (159.0–258.7) | 206.0 (159.6–259.2) | 196.2 (149.2–247.5) | 1 |
| Min HGB, median (Q1, Q3) | 10.0 (8.5–11.7) | 10.0 (8.5–11.8) | 9.2 (7.8–10.8) | <0.001 |
| Max HGB, median (Q1, Q3) | 11.7 (10.3–13.4) | 11.8 (10.3–13.5) | 11.3 (9.9–13.3) | 1 |
| Mean HGB, median (Q1, Q3) | 10.7 (9.3–12.4) | 10.7 (9.4–12.5) | 10.1 (8.9–11.8) | 0.0126 |
| Min anion gap, median (Q1, Q3) | 8.0 (6.0–11.0) | 8.0 (5.9–11.0) | 8.6 (6.0–12.0) | 0.82852 |
| Max anion gap, median (Q1, Q3) | 13.0 (10.3–16.0) | 13.0 (10.0–16.0) | 16.0 (12.0–20.0) | <0.001 |
| Mean anion gap, median (Q1, Q3) | 10.4 (8.0–13.1) | 10.3 (8.0–13.0) | 12.5 (9.0–15.3) | <0.001 |
| Min sodium, median (Q1, Q3) | 135.0 (132.0–138.0) | 135.0 (132.0–138.0) | 134.0 (130.0–137.0) | 0.00685 |
| Max sodium, median (Q1, Q3) | 141.0 (138.0–143.0) | 141.0 (138.0–143.0) | 141.0 (137.0–146.0) | 1 |
| Mean sodium, median (Q1, Q3) | 138.0 (135.2–140.4) | 138.0 (135.3–140.4) | 137.4 (134.1–140.8) | 1 |
| Min glucose, median (Q1, Q3) | 89.0 (74.0–105.0) | 89.0 (75.0–105.0) | 88.0 (68.0–111.2) | 1 |
| Max glucose, median (Q1, Q3) | 211.0 (153.0–293.0) | 210.0 (152.8–293.0) | 214.0 (162.8–293.2) | 1 |
| Mean glucose, median (Q1, Q3) | 136.4 (114.1–169.3) | 136.0 (113.7–169.2) | 141.1 (120.9–171.7) | 1 |
| Min potassium, median (Q1, Q3) | 3.6 (3.2–3.9) | 3.6 (3.2–3.9) | 3.6 (3.2–4.2) | 1 |
| Max potassium, median (Q1, Q3) | 4.7 (4.3–5.2) | 4.7 (4.3–5.2) | 5.1 (4.6–5.8) | <0.001 |
| Mean potassium, median (Q1, Q3) | 4.1 (3.8–4.4) | 4.1 (3.8–4.4) | 4.3 (3.9–4.8) | <0.001 |
| Min chloride, median (Q1, Q3) | 97.0 (93.0–101.0) | 97.0 (93.0–101.0) | 96.0 (92.0–100.0) | 1 |
| Max chloride, median (Q1, Q3) | 104.0 (100.0–107.0) | 103.0 (100.0–107.0) | 104.0 (100.0–109.0) | 1 |
| Mean chloride, median (Q1, Q3) | 100.3 (96.7–103.6) | 100.2 (96.7–103.5) | 100.4 (96.1–104.1) | 1 |
| Min bicarbonate, median (Q1, Q3) | 24.0 (21.0–28.0) | 24.0 (21.0–28.0) | 21.0 (17.0–26.0) | <0.001 |
| Max bicarbonate, median (Q1, Q3) | 30.0 (27.0–34.3) | 30.0 (27.0–35.0) | 28.0 (25.0–33.0) | <0.001 |
| Mean bicarbonate, median (Q1, Q3) | 27.3 (24.4–30.8) | 27.5 (24.6–31.0) | 24.5 (22.0–29.4) | <0.001 |
| Min calcium, median (Q1, Q3) | 8.3 (7.9–8.7) | 8.4 (7.9–8.7) | 7.9 (7.3–8.5) | <0.001 |
| Max calcium, median (Q1, Q3) | 9.1 (8.7–9.5) | 9.1 (8.8–9.5) | 9.0 (8.5–9.5) | 0.18182 |
| Mean calcium, median (Q1, Q3) | 8.7 (8.4–9.1) | 8.7 (8.4–9.1) | 8.5 (8.0–8.9) | <0.001 |
| Min bun, median (Q1, Q3) | 23.0 (16.0–36.0) | 23.0 (16.0–35.0) | 32.0 (20.0–44.2) | <0.001 |
| Max bun, median (Q1, Q3) | 42.0 (28.0–63.0) | 41.0 (27.0–62.0) | 62.0 (44.8–85.2) | <0.001 |
| Mean bun, median (Q1, Q3) | 33.0 (22.4–48.4) | 32.3 (22.0–47.6) | 45.6 (32.2–61.5) | <0.001 |
| Min creatinine, median (Q1, Q3) | 1.2 (0.9–1.8) | 1.2 (0.8–1.8) | 1.3 (0.9–1.9) | 1 |
| Max creatinine, median (Q1, Q3) | 1.7 (1.2–2.8) | 1.7 (1.2–2.8) | 2.4 (1.7–3.5) | <0.001 |
| Mean creatinine, median (Q1, Q3) | 1.4 (1.0–2.2) | 1.4 (1.0–2.2) | 1.8 (1.3–2.6) | <0.001 |
| Min albumin, median (Q1, Q3) | 2.9 (2.5–3.4) | 3.0 (2.5–3.4) | 2.5 (2.1–2.9) | <0.001 |
| Max albumin, median (Q1, Q3) | 3.3 (2.9–3.7) | 3.4 (3.0–3.7) | 3.1 (2.6–3.5) | <0.001 |
| Mean albumin, median (Q1, Q3) | 3.1 (2.7–3.5) | 3.1 (2.8–3.5) | 2.8 (2.4–3.1) | <0.001 |
| Min alt SGPT, median (Q1, Q3) | 21.0 (14.0–34.0) | 21.0 (14.0–34.0) | 24.0 (15.0–53.0) | 0.01158 |
| Max alt SGPT, median (Q1, Q3) | 27.0 (17.0–49.8) | 26.0 (17.0–47.0) | 52.0 (24.0–180.0) | <0.001 |
| Mean alt SGPT, median (Q1, Q3) | 24.0 (16.0–42.5) | 24.0 (16.0–40.0) | 41.9 (21.0–112.8) | <0.001 |
| Min total bilirubin, median (Q1, Q3) | 0.6 (0.4–0.9) | 0.6 (0.4–0.9) | 0.8 (0.5–1.2) | <0.001 |
| Max total bilirubin, median (Q1, Q3) | 0.7 (0.5–1.2) | 0.7 (0.5–1.2) | 1.2 (0.7–2.2) | <0.001 |
| Mean total bilirubin, median (Q1, Q3) | 0.6 (0.4–1.0) | 0.6 (0.4–1.0) | 1.0 (0.6–1.6) | <0.001 |
| Min HR, median (Q1, Q3) | 65.0 (56.0–74.0) | 65.0 (57.0–74.0) | 59.0 (30.5–72.5) | <0.001 |
| Max HR, median (Q1, Q3) | 107.0 (92.0–125.0) | 106.0 (92.0–123.0) | 128.0 (109.0–144.0) | <0.001 |
| Mean HR, median (Q1, Q3) | 83.0 (73.5–93.5) | 82.7 (73.2–93.0) | 90.7 (80.6–103.8) | <0.001 |
| Min RR, median (Q1, Q3) | 13.0 (10.0–16.0) | 13.0 (10.0–16.0) | 9.0 (0.0–14.0) | <0.001 |
| Max RR, median (Q1, Q3) | 31.0 (26.0–38.0) | 30.0 (26.0–37.0) | 36.0 (30.0–42.8) | <0.001 |
| Mean RR, median (Q1, Q3) | 20.2 (18.3–22.6) | 20.1 (18.3–22.5) | 21.3 (18.6–24.7) | <0.001 |
| Min SBP, median (Q1, Q3) | 90.0 (77.0–104.0) | 90.0 (78.0–105.0) | 68.0 (54.0–83.0) | <0.001 |
| Max SBP, median (Q1, Q3) | 158.0 (139.0–180.0) | 158.0 (139.5–180.0) | 148.0 (128.0–167.0) | <0.001 |
| Mean SBP, median (Q1, Q3) | 121.6 (108.1–136.8) | 122.7 (109.1–137.6) | 105.5 (95.2–117.7) | <0.001 |
| Min DBP, median (Q1, Q3) | 45.0 (36.0–54.0) | 45.0 (36.0–54.0) | 33.0 (22.0–46.0) | <0.001 |
| Max DBP, median (Q1, Q3) | 97.0 (84.0–112.0) | 97.0 (84.0–112.0) | 96.0 (81.0–113.0) | 1 |
| Mean DBP, median (Q1, Q3) | 65.6 (58.7–73.4) | 65.9 (59.0–73.8) | 60.5 (54.1–66.0) | <0.001 |
| Min temp, median (Q1, Q3) | 36.1 (35.8–36.4) | 36.2 (35.8–36.4) | 36.0 (35.5–36.3) | <0.001 |
| Max temp, median (Q1, Q3) | 37.2 (37.0–37.7) | 37.2 (37.0–37.7) | 37.6 (37.0–38.4) | <0.001 |
| Mean temp, median (Q1, Q3) | 36.7 (36.5–36.9) | 36.7 (36.5–36.9) | 36.7 (36.4–37.1) | 1 |
Baseline characteristics, vital signs, laboratory parameters and statistic results of eICU patients.
HGB, hemoglobin; ALT SGPT, alanine aminotransferase/serum glutamic - pyruvic transaminase.
We employed a feature selection strategy based on Boruta combined with feature importance. Traditional feature selection methods, such as Pearson correlation and stepwise selection, primarily capture linear relationships and often fail to account for interactions among variables (27–29). Therefore, we adopted the Boruta algorithm in conjunction with feature importance. Boruta is an automated feature selection algorithm based on random forests that uses statistical methods to identify features significantly associated with the target variable. Its core principle involves generating “shadow features” as noise benchmarks to distinguish truly important variables. This method offers several advantages, including automated thresholding to reduce manual intervention, retention of weak but stable features, robustness to multicollinearity, enhanced model interpretability, and applicability to high-dimensional heterogeneous data.
We selected the following features: minimum SpO2, minimum SBP, mean SBP, minimum RR, minimum HR, minimum albumin, minimum DBP, maximum BUN, mean BUN, maximum HR, mean SpO2, maximum creatinine, maximum WBC, mean WBC, and mean DBP.
Shapley additive explanations (SHAP)
The SHAP (SHapley Additive exPlanations) algorithm was applied to interpret the MLP model. Among the 15 selected features, the top 10 in terms of importance were min SpO2, min albumin, mean wbc, mean SpO2, mean sbp, mean bun, min rr, mean dbp, min hr, and min sbp. A reduction in minimum oxygen saturation (min SpO2) was generally associated with increased mortality risk. Lower levels of minimum albumin (min albumin) were also linked to increased mortality risk. The clinical significance of the mean white blood cell count (mean wbc) is complex; both abnormally low and elevated levels may be indicative of adverse outcomes. A decrease in average oxygen saturation (mean SpO2) may reflect inadequate oxygenation, thereby increasing the risk of mortality. Lower mean systolic blood pressure (mean sbp) was found to be associated with higher mortality. Elevated blood urea nitrogen (mean bun), potentially indicating renal dysfunction, was also linked to increased mortality. A decreased minimum respiratory rate (min rr) was associated with increased risk of death. Lower mean diastolic blood pressure (mean dbp) was related to higher mortality risk. Severely reduced minimum heart rate (min hr) was also associated with elevated mortality risk. Finally, decreased minimum systolic blood pressure (min sbp) was strongly associated with elevated mortality risk.
Discussion
Upon ICU admission, a total of 61 features were collected from patients. To improve prediction accuracy, the collected data were processed to include minimum, maximum, and mean values, accounting for dynamic changes in patients' conditions and the evolving nature of mortality prediction. Data from the two groups were processed separately to preserve the independence of the datasets. The MIMIC database was not involved in model development and was used solely as an external test set.
Through feature selection using Boruta and feature importance analysis, 15 features were identified Figure 2. Subsequently, the SHAP additive explanation method was applied to analyze the top-performing model (MLP) Figure 3. The top 10 features were identified as follows: minimum oxygen saturation (min SpO2), minimum albumin level (min albumin), mean white blood cell count (mean WBC), mean oxygen saturation (mean SpO2), mean systolic blood pressure (mean SBP), mean blood urea nitrogen (mean BUN), minimum respiratory rate (min RR), mean diastolic blood pressure (mean DBP), minimum heart rate (min HR), and minimum systolic blood pressure (min SBP).
Figure 2
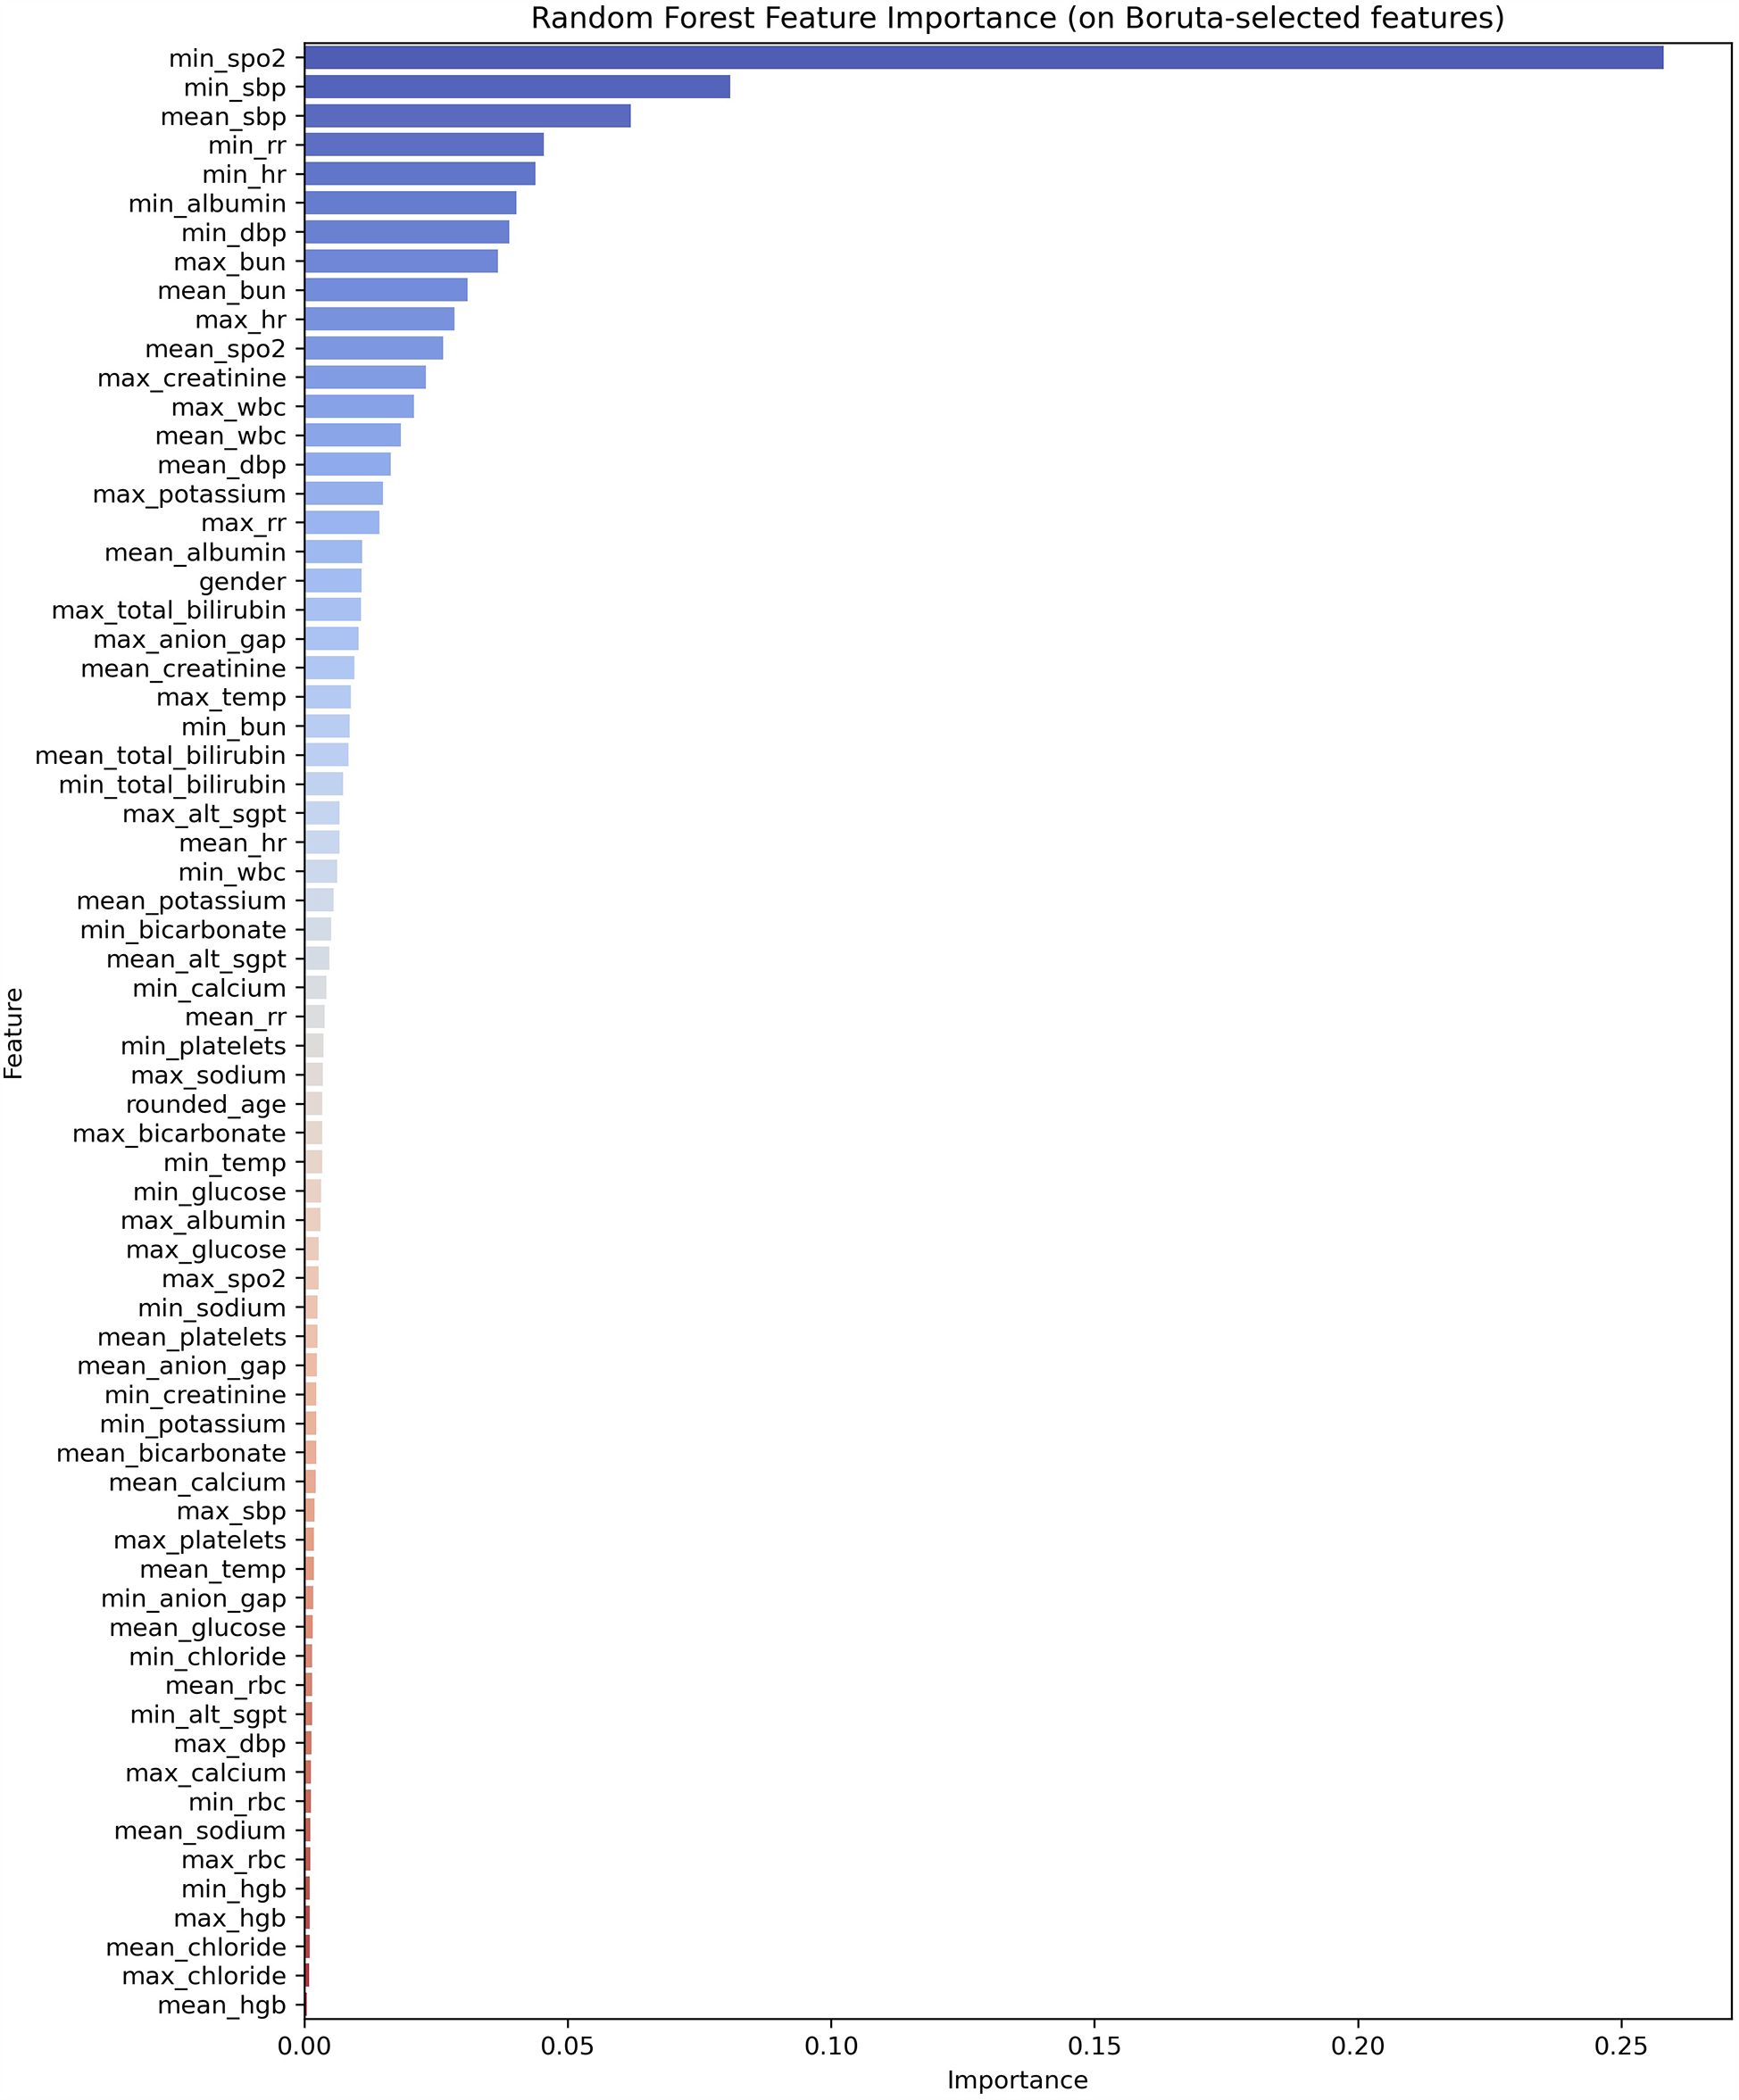
Feature importance ranking.
Figure 3
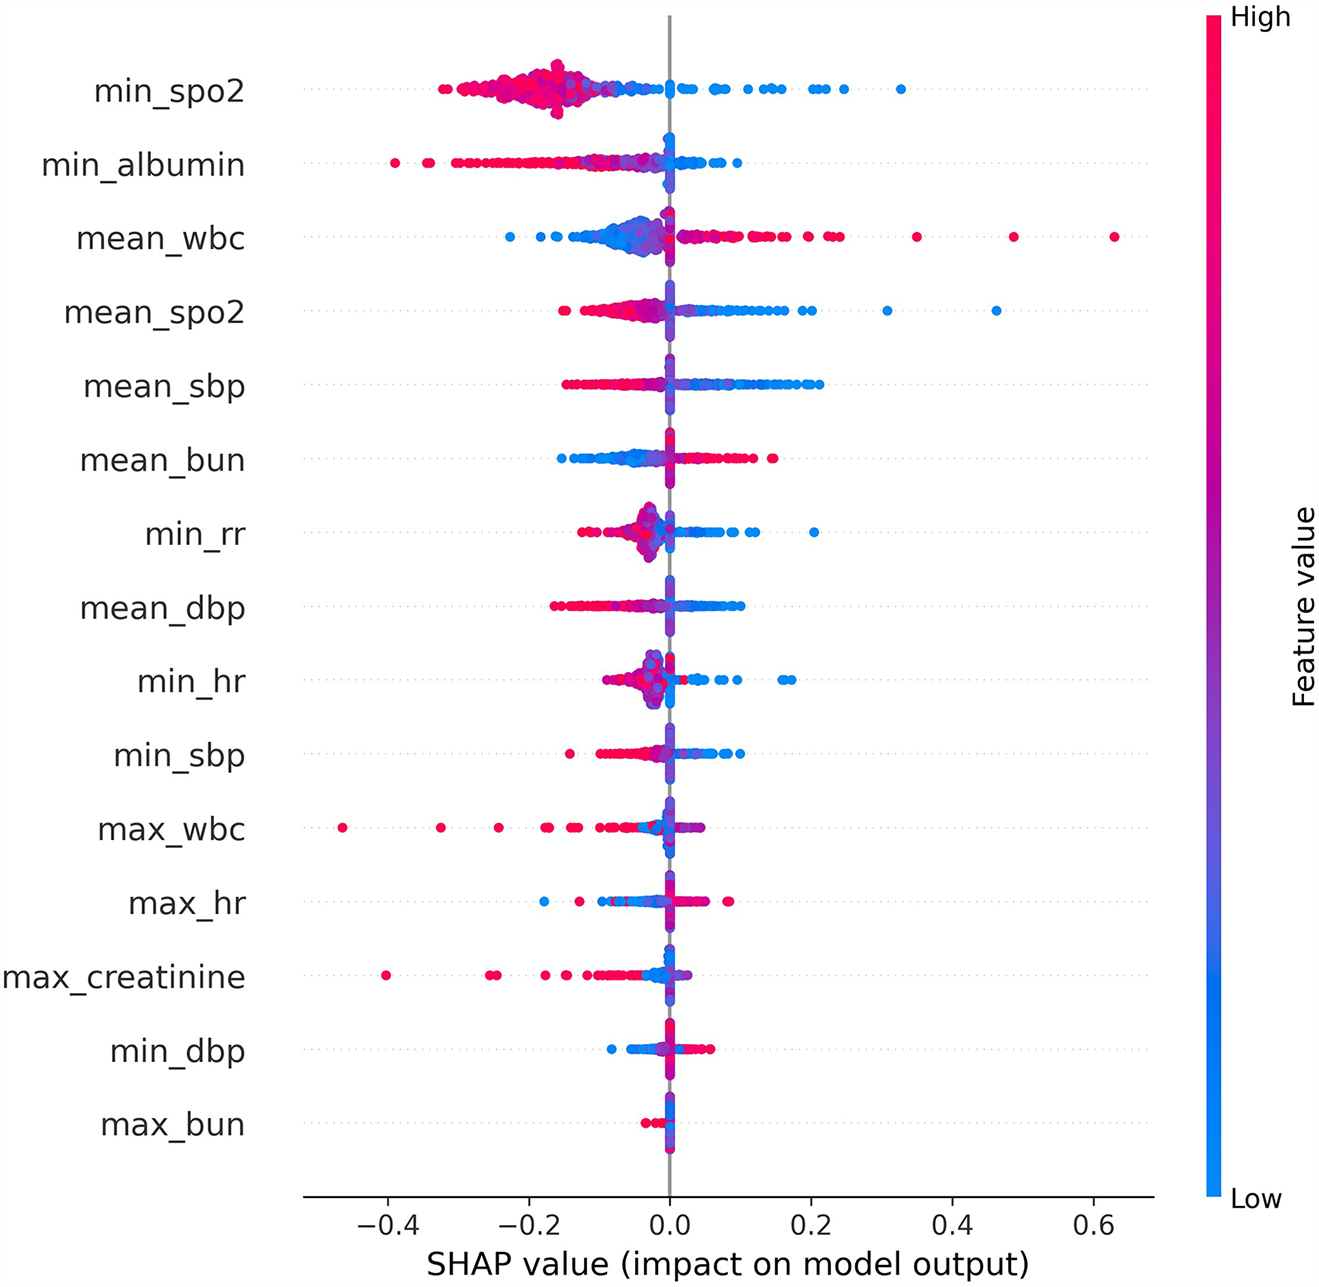
The shap analysis of MLP.
Heart failure patients exhibit significant clinical heterogeneity, and multiple treatment strategies are available. Rapid prediction of patient mortality would allow for timely adjustment of treatment plans, thereby significantly improving patient outcomes. In this study, nine models were selected: Logistic Regression, SVM, Decision Tree, LGBM, KNN, Random Forest, GBM, XGBoost, and MLP. These models were trained using random search and cross-validation. While AUC reflects the overall predictive accuracy, it is limited in assessing performance on the minority class (Figure 4). Therefore, the F1-score was selected as the primary evaluation metric, as it more accurately captures the model's ability to predict mortality by providing a better balance between false negatives (FN) and false positives (FP) (Figure 5) (30, 31).
Figure 4
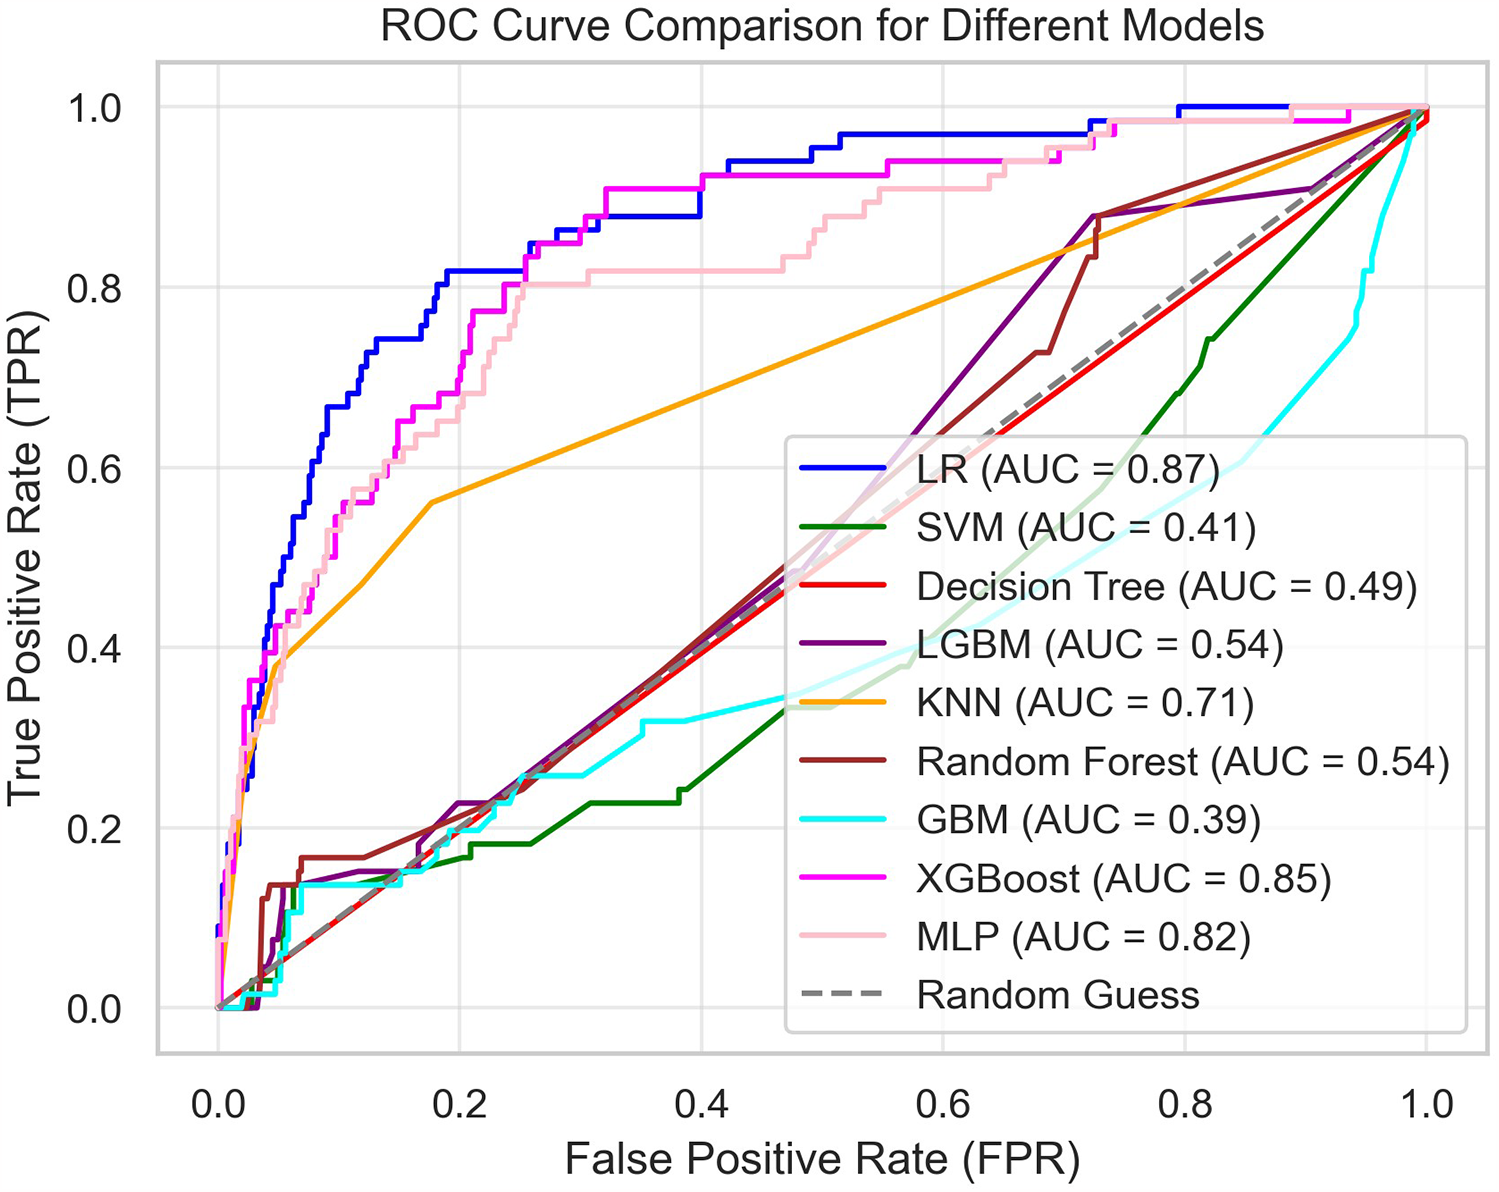
Summary of the ROC curves of all models.
Figure 5
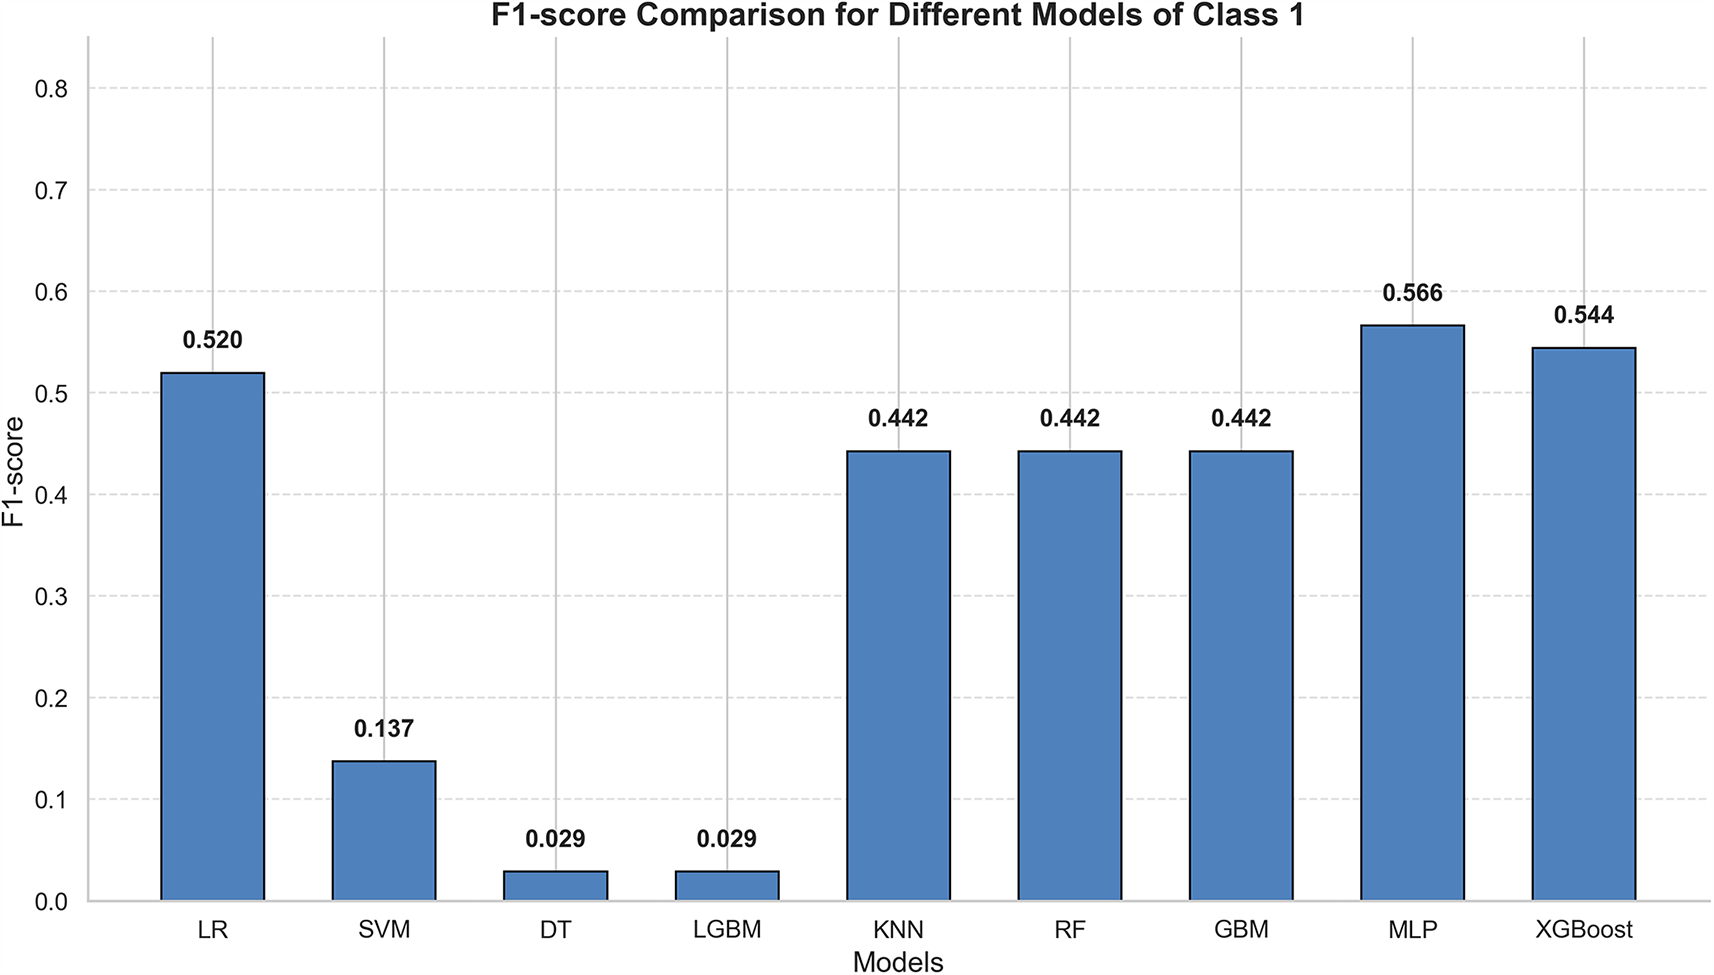
Summary of f1 scores of all models.
In this study, the eICU dataset was used as the development set to train the models, while the MIMIC-IV dataset served as an independent external test set to evaluate model performance. Each dataset underwent preprocessing: eICU data were handled through missing value imputation, multiple imputation, oversampling, and data normalization. The models were then trained under cross-validation. Since tree-based models do not require data normalization, the Decision Tree, Light Gradient Boosting Machine (LGBM), Random Forest, Gradient Boosting Machine (GBM), and Extreme Gradient Boosting (XGBoost) were not normalized. After missing value handling, the MIMIC-IV dataset was also used with unnormalized data for prediction in the tree-based models. Ultimately, the Multilayer Perceptron (MLP) demonstrated the best predictive performance, providing evidence of its ability to predict patient mortality risk Table 2. Although machine learning models must still be integrated with clinical decision-making, they can offer valuable auxiliary support in the absence of detailed examinations.
Table 2
| Models | Accuracy | Precision (1) | Recall (1) | F1 (1) | Macro F1 | Weighted F1 |
|---|---|---|---|---|---|---|
| LR | 0.88 | 0.54 | 0.50 | 0.52 | 0.73 | 0.88 |
| SVM | 0.81 | 0.18 | 0.14 | 0.15 | 0.52 | 0.80 |
| DT | 0.87 | 0.47 | 0.32 | 0.38 | 0.65 | 0.86 |
| LGBM | 0 . 89 | 0.75 | 0.14 | 0.23 | 0.58 | 0.85 |
| KNN | 0.88 | 0.53 | 0.38 | 0.44 | 0.69 | 0.87 |
| RF | 0.88 | 0.62 | 0.20 | 0.30 | 0.62 | 0.86 |
| GBM | 0.88 | 0.67 | 0.12 | 0.21 | 0.57 | 0.85 |
| MLP | 0.87 | 0.49 | 0 . 64 | 0 . 56 | 0 . 74 | 0 . 88 |
| XGBoost | 0.86 | 0.47 | 0 . 65 | 0.54 | 0.73 | 0.87 |
The final scores of all models.
Bold font indicates the highest value achieved for this metric.
A decrease in minimum saturation of peripheral oxygen (min SpO2) is associated with an increased risk of mortality, as low oxygen saturation reflects impaired cardiopulmonary function, which affects oxygen supply and poses a life-threatening risk (32, 33). A reduction in minimum albumin (min albumin) may also increase the risk of mortality, as low albumin levels suggest poor nutritional status or impaired liver synthesis, indicating overall body dysfunction (34, 35). The significance of mean white blood cell count (mean wbc) is more complex; a low count may increase mortality risk due to immune system dysfunction, while a high count may indicate an excessive inflammatory response or other adverse factors, which does not necessarily correlate with a reduction in risk (36, 37). A decrease in mean saturation of peripheral oxygen (mean SpO2) is linked to an increased risk of mortality, as adequate oxygenation is essential for vital functions, and a low mean oxygen saturation suggests inadequate oxygen supply (38). A reduction in mean systolic blood pressure (mean sbp) may also increase mortality risk, as low systolic blood pressure reflects issues with cardiac output or peripheral circulation (39, 40). An elevated mean blood urea nitrogen (mean bun) level may indicate impaired renal function, thus increasing mortality risk; however, a lower value is generally considered favorable, though it is not necessarily inversely correlated with mortality (40). A significantly low minimum respiratory rate (min rr) may indicate severe suppression of respiratory function, increasing mortality risk (41, 42). A decrease in mean diastolic blood pressure (mean dbp) may reflect cardiovascular abnormalities and is associated with an increased risk of mortality (43). A very low minimum heart rate (min hr) may indicate severe cardiac dysfunction, leading to a higher mortality risk (44, 45). A decrease in minimum systolic blood pressure (min sbp) typically reflects a sudden deterioration in cardiac pumping ability or peripheral circulation, thus increasing the risk of mortality.
The study has several limitations. First, this is a retrospective study, which is subject to selection bias and has not been validated by prospective research. Second, the model used in this study was derived from existing databases and is therefore limited by the quality of the original data. Third, the F1-score of the study remains low, which limits its clinical applicability.
Conclusion
Among the nine models, the Multi-Layer Perceptron (MLP) achieved the highest recall rate (0.64), identifying the greatest number of true positives and minimizing the risk of missed diagnoses. It also exhibited superior overall performance, with the highest Macro F1 score (0.74) and Weighted F1 score (0.88), effectively balancing performance across all categories.
Statements
Data availability statement
Publicly available datasets were analyzed in this study. This data can be found here: https://physionet.org/content/mimiciii/1.4, https://physionet.org/content/eicu-crd/2.0/.
Ethics statement
This study utilized the MIMIC-IV and eICU databases. In accordance with national regulations and institutional guidelines, written informed consent was not necessary for participation in this research.
Author contributions
YW: Writing – original draft, Writing – review & editing, Funding acquisition, Resources, Visualization. JR: Data curation, Methodology, Writing – review & editing. ZW: Project administration, Writing – original draft. XB: Validation, Writing – original draft. YD: Conceptualization, Formal analysis, Funding acquisition, Methodology, Project administration, Resources, Supervision, Writing – review & editing.
Funding
The author(s) declare that financial support was received for the research and/or publication of this article. This study was supported by the Intramural Fund of the First Hospital of Lanzhou University (No. ldyyyn2020-52).
Conflict of interest
The authors declare that the research was conducted in the absence of any commercial or financial relationships that could be construed as a potential conflict of interest.
Generative AI statement
The author(s) declare that no Generative AI was used in the creation of this manuscript.
Publisher’s note
All claims expressed in this article are solely those of the authors and do not necessarily represent those of their affiliated organizations, or those of the publisher, the editors and the reviewers. Any product that may be evaluated in this article, or claim that may be made by its manufacturer, is not guaranteed or endorsed by the publisher.
References
1.
Conrad N Judge A Canoy D Tran J Pinho-Gomes AC Millett ERC et al Temporal trends and patterns in mortality after incident heart failure. JAMA Cardiol. (2019) 4(11):1102–1110.1001/jamacardio.2019.3593
2.
James SL Abate D Abate KH Abay SM Abbafati C Abbasi N et al Global, regional, and national incidence, prevalence, and years lived with disability for 354 diseases and injuries for 195 countries and territories, 1990–2017: a systematic analysis for the global burden of disease study 2017. Lancet. (2018) 392(10159):1789–85810.1016/S0140-6736(18)32279-7
3.
Ambrosy AP Fonarow GC Butler J Chioncel O Greene SJ Vaduganathan M et al The global health and economic burden of hospitalizations for heart failure. J Am Coll Cardiol. (2014) 63(12):1123–33. 10.1016/j.jacc.2013.11.053
4.
Savarese G Becher PM Lund LH Seferovic P Rosano GMC Coats AJS . Global burden of heart failure: a comprehensive and updated review of epidemiology. Cardiovasc Res. (2023) 118(17):3272–87. 10.1093/cvr/cvac013
5.
Tromp J Ferreira JP Janwanishstaporn S Shah M Greenberg B Zannad F et al Heart failure around the world. Eur J of Heart Fail. (2019) 21(10):1187–96. 10.1002/ejhf.1585
6.
Ostrominski JW DeFilippis EM Bansal K Riello RJ Bozkurt B Heidenreich PA et al Contemporary American and European guidelines for heart failure management. JACC Heart Fail. (2024) 12(5):810–25. 10.1016/j.jchf.2024.02.020
7.
Krum H Gilbert RE . Demographics and concomitant disorders in heart failure. Lancet. (2003) 362(9378):147–58. 10.1016/S0140-6736(03)13869-X
8.
Johnson KW Torres Soto J Glicksberg BS Shameer K Miotto R Ali M et al Artificial intelligence in cardiology. J Am Coll Cardiol. (2018) 71(23):2668–79. 10.1016/j.jacc.2018.03.521
9.
Peng S Huang J Liu X Deng J Sun C Tang J et al Interpretable machine learning for 28-day all-cause in-hospital mortality prediction in critically ill patients with heart failure combined with hypertension: a retrospective cohort study based on medical information mart for intensive care database-IV and eICU databases. Front Cardiovasc Med. (2022) 9:994359. 10.3389/fcvm.2022.994359
10.
Golas SB Shibahara T Agboola S Otaki H Sato J Nakae T et al A machine learning model to predict the risk of 30-day readmissions in patients with heart failure: a retrospective analysis of electronic medical records data. BMC Med Inform Decis Mak. (2018) 18(1):44. 10.1186/s12911-018-0620-z
11.
Gautam N Mounsey JP Yeh ETH Al’Aref SJ . Promises and challenges of machine learning for device therapy in heart failure. Eur Heart J. (2023) 44(18):1583–5. 10.1093/eurheartj/ehad036
12.
Johnson AEW Bulgarelli L Shen L Gayles A Shammout A Horng S et al MIMIC-IV, a freely accessible electronic health record dataset. Sci Data. (2023) 10(1):1. 10.1038/s41597-022-01899-x
13.
Pollard TJ Johnson AEW Raffa JD Celi LA Mark RG Badawi O . The eICU collaborative research database, a freely available multi-center database for critical care research. Sci Data. (2018) 5(1):180178. 10.1038/sdata.2018.178
14.
Collins GS Reitsma JB Altman DG Moons KGM . Transparent reporting of a multivariable prediction model for individual prognosis or diagnosis (TRIPOD). Circulation. (2015) 131(2):211–9. 10.1161/CIRCULATIONAHA.114.014508
15.
Kruse CS Kristof C Jones B Mitchell E Martinez A . Barriers to electronic health record adoption: a systematic literature review. J Med Syst. (2016) 40(12):252. 10.1007/s10916-016-0628-9
16.
Shah KS Xu H Matsouaka RA Bhatt DL Heidenreich PA Hernandez AF et al Heart failure with preserved, borderline, and reduced ejection fraction: 5-year outcomes. J Am Coll Cardiol. (2017) 70(20):2476–86. 10.1016/j.jacc.2017.08.074
17.
Jakobsen JC Gluud C Wetterslev J Winkel P . When and how should multiple imputation be used for handling missing data in randomised clinical trials—a practical guide with flowcharts. BMC Med Res Methodol. (2017) 17(1):162. 10.1186/S12874-017-0442-1
18.
Peduzzi P Concato J Feinstein AR Holford TR . Importance of events per independent variable in proportional hazards regression analysis II. Accuracy and precision of regression estimates. J Clin Epidemiol. (1995) 48(12):1503–1010.1016/0895-4356(95)00048-8
19.
Kang H . The prevention and handling of the missing data. Korean J Anesthesiol. (2013) 64(5):402. 10.4097/kjae.2013.64.5.402
20.
Sterne JAC White IR Carlin JB Spratt M Royston P Kenward MG et al Multiple imputation for missing data in epidemiological and clinical research: potential and pitfalls. BMJ. (2009) 338:b239310.1136/bmj.b2393
21.
Bergstra J Bengio Y . Random search for hyper-parameter optimization. J Mach Learn Res. (2012) 13:281–305.
22.
Bergstra J Bardenet R Bengio Y Kégl B . Algorithms for hyper-parameter optimization. In:Shawe-TaylorJZemelRSBartlettPLPereiramFWeinbergerKQ, editors. Advances in Neural Information Processing Systems. Vol. 24. Red Hook, NY: Curran Associates, Inc (2011). p. 2546–54.
23.
Li L Jamieson K DeSalvo G Rostamizadeh A Talwalkar A . Hyperband: A novel bandit-based approach to hyperparameter optimization.
24.
Saito T Rehmsmeier M . The precision-recall plot is more informative than the ROC plot when evaluating binary classifiers on imbalanced datasets. PLoS One. (2015) 10(3):e0118432. 10.1371/journal.pone.0118432
25.
Powers DMW . Evaluation: from precision, recall and F-measure to ROC, informedness, markedness and correlation. (2020). 10.48550/arXiv.2010.16061
26.
Glickman ME Rao SR Schultz MR . False discovery rate control is a recommended alternative to bonferroni-type adjustments in health studies. J Clin Epidemiol. (2014) 67(8):850–7. 10.1016/j.jclinepi.2014.03.012
27.
Saeys Y Inza I Larrañaga P . A review of feature selection techniques in bioinformatics. Bioinformatics. (2007) 23(19):2507–17. 10.1093/bioinformatics/btm344
28.
Bommert A Sun X Bischl B Rahnenführer J Lang M . Benchmark for filter methods for feature selection in high-dimensional classification data. Comput Stat Data Anal. (2020) 143:106839. 10.1016/j.csda.2019.106839
29.
Dormann CF Elith J Bacher S Buchmann C Carl G Carré G et al Collinearity: a review of methods to deal with it and a simulation study evaluating their performance. Ecography. (2013) 36(1):27–4610.1111/j.1600-0587.2012.07348.x
30.
The advantages of the Matthews correlation coefficient (MCC) over F1 score and accuracy in binary classification evaluation. BMC Genomics. 10.1186/s12864-019-6413-7
31.
Tharwat A . Classification assessment methods. Appl Comput Inform. (2020) 17(1):168–92. 10.1016/j.aci.2018.08.003
32.
Mohammed AQ Abdu FA Su Y Liu L Yin G Feng Y et al Prognostic significance of coronary microvascular dysfunction in patients with heart failure with preserved ejection fraction. Can J Cardiol. (2023) 39(7):971–8010.1016/j.cjca.2023.04.011
33.
Sepehrvand N Ezekowitz JA . Oxygen therapy in patients with acute heart failure. JACC Heart Fail. (2016) 4(10):783–90. 10.1016/j.jchf.2016.03.026
34.
Levitt D Levitt M . Human serum albumin homeostasis: a new look at the roles of synthesis, catabolism, renal and gastrointestinal excretion, and the clinical value of serum albumin measurements. IJGM. (2016) 9:229–55. 10.2147/IJGM.S102819
35.
Don BR Kaysen G . Poor nutritional status and inflammation: serum albumin: relationship to inflammation and nutrition. Semin Dial. (2004) 17(6):432–7. 10.1111/j.0894-0959.2004.17603.x
36.
Hotchkiss RS Moldawer LL Opal SM Reinhart K Turnbull IR Vincent JL . Sepsis and septic shock. Nat Rev Dis Primers. (2016) 2(1):16045. 10.1038/nrdp.2016.45
37.
Zahorec R . Ratio of neutrophil to lymphocyte counts–rapid and simple parameter of systemic inflammation and stress in critically ill. Bratisl Lek Listy. (2001) 102(1):5–14.
38.
O’Driscoll BR Howard LS Earis J Mak V . British thoracic society guideline for oxygen use in adults in healthcare and emergency settings. BMJ Open Respir Res. (2017) 4(1):e000170. 10.1136/bmjresp-2016-000170
39.
Lee DS Austin PC Rouleau JL Liu PP Naimark D Tu JV . Predicting mortality among patients hospitalized for heart failure. JAMA. (2003) 290(19):2581. 10.1001/jama.290.19.2581
40.
Fonarow GC . Risk stratification for in-hospital mortality in acutely decompensated heart failure: classification and regression tree analysis. JAMA. (2005) 293(5):572. 10.1001/jama.293.5.572
41.
Haruki N Floras JS . Sleep-Disordered breathing in heart failure — a therapeutic dilemma. Circ J. (2017) 81(7):903–12. 10.1253/circj.CJ-17-0440
42.
Ingbir M Freimark D Motro M Adler Y . The incidence, pathophysiology, treatment and prognosis of cheyne-stokes breathing disorder in patients with congestive heart failure. Herz. (2002) 27(2):107–12. 10.1007/s00059-002-2350-2
43.
Benetos A Zureik M Morcet J Thomas F Bean K Safar M et al A decrease in diastolic blood pressure combined with an increase in systolic blood pressure is associated with a higher cardiovascular mortality in men. J Am Coll Cardiol. (2000);35(3):673–680. 10.1016/S0735-1097(99)00586-0
44.
Luo C Duan Z Xia Z Li Q Wang B Zheng T et al Minimum heart rate and mortality after cardiac surgery: retrospective analysis of the multi-parameter intelligent monitoring in intensive care (MIMIC-III) database. Sci Rep. (2023) 13(1):2597. 10.1038/s41598-023-29703-9
45.
Wang J Zhou L Zhang Y Zhang H Xie Y Chen Z et al Minimum heart rate and mortality in critically ill myocardial infarction patients: an analysis of the MIMIC-III database. Ann Transl Med. (2021) 9(6):496. 10.21037/atm-21-992
Summary
Keywords
machine learning, heart failure, NN, MLP, XGBoost, eICU, MIMIC
Citation
Wang Y, Rong J, Wei Z, Bai X and Deng Y (2025) Predicting ICU mortality in heart failure patients based on blood tests and vital signs. Front. Cardiovasc. Med. 12:1590367. doi: 10.3389/fcvm.2025.1590367
Received
09 March 2025
Accepted
16 May 2025
Published
25 June 2025
Volume
12 - 2025
Edited by
Cristiano Amarelli, Monaldi, Italy
Reviewed by
Concetta Di Nora, Azienda Sanitaria Universitaria Integrata di Udine, Italy
Davide Romagnolo, Humanitas Research Hospital, Italy
Updates
Copyright
© 2025 Wang, Rong, Wei, Bai and Deng.
This is an open-access article distributed under the terms of the Creative Commons Attribution License (CC BY). The use, distribution or reproduction in other forums is permitted, provided the original author(s) and the copyright owner(s) are credited and that the original publication in this journal is cited, in accordance with accepted academic practice. No use, distribution or reproduction is permitted which does not comply with these terms.
* Correspondence: YunDan Deng dengyundan_crij@yeah.net
Disclaimer
All claims expressed in this article are solely those of the authors and do not necessarily represent those of their affiliated organizations, or those of the publisher, the editors and the reviewers. Any product that may be evaluated in this article or claim that may be made by its manufacturer is not guaranteed or endorsed by the publisher.