Abstract
Objective:
This study aimed to evaluate the myocardial mechanical properties of the left atrium, left ventricle, and left atrioventricular coupling using ultrasound in patients with isolated basal septal hypertrophy (IBSH) caused by primary hypertension.
Methods:
This retrospective study enrolled 210 participants [140 hypertensive patients subdivided into IBSH and left ventricular hypertrophy (LVH) groups (n = 70 each) and 70 controls]. Speckle-tracking echocardiography was used to analyze left atrium (LA)/left ventricle (LV) strain parameters and atrioventricular coupling.
Results:
(1) The IBSH group demonstrated higher adherence to antihypertensive medication than the LVH group (P < 0.05). (2) Both the IBSH and LVH groups showed reduced global longitudinal strain (GLS) and global circumferential strain (GCS) (more severe in LVH) but increased global radial strain (GRS) (more prominent in IBSH) (P < 0.05). The 18-segment LV strain analysis revealed significantly reduced strain in the basal anterior and inferior septum (P < 0.05), while compensatory increased strain in all apical segments (P < 0.05) in the IBSH group. (3) Left atrioventricular coupling index (LACI) increased in both groups (P < 0.01), while left atrial reservoir strain (LASR) and left atrial conduit strain (LASCD) decreased (more in LVH), yet left atrial contraction strain (LASCT) markedly rose in IBSH (P < 0.01). (4) Correlation analysis in the IBSH group showed the following results: Left ventricular mass index (LVMI) negatively correlated with left ventricular ejection fraction (LVEF), GRS, and GCS (P < 0.05); LACI positively correlated with left atrial volume index(LAVI) (r = 0.73); LASR positively correlated with GLS and E/A but negatively with E/e′ (all P < 0.05).
Conclusion:
This study elucidates the potential association between regular antihypertensive medication use and cardiac remodeling in patients with IBSH. Through a comprehensive analysis of global and regional left atrioventricular myocardial function, we identified the basal septal segment as the most significantly impaired myocardial region. Furthermore, the study demonstrated the existence of a compensatory redistribution mechanism in myocardial mechanics.
1 Background
Previous studies have considered isolated basal septal hypertrophy (IBSH) a degenerative change associated with aging; however, its prevalence in hypertensive patients is as high as 20% (1). Earlier research has shown that in patients with hypertension, increases in wall thickness occur gradually and unevenly. Wall stress is influenced by the local geometry of the LV, with areas having a larger curvature radius exposed to higher wall stress (2, 3). Compared with the free wall, the basal segment has a larger curvature radius (2). As blood pressure increases, wall stress rises disproportionately, resulting in progressive thickening from the apical to the basal segment. According to Laplace's law, an imbalance between increased wall stress and locally generated forces leads to reduced local deformation. Over time, this imbalance may cause localized hypertrophy, which is considered a key mechanism underlying IBSH (4). However, the effects of this LV remodeling on the left atrium (LA) and atrioventricular coupling remain poorly understood (5). Therefore, this study aimed to explore the myocardial mechanical relationships among the LA, LV, and left atrioventricular coupling in the IBSH group.
This study utilizes two-dimensional speckle-tracking imaging (2D-STI) to assess the myocardial function of the left atrium and left ventricle. By identifying and tracking myocardial motion on echocardiographic images, 2D-STI enables quantitative analysis of myocardial strain (6). Parameters including GLS, GRS, global circumferential strain (GCS), and 18-segment left ventricular strain are derived echocardiographically to quantify both regional and overall left ventricular myocardial motion, thereby providing a systematic evaluation of left ventricular myocardial function. In recent years, increasing attention has been directed toward the assessment of left atrial function using the same 2D-STI methodology (7). Accordingly, this study aims to analyze the myocardial mechanical characteristics and intrinsic relationships of the left atrium, left ventricle, and left atrioventricular coupling in patients with IBSH.
2 Content and methods
2.1 Study subjects
A total of 140 hypertensive patients diagnosed at the First Affiliated Hospital of Xinjiang Medical University between July 2023 and May 2024 were enrolled in the case group. Based on baseline data, patients were classified into the IBSH group (n = 70) and the left ventricular hypertrophy (LVH) group (n = 70), according to the location of septal hypertrophy. An additional 70 healthy individuals were included as the control group. This study was conducted in strict accordance with the principles of the Declaration of Helsinki and has been reviewed and approved by the Ethics Committee of the First Affiliated Hospital of Xinjiang Medical University. As this is a retrospective study, the requirement for written informed consent was waived.
2.2 Inclusion and exclusion criteria
Inclusion criteria: Hypertension was defined as systolic blood pressure (SBP) ≥ 140 mmHg or diastolic blood pressure (DBP) ≥ 90 mmHg, measured over three consecutive days. Patients with a history of hypertension and on antihypertensive medications were included even if their blood pressure was below 140/90 mmHg. During echocardiographic examination, blood pressure was required to be controlled below 140/90 mmHg in both groups.
IBSH group: The Framingham inclusion criteria were used as a reference. (1) Localized thickening of the basal septal segment was defined as left ventricular septal basal-segment end-diastolic thickness (LVSBD) ≥ 1.4 cm. (2) The ratio of LVSBD to interventricular septum end-diastolic thickness (IVSD) was required to be ≥1.5. (3) No scarring or segmental wall motion abnormalities were present in the mid-septal segment. (4) Conditions such as aortic stenosis, subaortic membrane, and hypertrophic cardiomyopathy were excluded. All four criteria were required to be met simultaneously (Figures 1A–C).
Figure 1
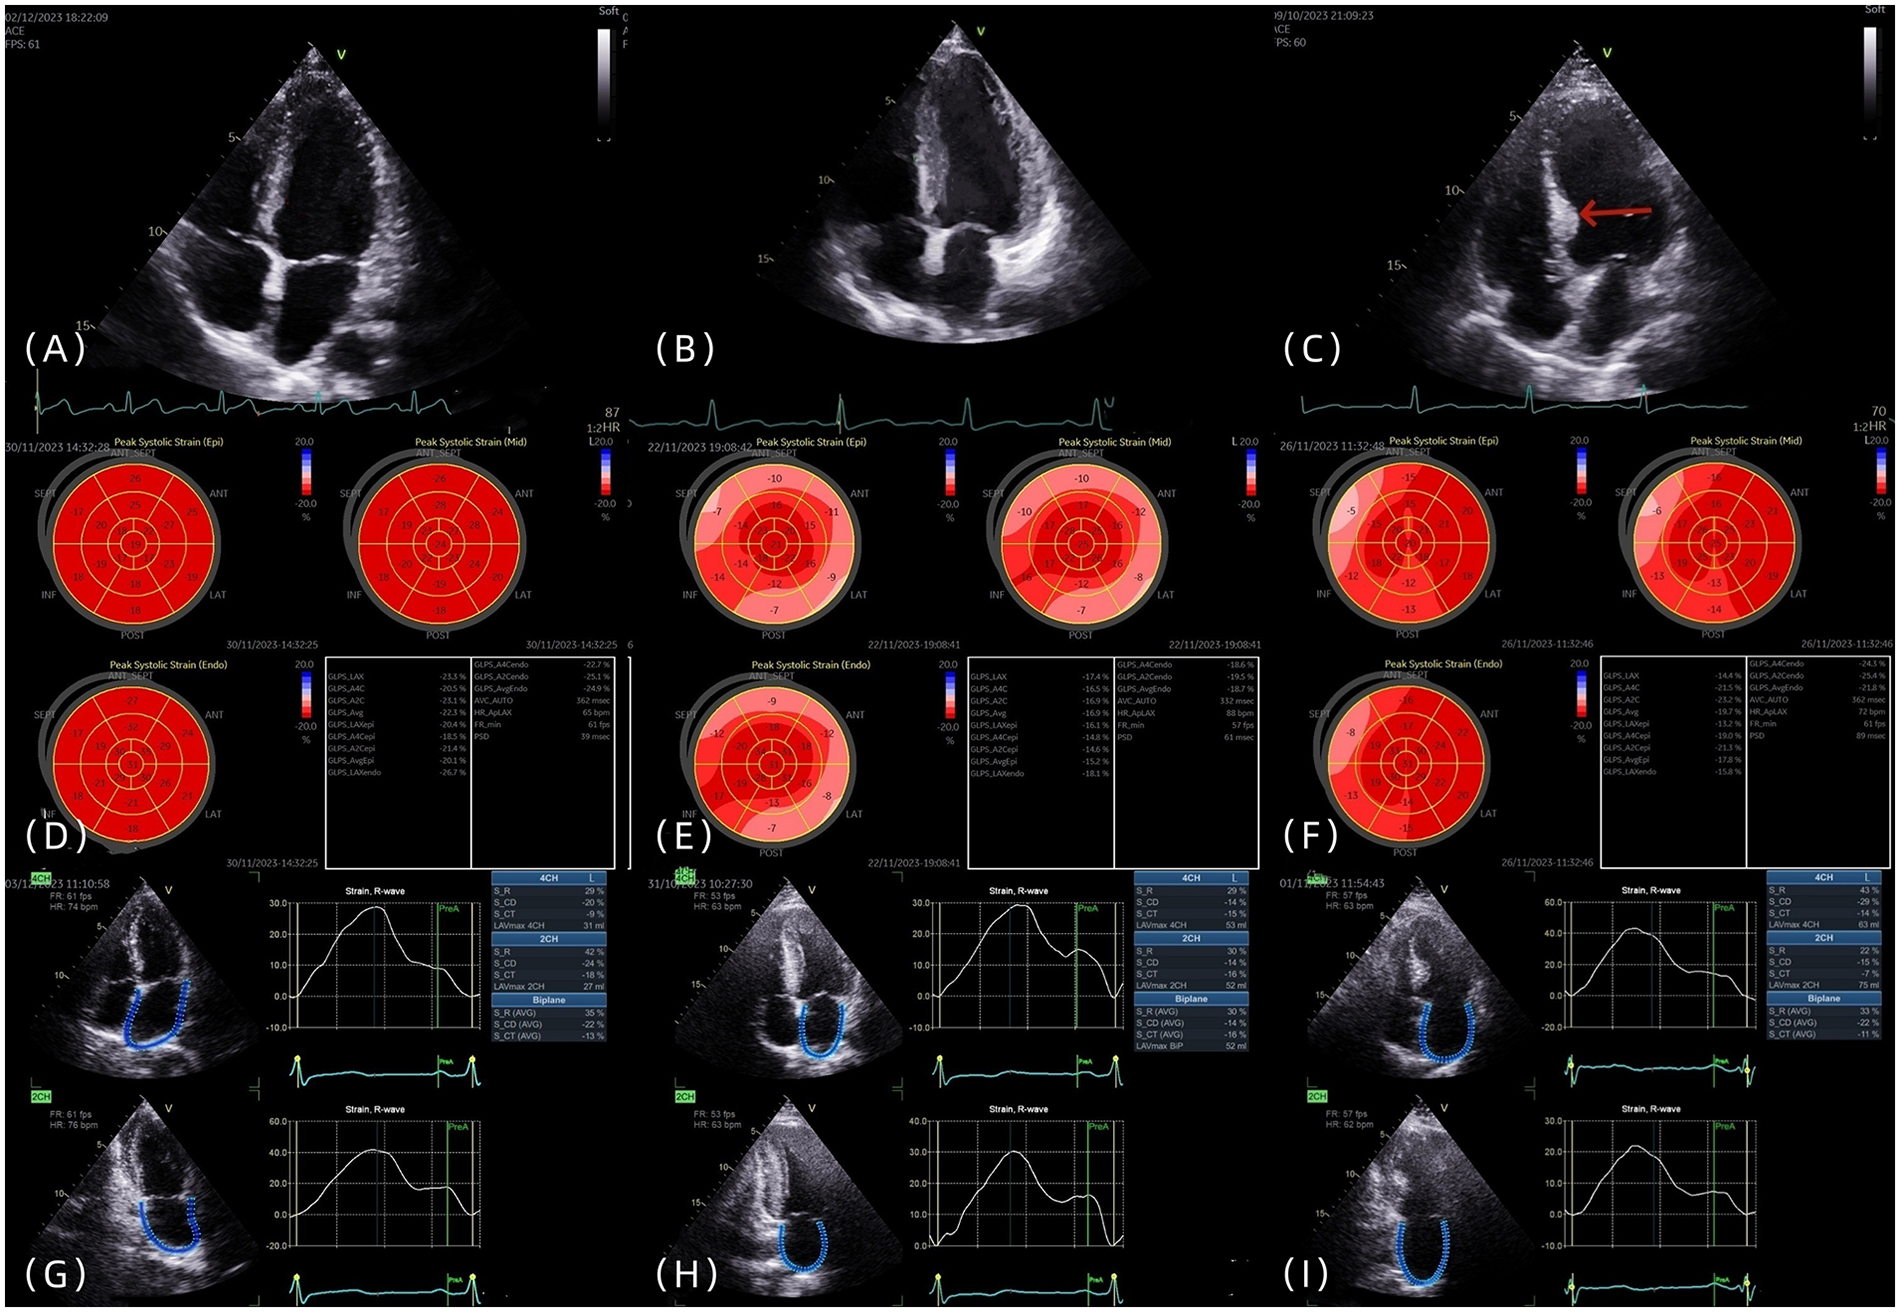
(A–C) The four-chamber heart views of the control group, LVH group, and IBSH group, respectively, with the arrow pointing to the posterior septal basal segment of the IBSH group. (D–F) The left ventricular strain images of the control group, LVH group, and IBSH group, respectively. (G–I) The left atrial strain images of the control group, LVH group, and IBSH group, respectively.
LVH group: Diagnostic criteria were based on current guidelines (8). Males were required to have left ventricular mass index (LVMI) > 115 g/m² and relative wall thickness (RWT) > 0.42, whereas females were required to have LVMI > 95 g/m² and RWT > 0.42.
Additionally, 70 healthy individuals were enrolled as the control group.
Exclusion criteria: (1) patients with confirmed cardiomyopathy, coronary artery disease, valvular heart disease, or other significant cardiac conditions; (2) those with secondary hypertensive heart disease caused by diabetes, kidney disease, or other systemic conditions; and (3) those with poor echocardiographic image quality.
2.3 Clinical data, equipment, and examination methods
2.3.1 Equipment
Two experienced echocardiographers, blinded to patient group allocation, obtained all images using the Vivid E9 ultrasound system (GE, Vingmed Ultrasound, Horten, Norway) with an M5S probe operating at 3.5–5.5 MHz and a frame rate of 50–80 frames per second (fps). Continuous images from five consecutive cardiac cycles were recorded. Offline image analysis was performed using the EchoPAC workstation (GE Medical Systems, version 204.0).
2.3.2 Transthoracic echocardiography
All patients were examined in the left lateral decubitus position following the guidelines of the American Society of Echocardiography (ASE) and the European Association of Cardiovascular Imaging (EACVI) (9).
In the transthoracic left ventricular long-axis view, measurements were taken for the IVSD, LVSBD, and the left ventricular posterior wall end-diastolic thickness (LVPWd). Based on the above measurements, the LVMI and LAVI were subsequently calculated. All parameters were recorded as the average of measurements taken over three consecutive cardiac cycles. From the apical four-chamber view, pulsed-wave Doppler was used to assess mitral inflow velocities, including early diastolic velocity (E), late diastolic velocity (A), and the E/A ratio. Tissue Doppler imaging (TDI) from the apical four-chamber view was used to measure septal annular velocity (e′), and the E/e′ ratio was then calculated.
The following parameters were calculated as described in (10). Left ventricular mass (LVM) was calculated using the corrected formula: LVM = 0.8 × {1.04[(LVDd + LVPWd + LVSd)³ − LVDd³]} + 0.6. LVMI was calculated as LVM ÷ Body Surface Area (BSA). RWT was calculated as (LVPWd + LVSd) / LVDd. LAVI was calculated as LAVmax ÷ BSA.
The biplane Simpson's method was applied in the apical four-chamber and two-chamber views to measure the following parameters: left ventricular end-systolic volume (LVESV), left ventricular end-diastolic volume (LVEDV), left ventricular ejection fraction (LVEF), left atrial maximum volume (LAVmax), left atrial minimum volume (LAVmin), left atrial pre-contraction volume (LAVpreA), left atrial total ejection fraction (LATEF), and left atrioventricular coupling index (LACI). LACI is defined as the ratio of left atrial end-diastolic volume to left ventricular end-diastolic volume.
The following parameters were calculated using LAVmax, LAVmin, LAVpreA, and LVEDV: LACI = LAVmin/LVEDV. Left atrial active ejection fraction (LAAEF) = (LAVpreA − LAVmin)/LAVpreA × 100%. Left atrial passive ejection fraction (LAPEF) = (LAVmax − LAVpreA)/LAVmax × 100%. Here, LAAEF represents left atrial pump function, and LAPEF represents left atrial conduit function.
2.3.3 2D-STI measurement methods
In accordance with the recommendations of the ASE and EACVI, 2D-STI was performed (9). Imaging planes included the apical two-chamber, apical three-chamber, and apical four-chamber views. The average value of all segments was calculated to determine the longitudinal strain at the time of aortic valve closure (AVC), which was used to evaluate LV-GLS (Figures 1D–F). Each wall of the left ventricle was automatically divided into three equal segments (basal, mid, and apical), producing strain values for 18 segments (Figures 1D–F). Subjects with poor image quality, inadequate border tracking, foreshortened views, or missing images were excluded from the analysis.
Left atrial strain was measured using the apical two-chamber and four-chamber views. The zero baseline of the left atrial strain curve was set at left ventricular end-diastole using R–R ECG gating. The endocardial border of the left atrium was manually traced at both left ventricular end-diastole and end-systole, and the average of three consecutive measurements was recorded (Figures 1G–I). Individuals with poor image quality, inadequate border tracking, foreshortened views, or missing images were excluded from the analysis.
The three components of left atrial function were evaluated:
Left atrial strain during the reservoir phase (LASR) corresponds to left ventricular systole.
Left atrial strain during the conduit phase (LASCD) is measured from mitral valve opening to the onset of the P wave.
Left atrial strain during the contraction phase (LASCT) is measured from the onset of the P wave to mitral valve closure.
These components were compared in the study.
2.3.4 Statistical methods
Statistical analysis was performed using SAS JMP 10.0 software. The normality of data distribution was tested using the Kolmogorov–Smirnov test. Normally distributed data were expressed as mean ± standard deviation (SD). For comparisons among the three groups, one-way analysis of variance (ANOVA) was used. When significant differences were found, pairwise comparisons were conducted using the least significant difference (LSD) method. Non-normally distributed data were described using median and interquartile range (IQR), and group comparisons were made using the Kruskal–Wallis test. Pairwise comparisons of non-normally distributed data were conducted using the Steel–Dwass test. Categorical variables were presented as frequencies and percentages, and comparisons among groups were conducted using the chi-square test. Logistic regression analysis was used to identify factors influencing hypertensive remodeling. For normally distributed variables, Pearson correlation coefficients and corresponding P-values were calculated; for non-normally distributed variables, Spearman correlation coefficients and p-values were used. Correlation analysis was conducted for variables in the IBSH group. A two-sided P < 0.05 was considered statistically significant for all analyses.
3 Results
3.1 Comparison of clinical data
No significant differences in gender or age were observed among the three groups (all P > 0.05). Compared with the control group, both the IBSH and LVH groups showed significantly higher SBP, DBP, blood glucose, blood lipid levels, body mass index (BMI), and B-type natriuretic peptide (BNP) concentrations (all P < 0.05). No significant differences were found between the IBSH and LVH groups in these variables (all P > 0.05). In addition, the proportion of patients adhering to regular antihypertensive medication use was significantly higher in the IBSH group than in the LVH group (P < 0.05) (see Table 1 for details).
Table 1
| Index | Controls (n = 70) | LVH (n = 70) | IBSH (n = 70) | F/H | P |
|---|---|---|---|---|---|
| Gender (male) [example (%)] | 37 (52.86%) | 40 (57.14%) | 39 (55.71%) | 0 | 1.000 |
| Age | 56.49 ± 11.87 | 58.81 ± 8.53 | 59.67 ± 10.85 | 1.722 | 0.181 |
| Hypertensive years | – | 8.00 (3.75, 14.00) | 9.00 (3.00, 15.25) | 0.071 | 0.943 |
| Take medication regularly (yes) | – | 40 (57.14%) | 57 (81.43%) | 9.700 | 0.002 |
| BMI | 23.00 (21.00, 26.00) | 27.00 (24.00, 29.00)a | 26.00 (23.75, 28.00)a | 22.757 | <0.001 |
| FBG | 5.40 (5.10, 5.72) | 5.75 (5.30, 6.73)a | 5.80 (5.30, 6.23)a | 21.22 | <0.001 |
| TG | 1.12 (0.68, 2.32) | 1.51 (1.04, 2.15) | 1.46 (1.02, 2.04) | 0.294 | 0.071 |
| TCHO | 4.00 (3.32, 4.54) | 4.45 (3.62, 5.11)a | 4.06 (3.43, 4.60) | 9.587 | 0.008 |
| HDL | 1.24 (0.96, 1.44) | 0.97 (0.83, 1.12)a | 1.00 (0.87, 1.14)a | 31.875 | <0.001 |
| LDL | 2.46 (2.08, 2.95) | 2.85 (2.36, 3.25)a | 2.62 (2.10, 3.12) | 8.825 | 0.012 |
| SBP | 120.00 (115.00, 125.00) | 143.50 (127.00, 157.75)a | 139.00 (129.75, 150.25)a | 81.841 | <0.001 |
| DBP | 76.00 (71.75, 80.00) | 86.00 (76.00, 102.50)a | 84.50 (76.00, 90.00)a | 35.280 | <0.001 |
| BNP | 41.70 (23.33, 75.58) | 78.95 (33.73, 144.75)a | 75.80 (33.83, 138.25)a | 18.705 | <0.001 |
General clinical data of control group, LVH group, and IBSH group [(), n (%), M (Q25, Q75)].
BMI, ballistic missile intercept; FBG, fasting blood glucose; TG, triglyceride; TCHO, total cholesterol; HDL, high-density lipoprotein; LDL, low-density lipoprotein; SBP, systolic blood pressure; DBP, diastolic blood pressure; BNP, brain natriuretic peptide.
Versus controls, P < 0.05.
Versus LVH, P < 0.05.
Multivariate regression analysis of SBP, DBP, blood glucose, blood lipids, BMI, and BNP identified fasting blood glucose (FBG) as a common risk factor for both the IBSH and LVH groups [odds ratio (OR) = 3.204, 95% confidence interval (CI): 1.454–7.061; OR = 5.080, 95% CI: 2.012–12.824]. BMI was identified as an independent risk factor for the LVH group (OR = 1.226, 95% CI: 1.087–1.382), while high-density lipoprotein (HDL) was a common protective factor for both the IBSH and LVH groups (OR = 0.091, 95% CI: 0.019–0.448; OR = 0.031, 95% CI: 0.005–0.185) (all P < 0.05\) (see Table 2 for details).
Table 2
| Index | β | SE | Wald χ2 | P | OR (95%CI) |
|---|---|---|---|---|---|
| IBSH | |||||
| Constant | −6.916 | 2.802 | 6.091 | 0.014 | |
| BMI | 0.122 | 0.063 | 3.785 | 0.052 | 1.130 (0.999–1.279) |
| FBG | 1.164 | 0.403 | 8.341 | 0.004 | 3.204 (1.454–7.061) |
| HDL | −2.392 | 0.811 | 8.712 | 0.002 | 0.091 (0.019–0.448) |
| LVH | |||||
| Constant | −10.653 | 3.292 | 10.473 | 0.002 | |
| BMI | 0.203 | 0.061 | 11.047 | <0.001 | 1.226 (1.087–1.382) |
| FBG | 1.625 | 0.472 | 11.832 | <0.001 | 5.080 (2.012–12.824) |
| HDL | −3.460 | 0.906 | 14.601 | <0.001 | 0.031 (0.005–0.185) |
Logistic regression analysis of factors influencing left ventricular remodeling.
After conducting a comparative analysis of the antihypertensive medications used by patients in the IBSH group and the LVH group, the statistical test results indicated that there was no statistically significant difference in the types or regimens of antihypertensive drugs between the two groups of patients (P > 0.05) (see Table 3 for details).
Table 3
| Hypertension medication | LVH (n = 70) | IBSH (n = 70) | χ 2 | P |
|---|---|---|---|---|
| β-Blockers + CCB + diuretics | 3 (4.3) | 1 (1.4) | 0.257 | 0.612 |
| ARB + CCB + diuretics | 13 (18.6) | 12 (17.1) | 0.049 | 0.825 |
| β-Blockers + ARBs | 18 (25.7) | 15 (21.4) | 0.357 | 0.550 |
| β-Blockers + CCB | 4 (5.7) | 2 (2.9) | 0.174 | 0.676 |
| ARB + diuretics | 2 (2.9) | 3 (4.3) | 0.000 | >0.999 |
| CCB + diuretics | 4 (5.7) | 5 (7.1) | 0.000 | >0.999 |
| β-Blockers | 3 (4.3) | 2 (2.9) | 0.000 | >0.999 |
| Diuretics | 2 (2.9) | 4 (5.7) | 0.174 | 0.676 |
| CCB | 9 (12.9) | 12 (17.1) | 0.504 | 0.478 |
| ARB | 12 (17.1) | 14 (20.0) | 0.189 | 0.664 |
Analysis of differences in antihypertensive drugs between the IBSH group and the LVH group [(), M (Q25, Q75)].
β-Blockers, beta-adrenoceptor antagonist; ARBs, angiotensin II receptor blockers; CCB, calcium channel blockers.
Versus LVH, P < 0.05.
3.2 Comparison of left ventricular cavity size and function
Compared with the control group, both the IBSH and LVH groups showed increased IVSD, LVSBD, RWT, and LVMI (P < 0.01). In comparisons between the IBSH and LVH groups, the IBSH group had significantly lower LVSd, LVSBD, RWT, and LVMI (P < 0.01). Both the IBSH and LVH groups exhibited reduced GLS and GCS compared with the control group, with a statistically significant reduction in GLS in the LVH group (P < 0.01). GRS was increased in both groups (P < 0.01). Compared with the LVH group, the IBSH group had higher GLS, GCS, and GRS, with a significant difference observed in GLS (P < 0.01). Compared with the control group, the IBSH group showed significantly higher E and E/A ratio, while atrial contraction velocity (A) was significantly lower (P < 0.01). In intergroup comparisons, the IBSH group had significantly higher A values and lower E/A ratios compared with the LVH group (P < 0.01) (see Table 4 and Figures 2F for details).
Figure 2
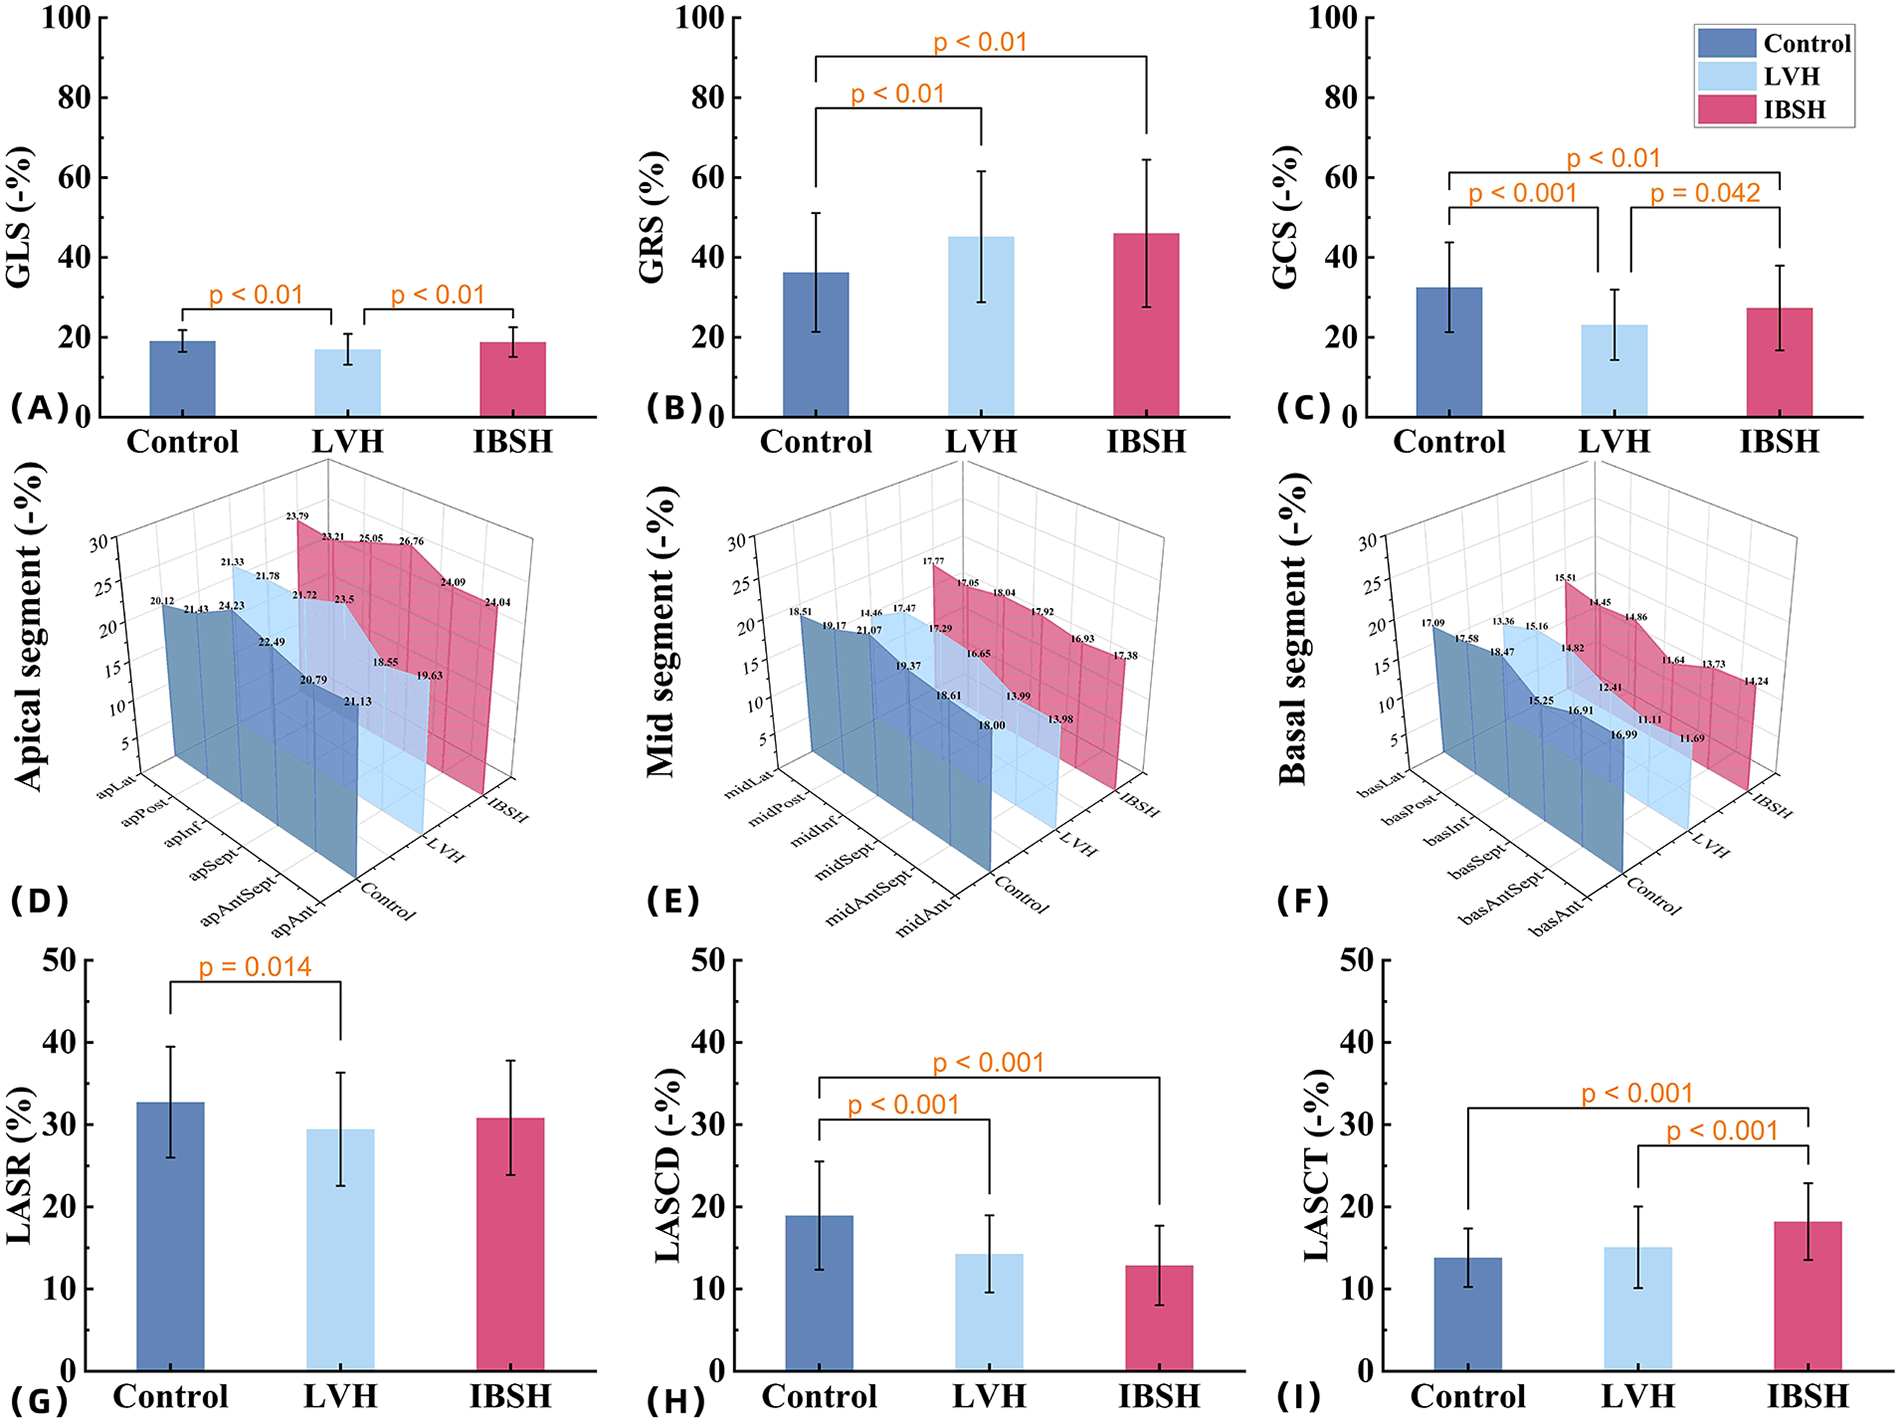
(A–C) The comparisons among the control group, LVH group, and IBSH group for GLS, GRS, and GCS, respectively. (D–F) The comparisons among the control group, LVH group, and IBSH group for the apical segment, mid-segment, and basal segment, respectively. (G–I) The comparisons among the control group, LVH group, and IBSH group for LASR, LASCD, and LASCT, respectively. All abbreviations are consistent with those in Tables 4 and 6.
Table 4
| Index | Controls (n = 70) | LVH (n = 70) | IBSH (n = 70) | F/H | P |
|---|---|---|---|---|---|
| LVSd | 0.80 (0.80, 0.83) | 1.20 (1.20, 1.30)a | 1.00 (0.90, 1.00)a,b | 174.604 | <0.001 |
| LVSBD | 0.80 (0.80, 0.83) | 1.20 (1.20, 1.30)a | 1.50 (1.40, 1.60)a,b | 190.153 | <0.001 |
| LVPWd | 0.80 (0.70, 0.80) | 1.20 (1.18, 1.20)a | 0.90 (0.80, 1.00)a,b | 166.456 | <0.001 |
| RWT | 0.34 (0.33, 0.36) | 0.51 (0.49, 0.52)a | 0.41 (0.38, 0.43)a,b | 176.192 | <0.001 |
| LVEDV | 103.00 (95.00, 108.00) | 103.00 (97.25, 113.00) | 95.00 (90.00, 100.50)a,b | 22.476 | <0.001 |
| LVESV | 39.00 (37.75, 41.00) | 41.50 (40.00, 43.00)a | 38.00 (37.00, 40.00)a,b | 49.863 | <0.001 |
| LVMI | 79.98 (75.25, 85.22) | 139.38 (133.86, 145.18)a | 101.41 (91.73, 111.36)a,b | 175.041 | <0.001 |
| LVEF | 62.00 (59.00, 63.00) | 60.00 (59.00, 62.00)a | 60.00 (59.00, 62.00)a | 11.300 | 0.004 |
| GLS | −19.11 ± 2.72 | −16.90 ± 4.01a | −18.89 ± 3.69b | 8.358 | <0.001 |
| GCS | −32.61 (−40.24, −21.40) | −22.59 (−29.24, −15.75)a | −25.59 (−33.65, −17.73) | 22.908 | <0.001 |
| GRS | 34.24 (23.13, 46.64) | 40.56 (31.06, 52.11) | 45.92 (32.34, 57.34)a | 11.006 | 0.004 |
| E | 0.79 (0.67, 0.90) | 0.66 (0.61, 0.76)a | 0.62 (0.55, 0.72)a | 36.821 | <0.001 |
| A | 0.67 (0.55, 0.78) | 0.74 (0.67, 0.82)a | 0.81 (0.72, 0.88)a,b | 29.336 | <0.001 |
| E/A | 1.36 (0.84, 1.55) | 0.86 (0.81, 0.92)a | 0.76 (0.68, 0.83)a,b | 60.548 | <0.001 |
| E/e′ | 8.66 (7.49, 9.90) | 9.18 (8.73, 10.13) | 9.29 (8.19, 10.25) | 5.782 | 0.056 |
| Peak TR velocity | 2.10 (1.91, 2.32) | 2.32 (2.10, 2.45)a | 2.24 (2.00, 2.4) | 13.725 | 0.001 |
Analysis results of left ventricular size and function difference among the control group, LVH group, and IBSH group [(), M (Q25, Q75)].
LVSd, left ventricular septal end-diastolic thickness; LVSBD, left ventricular septal basal-segment end-diastolic thickness; LVPWd, left ventricular posterior wall end-diastolic thickness; LVEDV, left ventricular end-diastolic volume; LVESV, left ventricular end-systolic volume; RWT, relative wall thickness; LVEF, left ventricular ejection fraction; LVMI, left ventricular mass index; GLS, global longitudinal strain; GCS, global circumferential strain; GRS, global radial strain; E, early diastolic transmitral inflow velocity; A, after diastolic transmitral inflow velocity.
Versus controls, P < 0.05.
Versus LVH, P < 0.05.
In the 18-segment strain analysis of the left ventricle, compared with the control group, myocardial strain in both the LVH and IBSH groups showed a progressive decrease from the apex to the base. A significant reduction was observed in the basal segments, especially in the anterior and posterior septum of the IBSH group (see Table 5 and Figures 2D-F for details).
Table 5
| Index | Controls (n = 70) | LVH (n = 70) | IBSH (n = 70) | F/Z | P |
|---|---|---|---|---|---|
| apAnt | −21.13 ± 6.23 | −19.63 ± 8.56a | −24.04 ± 8.56 | 5.638 | 0.004 |
| apAntSept | −20.79 (−24.61, −16.28) | −18.55 (−26.56, −13.22) | −24.09 (−29.26, −15.53) | 5.730 | 0.057 |
| apSept | −22.49 ± 5.51 | −23.50 ± 6.20a | −26.76 ± 6.27b | 9.600 | <0.001 |
| apInf | −24.23 ± 5.10 | −21.72 ± 7.61a | −25.05 ± 7.42 | 4.544 | 0.012 |
| apPost | −21.43 ± 4.49 | −21.78 ± 8.68 | −23.21 ± 8.35 | 1.129 | 0.325 |
| apLat | −20.12 ± 7.05 | −21.33 ± 6.79b | −23.79 ± 7.22b | 4.916 | 0.008 |
| midAnt | −18.00 ± 5.60 | −13.98 ± 7.13a,b | −17.38 ± 7.27 | 7.262 | <0.001 |
| midAntSept | −18.61 ± 5.71 | −13.99 ± 6.94a.b | −16.93 ± 7.64 | 8.254 | <0.001 |
| midSept | −19.37 ± 3.04 | −16.65 ± 4.53b | −17.92 ± 4.44 | 7.873 | <0.001 |
| midInf | −21.07 ± 4.39 | −17.29 ± 5.15b | −18.04 ± 4.46b | 12.78 | <0.001 |
| midPost | −19.17 ± 4.57 | −17.47 ± 5.35 | −17.05 ± 5.13b | 3.469 | 0.033 |
| midLat | −18.51 (−21.72, −13.85) | −14.46 (−18.62, −11.32)b | −17.77 (−21.43, −11.12) | 8.783 | 0.012 |
| basAnt | −16.99 (−19.83, −14.45) | −11.69 (−15.11, −6.38)b | −14.24 (−17.90, −9.56)b | 26.846 | <0.001 |
| basAntSept | −16.91 ± 5.49 | −11.11 ± 6.18b | −13.73 ± 6.93b | 15.204 | <0.001 |
| basSept | −15.25 (−17.87, −12.98) | −12.41 (−15.07, −9.64)b | −11.64 (−15.07, −8.78)b | 37.110 | <0.001 |
| basInf | −18.47 ± 4.55 | −14.82 ± 4.56b | −14.86 ± 4.45b | 15.046 | <0.001 |
| basPost | −17.58 ± 5.24 | −15.16 ± 4.82b | −14.45 ± 5.00b | 7.471 | <0.001 |
| basLat | −17.09 (−20.48, −13.07) | −13.36 (−16.92, −8.33)b | −15.51 (−19.50, −10.32) | 14.526 | <0.001 |
Analysis results of 18-segment differences of left ventricular strain in control group, LVH group, and IBSH group [(), M (Q25, Q75)].
Versus LVH, P < 0.05.
Versus controls, P < 0.05.
3.3 Comparison of left atrial size and function
Compared with the control group, both the IBSH and LVH groups showed significant increases in LAVmax, LAVmin, LAVpreA, LAVI, and LACI (all P < 0.01), while LATEF was significantly reduced (P < 0.01). No significant differences were observed between the IBSH and LVH groups (P > 0.05). Compared with the control group, left atrial strain during the reservoir phase (LASR) and LAS during the conduit phase (LASCD) were reduced in both IBSH and LVH groups, while left atrial strain during the contraction phase left atrial contraction strain (LASCT) was increased in the IBSH group. LASCD and LASCT showed statistically significant differences (all P < 0.01). In comparisons between IBSH and LVH groups, LASCT was significantly higher in the IBSH group (P < 0.01) (see Table 6 and Figure 2I for details).
Table 6
| Index | Controls (n = 70) | LVH (n = 70) | IBSH (n = 70) | F/H | P |
|---|---|---|---|---|---|
| LAVmax | 32.00 (27.00, 40.00) | 46.00 (38.75, 59.00)a | 41.50 (35.00, 48.25)a | 42.248 | <0.001 |
| LAVmin | 11.00 (9.00, 14.00) | 17.00 (13.75, 22.00)a | 15.50 (11.00, 18.00)a | 45.738 | <0.001 |
| LAVpreA | 22.00 (18.00, 30.25) | 35.00 (26.75, 38.75)a | 30.00 (24.00, 36.50)a | 35.729 | <0.001 |
| LATEF | 66.00 (64.00, 68.00) | 63.50 (60.75, 67.00)a | 64.00 (60.00, 66.25)a | 18.409 | <0.001 |
| LAAEF | 51.00 (43.75, 58.25) | 47.00 (41.00, 52.25) | 49.00 (42.00, 55.00) | 4.442 | 0.109 |
| LAPEF | 29.69 ± 14.25 | 29.53 ± 9.65 | 28.96 ± 10.23 | 0.077 | 0.926 |
| LAVI | 20.73 (18.64, 25.00) | 24.93 (21.41, 28.36)a | 23.09 (19.54, 29.41) | 17.701 | <0.001 |
| LACI | 11.00 (9.00, 13.00) | 17.00 (13.00, 22.00)a | 15.00 (12.00, 20.00)a | 45.76 | <0.001 |
| LASR | 32.74 ± 6.74 | 29.44 ± 6.89a | 30.84 ± 6.95 | 4.077 | 0.018 |
| LASCD | 18.00 (14.00, 18.00) | 14.00 (11.00, 16.25)a | 12.50 (10.00, 15.25)a | 37.156 | <0.001 |
| LASCT | 13.00 (11.00, 16.00) | 13.00 (11.00, 18.25) | 18.00 (14.00, 21.00)a,b | 37.732 | <0.001 |
Analysis results of the difference of left atrial size and function among different groups in the control group, LVH group, and IBSH group [(), M (Q25, Q75)].
LAVmax, left atrial volume max; LAVmin, left atrial volume min; LAVpreA, left atrial volume preA; LATEF, left atrial total ejection fraction; LAAEF, left atrial active ejection fraction; LAVI, left atrial volume index; LACI, left atrioventricular coupling index; LASR, left atrial reservoir strain; LASCD, left atrial conduit strain; LASCT, left atrial contraction strain.
Versus controls, P < 0.05.
Versus LVH, P < 0.05.
3.4 Correlation analysis among variables in the IBSH group
In the IBSH group, LVMI was negatively correlated with LVEF, GRS, and GCS (r = −0.92, r = −0.95, r = −0.87; all P < 0.05). LACI was positively correlated with LAVI (r = 0.73, P < 0.05). LASR was positively correlated with GLS, E, and E/A but negatively correlated with the ratio of early diastolic mitral inflow velocity to early diastolic mitral annular velocity (E/e′) (r = 0.58, r = 0.96, r = 0.92, r = −0.94; all P < 0.05). LASCD was negatively correlated with E and E/A and positively correlated with E/e′ (r = −0.49, r = −0.45, r = 0.47; all P < 0.05). LASCT was also negatively correlated with E and E/A and positively correlated with E/e′ (r = −0.53, r = −0.47, r = 0.59; all P < 0.05) (see Figure 3 for details).
Figure 3
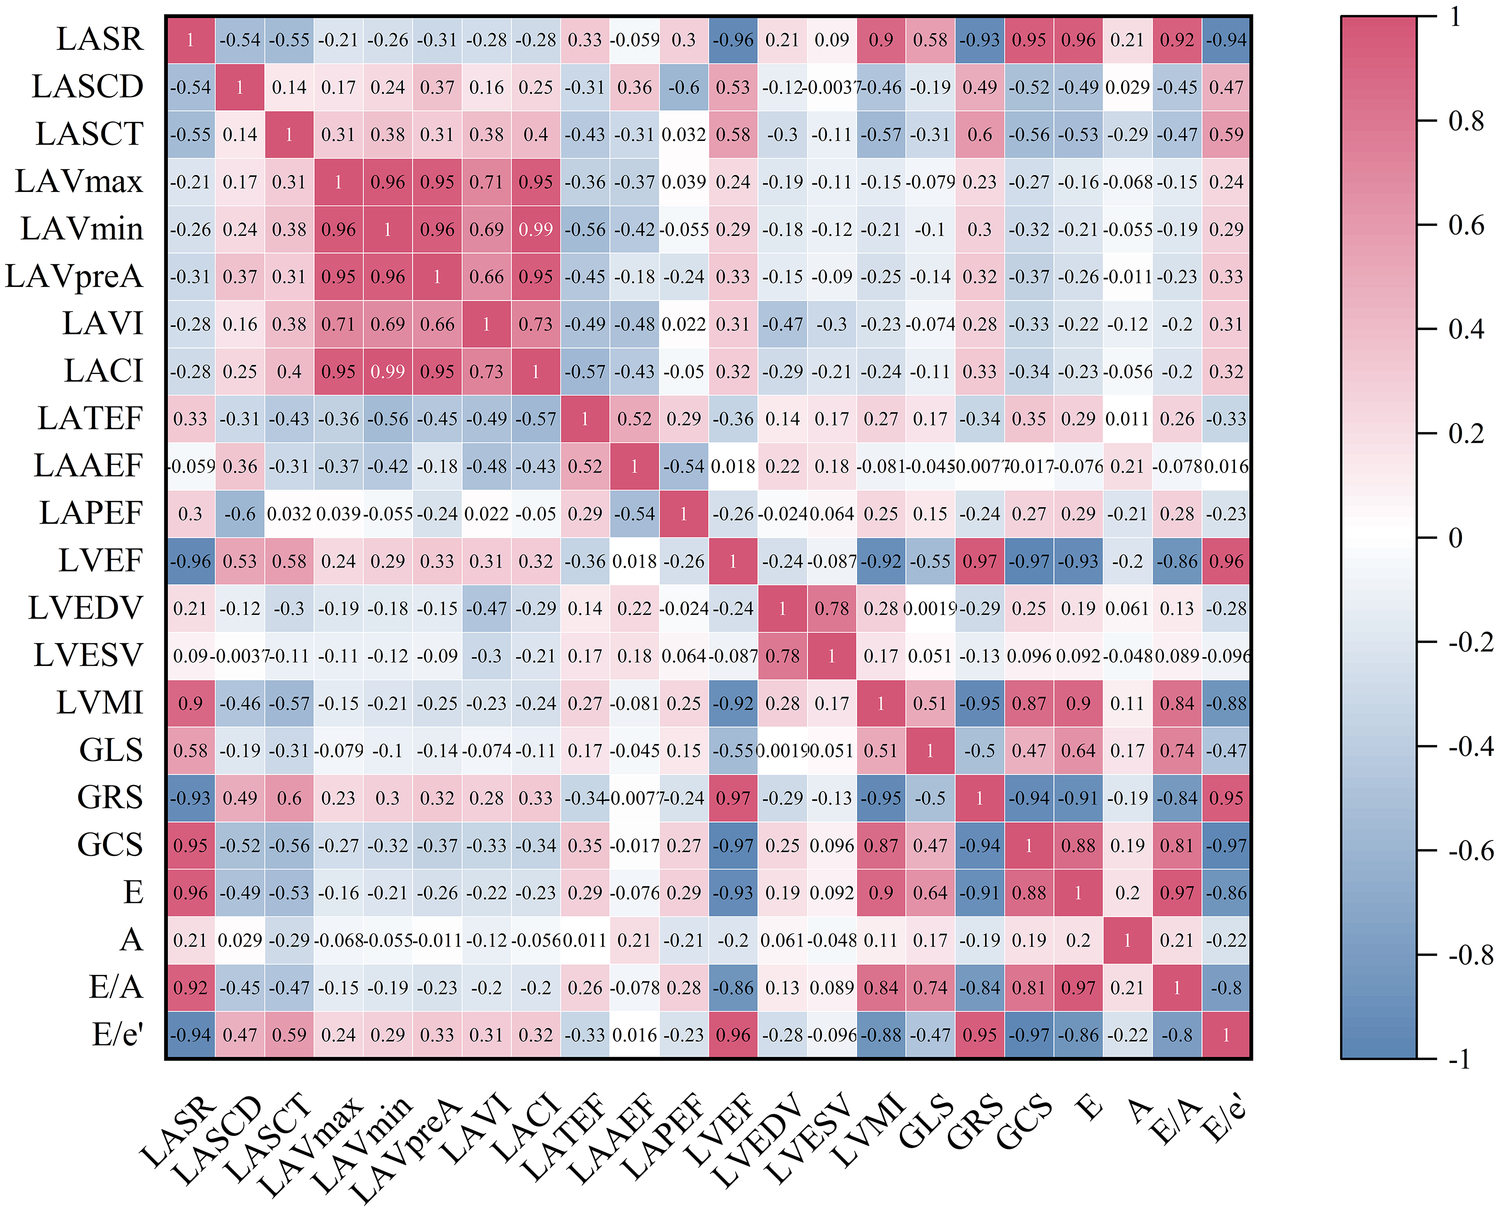
The heatmap represents the correlation analysis among various variables in the IBSH group. The color shading in each cell corresponds to the magnitude and direction of the correlation coefficient, with red indicating a positive correlation and blue indicating a negative correlation. The numerical value within each cell represents the bivariate correlation coefficient. All abbreviations are consistent with those in Tables 4 and 6.
4 Discussion
Our study confirmed that both the LVH and IBSH groups exhibited significant abnormalities in blood pressure, blood glucose, blood lipids, BMI, and BNP levels. Multivariate regression analysis indicated that elevated blood glucose was a common risk factor for both groups. BMI emerged as an independent risk factor specifically in the LVH group, whereas HDL was identified as a protective factor common to both the IBSH and LVH groups. These factors, along with hypertension, had varying effects on left ventricular remodeling, consistent with previous studies (11, 12).
Additionally, LVMI, a marker of left ventricular remodeling, was significantly increased in both the IBSH and LVH groups, with a greater increase observed in the LVH group. Stratified analysis showed that the proportion of patients regularly using antihypertensive medication was higher in the IBSH group than that in the LVH group, suggesting that consistent use of antihypertensive drugs may influence ventricular remodeling in the IBSH group. However, no statistically significant difference was observed between the two groups in terms of the types or regimens of antihypertensive drugs used. This observation has not been previously reported and requires further research for confirmation.
Indicators of early left ventricular systolic function, including GLS and GCS, showed a decreasing trend in both the IBSH and LVH groups. Long-term elevation in afterload resulted in varying degrees of systolic dysfunction in both groups, with more severe impairment in the LVH group. The IBSH group showed a significant increase in GRS due to compensatory mechanisms (see Figure 2B), which may have contributed to the preservation of systolic function, consistent with previous findings (13).
In the 18-segment analysis of systolic mechanics, the IBSH group showed increased myocardial strain only in the apical segment, while the other segments exhibited reduced strain, with the most notable decrease in the anterior and posterior septum of the basal segment (see Figures 2D–F). In contrast, the LVH group demonstrated extensive impairment across all segments. This pattern is related to the uneven distribution of wall stress in hypertension, where stress progressively increases from the apex to the base (14). These findings suggest that damage in the basal segments may be partially compensated for by functional reserve in the apical segment. This redistribution is closely associated with myocardial remodeling and appears more evident in IBSH patients (15).
Previous studies have shown that left atrial size is closely related to left ventricular filling pressure (16). LACI is a crucial metric for evaluating the functional coupling between the left atrium and the left ventricle. Studies have reported that a higher LACI reflects greater imbalance between left atrial and left ventricular volumes, indicating more severe impairment of coupling function (17). In this study, LACI was significantly increased in both the IBSH and LVH groups compared with the control group. However, myocardial impairment was less severe in the IBSH group than in the LVH group, suggesting that although atrioventricular coupling was impaired in IBSH, compensatory mechanisms may have helped preserve myocardial function.
The findings of this study indicate that both the IBSH and LVH groups exhibited significantly lower LASR and LASCD in the LA compared with the control group (18). However, LASCT showed a compensatory increase in the IBSH group, while it was significantly lower in the LVH group compared with the IBSH group. Otani et al. (19) reported that LASCT increases compensatorily in patients with mild to moderate diastolic dysfunction (see Figures 2G–I), which is consistent with the compensatory increase in left ventricular GRS. Therefore, the enhancement of LASCT may function as a regulatory mechanism for impaired left ventricular filling in the IBSH group (20).
This study found that the reduction in LASR was associated with impaired GLS (see Figure 3), indicating that the decline in left atrial function is linked to the secondary effects of persistently elevated left ventricular volume and pressure overload (21). As a result, left ventricular diastolic function was impaired in both the LVH and IBSH groups. Moreover, LASR, LASCD, and LASCT in the IBSH group were correlated with E, E/A, and E/e′, which are indicators of left ventricular diastolic function (see Figure 3), further suggesting that diastolic dysfunction in the IBSH group may contribute to reduced left atrial function.
5 Limitations
This study has certain limitations. Firstly, it is a single-center design, making it difficult to avoid inherent selection bias. Secondly, it may be subject to admission rate bias and misclassification bias. Finally, the sample size is relatively limited, and future validation through longer-term follow-up and larger-scale samples is still required.
6 Conclusions
This study reveals a potential association between regular antihypertensive medication use and cardiac remodeling in patients with IBSH, offering new research directions for understanding the pathophysiological mechanisms of hypertension combined with myocardial hypertrophy. By analyzing changes in global and regional left atrioventricular myocardial function, the study identified the basal septal segment as the most significantly impaired region and confirmed the existence of a compensatory redistribution mechanism in myocardial mechanics. This finding enriches research in the field of cardiac remodeling and provides an important theoretical basis for further exploration of hypertensive heart disease and myocardial compensatory mechanisms.
Statements
Data availability statement
The original contributions presented in the study are included in the article/Supplementary Material, further inquiries can be directed to the corresponding author/s.
Ethics statement
The studies involving humans were approved by the Medical Ethics Committee of the First Affiliated Hospital of Xinjiang Medical University. During the research, the researchers adhered to the Declaration of Helsinki. The studies were conducted in accordance with local legislation and institutional requirements. The ethics committee/institutional review board waived the requirement of written informed consent for participation from the participants or their legal guardians/next kin. Written informed consent was not obtained from the individual(s) for the publication of any potentially identifiable images or data included in this article.
Author contributions
HJ: Data curation, Investigation, Formal analysis, Writing – original draft. TM: Writing – review & editing, Conceptualization. XH: Conceptualization, Writing – review & editing. JN: Writing – review & editing, Conceptualization. SQ: Writing – review & editing, Conceptualization. YM: Writing – review & editing, Conceptualization, Methodology. LG: Project administration, Conceptualization, Methodology, Writing – review & editing.
Funding
The author(s) declared that financial support was received for this work and/or its publication. The research was supported by the Tianshan Meritocrat Project for Cultivating High_Level Talents in Medicine and Health Care in the Xinjiang Uygur Autonomous Region (Grant Recipient: Linnan Guan; Grant No. TSYC202301B002) and the Outstanding Talent and Innovation Team Project of the First Affiliated Hospital of Xinjiang Medical University (Grant Recipient: Linnan Guan; Grant No. cxtd202424), which provided support for clinical sample collection and storage, patient data management, and stipends for graduate research assistants.
Conflict of interest
The author(s) declared that this work was conducted in the absence of any commercial or financial relationships that could be construed as a potential conflict of interest.
Generative AI statement
The author(s) declared that generative AI was not used in the creation of this manuscript.
Any alternative text (alt text) provided alongside figures in this article has been generated by Frontiers with the support of artificial intelligence, and reasonable efforts have been made to ensure accuracy, including review by the authors wherever possible. If you identify any issues, please contact us.
Publisher’s note
All claims expressed in this article are solely those of the authors and do not necessarily represent those of their affiliated organizations, or those of the publisher, the editors and the reviewers. Any product that may be evaluated in this article, or claim that may be made by its manufacturer, is not guaranteed or endorsed by the publisher.
Glossary
- 2D-STI
two-dimensional speckle-tracking imaging
- ASE
American Society of Echocardiography
- A
late diastolic transmitral inflow velocity
- BMI
ballistic missile intercept
- BNP
brain natriuretic peptide
- DBP
diastolic blood pressure
- E
early diastolic transmitral inflow velocity
- E′
early diastolic transmitral inflow
- EAE
European Association of Echocardiography
- EACVI
European Association of Cardiovascular Imaging
- FBG
fasting blood glucose
- GLS
global longitudinal strain
- GCS
global circumferential strain
- GRS
global radial strain
- HDL
high-density lipoprotein
- IBSH
isolated basal septal hypertrophy
- LACI
left atrioventricular coupling index
- LDL
low-density lipoprotein
- LV
left ventricle
- LA
left atrial
- LVH
left ventricular hypertrophy
- LVMI
left ventricular mass index
- LAVI
left atrial volume index
- LACI
left atrioventricular coupling index
- LASR
left atrial reservoir strain
- LASCD
left atrial conduit strain
- LASCT
left atrial contraction strain
- LVEF
left ventricular ejection fraction
- LVSBD
left ventricular septal basal-segment end-diastolic thickness
- LVSd
left ventricular septal end-diastolic thickness
- LVDd
left ventricular diameter diastolic
- LVDs
left ventricular diameter systolic
- LVPWd
left ventricular posterior wall end-diastolic thickness
- LVEDV
left ventricular end-diastolic volume
- LVESV
left ventricular end-systolic volume
- LVEDd
left ventricle end-diastolic diameter
- LAAD
left atrial end-diastolic dimension
- LAVmax
left atrial volume max
- LAVmin
left atrial volume min
- LAVpreA
left atrial volume preA
- LATEF
left atrial total ejection fraction
- LAAEF
left atrial active ejection fraction
- LAPEF
left atrial passive ejection fraction
- RWT
relative wall thickness
- SBP
systolic blood pressure
- TG
triglyceride
- TCHO
total cholesterol
- TDI
tissue Doppler imaging.
References
1.
Diaz T Pencina MJ Benjamin EJ Aragam J Fuller DL Pencina KM et al Prevalence, clinical correlates, and prognosis of discrete upper septal thickening on echocardiography: the framingham heart study. Echocardiography. (2009) 26(3):247–53. 10.1111/j.1540-8175.2008.00806.x
2.
Bogaert J Rademakers FE . Regional nonuniformity of normal adult human left ventricle. Am J Physiol Heart Circ Physiol. (2001) 280:H610–20. 10.1152/ajpheart.2001.280.2.H610
3.
Santos M Shah AM . Alterations in cardiac structure and function in hypertension. Curr Hypertens Rep. (2014) 16(5):428. 10.1007/s11906-014-0428-x
4.
Baltabaeva A Marciniak M Bijnens B Moggridge J He FJ Antonios TF et al Regional leftventricular deformation and geometry analysis provides insights in myocardial remodelling inmild to moderate hypertension. Eur J Echocardiogr. (2008) 9(4):501–8. 10.1016/j.euje.2007.08.004
5.
Loncaric F Nunno L Mimbrero M Marciniak M Fernandes JF Tirapu L et al Basal ventricular septal hypertrophyin systemic hypertension. Am J Cardiol. (2020) 125(9):1339–46. 10.1016/j.amjcard.2020.01.045
6.
Geyer H Caracciolo G Abe H Wilansky S Carerj S Gentile F et al Assessment of myocardial mechanics using speckle tracking echocardiography: fundamentals and clinical applications. J Am Soc Echocardiogr. (2010) 23(4):351–69; quiz 453-5. 10.1016/j.echo.2010.02.015
7.
Yuda S . Current clinical applications of speckle tracking echocardiography for assessment of left atrial function. J Echocardiogr. (2021) 19:129–40. 10.1007/s12574-021-00519-8
8.
Lang RM Badano LP Mor-Avi V Afilalo J Armstrong A Ernande L et al Recommendations for cardiac chamber quantification by echocardiography in adults: an update from the American society of echocardiography and the European association of cardiovascular imaging. J Am Soc Echocardiogr. (2015) 28(1):1–39.e14. 10.1016/j.echo.2014.10.003
9.
Nagueh SF Sanborn DY Oh JK Anderson B Billick K Derumeaux G et al Recommendations for the evaluation of left ventricular diastolic function by echocardiography and for heart failure with preserved ejection fraction diagnosis: an update from the American societyof echocardiography. J Am Soc Echocardiogr. (2025) 38(7):537–69. 10.1016/j.echo.2025.03.011
10.
Mitchell C Rahko PS Blauwet LA Canaday B Finstuen JA Foster MC et al Guidelines for performing a comprehensive transthoracic echocardiographic examination in adults: recommendations from the American society of echocardiography. J Am Soc Echocardiogr. (2019) 32(1):1–64. 10.1016/j.echo.2018.06.004
11.
Mahabadi AA Lehmann N Kälsch H Bauer M Dykun I Kara K et al Association of epicardial adipose tissue and left atrial size on non-contrast CT with atrial fibrillation: the HeinzNixdorf recall study. Eur Heart J Cardiovasc Imaging. (2014) 15(8):863–9. 10.1093/ehjci/jeu006
12.
Ormazabal V Nair S Elfeky O Aguayo C Salomon C Zuñiga FA . Association between insulin resistance and the development of cardiovascular disease. Cardiovasc Diabetol. (2018) 17(1):122. 10.1186/s12933-018-0762-4
13.
de Simone G Di Lorenzo L Costantino G Moccia D Buonissimo S de Divitiis O . Supernormal contractility in primary hypertension without left ventricular hypertrophy. Hypertension. (1988) 11(5):457–63. 10.1161/01.hyp.11.5.457
14.
Büchi M Hess OH Murakami T Krayenbuehl HP . Left ventricular wall stress distribution in chronic pressure and volume overload: effect of normal and depressed contractility on regional stress-velocity relations. Basic Res Cardiol. (1990) 85:367–83. 10.1007/BF01907129
15.
Loncaric F Marciniak M Nunno L Mimbrero M Fernandes JF Fabijanovic D et al Distribution of myocardial work in arterial hypertension: insights from non-invasive left ventricular pressure-strain relations. Int J Cardiovasc Imaging. (2021) 37(1):145–54. 10.1007/s10554-020-01969-4
16.
Hammoudi N Achkar M Laveau F Boubrit L Djebbar M Allali Y et al Left atrial volume predicts abnormal exercise left ventricular filling pressure. Eur J Heart Fail. (2014) 16(10):1089–95. 10.1002/ejhf.131
17.
Pezel T Venkatesh BA De Vasconcellos HD Kato Y Shabani M Xie E et al Left atrioventricular coupling Index as a prognostic marker of cardiovascular events: the MESA study. Hypertension. (2021) 78(3):661–71. 10.1161/HYPERTENSIONAHA.121.17339
18.
Jarasunas J Aidietis A Aidietiene S . Left atrial strain-an early marker of left ventricular diastolic dysfunction in patients with hypertension and paroxysmal atrial fibrillation. Cardiovasc Ultrasound. (2018) 16(1):29. 10.1186/s12947-018-0147-6
19.
Otani K Takeuchi M Kaku K Haruki N Yoshitani H Tamura M et al Impact of diastolicdysfunction grade on left atrial mechanics assessed by two-dimensional speckle tracking echocardiography. J Am Soc Echocardiogr. (2010) 23(9):961–7. 10.1016/j.echo.2010.06.023
20.
Prioli A Marino P Lanzoni L Zardini P . Increasing degrees of left ventricular filling impairment modulate left atrial function in humans. Am J Cardiol. (1998) 82(6):756–61. 10.1016/s0002-9149(98)00452-4
21.
Ersbøll M Andersen MJ Valeur N Mogensen UM Waziri H Møller JE et al The prognostic value of left atrial peak reservoir strain in acute myocardial infarction is dependent on left ventricular longitudinal function and left atrial size. Circ Cardiovasc Imaging. (2013) 6(1):26–33. 10.1161/CIRCIMAGING.112.978296
Summary
Keywords
hypertension, IBSH, left atrial strain, left atrioventricular coupling, left ventricular strain
Citation
Jia H, Ma T, Hu X, Nan J, Qi S, Mu Y and Guan L (2026) Study on the ultrasonic myocardial mechanics of left atrioventricular coupling in IBSH patients. Front. Cardiovasc. Med. 12:1646874. doi: 10.3389/fcvm.2025.1646874
Received
08 August 2025
Revised
25 December 2025
Accepted
31 December 2025
Published
11 February 2026
Volume
12 - 2025
Edited by
Giuseppe Caminiti, Università Telematica San Raffaele, Italy
Reviewed by
Enrico Maggio, Sapienza University of Rome, Italy
Sishi Tang, Chengdu Fifth People’s Hospital, China
Updates
Copyright
© 2026 Jia, Ma, Hu, Nan, Qi, Mu and Guan.
This is an open-access article distributed under the terms of the Creative Commons Attribution License (CC BY). The use, distribution or reproduction in other forums is permitted, provided the original author(s) and the copyright owner(s) are credited and that the original publication in this journal is cited, in accordance with accepted academic practice. No use, distribution or reproduction is permitted which does not comply with these terms.
* Correspondence: Lina Guan sanjin_lsx@163.comYuming Mu mym1234@126.com
†These authors have contributed equally to this work
Disclaimer
All claims expressed in this article are solely those of the authors and do not necessarily represent those of their affiliated organizations, or those of the publisher, the editors and the reviewers. Any product that may be evaluated in this article or claim that may be made by its manufacturer is not guaranteed or endorsed by the publisher.