Abstract
Background:
This study aims to perform a systematic review and meta-analysis evaluating the association between serum uric acid (SUA) concentrations and clinical outcomes in individuals diagnosed with acute coronary syndrome (ACS).
Methods:
PubMed, Web of Science, Embase, and the Cochrane Library were searched up to March 2025. Stata (15.1) was employed to assess heterogeneity, perform sensitivity analyses, evaluate publication bias, and execute subgroup analyses.
Results:
A total of 40 cohort studies involving 105,609 ACS patients were included. The results showed that patients with high serum uric acid (HSUA) had significantly higher risks of all-cause mortality [Hazard Ratio [HR] = 1.81, 95% confidence interval [CI]: 1.47–2.22, p < 0.001; Odds Ratio [OR] = 1.97, 95% CI: 1.29–2.99, p < 0.05], major adverse cardiovascular events (MACE) (HR = 1.40, 95% CI: 1.15–1.71, p < 0.05; OR=2.25, 95% CI: 1.73–2.92, p < 0.001), cardiovascular mortality (HR = 2.58, 95% CI: 1.67–3.98, p < 0.001), stroke [risk ratio (RR) = 1.27, 95% CI: 1.08–1.48, p < 0.05], and heart failure (RR = 1.90, 95% CI: 1.72–2.11, p < 0.001) compared to those with non-HSUA level. However, there was no significant effect on the risk of revascularization (RR = 1.09, 95% CI: 0.80–1.47, p = 0.594). Subgroup analyses suggested that follow-up time, type of ACS, treatment methods, and region might influence the observed associations. Additionally, SUA level was also nonlinearly related to all-cause and cardiovascular mortality.
Conclusion:
HSUA level is strongly associated with poor clinical outcomes in ACS patients, including mortality and major cardiovascular events. Given the nonlinear relationship with mortality, SUA could serve as a potentially valuable clinical marker. However, further multicenter studies are needed to confirm these findings.
1 Introduction
Every year, millions of people die from acute coronary syndrome (ACS). This makes the search for reliable prognostic markers more important than ever. Unstable angina, non-ST-segment elevation myocardial infarction (NSTEMI), and ST-segment elevation myocardial infarction (STEMI) are all types of ACS. It is still a major cause of illness and death around the world (1). The risks of death, heart failure, and recurrent events are high for survivors. There has been advancement in reperfusion treatments and instruments such as the GRACE score (2). However, because of unresolved residual risks, many patients continue to fall through the cracks. This emphasizes the necessity of easily accessible and adjustable biomarkers (3). Serum uric acid (SUA), traditionally regarded as a culprit in gout due to its role as a byproduct of purine metabolism, has now emerged as a multifaceted player in cardiovascular pathology. It exerts effects through mechanisms such as NLRP3 inflammasome activation, promotion of oxidative stress, and endothelial dysfunction (4, 5). High serum uric acid (HSUA) levels are linked to worse outcomes in ACS, such as bigger infarcts, worse left ventricular function, and higher death rates (6). Some studies, on the other hand, don't find a link (7). This makes people wonder if SUA is a cause of ACS.
There were problems with previous meta-analyses (8), such as small sample sizes, big differences in the makeup of the populations studied, and not enough research into dose-response or subgroup effects. The number of people around the world with hyperuricemia is going up (9). We need to take a closer look at the role of SUA in predicting the outcome of ACS. In this systematic review and meta-analysis of cohort studies with more than 100,000 ACS patients, we first looked at the combined risks of death from any cause, death from heart disease, and major adverse cardiovascular events (MACE). Next, we looked at how different doses affected different groups of people based on the type of ACS, how long the follow-up lasted, and where the people lived. The goal of this study is to give stronger clinical evidence about how well SUA predicts the outcome in ACS patients and to support more personalized care.
2 Methods
2.1 Literature search
This PRISMA-compliant meta-analysis was prospectively registered on the PROSPERO international prospective register of systematic reviews (Registration ID: CRD420251013025) (10). The Cochrane Library, Embase, Web of Science, and PubMed were retrieved between the database's creation and March 2025. Among the search terms were unstable angina, myocardial infarction, acute coronary syndrome, and uric acid. Supplementary Table S1 provides more search details.
2.2 Screening criteria
Two researchers, Zongle Sun and Ju Hui, first checked titles and abstracts and then analyzed the full text of the literature. Any doubts were resolved by discussion with Yan Wang. The screening followed the following rules.
2.3 Inclusion criteria
The following requirements were satisfied by eligible studies: (i) patients diagnosed with ACS; (ii) the exposed group included ACS patients with high serum uric acid (HSUA); (iii) the control group included ACS patients with non-HSUA; (iv) primary outcomes included all-cause mortality, cardiovascular mortality, MACE, stroke, revascularization, and heart failure; and (v) cohort design.
2.4 Exclusion criteria
The following studies were excluded: (i) animal experiments; (ii) meta, review, meeting, abstract, case report, guideline; (iii) duplicate articles; (iv) no available data for analysis.
2.5 Data extraction
Zongle Sun and Ju Hui, the authors, will filter articles based on the chosen inclusion criteria. Discussions with Yan Wang, the third researcher, about the final inclusion criteria will settle any disagreements. Author names, publication year, country of origin, study design, sample size, demographic characteristics (age, gender), follow-up time, data analysis methods, classification of SUA, type of ACS, treatment methods, and outcomes are among the information that will be included.
2.6 Definition of outcome indicators
The definition of HSUA varied among the included studies. In most studies, HSUA was defined as SUA levels >7.0 mg/dL in men and >6.0 mg/dL in women, whereas others used study-specific cut-off values or quantile-based categories. To maintain consistency with the original data, we adopted the definitions reported by each study and summarized them in Supplementary Table S2.
The definition of MACE varied among studies. Most defined MACE as a composite of cardiovascular death, non-fatal myocardial infarction, and non-fatal stroke, while some also included revascularization, heart failure, or unstable angina. To maintain consistency and transparency, the original definitions were retained and summarized in Supplementary Table S2.
Short term outcome indicators: (i) all-cause mortality within 30 days and cardiovascular mortality within 30 days, both of which include deaths occurring during hospitalization; (ii) MACE within 30 days; (iii) other adverse clinical outcomes within 30 days, such as revascularization, stroke, and heart failure.Middle to long term outcome indicators: (i) all-cause mortality at 6 months or longer and cardiovascular mortality at 6 months or longer; (ii) MACE at 6 months or longer; (iii) other adverse clinical outcomes at 6 months or longer, such as revascularization, stroke, and heart failure. More details are provided in Supplementary Table S2.
2.7 Quality evaluation
Two reviewers independently assessed study quality using a domain-adapted Newcastle–Ottawa Scale (NOS) (11); Consultation with a third reviewer was used to settle any disputes. The adaptation follows domain-specific practices reported in the literature and prespecifies thresholds for exposure ascertainment, outcome assessment, adequacy of follow-up, and comparability. Full scoring criteria are provided in the Supplementary Tables S3 and S4.
2.8 Statistical analysis
Stata (15.1) software was used to analyze the data. A random-effects model with the DerSimonian and Laird weighted technique was used to conduct the meta-analysis (12). To address variations in reported effect measures across studies, analyses were stratified by the type of effect measure: hazard ratio (HR) for time-to-event outcomes and odds ratio (OR) or relative risk (RR) for binary outcomes. Where studies reported RR or OR, these were pooled separately after transforming RR to OR using standard methods to ensure consistency within that stratum; HR were not transformed or pooled with OR/RR due to their distinct statistical interpretations and underlying assumptions. Separate forest plots were generated for each stratum (e.g., one for HR and one for OR) to estimate overall effects without combining incompatible measures (13). Meta-analysis of the studies was depicted as forest plots to estimate the overall RR, OR and HR. I2 statistics were used to assess study heterogeneity and were classed as follows: Because of the significant heterogeneity shown by I2 ≥ 50%, a random-effects model was used to account for between-study variation (14). Sensitivity analysis (leave-one-out method) identified potential sources of heterogeneity. Subgroup analyses stratified studies by control group type. For analyses with I2 < 50%, a fixed-effects model was applied, assuming a common effect size across studies. Methods for evaluating potential bias in publications included Egger's test and the funnel plot (15). When conducting two-tailed tests, statistical significance was defined as a two-tailed p-value < 0.05 in all analyses. We conducted a dose-response analysis using a recognized technique in order to thoroughly describe the dose-response relationship (16–18). For this method, at least three quantitative exposure categories have to have their total number of participants and cases, HR estimates, and variance estimates. The associated risk estimate for each study was based on the median/mean uric acid levels for each category. For categories lacking reported median/mean UA values, the central tendency was estimated by taking the midpoint of the upper and lower category boundaries. The interval's width was assumed to be identical to that of the nearest category if either the highest or lowest category was open-ended (19). When the reference category utilized in the analysis was not the lowest group, risk estimates were converted using the Hamling et al. (20) technique. In order to investigate the possible correlation between the risk of cardiovascular events and uric acid levels, we used restricted cubic splines to model exposure levels. Three knots were positioned at the 25th, 50th, and 75th percentiles of the exposure distribution. The null hypothesis that the coefficient of the second spline term was equal to zero was tested in order to determine nonlinearity. Every statistical test had a significance threshold of p < 0.05 and was two-sided.
3 Results
3.1 Literature search and screening process
The literature search yielded 9,824 potentially relevant articles. Automated deduplication reduced this to 3,087 unique publications. Screening of titles and abstracts further narrowed the set to 64 articles, which were then subjected to full-text review. Ultimately, 40 articles were included in the analysis. The details can be found in Figure 1.
Figure 1
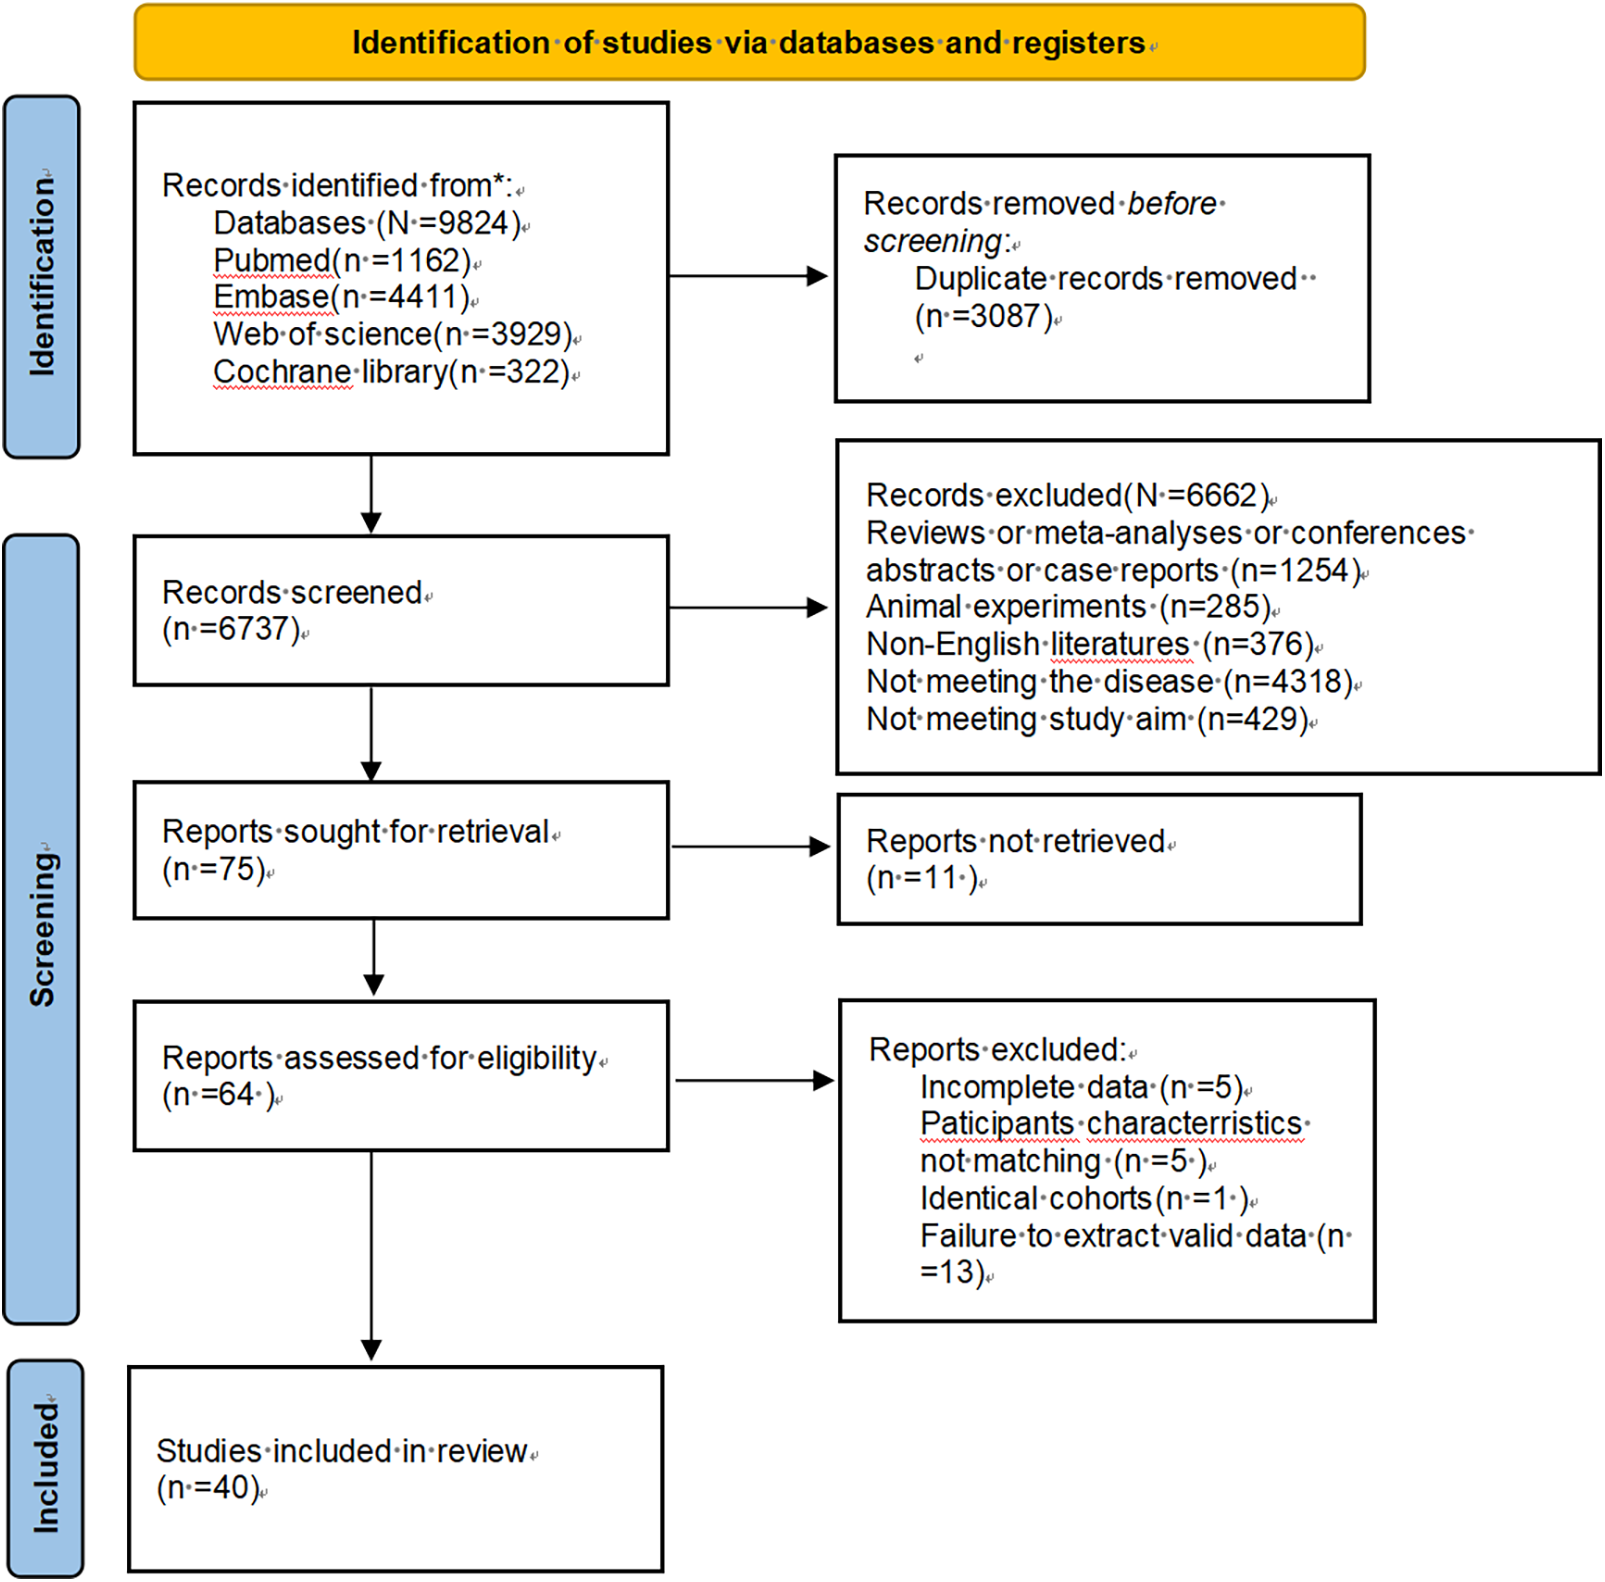
Flowchart of the preferred reporting items for systematic reviews and meta-analyses.
3.2 Methodological quality and baseline characteristics of selected studies
A total of 40 (6, 7, 21–58) studies, encompassing various countries and regions, were included. These comprised both prospective and retrospective cohort studies conducted between 2005 and 2025, involving 105,609 ACS patients with sample sizes ranging from 184 to 27,959. Participant demographics varied in age, gender, ACS type, follow-up time, data analysis methods, classification of SUA, and treatment methods. All-cause mortality, cardiovascular mortality, MACE, heart failure, stroke, and revascularization were the main outcomes evaluated, as indicated in Table 1 and Supplementary Table S2. Subgroup analysis will be conducted from four aspects: follow-up time, type of ACS, treatment methods, and region. Quality assessment using the NOS demonstrated the following score distribution among included studies: 36 studies ≥6 points, 3 studies with 5 points, and 1 study at 4 points (Supplementary Table S4).
Table 1
| Author | Publication year | Country | Study design | Sample size | Age | Gender (male/female) | Data analysis methods | Type of ACS | Follow-up time | Treatment methods | Outcome |
|---|---|---|---|---|---|---|---|---|---|---|---|
| Akpek et al. (21) | 2011 | Turkey | Prospective cohort study | 289 | 60.00 | 221/67 | Multivariate analysis | STEMI | 1 year | PCI | Mace/Revascularization |
| Basar et al. (22) | 2011 | Turkey | Retrospective cohort study | 185 | 58.74 | 148/37 | Multivariate analysis | STEMI | In-hospital period | PCI | All-Cause Mortality |
| Chen et al. (23) | 2012 | China | Retrospective cohort study | 502 | 61.27 | 417/85 | Multivariate analysis | STEMI | In-hospital period/24.3 months/5 years | PCI/non-PCI | Stroke/Heart failure |
| Kaya et al. (24) | 2012 | Turkey | Prospective cohort study | 2,249 | 57.14 | 1,853/396 | Multivariate analysis | STEMI | average of 2.8 years | PCI | Cardiovascular Mortality/Mace/Revascularization/Stroke/Heart failure |
| Krishnan et al. (25) | 2012 | America | Prospective cohort study | 4,352 | 54.90 | 3,877/475 | Univariate Analysis | STEMI/NSTEMI | 1 year | PCI/non-PCI | All-Cause Mortality/Cardiovascular Mortality |
| Ndrepepa et al. (26) | 2012 | Germany | Prospective cohort study | 5,124 | 67.87 | 3,762/1,362 | Multivariate analysis | ACS | In-hospital period | PCI | All-Cause Mortality |
| Omidvar et al. (27) | 2012 | Iran | Prospective cohort study | 184 | 58.00 | 129/55 | Multivariate analysis | STEMI | In-hospital period | PCI/non-PCI | All-Cause Mortality |
| Wang et al. (28) | 2012 | China | Prospective cohort study | 276 | 56.41 ± 11.22 | 221/55 | Multivariate analysis | STEMI | 3.5 years | PCI | No-reflow Phenomenon |
| Levantesi et al. (29) | 2013 | Italy | Retrospective cohort study | 10,840 | 59.30 | 9,247/1,593 | Multivariate analysis | STEMI/NSTEMI | 1 year | PCI/non-PCI | All-Cause Mortality/Cardiovascular Mortality |
| Timóteo et al. (30) | 2013 | Portugal | Retrospective cohort study | 683 | 64.00 | 471/212 | Multivariate analysis | ACS | 6 months | PCI/non-PCI | All-Cause Mortality |
| Akgul et al. (31) | 2014 | Turkey | Prospective cohort study | 434 | 55.40 | 341/93 | Multivariate analysis | STEMI | In-hospital period | PCI/non-PCI | All-Cause Mortality/Revascularization/Stroke/Heart failure |
| Gazi et al. (32) | 2014 | Turkey | Retrospective cohort study | 586 | 61.02 | 467/119 | Multivariate analysis | STEMI | In-hospital period | PCI/non-PCI | Cardiovascular Mortality/Heart failure |
| Karim et al. (33) | 2015 | Indonesia | Retrospective cohort study | 251 | 57.10 | 169/82 | Univariate Analysis | ACS | 1 year | PCI/non-PCI | Mace/Revascularization |
| Lazzeri et al. (34) | 2015 | Italy | Prospective cohort study | 329 | 77.20 | 177/152 | Multivariate analysis | STEMI | 3 years | PCI | All-Cause Mortality |
| Von Lueder et al. (35) | 2015 | Multiple countries | Retrospective cohort study | 12,677 | 65.25 | 9,065/3,612 | Multivariate analysis | STEMI/NSTEMI | 20 months | PCI/non-PCI | All-Cause Mortality/Cardiovascular Mortality |
| Hajizadeh et al. (36) | 2016 | Iran | Prospective cohort study | 608 | 62.60 | 437/171 | Multivariate analysis | STEMI | In-hospital period | PCI/non-PCI | Stroke |
| Ranjith et al. (40) | 2016 | South Africa | Retrospective cohort study | 2,683 | 57.10 | 1,740/943 | Multivariate analysis | STEMI/NSTEMI | 30 days/1 year | PCI/non-PCI | Cardiovascular Mortality/Mace/Stroke/Heart failure |
| Liu et al. (7) | 2017 | China | Retrospective cohort study | 944 | 57.69 | 831/113 | Multivariate analysis | STEMI | In-hospital period | PCI | All-Cause Mortality |
| Magnoni et al. (37) | 2017 | Italy | Retrospective cohort study | 1,548 | 62.71 | 1,121/427 | Multivariate analysis | ACS | In-hospital period | PCI/non-PCI | All-Cause Mortality |
| Morn et al. (38) | 2017 | Mexico | Retrospective cohort study | 795 | 59.00 | 668/127 | Multivariate analysis | STEMI | The median follow-up period of 365 days | PCI/non-PCI | All-Cause Mortality/Stroke/Heart failure |
| Pagidipati et al. (39) | 2017 | Multiple countries | Retrospective cohort study | 27,959 | 63.35 | 20,068/7,891 | Univariate Analysis/Multivariate analysis | ACS | 2 years | PCI/non-PCI | Stroke |
| Kobayashi et al. (41) | 2018 | Japan | Retrospective cohort study | 1,308 | 66.62 | 1,042/266 | Univariate Analysis | ACS | 2 years | PCI/non-PCI | Cardiovascular Mortality |
| Kobayashi et al. (42) | 2018 | Japan | Retrospective cohort study | 1,114 | 66.44 | 995/119 | Multivariate analysis/propensity score adjusted | ACS | The median follow-up period of 5.5 ± 2.9 years | PCI/non-PCI | Cardiovascular Mortality |
| Tscharre et al. (44) | 2018 | Austria | Prospective cohort study | 1,215 | 62.90 | 805/408 | Multivariate analysis | ACS | 5 years | PCI/non-PCI | Cardiovascular Mortality/Mace |
| Lopez et al. (43) | 2018 | Spain | Prospective cohort study | 1,119 | 68.10 | 830/289 | Multivariate analysis | STEMI/NSTEMI | The median follow-up period of 246.31 ± 49.16 days | PCI/non-PCI | All-Cause Mortality/Cardiovascular Mortality/Mace |
| Ye et al. (45) | 2018 | China | Retrospective cohort study | 2,296 | 60.09 | 1,558/738 | Multivariate analysis | ACS | In-hospital period/1 year | PCI | All-Cause Mortality |
| Tai et al. (48) | 2019 | China | Retrospective cohort study | 711 | 78.12 | 438/273 | Multivariate analysis | STEMI/NSTEMI | The median follow-up of 2.3 ± 1.0 years | PCI/non-PCI | All-Cause Mortality/Revascularization/Stroke/Heart failure |
| Guo et al. (46) | 2019 | China | Prospective cohort study | 1,005 | 61.82 | 849/156 | Univariate Analysis | STEMI/NSTEMI | 1 year | PCI | All-Cause Mortality |
| Mandurino et al. (51) | 2020 | Italy | Prospective cohort study | 2,369 | 63.35 | 1,840/529 | Multivariate analysis | STEMI | In-hospital period | PCI | All-Cause Mortality |
| Centola et al. (47) | 2020 | Italy | Retrospective cohort study | 1,088 | 68.7 ± 13.36 | 830/258 | Multivariate analysis | ACS | The median follow-up of 41.7 months | PCI/non-PCI | All-Cause Mortality |
| Ma et al. (50) | 2021 | China | Prospective cohort study | 1,179 | 55.70 | 867/312 | Multivariate analysis | STEMI/NSTEMI | 30 months | PCI/non-PCI | Mace/Revascularization/Stroke/Heart failure |
| Mohammed et al. (52) | 2021 | China | Prospective cohort study | 249 | 62.67 | 127/122 | propensity score adjusted | STEMI/NSTEMI | The median follow-up of 5.02 (3.07, 7.55) years | PCI/non-PCI | Mace/Stroke/Heart failure |
| Kim et al. (53) | 2022 | Korea | Retrospective cohort study | 5,888 | 64.00 | 4,141/1,744 | Multivariate analysis | STEMI/NSTEMI | In-hospital period | PCI | All-Cause Mortality/Cardiovascular Mortality/Revascularization/Stroke/Heart failure |
| Nakahashi et al. (55) | 2022 | Japan | Retrospective cohort study | 989 | 68.00 | 763/226 | Multivariate analysis | STEMI/NSTEMI | 5 years | PCI | All-Cause Mortality |
| Tang et al. (56) | 2022 | China | Prospective cohort study | 1,448 | - | 1,238/210 | Multivariate analysis | STEMI | The median of 4 years | PCI | All-Cause Mortality/Cardiovascular mortality/Mace/Revascularization/Stroke |
| Nakahashi et al. (54) | 2022 | America | Retrospective cohort study | 1,068 | 69.00 | 794/74 | Univariate Analysis | ACS | 3 years | PCI | All-Cause Mortality |
| Dyrbuś et al. (49) | 2023 | Poland | Retrospective cohort study | 2,824 | 66.12 | 1,844/980 | Multivariate analysis | ACS | 1 year | PCI/non-PCI | All-Cause Mortality |
| Liang et al. (57) | 2023 | China | Retrospective cohort study | 1,396 | 63.90 | 1,104/292 | Multivariate analysis | STEMI | 1 year | PCI/non-PCI | All-Cause Mortality |
| Nie et al. (6) | 2024 | China | Retrospective cohort study | 4,319 | 63.07 | 3,144/1,175 | Multivariate analysis | STEMI/NSTEMI | The median follow-up of 64 (46, 79) months | PCI/non-PCI | All-Cause Mortality/Cardiovascular Mortality |
| Li et al. (58) | 2025 | China | Retrospective cohort study | 526 | 81.35 | 327/199 | Data analysis methods | ACS | Follow-up time | PCI/non-PCI | Mace |
Baseline characteristics.
3.3 All-cause mortality
A total of 12 studies assessed all-cause mortality(HR), involving 22,696 patients. Heterogeneity analysis (I2 = 66.1%, p < 0.05) showed significant heterogeneity. The risk of all-cause mortality was significantly higher for the HSUA group than for the non-HSUA group (HR = 1.81, 95% CI: 1.47–2.22, p < 0.001) (Figure 2A and Supplementary Table S5). Subgroup analyses revealed that across multiple clinical categories, the HSUA group had a higher all-cause mortality rate than the non-HSUA group: Middle to long follow-up (11 studies; HR = 1.80, 95% CI: 1.44–2.23, p < 0.001), Short follow-up (2 studies; HR = 1.69, 95% CI: 1.08–2.64, p < 0.001), STEMI (6 studies; HR = 2.07, 95% CI: 1.59–2.70, p < 0.001), ACS (3 studies; HR = 1.84, 95% CI: 1.23–2.76, p < 0.05), STEMI/NSTEMI (3 studies; HR = 1.43, 95% CI: 1.08–1.89, p < 0.05), Percutaneous coronary intervention (PCI) (6 studies; HR = 1.64, 95% CI: 1.24–2.17, p < 0.05), PCI/non-PCI (6 studies; HR = 1.95, 95% CI: 1.53–2.50, p < 0.001), Europe (4 studies; HR = 2.28, 95% CI: 1.53–3.40, p < 0.001), America (1 study; HR = 1.99, 95% CI: 1.08–3.66, p < 0.05),and Asia (7 studies; HR = 1.55, 95% CI: 1.25–1.92, p < 0.001) (Supplementary Figure S1 and Supplementary Table S5). The Middle to long follow-up, Short follow-up, STEMI, ACS, STEMI/NSTEMI, PCI/non-PCI, Europe, Asia subgroups showed less heterogeneity (Supplementary Figure S1 and Supplementary Table S5).
Figure 2
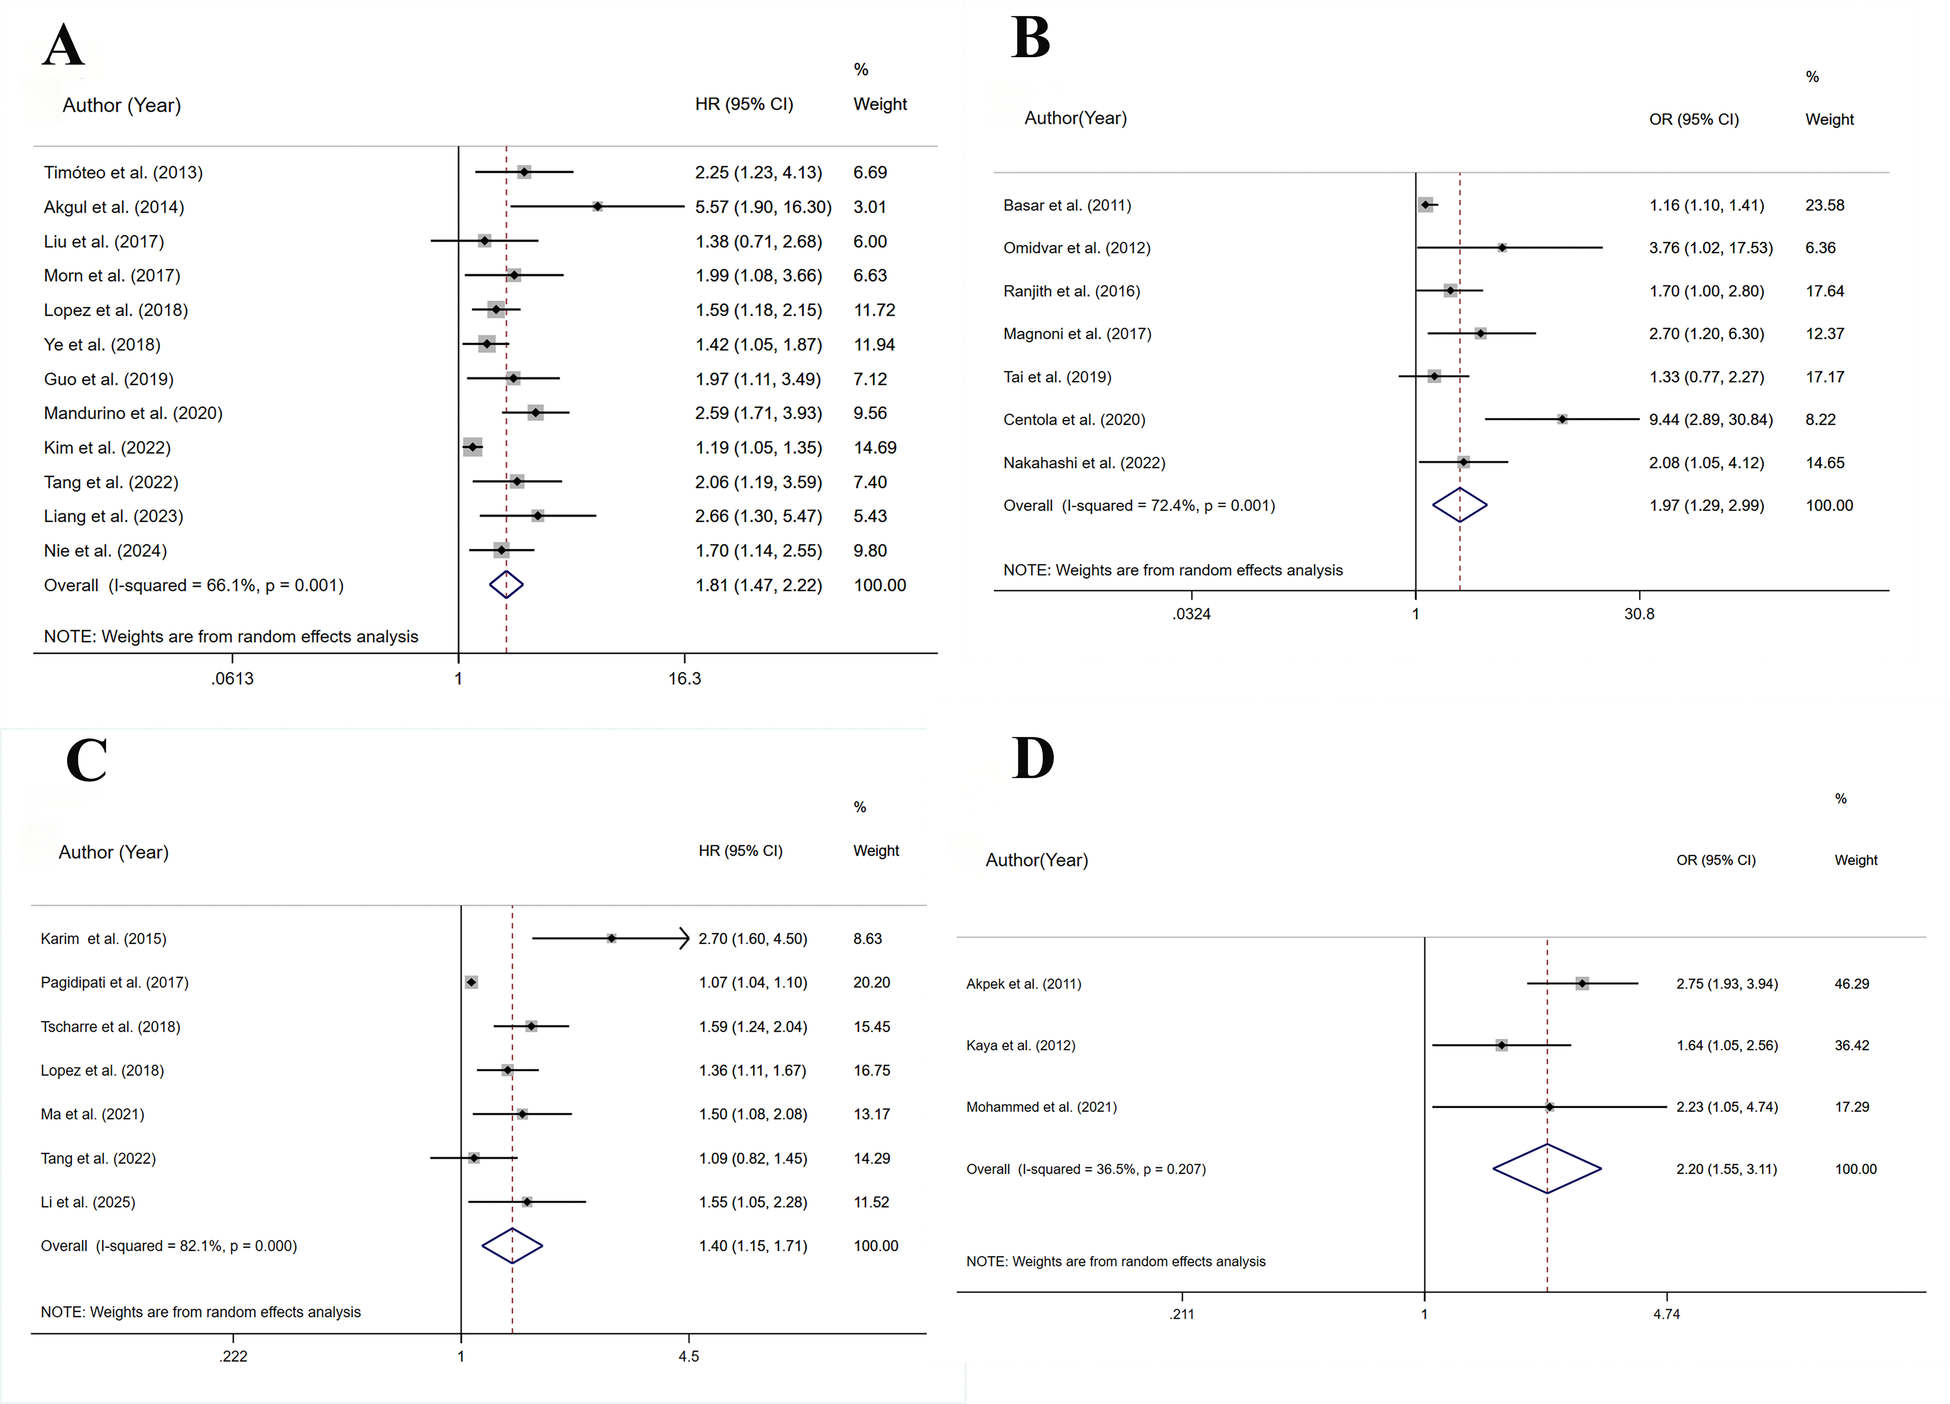
Meta-analysis on the prognosis of ACS patients with HSUA and Non-HSUA groups. (A) All-cause mortality(HR). (B) All-cause mortality(OR). (C) MACE(HR). (D) MACE(OR).
A total of 7 studies assessed all-cause mortality(OR), involving 7,467 patients. Heterogeneity analysis (I2 = 72.4%, p < 0.05) showed significant heterogeneity. The risk of all-cause mortality was significantly higher for the HSUA group than for the non-HSUA group (OR = 1.97, 95% CI: 1.29–2.99, p < 0.05) (Figure 2B and Supplementary Table S5). Subgroup analyses revealed that across multiple clinical categories, the HSUA group had a higher all-cause mortality rate than the non-HSUA group: Middle to long follow-up (2 studies; OR = 1.17, 95% CI: 1.03–1.32, p < 0.05), Short follow-up (5 studies; OR = 2.67, 95% CI: 1.60–4.45, p < 0.001), ACS (2 studies; OR = 4.69, 95% CI: 1.39–15.85, p < 0.05), STEMI/NSTEMI (3 studies; OR = 1.63, 95% CI: 1.17–2.26, p < 0.05), PCI/non-PCI (5 studies; OR = 2.43, 95% CI: 1.37–4.31, p < 0.05),Asia (3 studies; OR = 1.55, 95% CI: 1.10–2.74, p < 0.05), and Africa (1 study; OR = 1.70, 95% CI: 1.02–2.84, p < 0.05) (Supplementary Figure S1 and Supplementary Table S5). No notable differences in all-cause mortality were detected among the subgroups of Middle to long follow-up, STEMI, PCI, and Europe (Supplementary Figure S1 and Supplementary Table S5). The Middle to long follow-up, Short follow-up, STEMI, ACS, STEMI/NSTEMI, PCI, Asia subgroups showed less heterogeneity (Supplementary Figure S1 and Supplementary Table S5).
3.4 MACE
A total of 7 studies assessed MACE(HR), involving 33,697 patients. Heterogeneity analysis (I2 = 82.1%, p < 0.001) showed significant heterogeneity. In comparison to the non-HSUA group, the HSUA group had a significantly elevated risk of MACE (HR = 1.40, 95% CI: 1.15–1.71, p < 0.05) (Figure 2C and Supplementary Table S5). The subgroup demonstrated that the HSUA group had significantly higher MACE risk compared with the non-HSUA group across multiple categories: ACS (4 studies; HR = 1.55, 95% CI: 1.08–2.22, p < 0.05),STEMI/NSTEMI (2 studies; HR = 1.40, 95% CI: 1.18–1.66, p < 0.001), Asia (4 studies; HR = 1.54, 95% CI: 1.11–2.14, p < 0.05), Others (3 studies; HR = 1.29, 95% CI: 1.00–1.67, p < 0.05). No notable changes were detected in the “STEMI” groupings (Supplementary Figure S1 and Supplementary Table S5). Reduced heterogeneity was observed in the STEMI/NSTEMI category (Supplementary Figure S1 and Supplementary Table S5).
A total of 3 studies assessed MACE(OR), involving 2,787 patients. Heterogeneity analysis (I2 = 35.5%, p = 0.207) showed low heterogeneity. In comparison to the non-HSUA group, the HSUA group had a significantly elevated risk of MACE (OR = 2.25, 95% CI: 1.73–2.92, p < 0.001) (Figure 2D and Supplementary Table S5). The subgroup analysis demonstrated that the HSUA group had significantly higher MACE risk compared with the non-HSUA group across different follow-up time: Middle to long follow-up (2 studies; OR = 1.78, 95% CI: 1.21–2.61, p < 0.05), Short follow-up (2 studies; OR = 2.51, 95% CI: 1.86–3.89, p < 0.001). Reduced heterogeneity was observed in both subgroups (Supplementary Figure S1 and Supplementary Table S5).
3.5 Cardiovascular mortality
A total of 9 studies assessed cardiovascular mortality, involving 19,246 patients. Heterogeneity analysis (I2 = 92.9%, p < 0.001) showed significant heterogeneity. The risk of cardiovascular mortality (HR = 2.58, 95% CI: 1.67–3.98, p < 0.001) substantially increased in the HSUA group compared to the non-HSUA group (Figure 3A and Supplementary Table S5).
Figure 3
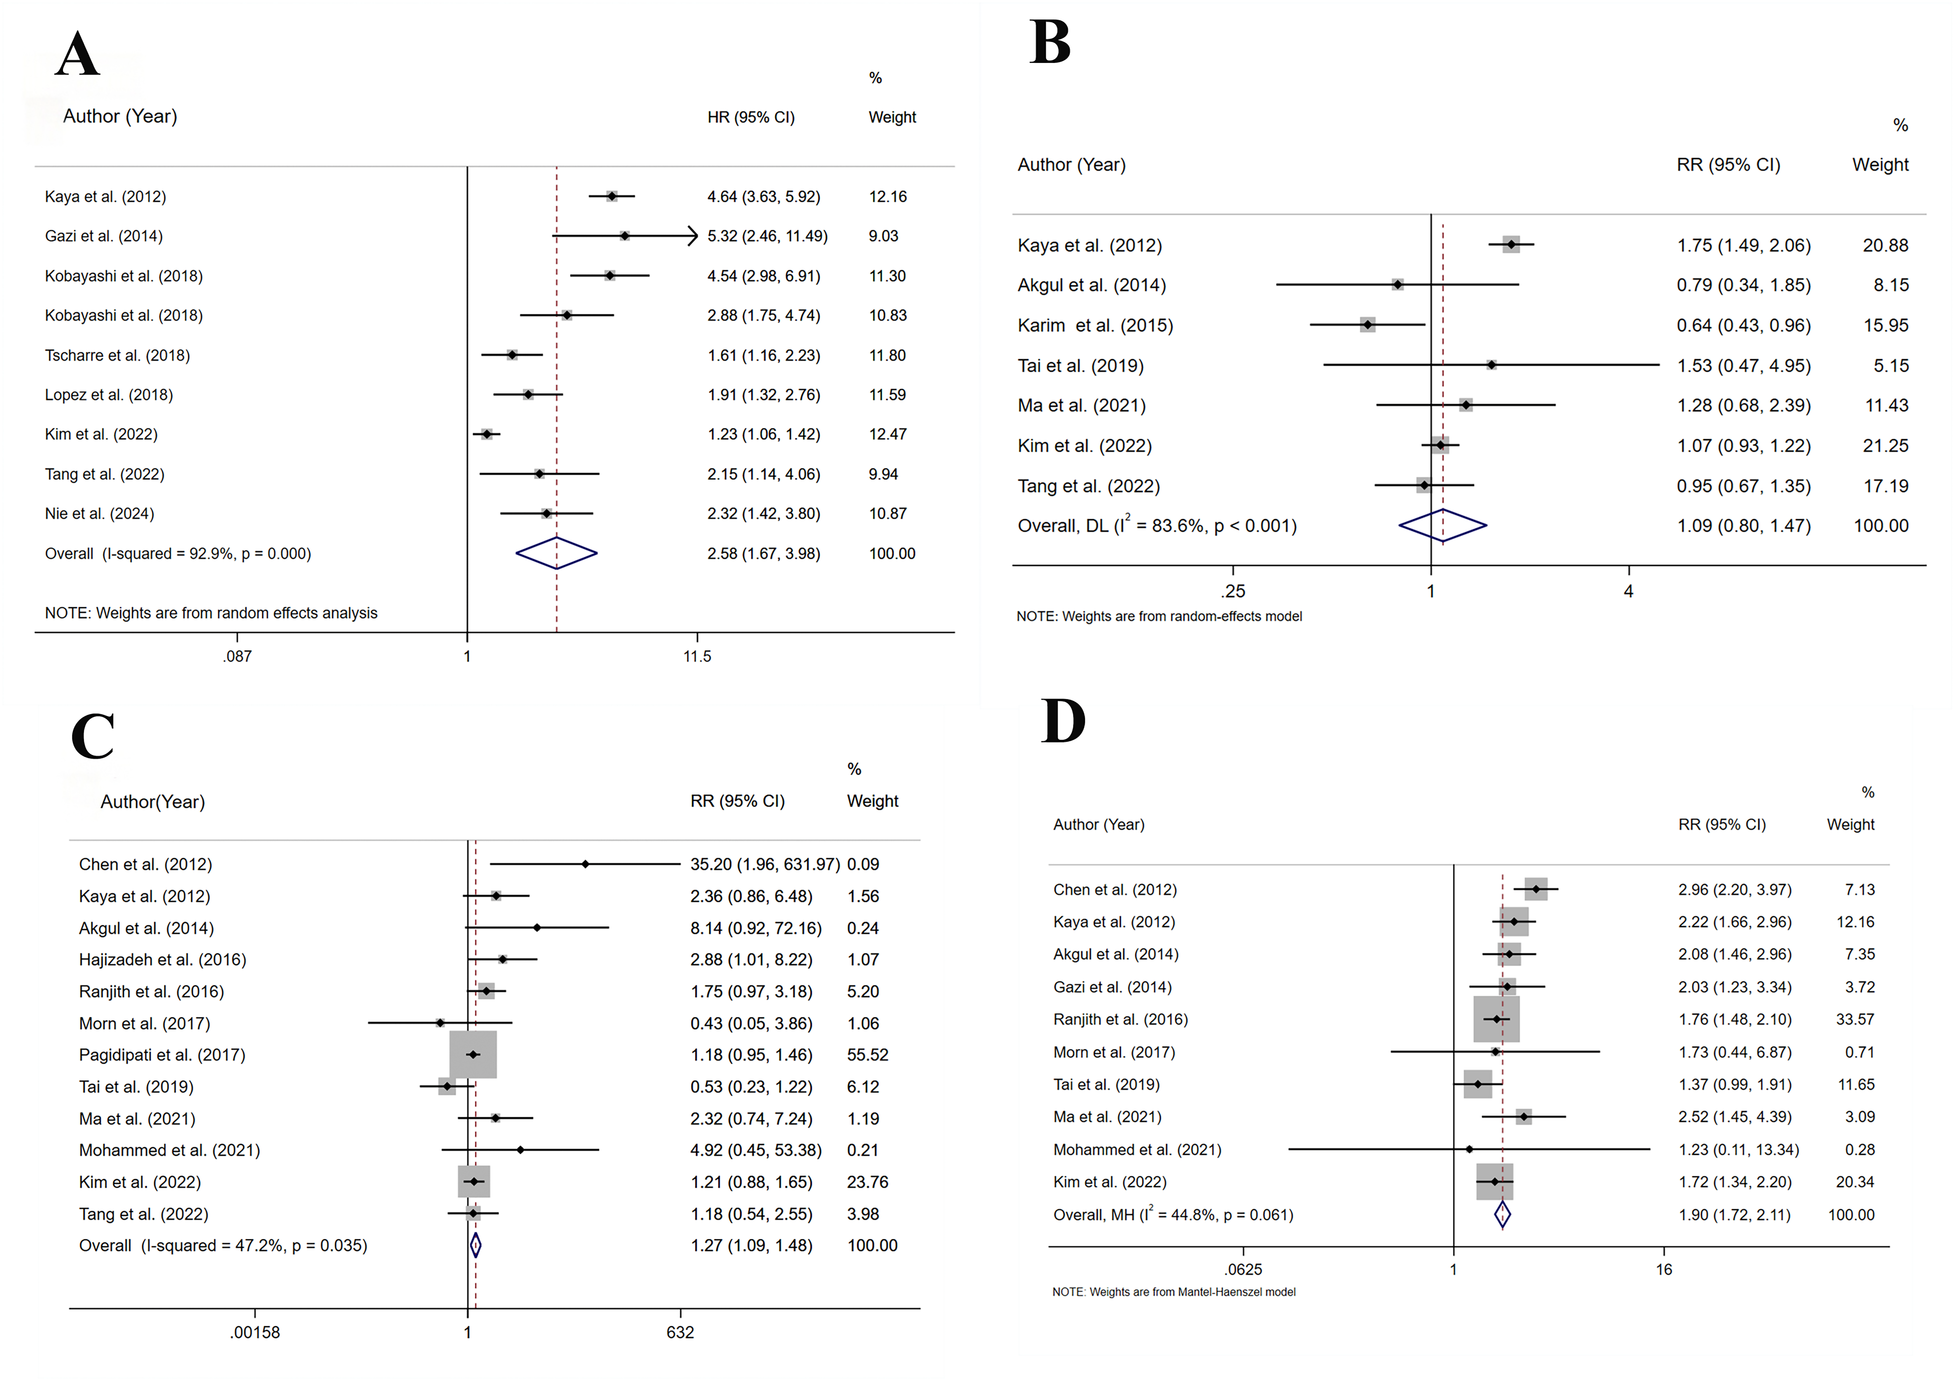
Meta-analysis on the prognosis of ACS patients with HSUA and Non-HSUA groups. (A) Cardiovascular mortality. (B) Revascularization. (C) Stroke. (D) Heart failure.
The subgroup analysis revealed that the HSUA group exhibited a higher risk of cardiovascular mortality compared to the non-HSUA group in all evaluated categories: STEMI (3 studies; HR = 3.84, 95% CI: 2.34–6.32, p < 0.001), ACS (3 studies; HR = 2.73, 95% CI: 1.43–5.23, p < 0.05), STEMI/NSTEMI (3 studies; HR = 1.68, 95% CI: 1.11–2.53, p < 0.001), PCI/non-PCI (6 studies; HR = 2.68, 95% CI: 1.84–3.89, p < 0.001), Europe (3 studies; HR = 3.50, 95% CI: 1.78–6.88, p < 0.001), and Asia (5 studies; HR = 2.37, 95% CI: 1.33–4.24, p < 0.05). No substantial differences were observed in the PCI subgroup (Supplementary Figure S1 and Supplementary Table S5). The STEMI subgroups exhibited reduced heterogeneity (Supplementary Figure S1 and Supplementary Table S5).
3.6 Revascularization
A total of 7 studies assessed revascularization, involving 19,960 patients. Heterogeneity analysis (I2 = 83.6%, p < 0.001) showed significant heterogeneity. In comparison to the non-HSUA group, the HSUA group presented no statistically notable elevation in the risk of revascularization (RR = 1.09, 95% CI: 0.80–1.47, p = 0.594) (Figure 3B and Supplementary Table S5).
In the short-term (RR = 0.67, 95% CI: 0.46–0.96, p < 0.05) and ACS (RR = 0.64, 95% CI: 0.43–0.96, p < 0.001) subgroups, the HSUA group showed a significantly lower revascularization risk compared to the non-HSUA group. No notable differences in revascularization risk were detected among the subgroups of Middle to long follow-up, STEMI, STEMI/NSTEMI, Europe, and Asia (Supplementary Figure S1 and Supplementary Table S5). Lower heterogeneity was found in the Short follow-up, ACS, STEMI/NSTEMI, and Asia subgroups (Supplementary Figure S1 and Supplementary Table S5).
3.7 Stroke
A total of 12 studies assessed stroke, involving 44,705 patients. Heterogeneity analysis (I2 = 47.2%, p = 0.035) showed moderate heterogeneity. In comparison to the non-HSUA group, the HSUA group presented a significantly elevated risk of stroke (RR = 1.27, 95% CI: 1.08–1.48, p < 0.05) (Figure 3C and Supplementary Table S5).
The subgroup analysis results indicated that the HSUA group had a significantly higher risk of stroke compared with the non-HSUA group in numerous categories: Short follow-up (7 studies; RR = 1.92, 95% CI: 1.10–3.35, p < 0.05), STEMI (6 studies; RR = 2.30, 95% CI: 1.05–5.01, p < 0.05), PCI/non-PCI (9 studies; RR = 1.27, 95% CI: 1.06–1.53, p < 0.05), and Europe (2 studies; RR = 2.96, 95% CI: 1.16–7.53, p < 0.05). No substantial differences in stroke risk were noted among the subgroups of Middle to long, ACS, STEMI/non-STEMI, PCI, Asia, and “Others” (Supplementary Figure S1 and Supplementary Table S5). Lower heterogeneity was found in the Middle to long follow-up, STEMI, ACS, STEMI/NSTEMI, PCI/non-PCI, Europe, and “Others” subgroups (Supplementary Figure S1 and Supplementary Table S5).
3.8 Heart failure
A total of 10 studies assessed heart failure, involving 15,276 patients. Heterogeneity analysis (I2 = 44.8%, p = 0.061) showed moderate heterogeneity. In comparison to the non-HSUA group, the HSUA group presented a substantially elevated risk of heart failure (RR = 1.90, 95% CI: 1.72–2.11, p < 0.001) (Figure 3D and Supplementary Table S5).
Subgroup analysis found that the prospective risk of heart failure in the listed groups of the HSUA group surpassed that of the non-HSUA group: Middle to long follow-up (4 studies; RR = 1.95, 95% CI: 1.64–2.23, p < 0.001), Short follow-up (6 studies; RR = 1.88, 95% CI: 1.66–2.12, p < 0.001), STEMI (5 studies; RR = 2.32, 95% CI: 1.86–2.74, p < 0.001), STEMI/NSTEMI (5 studies; RR = 1.71, 95% CI: 1.51–1.95, p < 0.001), PCI (2 studies; RR = 1.90, 95% CI: 1.58–2.29, p < 0.001), PCI/non-PCI (8 studies; RR = 1.90, 95% CI: 1.69–2.14, p < 0.001), Europe (3 studies; RR = 2.14, 95% CI: 1.61–2.21, p < 0.001), Asia (5 studies; RR = 1.89, 95% CI: 1.51–1.95, p < 0.001), and “Others” (2 studies; RR = 1.76, 95% CI: 1.48–2.09, p < 0.001) (Supplementary Figure S1 and Supplementary Table S5). Lower heterogeneity was found in the Middle to long follow-up, STEMI, STEMI/NSTEMI, PCI, Europe, and “Others” subgroups (Supplementary Figure S1 and Supplementary Table S5).
3.9 Dose-response analysis
The dose-response relationships of SUA concentrations with composite all-cause and cardiovascular mortality outcomes were analyzed. The nonlinear test results indicated that all-cause mortality exhibited a nonlinear trend (p = 0.753) (Figure 4A). At 3.978, 5.99, and 8.98 mg/dL, the HR (95% CI) of all-cause mortality were 1.06 (0.95–1.20), 1.16 (0.87–1.52), and 1.41 (1.05–1.84), respectively. Cardiovascular mortality showed a nonlinear trend (p = 0.806) (Figure 4B). At 4.00, 8.99, and 12.02 mg/dL, the HR (95% CI) of cardiovascular mortality were 1.28 (0.94–1.69), 4.83 (1.45–14.25), and 12.03 (1.60–23.75), respectively.
Figure 4
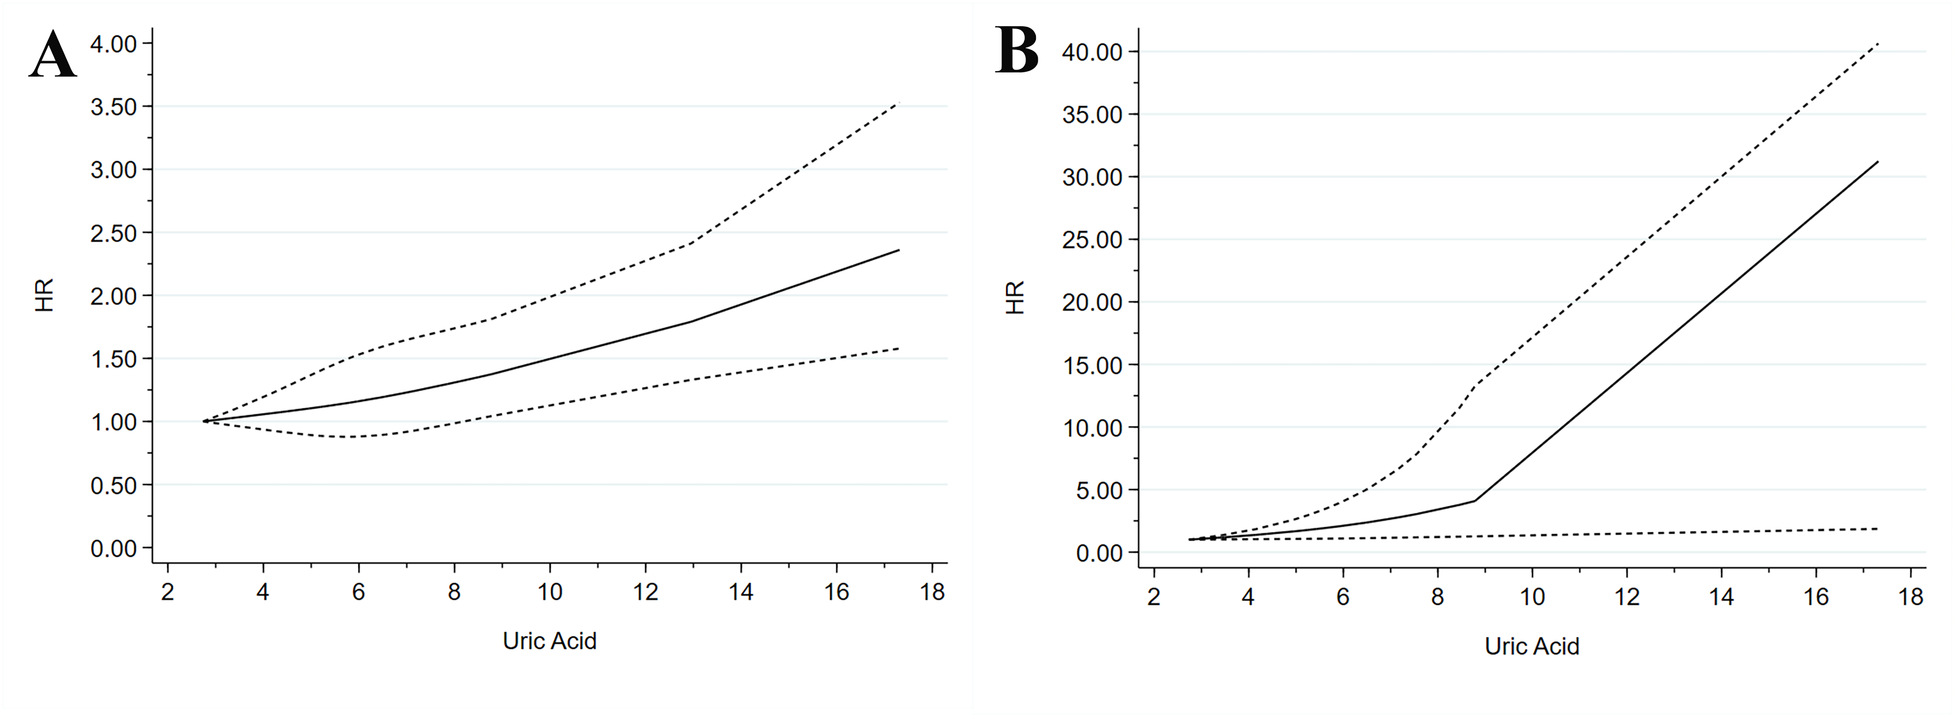
Dose–response meta-analysis between SUA levels and mortality in patients with ACS. (A) All-cause mortality. (B) Cardiovascular mortality.
3.10 Sensitivity analysis and publication bias analysis
By performing a leave-one-out sensitivity analysis, all outcomes demonstrated good robustness. For outcomes with ≥10 studies, funnel plots and Egger's test were conducted to assess publication bias. Egger's test indicated a significant probability of publication bias for the HR for all-cause mortality (P < 0.05). The application of the trim-and-fill method to address this bias resulted in a reversal of the estimated impact sizes for the outcome indicators, suggesting that the original analysis results may have been overestimated due to the small study effect or selective publication of positive findings. Consequently, a cautious interpretation is warranted for the outcome. Conversely, the funnel plots and Egger's test results for stroke, and heart failure exhibited no discernible publication bias, indicating that the associations of these outcomes were relatively reliable. The detailed results are illustrated in Supplementary Figure S2.
4 Discussion
ACS is still one of the main causes of heart disease and death around the world, so we need reliable prognostic biomarkers to help us better manage patients and improve their outcomes. This systematic review and meta-analysis, which included 40 cohort studies and a total of 105,609 patients, shows that there may be a link between HSUA level and bad clinical outcomes in ACS. This shows that SUA could be a very important tool for figuring out who is at risk.
There is a close two-way link between HSUA and ACS. HSUA can happen because of different problems like metabolism issues, oxidative stress, kidney problems, and long-term inflammation (1, 4, 5). Together, these conditions damage the endothelium, change the structure of blood vessels, and promote clot formation. As a result, they can worsen or sustain the development of ACS. Strong inflammation during ACS can make the body respond more to uric acid crystals. The reaction happens through the NLRP3 inflammasome pathway. This response makes more harmful oxygen substances, stops the blood vessels from making nitric oxide, and causes the cells in the blood vessels to die. These problems make it more likely that plaques in the arteries will break and cause heart attacks to become worse. Furthermore, Rebora et al. suggest that elevated UA may act as an index of peripheral hypoperfusion in ACS patients with acute HF, where it could reflect worsened responses to hypoperfusion (potentially influenced by diuretics), serving as an indirect marker of increased mortality rather than a direct causal factor (59). HSUA can also raise the risk of stroke, it does this by promoting blood-brain barrier disruption and cerebrovascular inflammation. People with ACS are more likely to have this if they also have high blood pressure in the lungs or problems with the right side of the heart. People with ACS often also have metabolic problems. These include high blood pressure, diabetes, and being overweight. These problems can make it harder for the kidneys to remove uric acid, especially by changing how a protein called URAT1 works. This leads to higher uric acid levels and creates a cycle that makes inflammation-related ACS get worse. The precise causal sequence of these interactions often hinges on underlying comorbidities and individualized pathophysiological profiles.
The findings of this study reveal that HSUA substantially elevates the risks of all-cause mortality, cardiovascular mortality, MACE, stroke, and heart failure among patients with ACS. These results align partially with those of a prior meta-analysis; however, the present investigation extends these insights by incorporating a more expansive evidence base (40 vs. 14 studies) and evaluating additional endpoints, such as stroke and heart failure, which were insufficiently addressed in earlier efforts. The nonlinear dose-response relationships for all-cause and cardiovascular mortality back up the idea of a threshold effect. Risks go up a lot when SUA levels go above a certain point. Because there is no link with revascularization, it seems that the severity of the coronary lesions and the choices made by doctors are the main factors that affect this outcome. The levels of SUA do not have a big effect on it. These ideas are backed up by subgroup analyses. They show that the effect is stronger in people with STEMI. This could mean that uric acid can hurt their hearts more easily.
Because of the considerable heterogeneity revealed in this meta-analysis, we further performed subgroup analyses to explore its sources. When HSUA group was compared with non-HSUA group, all-cause mortality, cardiovascular mortality, MACE (HR), and revascularization presented high heterogeneity; whereas stroke and heart failure presented moderate heterogeneity. Subgroup analyses indicated that follow-up time, ACS subtype, treatment method, and geographic region contributed to this high heterogeneity, and reduction of I2 could be observed in certain strata. For all-cause mortality, HSUA patients showed higher risk of acute events in short-term follow-up groups. Mid to long-term follow-up could decrease the risk differences of acute events in HSUA patients, which may weaken overall heterogeneity of all-cause mortality. This may be due to the fact that the nature of acute inflammation in ACS is amplified by HSUA-induced oxidative stress and NLRP3 inflammasome activity, and these effects could cause inconsistent early outcomes like faster myocardial ischemia or stroke (4, 5). Similarly, the large overall I2 of cardiovascular mortality may be correlated to disease subtype. For example, STEMI patients always present more severe ischemia-reperfusion injury and endothelial dysfunction, which may cause more overall I2 than cardiac acute events in NSTEMI patients with mostly chronic plaque instability (26, 44). In addition, the MACE heterogeneity seemed also related to ACS subtype distinctions. For STEMI/NSTEMI subgroup (HR = 1.40, 95% CI: 1.18–1.66; reduced I2), the amplified inflammatory response may increase composite risk in HSUA patients; whereas ACS broader groups also contributed to higher overall I2.Treatment method including PCI vs. non-PCI strategies also contributed substantially to this heterogeneity. Post-interventional inflammatory cascade may differentially modulate the effects of HSUA on vascular remodeling and neurological sequelae, causing discrepant outcome reporting between PCI and non-PCI strategies (35, 51, 56). In addition, geographic region also contributed, and Europe/Asia subgroups indicated different overall I², such as higher HR in Europe for all-cause mortality, 2.28, 95% CI: 1.53–3.40, which may be related to differences in population genetics, dietary urate intake, healthcare access, and comorbid profiles like hypertension and diabetes prevalence. In addition, emerging evidence, including findings from the URRAH project, suggests that lower SUA cut-off values (e.g., >5.1 mg/dL for females and >5.6 mg/dL for males) may more accurately predict cardiovascular events and mortality than traditional thresholds (60). Although diuretic use—a common contributor to hyperuricemia—was adjusted for or reported in the baseline characteristics of many included studies, residual confounding may still be present (61). This could partly explain the heterogeneity observed in our findings and highlights the need for further validation in ACS cohorts.
For stroke and heart failure, differences between studies were smaller. Subgroup analyses elucidated specific influences on these outcomes, particularly follow-up time, ACS subtype, treatment method, and geographic region, with several subgroups showing reduced heterogeneity. Stroke risk showed a HR of 1.45 in short-term follow-up groups and 2.11 in STEMI groups. This may be because HSUA patients have higher risk for blood vessel events during the acute phase. This is caused by differences in thrombogenesis or inflammatory processes. Long-term data may show reduced risk through inflammation control and active medical treatments. In heart failure, patients with HSUA showed consistently higher risk across multiple subgroups, with the association most pronounced in European cohorts. These factors include dietary patterns, lifestyle, or differences in medical intervention standards.
This study highlights SUA as a prognostic marker in ACS, showing its link to adverse outcomes. The heterogeneity observed suggests that HSUA's role in ACS prognosis is influenced by clinical, methodological, and demographic factors. It explains how uric acid contributes to cardiovascular issues through inflammation and oxidative stress. The risks associated with HSUA suggest the potential of urate-lowering therapies in ACS treatment. Future research should use standardized SUA thresholds, consider confounders like diuretic use, and employ larger, diverse prospective cohorts to refine these findings.
5 Conclusion
The clinical value of SUA as a possible target for intervention, HSUA greatly increases the risk of all-cause mortality, cardiovascular mortality, MACE, stroke, and heart failure in these patients and has a nonlinear mortality connection. However, other factors may confound these conclusions. There should be more high-quality randomized controlled trials to confirm the effect of controlling blood uric acid on prognosis.
Statements
Data availability statement
The original contributions presented in the study are included in the article/Supplementary Material, further inquiries can be directed to the corresponding authors.
Author contributions
ZS: Conceptualization, Data curation, Writing – original draft, Methodology. JH: Data curation, Methodology, Writing – original draft. YW: Data curation, Writing – review & editing. JW: Visualization, Writing – review & editing. RH: Visualization, Writing – review & editing. LL: Funding acquisition, Visualization, Writing – review & editing. YC: Writing – review & editing, Supervision. JG: Conceptualization, Funding acquisition, Supervision, Writing – review & editing.
Funding
The author(s) declared that financial support was received for this work and/or its publication. This work was supported by the 2023 Natural Science Foundation Project of Jilin Province (YDZJ202301ZYTS163), the 2023 Innovation and Entrepreneurship Talent Funding Project of Jilin Province (2023QN22), and the Weifang Development Plan Project (2022YX014).
Conflict of interest
The author(s) declared that this work was conducted in the absence of any commercial or financial relationships that could be construed as a potential conflict of interest.
Generative AI statement
The author(s) declared that generative AI was not used in the creation of this manuscript.
Any alternative text (alt text) provided alongside figures in this article has been generated by Frontiers with the support of artificial intelligence and reasonable efforts have been made to ensure accuracy, including review by the authors wherever possible. If you identify any issues, please contact us.
Publisher’s note
All claims expressed in this article are solely those of the authors and do not necessarily represent those of their affiliated organizations, or those of the publisher, the editors and the reviewers. Any product that may be evaluated in this article, or claim that may be made by its manufacturer, is not guaranteed or endorsed by the publisher.
Supplementary material
The Supplementary Material for this article can be found online at: https://www.frontiersin.org/articles/10.3389/fcvm.2025.1670418/full#supplementary-material
References
1.
Kraler S Mueller C Libby P Bhatt DL . Acute coronary syndromes: mechanisms, challenges, and new opportunities. Eur Heart J. (2025) 46:2866–89. 10.1093/eurheartj/ehaf289
2.
Georgiopoulos G Kraler S Mueller-Hennessen M Delialis D Mavraganis G Sopova K et al Modification of the GRACE risk score for risk prediction in patients with acute coronary syndromes. JAMA Cardiol. (2023) 8(10):946–56. 10.1001/jamacardio.2023.2741
3.
Liao J Qiu M Su X Qi Z Xu Y Liu H et al The residual risk of inflammation and remnant cholesterol in acute coronary syndrome patients on statin treatment undergoing percutaneous coronary intervention. Lipids Health Dis. (2024) 23(1):172. 10.1186/s12944-024-02156-3
4.
Gherghina ME Peride I Tiglis M Neagu TP Niculae A Checherita IA . Uric acid and oxidative stress-relationship with cardiovascular, metabolic, and renal impairment. Int J Mol Sci. (2022) 23(6):3188. 10.3390/ijms23063188
5.
Kimura Y Tsukui D Kono H . Uric acid in inflammation and the pathogenesis of atherosclerosis. Int J Mol Sci. (2021) 22(22):12394. 10.3390/ijms222212394
6.
Nie S Zhao Y Feng Z Zou C Ding F Gong L et al Effect of ticagrelor versus clopidogrel on all-cause and cardiovascular mortality in acute coronary syndrome patients with hyperuricemia. Clin Drug Investig. (2024) 44(3):163–74. 10.1007/s40261-024-01342-6
7.
Liu CW Liao PC Chen KC Chiu YW Liu YH Ke SR et al Relationship of serum uric acid and Killip class on mortality after acute ST-segment elevation myocardial infarction and primary percutaneous coronary intervention. Int J Cardiol. (2017) 226:26–33. 10.1016/j.ijcard.2016.10.025
8.
He C Lin P Liu W Fang K . Prognostic value of hyperuricemia in patients with acute coronary syndrome: a meta-analysis. Eur J Clin Invest. (2019) 49(4):e13074. 10.1111/eci.13074
9.
Singh G Lingala B Mithal A . Gout and hyperuricaemia in the USA: prevalence and trends. Rheumatology (Oxford). (2019) 58(12):2177–80. 10.1093/rheumatology/kez196
10.
Page MJ McKenzie JE Bossuyt PM Boutron I Hoffmann TC Mulrow CD et al The PRISMA 2020 statement: an updated guideline for reporting systematic reviews. Br Med J. (2021) 372:n71. 10.1136/bmj.n71
11.
Rebora P Andreano A Triglione N Piccinelli E Palazzini M Occhi L et al Association between uric acid and pulse wave velocity in hypertensive patients and in the general population: a systematic review and meta-analysis. Blood Press. (2020) 29(4):220–31. 10.1080/08037051.2020.1735929
12.
DerSimonian R Laird N . Meta-analysis in clinical trials. Control Clin Trials. (1986) 7(3):177–88. 10.1016/0197-2456(86)90046-2
13.
Schünemann HJ Vist GE Higgins JP Santesso N Deeks JJ Glasziou P et al Interpreting Results and Drawing Conclusions. Available online at: https://training.cochrane.org/handbook/current/chapter-15 (Accessed Jun 12, 2023).
14.
Svanfeldt M Thorell A Hausel J Soop M Rooyackers O Nygren J et al Randomized clinical trial of the effect of preoperative oral carbohydrate treatment on postoperative whole-body protein and glucose kinetics. Br J Surg. (2007) 94(11):1342–50. 10.1002/bjs.5919
15.
Mathur S Plank LD McCall JL Shapkov P McIlroy K Gillanders LK et al Randomized controlled trial of preoperative oral carbohydrate treatment in major abdominal surgery. Br J Surg. (2010) 97(4):485–94. 10.1002/bjs.7026
16.
Greenland S Longnecker MP . Methods for trend estimation from summarized dose-response data, with applications to meta-analysis. Am J Epidemiol. (1992) 135(11):1301–9. 10.1093/oxfordjournals.aje.a116237
17.
Orsini N Bellocco R Greenland S . Generalized least squares for trend estimation of summarized dose–response data. Stata J. (2006) 6(1):40–57. 10.1177/1536867X0600600103
18.
White IR . Multivariate random-effects meta-regression: updates to mvmeta. Stata J. (2011) 11(2):255–70. 10.1177/1536867X1101100206
19.
Hartemink N Boshuizen HC Nagelkerke NJ Jacobs MA van Houwelingen HC . Combining risk estimates from observational studies with different exposure cutpoints: a meta-analysis on body mass index and diabetes type 2. Am J Epidemiol. (2006) 163(11):1042–52. 10.1093/aje/kwj141
20.
Hamling J Lee P Weitkunat R Ambuhl M . Facilitating meta-analyses by deriving relative effect and precision estimates for alternative comparisons from a set of estimates presented by exposure level or disease category. Stat Med. (2008) 27(7):954–70. 10.1002/sim.3013
21.
Akpek M Kaya MG Uyarel H Yarlioglues M Kalay N Gunebakmaz O et al The association of serum uric acid levels on coronary flow in patients with STEMI undergoing primary PCI. Atherosclerosis. (2011) 219(1):334–41. 10.1016/j.atherosclerosis.2011.07.021
22.
Basar N Sen N Ozcan F Erden G Kanat S Sokmen E et al Elevated serum uric acid predicts angiographic impaired reperfusion and 1-year mortality in ST-segment elevation myocardial infarction patients undergoing percutaneous coronary intervention. J Investig Med. (2011) 59(6):931–7. 10.2310/JIM.0b013e318214ebaf
23.
Chen L Li XL Qiao W Ying Z Qin YL Wang Y et al Serum uric acid in patients with acute ST-elevation myocardial infarction. World J Emerg Med. (2012) 3(1):35–9. 10.5847/wjem.j.issn.1920-8642.2012.01.006
24.
Kaya MG Uyarel H Akpek M Kalay N Ergelen M Ayhan E et al Prognostic value of uric acid in patients with ST-elevated myocardial infarction undergoing primary coronary intervention. Am J Cardiol. (2012) 109(4):486–91. 10.1016/j.amjcard.2011.09.042
25.
Krishnan E Pandya BJ Lingala B Hariri A Dabbous O . Hyperuricemia and untreated gout are poor prognostic markers among those with a recent acute myocardial infarction. Arthritis Res Ther. (2012) 14(1):R10. 10.1186/ar3684
26.
Ndrepepa G Braun S Haase H-U Schulz S Ranftl S Hadamitzky M et al Prognostic value of uric acid in patients with acute coronary syndromes. Am J Cardiol. (2012) 109(9):1260–5. 10.1016/j.amjcard.2011.12.018
27.
Omidvar B Ayatollahi F Alasti M . The prognostic role of serum uric acid level in patients with acute ST elevation myocardial infarction. J Saudi Heart Assoc. (2012) 24(2):73–8. 10.1016/j.jsha.2012.01.005
28.
Wang JW Chen YD Wang CH Zhu XL . Correlation of serum uric acid levels with coronary flow in patients with ST-segment elevation myocardial infarction undergoing primary coronary intervention. Zhonghua Yi Xue Za Zhi. (2012) 92(44):3100–3. 10.3760/cma.j.issn.0376-2491.2012.44.003
29.
Levantesi G Marfisi RM Franzosi MG Maggioni AP Nicolosi GL Schweiger C et al Uric acid: a cardiovascular risk factor in patients with recent myocardial infarction. Int J Cardiol. (2013) 167(1):262–9. 10.1016/j.ijcard.2011.12.110
30.
Timoteo AT Lousinha A Labandeiro J Miranda F Papoila AL Oliveira JA et al Serum uric acid: a forgotten prognostic marker in acute coronary syndromes? Eur Heart J Acute Cardiovasc Care. (2013) 2(1):44–52. 10.1177/2048872612474921
31.
Akgul O Uyarel H Pusuroglu H Gul M Isiksacan N Turen S et al Predictive value of elevated uric acid in turkish patients undergoing primary angioplasty for ST elevation myocardial infarction. Acta Cardiol Sin. (2014) 30(2):119–27. Available online at: https://pubmed.ncbi.nlm.nih.gov/27122778/
32.
Gazi E Temiz A Altun B Barutcu A Bekler A Gungor O et al The association between serum uric acid level and heart failure and mortality in the early period of ST-elevation acute myocardial infarction. Turk Kardiyol Dern Ars. (2014) 42(6):501–8. 10.5543/tkda.2014.65507
33.
Karim B Nasution SA Wijaya IP Harimurti K . Hyperuricemia as a risk factors of major adverse cardiac events in patients with acute coronary syndrome: a retrospective cohort study. Acta Med Indones. (2015) 47(4):320–5. Available online at: https://pubmed.ncbi.nlm.nih.gov/26932701/
34.
Lazzeri C Valente S Chiostri M Gensini GF . Long-term prognostic role of uric acid in patients with ST-elevation myocardial infarction and renal dysfunction. J Cardiovasc Med (Hagerstown. (2015) 16(11):790–4. 10.2459/JCM.0000000000000238
35.
von Lueder TG Girerd N Atar D Agewall S Lamiral Z Kanbay M et al Serum uric acid is associated with mortality and heart failure hospitalizations in patients with complicated myocardial infarction: findings from the high-risk myocardial infarction database initiative. Eur J Heart Fail. (2015) 17(11):1144–51. 10.1002/ejhf.419
36.
Hajizadeh R Ghaffari S Salehi R Mazani S Aghavali S . Association of serum uric acid level with mortality and morbidity of patients with acute ST-elevation myocardial infarction. J Cardiovasc Thorac Res. (2016) 8(2):56–60. 10.15171/jcvtr.2016.11
37.
Magnoni M Berteotti M Ceriotti F Mallia V Vergani V Peretto G et al Serum uric acid on admission predicts in-hospital mortality in patients with acute coronary syndrome. Int J Cardiol. (2017) 240:25–9. 10.1016/j.ijcard.2017.04.027
38.
Mora-Ramirez M Estevez-Garcia IO Irigoyen-Camacho ME Bojalil R Gonzalez-Pacheco H Amezcua-Guerra LM . Hyperuricemia on admission predicts short-term mortality due to myocardial infarction in a population with high prevalence of cardiovascular risk factors. Rev Invest Clin. (2017) 69(5):247–53. 10.24875/ric.17002167
39.
Pagidipati NJ Hess CN Clare RM Akerblom A Tricoci P Wojdyla D et al An examination of the relationship between serum uric acid level, a clinical history of gout, and cardiovascular outcomes among patients with acute coronary syndrome. Am Heart J. (2017) 187:53–61. 10.1016/j.ahj.2017.02.023
40.
Ranjith N Myeni NN Sartorius B Mayise C . Association between hyperuricemia and major adverse cardiac events in patients with acute myocardial infarction. Metab Syndr Relat Disord. (2017) 15(1):18–25. 10.1089/met.2016.0032
41.
Kobayashi N Asai K Tsurumi M Shibata Y Okazaki H Shirakabe A et al Impact of accumulated serum uric acid on coronary culprit lesion morphology determined by optical coherence tomography and cardiac outcomes in patients with acute coronary syndrome. Cardiology. (2018) 141(4):190–8. 10.1159/000496053
42.
Kobayashi N Hata N Tsurumi M Shibata Y Okazaki H Shirakabe A et al Relation of coronary culprit lesion morphology determined by optical coherence tomography and cardiac outcomes to serum uric acid levels in patients with acute coronary syndrome. Am J Cardiol. (2018) 122(1):17–25. 10.1016/j.amjcard.2018.03.022
43.
Lopez-Pineda A Cordero A Carratala-Munuera C Orozco-Beltran D Quesada JA Bertomeu-Gonzalez V et al Hyperuricemia as a prognostic factor after acute coronary syndrome. Atherosclerosis. (2018) 269:229–35. 10.1016/j.atherosclerosis.2018.01.017
44.
Tscharre M Herman R Rohla M Hauser C Farhan S Freynhofer MK et al Uric acid is associated with long-term adverse cardiovascular outcomes in patients with acute coronary syndrome undergoing percutaneous coronary intervention. Atherosclerosis. (2018) 270:173–9. 10.1016/j.atherosclerosis.2018.02.003
45.
Ye Z Lu H Long M Li L . Baseline serum uric acid levels are associated with all-cause mortality in acute coronary syndrome patients after percutaneous coronary intervention. Dis Markers. (2018) 2018:9731374. 10.1155/2018/9731374
46.
Guo W Yang D Wu D Liu H Chen S Liu J et al Hyperuricemia and long-term mortality in patients with acute myocardial infarction undergoing percutaneous coronary intervention. Ann Transl Med. (2019) 7(22):636. 10.21037/atm.2019.10.110
47.
Centola M Maloberti A Castini D Persampieri S Sabatelli L Ferrante G et al Impact of admission serum acid uric levels on in-hospital outcomes in patients with acute coronary syndrome. Eur J Intern Med. (2020) 82:62–7. 10.1016/j.ejim.2020.07.013
48.
Tai S Li X Zhu Z Tang L Yang H Fu L et al Hyperuricemia is a risk factor for one-year overall survival in elderly female patients with acute coronary syndrome. Cardiovasc Ther. (2020) 2020:1–10. 10.1155/2020/2615147
49.
Dyrbus M Desperak P Pawelek M Mozdzen M Gasior M Hawranek M . Serum uric acid is an independent risk factor of worse mid- and long-term outcomes in patients with non-ST-segment elevation acute coronary syndromes. Cardiol J. (2021) 30(6):984–94. 10.5603/CJ.a2021.0156
50.
Ma W Gao S Huang S Yuan J Yu M . Hyperuricemia as a prognostic marker for long-term outcomes in patients with myocardial infarction with nonobstructive coronary arteries. Nutr Metab (Lond). (2021) 18(1):107. 10.1186/s12986-021-00636-2
51.
Mandurino-Mirizzi A Cornara S Somaschini A Demarchi A Galazzi M Puccio S et al Elevated serum uric acid is associated with a greater inflammatory response and with short- and long-term mortality in patients with ST-segment elevation myocardial infarction undergoing primary percutaneous coronary intervention. Nutr Metab Cardiovasc Dis. (2021) 31(2):608–14. 10.1016/j.numecd.2020.10.020
52.
Mohammed AQ Abdu FA Liu L Zhang W Yin G Xu Y et al Hyperuricemia predicts adverse outcomes after myocardial infarction with non-obstructive coronary arteries. Front Med (Lausanne). (2021) 8:716840. 10.3389/fmed.2021.716840
53.
Kim S Hwang BH Lee KY Kim CJ Choo EH Lim S et al High uric acid levels in acute myocardial infarction provide better long-term prognosis predictive power when combined with traditional risk factors. J Clin Med. (2022) 11(19):5531. 10.3390/jcm11195531
54.
Nakahashi T Sakata K Masuda J Kumagai N Higuma T Ogimoto A et al Impact of hyperuricemia on coronary blood flow and in-hospital mortality in patients with acute myocardial infarction undergoing percutaneous coronary intervention. J Cardiol. (2022) 80(3):268–74. 10.1016/j.jjcc.2022.04.009
55.
Nakahashi T Tada H Sakata K Yoshida T Tanaka Y Nomura A et al The association between serum uric acid and mortality in patients with acute coronary syndrome after percutaneous coronary intervention. Int Heart J. (2022) 63(3):447–53. 10.1536/ihj.21-764
56.
Tang XF He C Zhu P Zhang C Song Y Xu JJ et al Hyperuricemia is associated with 2- and 5-year adverse outcomes in patients with ST-segment elevation myocardial infarction undergoing percutaneous coronary intervention. Front Endocrinol (Lausanne). (2022) 13:852247. 10.3389/fendo.2022.852247
57.
Liang D Zhu Q He Y Lin Q Feng X Hu L et al The interaction between hyperuricemia and low-density lipoprotein cholesterol increases the risk of 1-year post-discharge all-cause mortality in ST-segment elevation myocardial infarction patients. Nutr Metab Cardiovasc Dis. (2023) 33(1):133–40. 10.1016/j.numecd.2022.09.011
58.
Li Y Sang T Lv N Liu J Gu Y Han X et al The impact of uric acid on acute coronary syndrome prognosis in elderly patients. Ann Med. (2025) 57(1):2445200. 10.1080/07853890.2024.2445200
59.
Rebora P Centola M Morici N Sacco A Occhino G Viola G et al Uric acid associated with acute heart failure presentation in acute coronary syndrome patients. Eur J Intern Med. (2022) 99:30–7. 10.1016/j.ejim.2022.01.018
60.
Maloberti A Mengozzi A Russo E Cicero AFG Angeli F Agabiti Rosei E et al The results of the URRAH (uric acid right for heart health) project: a focus on hyperuricemia in relation to cardiovascular and kidney disease and its role in metabolic dysregulation. High Blood Press Cardiovasc Prev. (2023) 30(5):411–25. 10.1007/s40292-023-00602-4
61.
Maloberti A Bombelli M Facchetti R Barbagallo CM Bernardino B Rosei EA et al Relationships between diuretic-related hyperuricemia and cardiovascular events: data from the uric acid right for heart health study. J Hypertens. (2021) 39(2):333–40. 10.1097/HJH.0000000000002600
Summary
Keywords
serum uric acid, acute coronary syndrome, prognosis, systematic review, meta-analysis
Citation
Sun Z, Hui J, Wang Y, Wang J, He R, Lyu L, Cui Y and Guo J (2026) Serum uric acid level and prognosis of acute coronary syndrome: a systematic review and dose-response meta-analysis. Front. Cardiovasc. Med. 12:1670418. doi: 10.3389/fcvm.2025.1670418
Received
22 July 2025
Revised
31 October 2025
Accepted
15 December 2025
Published
09 January 2026
Volume
12 - 2025
Edited by
Maurizio Giuseppe Abrignani, Asp Trapani, Italy
Reviewed by
Ivica Bosnjak, Osijek Clinical Hospital Center, Croatia
Himanshu Rai, Mater Private Network, Ireland
Updates
Copyright
© 2026 Sun, Hui, Wang, Wang, He, Lyu, Cui and Guo.
This is an open-access article distributed under the terms of the Creative Commons Attribution License (CC BY). The use, distribution or reproduction in other forums is permitted, provided the original author(s) and the copyright owner(s) are credited and that the original publication in this journal is cited, in accordance with accepted academic practice. No use, distribution or reproduction is permitted which does not comply with these terms.
* Correspondence: Jiajuan Guo gjj-2005@163.com Yingzi Cui yingzi930@sina.com
Disclaimer
All claims expressed in this article are solely those of the authors and do not necessarily represent those of their affiliated organizations, or those of the publisher, the editors and the reviewers. Any product that may be evaluated in this article or claim that may be made by its manufacturer is not guaranteed or endorsed by the publisher.