Abstract
Background:
Vasovagal syncope (VVS) is the most common type of reflex syncope. Although typically benign in its clinical course, VVS may lead to injury and reduced quality of life. Autonomic nervous system imbalance is considered the core pathophysiological mechanism of VVS. Heart rate variability (HRV), a noninvasive marker of autonomic regulation, may have practical value in identifying VVS and its subtypes; however, its predictive utility has not been fully elucidated.
Methods:
In this single-center retrospective case-control study, we included 415 patients with syncope symptoms who underwent both 24-hour Holter monitoring and a head-up tilt test (HUTT) between January 2021 and December 2024. Based on HUTT results, patients were classified into a VVS-positive group (n = 279) and a control group (n = 136). HRV parameters extracted from Holter recordings included 24 h average, maximum and minimum heart rates (HRs), standard deviation of NN intervals (SDNN), triangular index (TI), root mean square of successive differences (rMSSD), and the percentage of NN intervals differing by more than 50 ms (pNN50). Associations and predictive performance were assessed using logistic regression and receiver operating characteristic (ROC) analysis.
Results:
Multivariable logistic regression revealed that 24 h average HRs (OR: 0.935; 95% CI: 0.912–0.959; P < 0.001), 24 h maximum HRs (OR: 0.976; 95% CI: 0.964–0.989; P < 0.001), 24 h minimum HRs (OR: 0.947; 95% CI: 0.915–0.980; P = 0.002), TI (OR: 1.032; 95% CI: 1.009–1.056; P = 0.006), SDNN (OR: 1.029; 95% CI: 1.016–1.043; P < 0.001), rMSSD (OR: 1.023; 95% CI: 1.007–1.038; P = 0.004), and pNN50 (OR: 1.028; 95% CI: 1.006–1.051; P = 0.013) were independently associated with the occurrence of VVS. ROC analysis showed that 24 h average HRs (AUC: 0.688; 95% CI: 0.632–0.744), 24 h maximum HRs (AUC: 0.652; 95% CI: 0.594–0.709), and SDNN (AUC: 0.614; 95% CI: 0.557–0.672) exhibited moderate predictive ability for VVS.
Conclusion:
HRV parameters are associated with the occurrence of VVS. As a noninvasive and continuous physiological biomarker, HRV may aid in the clinical screening, risk stratification, and phenotypic classification of patients with suspected VVS.
Background
Syncope is one of the common clinical symptoms and refers to a sudden and transient loss of consciousness caused by brief, reversible cerebral hypoperfusion, usually accompanied by postural collapse and followed by spontaneous recovery within minutes (1). Based on underlying pathophysiological mechanisms, syncope is generally classified into three major categories: reflex syncope, cardiac syncope, and orthostatic hypotension-related syncope (2). Vasovagal syncope (VVS) is the most common form of reflex syncope, accounting for approximately 30% to 40% of all syncope cases (3). VVS predominantly affects adolescents and young adults, and is characterized by sudden onset, variable symptoms, and a high recurrence rate (4). The pathogenesis of VVS is primarily attributed to autonomic dysregulation, manifested as abrupt withdrawal of sympathetic activity and/or exaggerated vagal response, leading to a concomitant decline in heart rates (HRs) and blood pressure and resulting in transient cerebral hypoperfusion (5). VVS episodes are often triggered by predisposing factors such as prolonged standing, emotional stress, or pain. These stimuli promote lower extremity venous pooling and reduced venous return, causing inadequate left ventricular filling and heightened sensitivity of ventricular wall mechanoreceptors (6). Although VVS typically follows a benign course, it may lead to fall-related injuries, traffic accidents, or other secondary harm during an episode, posing a potential public health and safety risk (7).
The head-up tilt test (HUTT) is currently the most widely used provocation method for assessing VVS in clinical settings. By simulating orthostatic hemodynamic stress observed in daily life, HUTT induces syncope or presyncope symptoms, thereby assisting in the differential diagnosis of underlying causes (8, 9). However, how to achieve noninvasive, dynamic, and early prediction of VVS episodes remains a pressing challenge in the field of autonomic function assessment (10). Heart rate variability (HRV), defined as the physiological fluctuation in consecutive RR intervals under sinus rhythm, reflects temporal changes in cardiac autonomic modulation and is considered a key marker of the autonomic nervous system's adaptability to internal and external stimuli (11). HRV is jointly regulated by sympathetic and parasympathetic branches of the autonomic nervous system and is influenced by respiratory rhythm, blood pressure regulation, emotional state, and metabolic status (12). Previous studies have demonstrated the prognostic value of HRV in patients with atrial fibrillation, heart failure, and myocardial infarction (13, 14). In patients with VVS, HRV has been shown to reflect baseline autonomic tone as well as pre-syncopal changes, indicating its potential as a predictive biomarker and interventional window (15, 16). Nevertheless, systematic comparisons of different HRV parameters in VVS remain limited, and their specificity across various clinical subtypes of VVS has not been clearly defined. Therefore, this study aims to analyze the characteristic patterns of HRV parameters in patients with VVS and to further evaluate their predictive value in both overall VVS and its distinct subtypes, providing a theoretical basis and quantitative tool to support individualized clinical management strategies.
Methods
Study design
This was a single-center retrospective case-control study. Hospitalized patients who underwent both 24 h Holter monitoring and HUTT in the Department of Cardiac Function, First Affiliated Hospital of Xinjiang Medical University, between January 2021 and December 2024 were consecutively enrolled. The study was conducted by the principles of the Declaration of Helsinki and was approved by the Human Ethics Committee of the First Affiliated Hospital of Xinjiang Medical University.
Study population
Patients were included if they met all of the following criteria: (1) age ≥ 18 years; (2) a documented history of syncope triggered by prolonged standing, pain, or emotional stress; (3) completion of 24 h Holter monitoring during hospitalization; and (4) completion of a full HUTT after admission. Exclusion criteria were as follows: (1) presence of structural heart disease (e.g., valvular disease, cardiomyopathy, or congenital heart disease); (2) cardiogenic syncope (e.g., ventricular arrhythmias, atrioventricular block, or a family history of sudden cardiac death); (3) neurogenic syncope (e.g., epilepsy or psychogenic pseudosyncope); (4) current diagnosis of psychiatric disorders or use of antidepressants, antiepileptics, or other neuroactive medications; and (5) Holter monitoring duration less than 6 h.
Clinical data collection
Demographic and clinical data were retrospectively collected from the electronic medical records, including age, sex, body mass index (BMI), history of hypertension, diabetes mellitus, and cardiovascular disease (CVD) at the time of hospital admission. Laboratory tests included hemoglobin, serum potassium (K+), glycated hemoglobin (HbA1c), N-terminal pro-brain natriuretic peptide (NT-proBNP), and interleukin-6 (IL-6). A history of hypertension was defined based on patient self-report, ambulatory blood pressure monitoring results, or current use of antihypertensive medications. Cardiovascular diseases included coronary artery disease, heart failure, angina pectoris, myocardial infarction, or stroke. Diabetes mellitus was defined by one or more of the following criteria: self-reported history, HbA1c level >6.5%, fasting plasma glucose ≥7.0 mmol/L, or use of glucose-lowering medications or insulin.
24-hour Holter monitoring
Within 24 h of admission, all patients underwent 24 h Holter monitoring using the MedEx MECG-200 device (Beijing, China). Recordings were acquired at a sampling frequency of 250 Hz, with patients instructed to maintain their usual daily activities during monitoring. Following completion of the 24 h recording, the device was retrieved. MedEx analysis software automatically detected artifacts, premature ectopic beats, and segments with noise contamination, which were then manually reviewed and confirmed by two physicians with intermediate or higher titles. Segments requiring editing (RR interval <5%) or with noise contamination >10% were excluded from each record. Only normal heartbeat intervals (NN intervals) were used to calculate heart rate variability indices. The following parameters were extracted: 24-hour maximum HRs, minimum HRs, and average HRs; standard deviation of normal-to-normal RR intervals (SDNN); triangular index (TI); root mean square of successive differences (rMSSD); percentage of successive RR intervals differing by more than 50 ms (pNN50); low-frequency power (LF); high-frequency power (HF); and the ratio of low-frequency to high-frequency power (LF: HF).
Head-up tilt test
All patients in this study underwent a standardized HUTT with continuous electrocardiographic and noninvasive blood pressure monitoring. The procedure was conducted in a quiet, temperature-controlled examination room, following the protocol recommended by the 2018 Chinese Expert Consensus on the Diagnosis and Treatment of Syncope (17). All participants were required to fast for at least 4 h and discontinue any medications that might affect autonomic function for at least 48 h before testing. The test protocol was as follows: patients rested in the supine position on a tilt table for 10 min while baseline ECG and blood pressure were recorded. The table was then tilted gradually to a 70° angle. During the tilt phase, patients were continuously monitored for presyncope symptoms such as dizziness, nausea, pallor, or sweating, as well as for typical autonomic responses such as sudden drops in heart rate or blood pressure. The passive phase lasted for up to 40 min. For patients without a positive response during the passive phase, 5 μg/kg of sublingual nitroglycerin or an equivalent dose of isoproterenol was administered. The pharmacological phase continued for an additional 20 min. If a positive response occurred, the test was immediately terminated; if no response occurred within 20 min, the test was considered negative. For patients with a positive response, the type of reaction was recorded and classified into one of the three subtypes of VVS based on heart rate and blood pressure patterns: mixed type, cardioinhibitory type, or vasodepressor type.
Statistical analysis
All statistical analyses were performed using R software (version 4.4.2). Based on the HUTT results, participants were divided into the VVS-positive group and the control group. Baseline characteristics, HRV parameters, and HUTT outcomes were compared between groups. Continuous variables with non-normal distributions were expressed as median and interquartile range (25th and 75th percentiles), and differences between groups were assessed using the Mann–Whitney U test. Categorical variables were presented as frequencies (percentages) and compared using the chi-square test. To compare HRV parameters among different VVS subtypes, the Kruskal–Wallis test was employed. Spearman correlation analysis was used to examine the associations between various HRV parameters. Logistic regression analysis was used to explore the independent associations between HRV and the presence of VVS and its subtypes. The predictive ability of each HRV parameter for identifying VVS and its subtypes was assessed using receiver operating characteristic (ROC) curve analysis. A two-tailed P-value < 0.05 was considered statistically significant for all analyses.
Results
Baseline characteristics of participants
A total of 415 patients with syncope symptoms were enrolled in this study. The median age was 52 years, with 212 (51.1%) males and 203 (48.9%) females. Based on the results of the HUTT, 279 patients were classified into the positive group and 136 into the control group. There were no significant differences between the two groups in terms of sex, prevalence of diabetes mellitus, CVD, hemoglobin levels, serum potassium, or HbA1c levels (P > 0.05). However, the positive group had significantly higher age, prevalence of hypertension, NT-proBNP levels, and IL-6 levels, while BMI was significantly lower compared to the control group (P < 0.05) (Table 1). In the HUTT, patients in the positive group exhibited significantly lower values in tilt duration, supine heart rate, minimum systolic blood pressure, minimum diastolic blood pressure, and minimum heart rate (P < 0.05). In contrast, the maximum heart rate change during the test was significantly greater in the positive group compared to the control group (P < 0.05). There were no significant differences in supine systolic or diastolic blood pressure between the two groups (P > 0.05) (Table 2).
Table 1
| Characteristics | Total (n = 415) | Control group (n = 136) | Positive group (n = 279) | χ 2/U | P-value |
|---|---|---|---|---|---|
| Sex | |||||
| Male | 212 (51.1) | 75 (55.1) | 137 (49.1) | 1.336 | 0.248 |
| Female | 203 (48.9) | 61 (44.9) | 142 (50.9) | ||
| Diabetes | 26 (6.3) | 7 (5.1) | 19 (6.8) | 0.431 | 0.512 |
| CVD | 71 (17.1) | 17 (12.5) | 54 (19.4) | 3.029 | 0.082 |
| Hypertension | 113 (27.2) | 26 (19.1) | 87 (31.2) | 6.717 | 0.010 |
| Age, years | 52.0 (44.0,62.0) | 49.0 (43.0,56.0) | 56.0 (44.0,64.0) | −3.567 | <0.001 |
| BMI, kg/m2 | 24.7 (22.6,27.2) | 25.9 (23.6,28.1) | 24.2 (22.2,26.2) | 5.299 | <0.001 |
| Hemoglobin, g/L | 134.0 (125.0,144.0) | 132.0 (125.0,143.0) | 135.0 (125.0,145.0) | −0.436 | 0.663 |
| K+, mmolL | 3.79 (3.60,3.99) | 3.85 (3.63,4.00) | 3.78 (3.58,3.99) | 1.431 | 0.152 |
| HbA1C, % | 5.59 (5.40,5.85) | 5.56 (5.40,5.76) | 5.60 (5.40,5.90) | −1.772 | 0.076 |
| NT-proBNP, pg/mL | 43.0 (23.0,72.7) | 29.9 (20.9,52.4) | 51.1 (27.2,91.3) | −4.837 | <0.001 |
| IL-6, pg/mL | 2.57 (1.71,5.15) | 1.94 (1.50,3.40) | 3.00 (1.94,6.14) | −4.856 | <0.001 |
General clinical information of participants.
BMI, body mass index; HbA1C, glycated hemoglobin; NT-proBNP, N-terminal pro-brain natriuretic peptide; IL-6, interleukin-6; CVD, cardiovascular disease.
Table 2
| Characteristics | Control group | Positive group | U | P-value |
|---|---|---|---|---|
| Tilt duration, min | 40.0 (40.0,40.0) | 26.0 (23.0,29.0) | 16.483 | <0.001 |
| Supine period SBP, mmHg | 121.0 (112.0,134.0) | 123.0 (114.0,134.0) | −1.052 | 0.293 |
| Supine period DBP, mmHg | 75.0 (66.0,82.0) | 77.0 (70.0,84.0) | −1.835 | 0.066 |
| Supine period HRs, bpm | 74.0 (67.0,88.0) | 68.0 (62.0,77.0) | 4.4 | <0.001 |
| Minimum SBP, mmHg | 103.0 (95.0,111.0) | 76.0 (68.0,80.0) | 15.163 | <0.001 |
| Lowest DBP, mmHg | 70.0 (65.0,78.0) | 47.0 (42.0,52.0) | 15.346 | <0.001 |
| Maximum HRs change, bpm | 0.0 (0.0,5.0) | 16.0 (8.0,23.0) | −11.906 | <0.001 |
| Minimum HRs, bpm | 71.0 (64.0,79.0) | 54.0 (44.0,61.0) | 11.808 | <0.001 |
HUTT records of patients in the control group and positive group.
SBP, systolic blood pressure; DBP, diastolic blood pressure; HRs, heart rates.
Relationship between HRV and VVS
Spearman correlation analysis demonstrated that heart rate parameters and HRV indices were moderately associated. Specifically, 24 h Average HRs and 24 h Min HRs were positively correlated with HRV measures, whereas 24 h Max HRs showed negative correlations. In addition, TI, SDNN, rMSSD, pNN50, LF, and HF were all positively correlated with one another (Figure 1). This study demonstrated that patients in the positive group had significantly lower 24 h Average HRs, 24 h Max HRs, 24 h Min HRs, whereas the levels of TI, SDNN, rMSSD, and pNN50 were significantly higher compared to the control group (P < 0.05) (Table 3). Among the 279 patients with a positive HUTT, 23 were classified as cardioinhibitory type, 124 as mixed type, and 132 as vasodepressor type. Further analysis revealed significant differences among the three VVS subtypes in terms of 24 h Max HR, 24 h Min HR, TI, SDNN, rMSSD, pNN50, LF, and HF (P < 0.05) (Table 4).
Figure 1
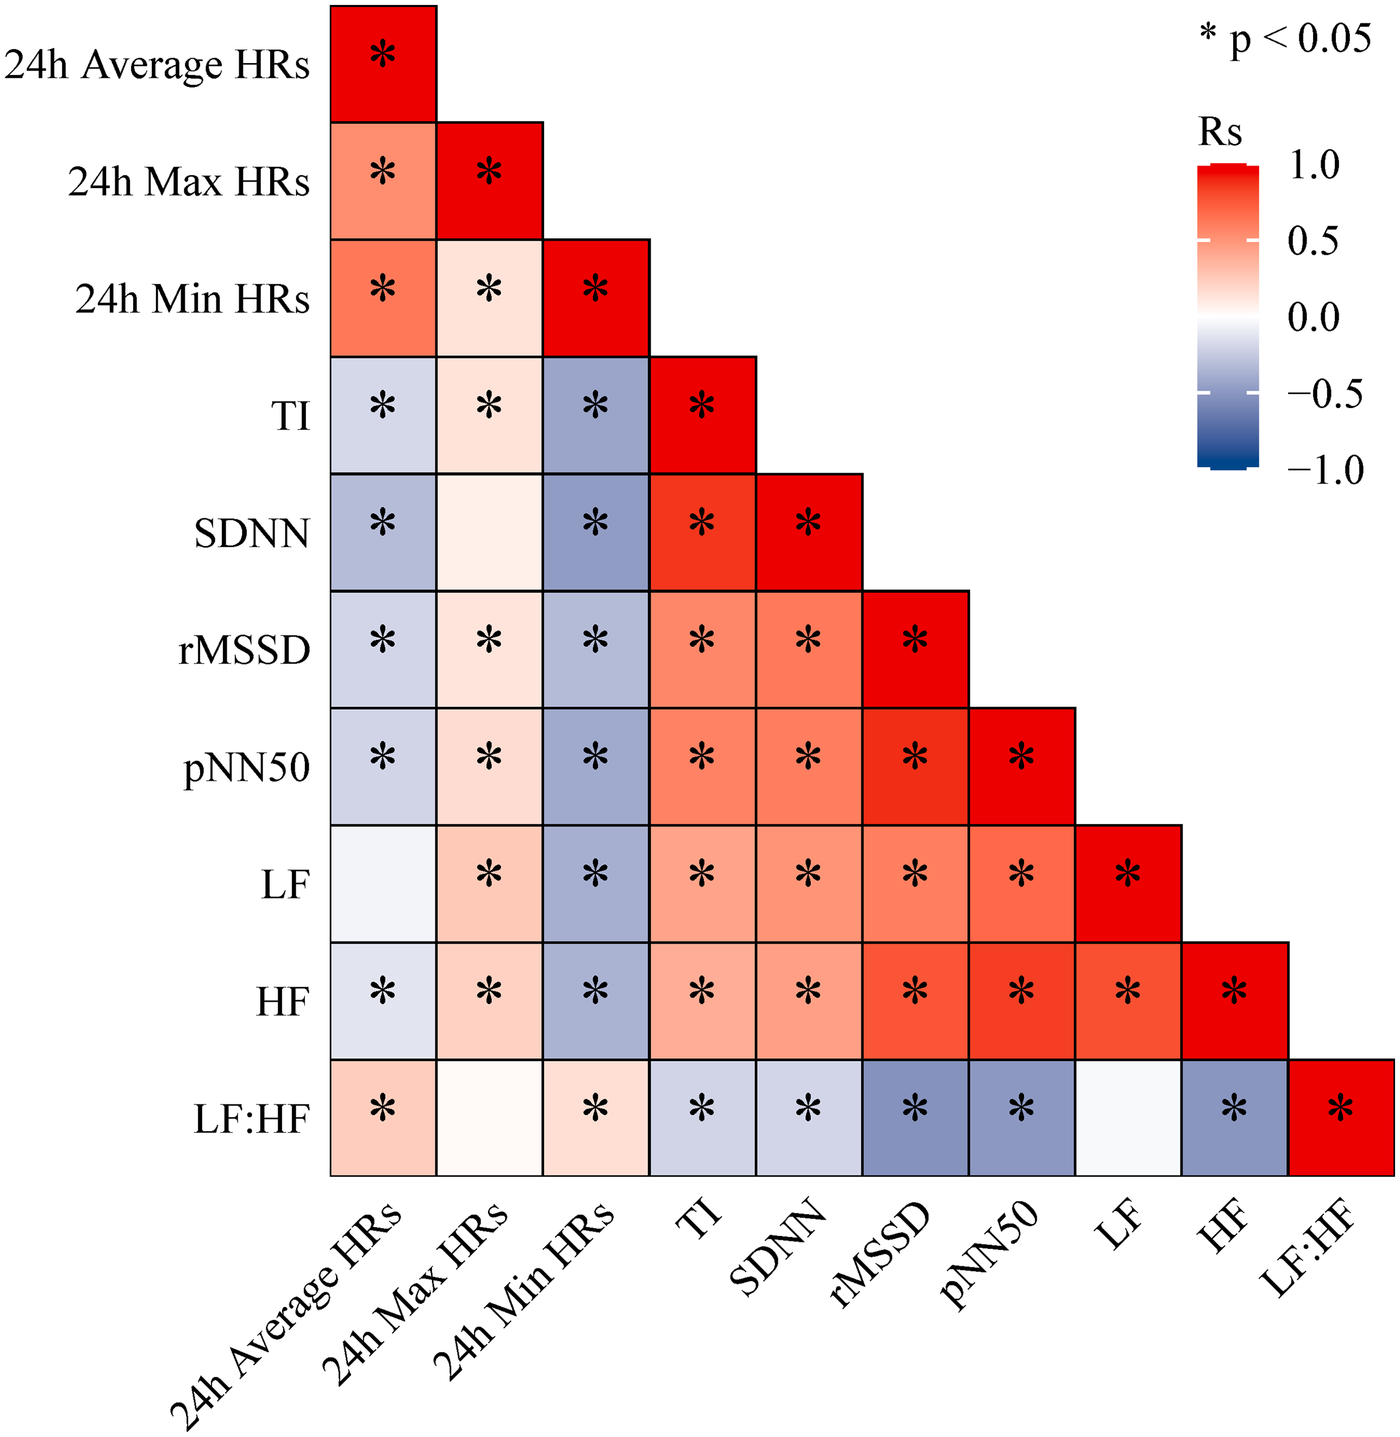
Spearman correlation heatmap between 24-hour holter monitoring indicators.
Table 3
| Characteristics | Total | Control group | Positive group | U | P-value |
|---|---|---|---|---|---|
| 24 h Average HRs | 73.0 (68.0,79.0) | 77.0 (72.0,85.0) | 72.0 (66.0,77.0) | 6.220 | <0.001 |
| 24 h Max HRs | 126.0 (116.0,140.0) | 135.0 (120.0,149.0) | 123.0 (114.0,135.0) | 5.024 | <0.001 |
| 24 h Min HRs | 50.0 (46.0,54.0) | 51.0 (46.0,55.0) | 49.0 (45.0,53.0) | 2.123 | 0.034 |
| TI | 32.6 (27.2,40.3) | 32.9 (26.2,38.7) | 32.5 (28.2,40.9) | −1.548 | 0.122 |
| SDNN | 74.6 (64.8,92.3) | 70.5 (60.3,85.8) | 77.2 (66.1,93.6) | −3.787 | <0.001 |
| rMSSD | 30.7 (23.3,42.6) | 27.9 (20.0,39.4) | 31.4 (24.6,45.6) | −3.035 | 0.002 |
| pNN50 | 7.7 (3.3,16.4) | 6.5 (2.1,16.9) | 7.9 (3.9,16.3) | −2.133 | 0.033 |
| LF | 512.0 (346.1,774.3) | 502.8 (305.3,780.3) | 518.6 (359.3,769.0) | −0.956 | 0.339 |
| HF | 219.0 (138.8,445.6) | 218.1 (113.5,516.4) | 219.9 (146.2,432.6) | −0.892 | 0.372 |
| LF: HF | 2.8 (2.1,3.7) | 3.0 (2.3,3.8) | 2.7 (2.1,3.6) | 1.193 | 0.233 |
HRV parameters of patients in the control group and positive group.
Table 4
| Characteristics | Vasodepressor (n = 132) | Cardioinhibitory (n = 23) | Mixed (n = 124) | U | P-value |
|---|---|---|---|---|---|
| 24 h Average HRs | 72.0 (66.0,75.0) | 70.0 (67.0,75.0) | 72.0 (66.0,79.0) | 2.229 | 0.328 |
| 24 h Max HRs | 121.0 (111.0,134.0) | 124.0 (116.0,133.0) | 127.0 (117.0,140.0) | 9.961 | 0.007 |
| 24 h Min HRs | 50.0 (47.0,53.0) | 46.0 (40.0,50.0) | 49.0 (45.0,54.0) | 7.327 | 0.026 |
| TI | 31.1 (26.7,37.7) | 41.1 (35.2,45.5) | 34.1 (30.0,41.2) | 12.822 | 0.002 |
| SDNN | 75.4 (65.0,90.7) | 91.1 (75.8,102.3) | 77.3 (67.0,94.6) | 6.621 | 0.036 |
| rMSSD | 28.8 (23.4,39.6) | 45.6 (32.8,49.5) | 34.2 (25.1,45.0) | 13.947 | <0.001 |
| pNN50 | 6.1 (3.2,12.7) | 14.0 (9.2,25.9) | 9.4 (4.6,19.3) | 19.908 | <0.001 |
| LF | 462.6 (311.5,657.2) | 750.7 (470.3,829.3) | 544.6 (375.7,878.5) | 13.049 | 0.001 |
| HF | 184.0 (131.1,333.4) | 289.2 (219.9,573.3) | 257.6 (158.0,468.5) | 15.357 | <0.001 |
| LF: HF | 3.0 (2.2,3.9) | 2.7 (2.1,3.2) | 2.5 (2.0,3.4) | 4.389 | 0.111 |
HRV parameters of patients with different types of VVS.
Univariate logistic regression analysis indicated that 24 h Average HRs, 24 h Max HRs, 24 h Min HRs, TI, SDNN, and rMSSD were significantly associated with the occurrence of VVS. After adjusting for age, BMI, history of hypertension, NT-proBNP, and IL-6, multivariate logistic regression analysis showed that 24 h Average HRs (OR: 0.935; 95% CI: 0.912–0.959; P < 0.001), 24 h Max HRs (OR: 0.976; 95% CI: 0.964–0.989; P < 0.001), 24 h Min HRs (OR: 0.947; 95% CI: 0.915–0.980; P = 0.002), TI (OR: 1.032; 95% CI: 1.009–1.056; P = 0.006), SDNN (OR: 1.029; 95% CI: 1.016–1.043; P < 0.001), rMSSD (OR: 1.023; 95% CI: 1.007–1.038; P = 0.004), and pNN50 (OR: 1.028; 95% CI: 1.006–1.051; P = 0.013) were independently associated with the risk of VVS (Table 5).
Table 5
| Characteristics | OR(95% CI) | P-value | OR(95% CI)-adjusted | P-value-adjusted |
|---|---|---|---|---|
| 24 h Average HR | 0.929 (0.907,0.951) | <0.001 | 0.935 (0.912,0.959) | <0.001 |
| 24 h Max HR | 0.972 (0.96,0.983) | <0.001 | 0.976 (0.964,0.989) | <0.001 |
| 24 h Min HR | 0.955 (0.926,0.986) | 0.004 | 0.947 (0.915,0.980) | 0.002 |
| TI | 1.023 (1.006,1.04) | 0.008 | 1.032 (1.009,1.056) | 0.006 |
| SDNN | 1.022 (1.012,1.032) | <0.001 | 1.029 (1.016,1.043) | <0.001 |
| rMSSD | 1.016 (1.003,1.029) | 0.014 | 1.023 (1.007,1.038) | 0.004 |
| pNN50 | 1.014 (0.996,1.031) | 0.129 | 1.028 (1.006,1.051) | 0.013 |
| LF | 1.000 (1.000,1.000) | 0.901 | 1.000 (1.000,1.000) | 0.942 |
| HF | 1.000 (1.000,1.000) | 0.911 | 1.000 (1.000,1.000) | 0.981 |
| LF: HF | 0.905 (0.779,1.051) | 0.192 | 0.918 (0.778,1.083) | 0.309 |
Logistic regression of HRV and occurrence of VVS in participants.
Further logistic regression analyses by VVS subtype showed that 24 h Average HRs, 24 h Max HRs, 24 h Min HRs, TI, and SDNN were independently associated with both vasodepressor and cardioinhibitory types (Supplementary Table S1). pNN50 was also independently associated with the cardioinhibitory type (Supplementary Table S2). In addition, 24 h Average HRs, 24 h Min HRs, TI, SDNN, rMSSD, and pNN50 were independently associated with the mixed type of VVS (Supplementary Table S3).
Predictive value of HRV for VVS
This study assessed the predictive performance of HRV parameters for VVS and its subtypes using ROC curve analysis (Table 6). The results showed that 24 h Average HRs (AUC: 0.688; 95% CI: 0.632–0.744), 24 h Max HRs (AUC: 0.652; 95% CI: 0.594–0.709), and SDNN (AUC: 0.614; 95% CI: 0.557–0.672) had moderate ability to predict the presence of VVS (Figure 2A). For vasodepressor-type VVS, both 24 h Average HRs (AUC: 0.703; 95% CI: 0.640–0.765) and 24 h Max HRs (AUC: 0.701; 95% CI: 0.638–0.763) demonstrated good predictive performance. In contrast, SDNN (AUC: 0.584; 95% CI: 0.516–0.652) and rMSSD (AUC: 0.540; 95% CI: 0.471–0.610) showed relatively lower predictive value (Figure 2B). Regarding the prediction of cardioinhibitory-type VVS, SDNN (AUC: 0.746; 95% CI: 0.642–0.850), 24 h Average HRs (AUC: 0.729; 95% CI: 0.627–0.832), and rMSSD (AUC: 0.725; 95% CI: 0.631–0.820) all exhibited good predictive accuracy. Additionally, pNN50 (AUC: 0.710; 95% CI: 0.605–0.815) and TI (AUC: 0.708; 95% CI: 0.593–0.823) also showed strong discriminative ability (Figure 2C). For the mixed-type VVS, 24 h Average HRs (AUC: 0.665; 95% CI: 0.599–0.730), SDNN (AUC: 0.623; 95% CI: 0.555–0.690), rMSSD (AUC: 0.622; 95% CI: 0.554–0.689), and pNN50 (AUC: 0.606; 95% CI: 0.537–0.674) were found to have favorable predictive performance (Figure 2D). Detailed ROC parameters for predicting specific VVS subtypes are presented in the (Supplementary Tables S4–S6).
Table 6
| Variable | AUC (95% CI) | Cut-off value | Sensitivity | Specificity | Youden index |
|---|---|---|---|---|---|
| 24 h Average HR | 0.688 (0.632–0.744) | 73.5 | 68.4% | 63.1% | 0.315 |
| 24 h Max HR | 0.652 (0.594–0.709) | 143.5 | 39.7% | 88.2% | 0.279 |
| 24 h Min HR | 0.564 (0.503–0.625) | 59.5 | 16.9% | 97.1% | 0.140 |
| SDNN | 0.614 (0.557–0.672) | 70.9 | 54.4% | 64.9% | 0.193 |
| TI | 0.453 (0.394–0.512) | 32.5 | 53.7% | 50.2% | 0.039 |
| rMSSD | 0.592 (0.531–0.652) | 20.9 | 30.1% | 89.2% | 0.194 |
| pNN50 | 0.564 (0.503–0.626) | 2.9 | 33.1% | 83.5% | 0.166 |
ROC analysis of HRV prediction of VVS.
AUC, area under the receiver operating characteristic curve.
Figure 2
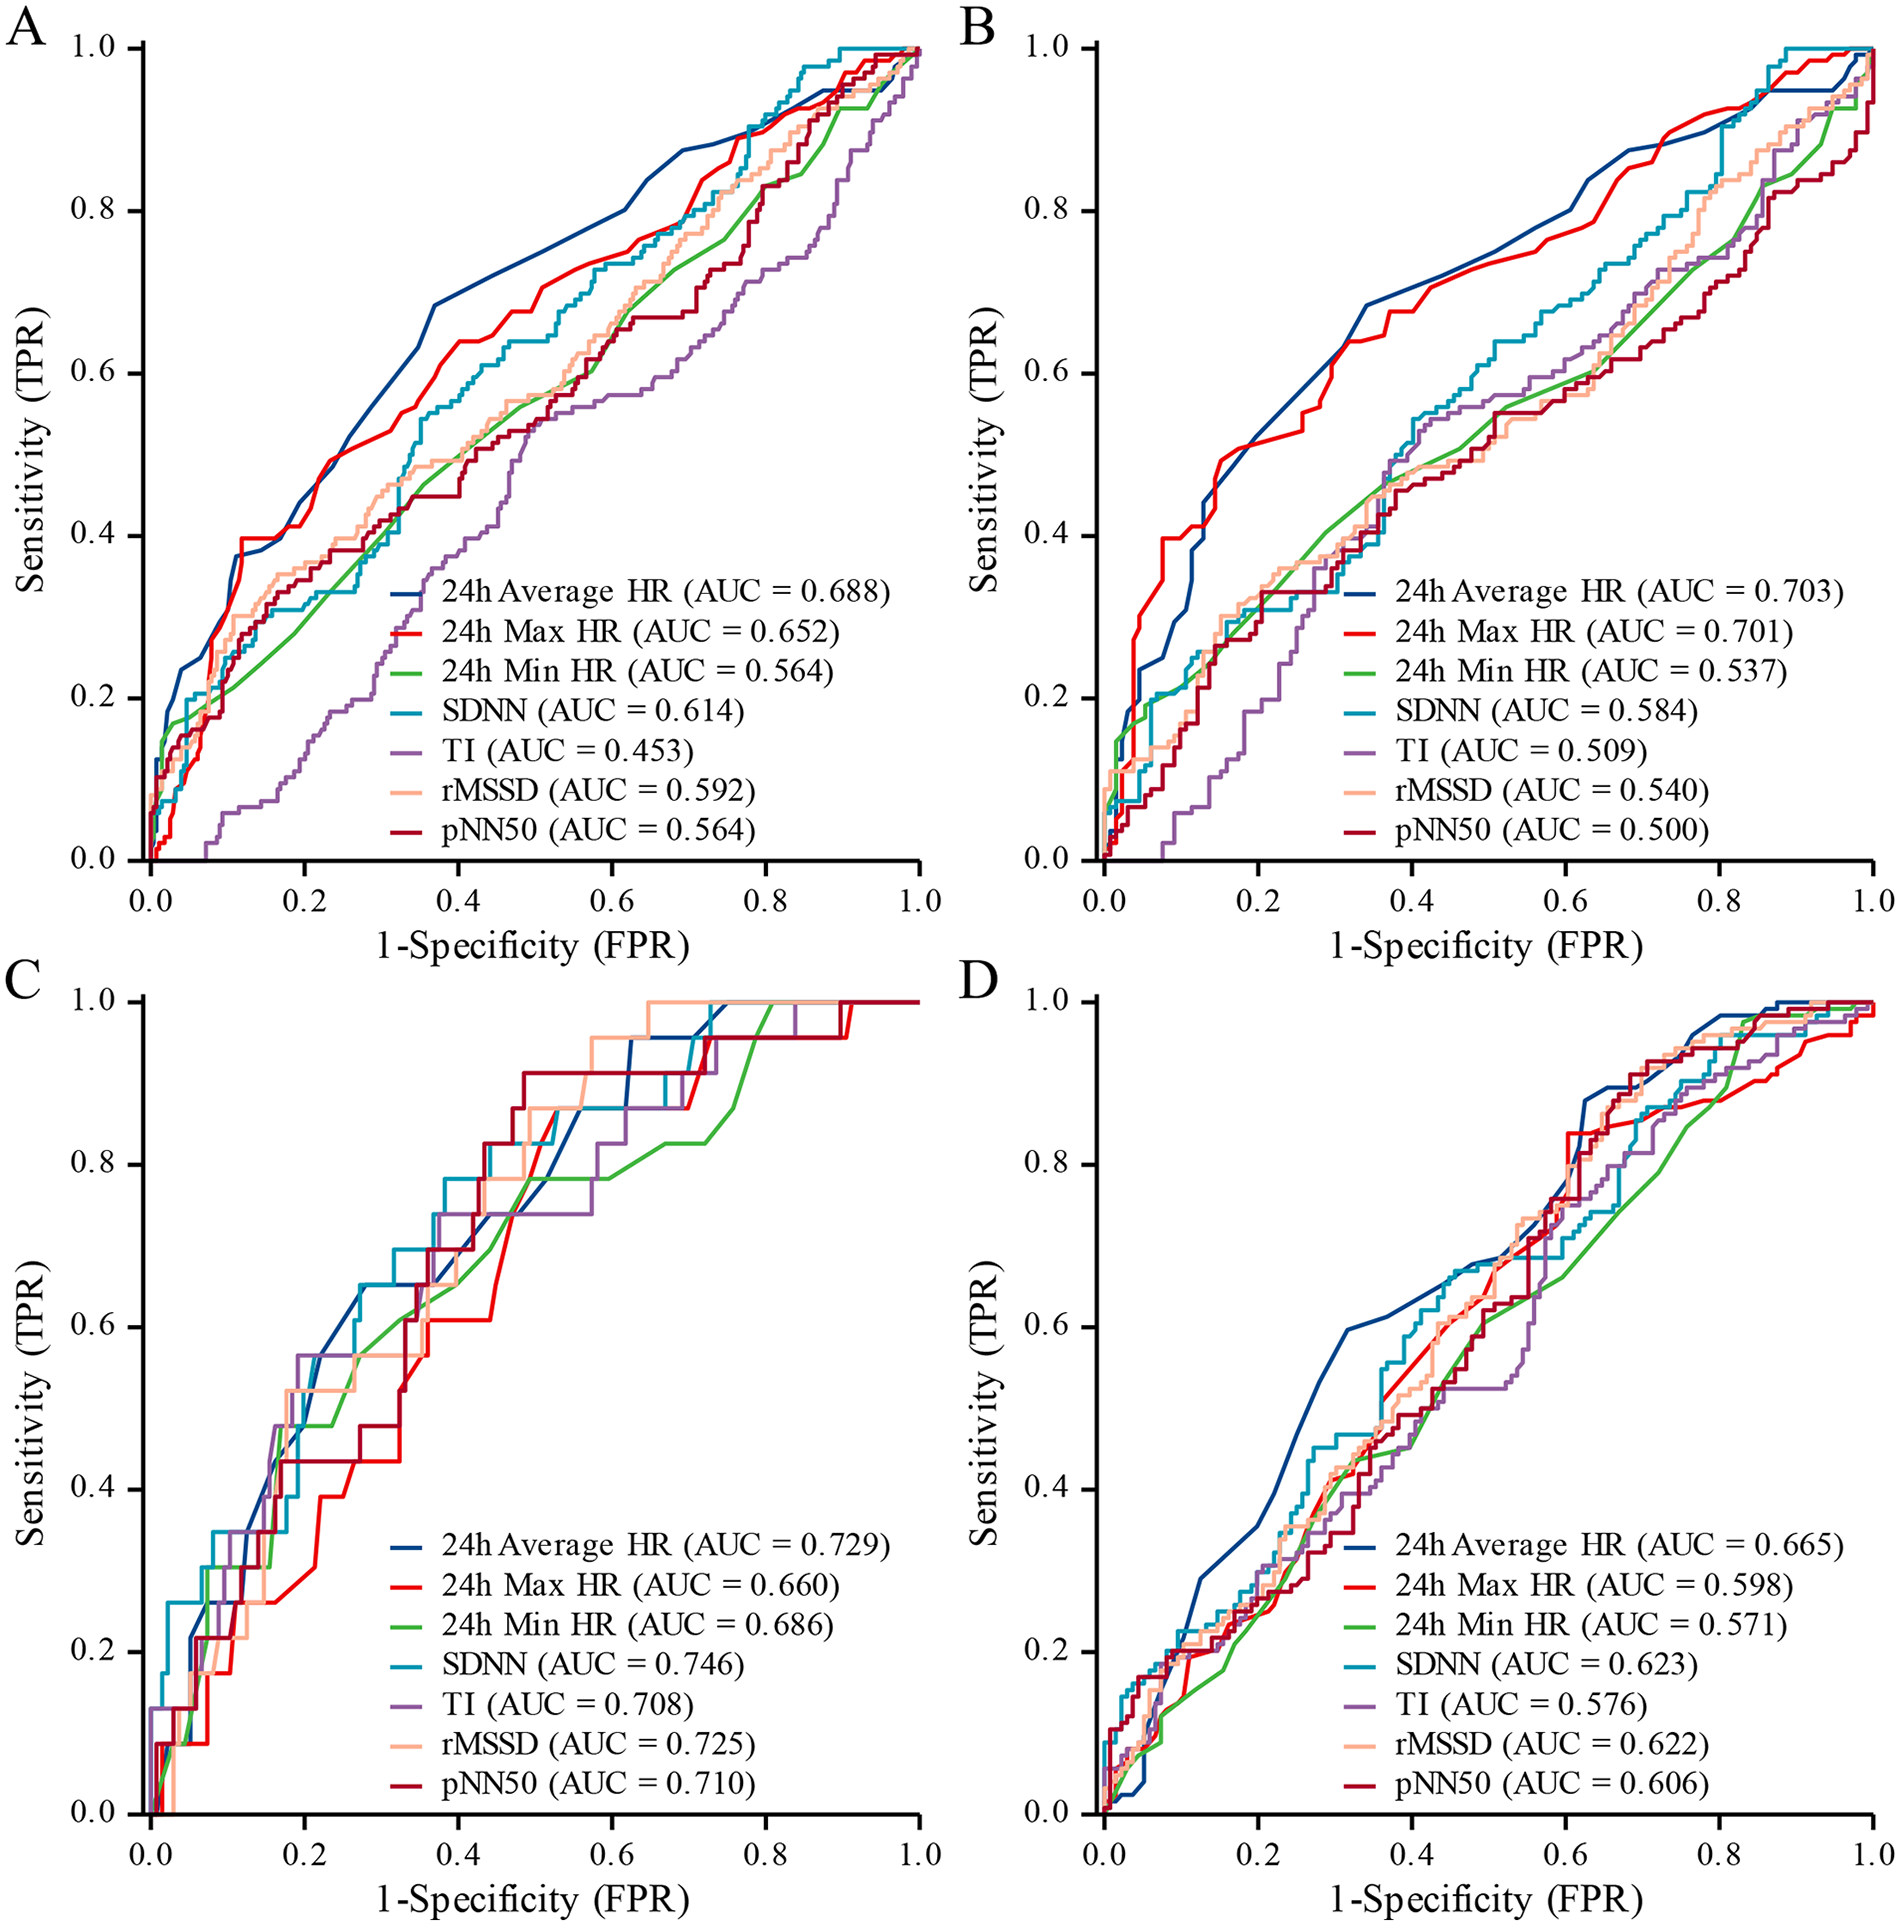
ROC curves for HRV prediction of VVS and subtypes. (A) All types; (B) vasodepressor type; (C) cardioinhibitory type; (D) mixed type.
Discussion
The findings of this study suggest that HRV parameters hold certain clinical value in distinguishing individuals with VVS from those without, as well as in differentiating among VVS subtypes. Specifically, 24 h Average HRs, 24 h Max HRs, 24 h Min HRs, TI, SDNN, rMSSD, and pNN50 were all associated with VVS and demonstrated a degree of predictive ability.
The core pathophysiological mechanism of VVS involves a synergistic effect between enhanced vagal activity and suppressed sympathetic activity (18). In the present study, we observed that 24 h average, maximum, and minimum HRs were negatively correlated with the presence of VVS, whereas TI, SDNN, rMSSD, and pNN50 were positively correlated. The 24 h average, maximum, and minimum HRs are fundamental statistical measures reflecting the overall, peak, and trough heart rate levels over a 24 h period, respectively, and are primarily influenced by sympathetic nervous activity (19). An elevated heart rate typically reflects enhanced sympathetic activation or reduced parasympathetic tone, while a reduced heart rate is often indicative of increased vagal activity or decreased sympathetic drive. SDNN, TI, rMSSD, and pNN50 are all time-domain measures of HRV, which collectively reflect the integrated state of autonomic nervous system modulation. An upward trend in these parameters suggests increased autonomic fluctuations and stronger vagal influence in daily physiological rhythms (20). Notably, rMSSD and pNN50 are highly sensitive to parasympathetic activity; elevated values indicate vagal hyperexcitability even during non-syncope periods, which may provide a physiological basis for the rapid onset of vagal reflexes in response to specific triggers (21). The increase in SDNN further implies heightened overall HRV variability across 24 h, representing a state of autonomic instability between sympathetic and parasympathetic systems. This intrinsic feature may underlie syncope susceptibility. HF power has traditionally been regarded as the most specific frequency-domain marker of cardiac parasympathetic regulation. However, HF power is highly sensitive to respiratory patterns—such as respiratory irregularity and respiratory rate variability—neither of which were standardized or recorded in this retrospective cohort study. Respiratory variability during daily activities may introduce significant noise into HF power measurements, weakening its association with vagal tone (22). In contrast, rMSSD and pNN50 are less affected by respiratory variability and are considered more robust markers of short-term vagal regulation in free-living conditions (23). Twenty-four-hour HF power reflects the cumulative effects of sleep-related respiratory rhythms and daytime behavioral factors, potentially diminishing its sensitivity in distinguishing subtle differences between vagal dysfunction subtypes. In contrast, time-domain metrics capture inter-beat parasympathetic fluctuations and are more likely to reflect increased intrinsic vagal excitability associated with cardiac suppression responses.
There are significant differences in autonomic reflex characteristics among the three clinical subtypes of VVS (24). In this study, patients with cardioinhibitory VVS generally exhibited higher HRV levels, with parameters such as SDNN, rMSSD, and pNN50 demonstrating strong predictive performance. The hallmark of the cardioinhibitory subtype is a markedly enhanced vagal response, manifesting as sinus bradycardia, atrioventricular conduction delay, or even transient cardiac arrest (25). The underlying mechanism is attributed to the hypersensitivity of cardiac mechanoreceptors to mechanical stretch. Under triggering conditions, these receptors transmit strong inhibitory signals via the vagus nerve to the central nervous system, thereby activating cardioinhibitory reflexes. This results in sinoatrial node suppression, abrupt reduction in cardiac output, and subsequent loss of consciousness (26, 27). Elevated HRV in this subtype suggests a predominance of parasympathetic tone even during interictal periods, indicating a physiological predisposition to vagal hyperactivity that can rapidly precipitate syncope upon provocation (28).
The vasodepressor subtype is primarily triggered by sudden sympathetic withdrawal, leading to peripheral vasodilation. Episodes are often characterized by a rapid drop in blood pressure with minimal changes in heart rate (29). This reflects impaired regulation of arterial smooth muscle tone. In the presence of postural stress or abnormal blood volume distribution, the sympathetic-mediated vascular tone fails to compensate, resulting in a sharp decline in effective circulating blood volume (30). Because heart rate fluctuations are relatively mild, HRV variability in this subtype is generally less pronounced compared to the cardioinhibitory type (31). Our findings showed that the predictive performance of most HRV parameters in this subtype was also relatively limited. While 24 h average and maximum heart rates retained some discriminatory power, possibly reflecting a baseline reduction in sympathetic tone, other indices such as SDNN, rMSSD, and pNN50 exhibited low predictive value. This is consistent with clinical observations that vasodepressor VVS is primarily characterized by hypotension without prominent bradycardia (32).
The mixed type of VVS encompasses features of both the cardioinhibitory and vasodepressor subtypes. During syncopal episodes, patients experience both a reduction in heart rate and a significant drop in blood pressure (33). This dual response reflects a global imbalance in autonomic regulation, characterized by a loss of coordinated sympathetic and parasympathetic control, resulting in simultaneous instability of both heart rate and blood pressure (34). As the most common subtype observed in clinical settings, mixed-type VVS typically exhibits intermediate HRV characteristics, with its predictive capacity showing variability depending on individual autonomic profiles. In the present study, HRV parameters in mixed-type patients were generally between those of the other two subtypes. While rMSSD, pNN50, and SDNN exhibited an upward trend, their predictive performance was slightly lower than that observed in the cardioinhibitory group. To date, there is a relative paucity of literature addressing HRV parameter differences across VVS subtypes. Many previous studies have not stratified VVS into distinct clinical forms or have solely focused on differences between tilt-positive and tilt-negative individuals, thereby overlooking the unique autonomic patterns associated with different pathophysiological mechanisms (35, 36). Some recent efforts have attempted to integrate HRV with blood pressure variability (BPV) or dynamic indices derived from tilt-table testing to enhance predictive accuracy. For example, Virag et al. used RR intervals and SBP trends during HUTT to predict impending syncope (37). However, the clinical utility of such models is limited by their complexity and dependence on operator expertise. In contrast, the findings of this study suggest that HRV serves as a valuable adjunct diagnostic tool. Its methodological simplicity, capacity for continuous noninvasive monitoring, and compatibility with wearable medical devices make it a highly promising approach for identifying high-risk individuals for VVS in real-world and outpatient settings (38). This study focused on 24 h HRV reflecting autonomic nervous system status across a full circadian rhythm cycle. However, short-term HRV based on 5 min or ultra-short recordings can capture more immediate parasympathetic fluctuations, potentially offering complementary diagnostic information (39). Wearable or low-cost photoplethysmography (PPG) devices can perform short-term HRV analysis. Future studies may consider integrating low-cost HRV monitoring solutions to achieve continuous autonomic monitoring in real-world settings (40).
Recent evidence indicates that heart rate variability biofeedback (HRV-BF) serves as an evidence-based non-pharmacological intervention aimed at enhancing autonomic nervous system regulation by self-modulating cardiopulmonary rhythms (41). HRV-BF typically guides individuals to breathe at a personalized resonance frequency (approximately 0.1 Hz), where respiratory sinus arrhythmia reaches its maximum expression and baroreflex sensitivity is heightened. This synergistic activation of the cardiac vagal pathway induces more stable oscillatory patterns in heart rate and blood pressure, thereby promoting sympathetic-parasympathetic equilibrium (42). Clinical studies confirm that regular HRV-BF training enhances vagal tone, improves baroreflex function, and reduces autonomic hypersensitivity, indicating its potential efficacy for autonomic dysregulation disorders (43). For patients with cardiac-suppressed VVS, such methods may help inhibit excessive vagal impulses; whereas those with vascular-suppressed VVS may benefit from enhanced sympathetic-baroreflex coupling. Therefore, incorporating subtype-specific breathing guidance into clinical management not only complements HRV diagnostic assessment but also reduces syncope susceptibility through personalized autonomic regulation.
Limitations
This study has several limitations. First, as a retrospective analysis based on previously collected medical records, certain potential confounding factors—such as sleep status and emotional disturbances—may not have been adequately controlled. Second, the study population was derived from a single-center cohort consisting of patients with syncope symptoms who underwent both 24 h Holter monitoring and HUTT, which may limit the generalizability of the findings. Therefore, the observed characteristics of VVS may not fully reflect those in the general population or in asymptomatic individuals. Third, this study evaluated the discriminatory ability of HRV parameters for different VVS subtypes through ROC analysis. However, the sample size in the cardiac suppression subtype group was relatively small, necessitating larger-scale studies to validate the role of HRV in this subtype.
Conclusion
In conclusion, 24 h Average HRs, 24 h Max HRs, 24 h Min HRs, TI, SDNN, rMSSD, and pNN50 were all found to be significantly associated with VVS. As a noninvasive, objective, and dynamic physiological measure, HRV reflects the regulatory capacity of the autonomic nervous system and may serve as a valuable tool in the clinical screening, risk prediction, and subtype classification of VVS.
Statements
Data availability statement
The raw data supporting the conclusions of this article will be made available, upon reasonable request to the corresponding author.
Ethics statement
The studies involving humans were approved by Human Ethics Committee of the First Affiliated Hospital of Xinjiang Medical University. The studies were conducted in accordance with the local legislation and institutional requirements. The ethics committee/institutional review board waived the requirement of written informed consent for participation from the participants or the participants’ legal guardians/next of kin because this study is a retrospective case-control study that only collects data from patients’ previous visits through electronic medical records and does not involve any clinical intervention measures.
Author contributions
YY: Investigation, Writing – original draft, Writing – review & editing. BT: Methodology, Supervision, Validation, Writing – original draft, Writing – review & editing. LM: Investigation, Writing – original draft, Writing – review & editing. LY: Data curation, Formal analysis, Software, Writing – original draft, Writing – review & editing. ZM: Data curation, Writing – original draft, Writing – review & editing. PF: Funding acquisition, Supervision, Validation, Writing – original draft, Writing – review & editing.
Funding
The author(s) declared that financial support was received for this work and/or its publication. This work was supported by the “Tianshan Talent” Project for High-Level Medical and Health—Leading talents in medical and health care (TSYC202401A069), Autonomous Region Health and Wellness Science and Technology Program Project (2025001MXJCSYJSTGXM650030286), and the First Affiliated Hospital of Xinjiang Medical University “Youth Research Launch Special” Fund Project (2025YFY-QKQN-35).
Conflict of interest
The author(s) declared that this work was conducted in the absence of any commercial or financial relationships that could be construed as a potential conflict of interest.
Generative AI statement
The author(s) declared that Generative AI was not used in the creation of this manuscript.
Any alternative text (alt text) provided alongside figures in this article has been generated by Frontiers with the support of artificial intelligence and reasonable efforts have been made to ensure accuracy, including review by the authors wherever possible. If you identify any issues, please contact us.
Publisher’s note
All claims expressed in this article are solely those of the authors and do not necessarily represent those of their affiliated organizations, or those of the publisher, the editors and the reviewers. Any product that may be evaluated in this article, or claim that may be made by its manufacturer, is not guaranteed or endorsed by the publisher.
Supplementary material
The Supplementary Material for this article can be found online at: https://www.frontiersin.org/articles/10.3389/fcvm.2025.1684990/full#supplementary-material
References
1.
Benditt DG Fedorowski A Sutton R van Dijk JG . Pathophysiology of syncope: current concepts and their development. Physiol Rev. (2025) 105(1):209–66. 10.1152/physrev.00007.2024
2.
Cho B-H . The pathophysiology of syncope and the role of transcranial doppler in its diagnostic evaluation. J Neurosonol Neuroimag. (2024) 16(2):51–62. 10.31728/jnn.2024.00160
3.
Moloney D Romero-Ortuno R Kenny RA . Vasovagal syncope. JAMA Intern Med. (2021) 181(6):880. -. 10.1001/jamainternmed.2020.9151
4.
Kenny RA Bhangu J King-Kallimanis BL . Epidemiology of syncope/collapse in younger and older western patient populations. Prog Cardiovasc Dis. (2013) 55(4):357–63. 10.1016/j.pcad.2012.11.006
5.
Benditt DG van Dijk JG Krishnappa D Adkisson WO Sakaguchi S . Neurohormones in the pathophysiology of vasovagal syncope in adults. Front Cardiovasc Med. (2020) 7:76. 10.3389/fcvm.2020.00076
6.
Vaddadi G Esler MD Dawood T Lambert E . Persistence of muscle sympathetic nerve activity during vasovagal syncope. Eur Heart J. (2010) 31(16):2027–33. 10.1093/eurheartj/ehq071
7.
Kavi KS Gall NP . Trauma and syncope: looking beyond the injury. Trauma Surg Acute Care Open. (2023) 8(1):e001036. 10.1136/tsaco-2022-001036
8.
Forleo C Guida P Iacoviello M Resta M Monitillo F Sorrentino S et al Head-up tilt testing for diagnosing vasovagal syncope: a meta-analysis. Int J Cardiol. (2013) 168(1):27–35. 10.1016/j.ijcard.2012.09.023
9.
Barón-Esquivias G Martín AJD Del Castillo ÁM Quintanilla M Barón-Solís C Morillo CA . Head-up tilt test diagnostic yield in syncope diagnosis. J Electrocardiol. (2020) 63:46–50. 10.1016/j.jelectrocard.2020.09.016
10.
Dani M Panagopoulos D Dirksen A Taraborrelli P Torocastro M Sutton R et al Vasovagal syncope: a review of current and future strategies. Eur J Arrhythm Electrophysiol. (2021) 7(1):40–7. 10.17925/EJAE.2021.7.1.40
11.
Takase B . Role of heart rate variability in non-invasive electrophysiology: prognostic markers of cardiovascular disease. J Arrhythm. (2010) 26(4):227–37. 10.1016/S1880-4276(10)80021-3
12.
Agorastos A Mansueto AC Hager T Pappi E Gardikioti A Stiedl O . Heart rate variability as a translational dynamic biomarker of altered autonomic function in health and psychiatric disease. Biomedicines. (2023) 11(6):1591. 10.3390/biomedicines11061591
13.
Brinza C Floria M Covic A Burlacu A . Measuring heart rate variability in patients admitted with ST-elevation myocardial infarction for the prediction of subsequent cardiovascular events: a systematic review. Medicina (Kaunas). (2021) 57(10):1021. 10.3390/medicina57101021
14.
Hämmerle P Aeschbacher S Schlageter V Coslovsky M Hennings E Krisai P et al Heart rate variability and stroke or systemic embolism in patients with atrial fibrillation. Heart Rhythm. (2024) 21(9):1509–16. 10.1016/j.hrthm.2024.05.028
15.
Miranda CM Silva R . Analysis of heart rate variability before and during tilt test in patients with cardioinhibitory vasovagal syncope. Arq Bras Cardiol. (2016) 107(6):568–75. 10.5935/abc.20160177
16.
Budrejko S Kempa M Chmielecka M Kozłowski D Raczak G . Analysis of heart rate variability during head-up tilt-test in patients with vasovagal syncope. Eur J Transl Clin Med. (2018) 1(1):26–38. 10.31373/ejtcm/92837
17.
Cardiology ECoCJo, Pacing CSo, Electrophysiology CSoBE, Cardiovascular Disease Professional Committee CSoG, Geriatrics. Chinese Expert consensus on the diagnosis and treatment of syncope (2018). Chin J Cardiol. (2019) 47(2):96–107. 10.3760/cma.j.issn.0253-3758.2019.02.006
18.
Liu W Ding R Li X Zhang H Yang J Pu J et al Chinese expert consensus on rehabilitation for non-cardiogenic syncope. Chin Circ J. (2023) 38(11):1103–11. 10.3969/j.issn.1000-3614.2023.11.001
19.
Gibbons CH . Basics of autonomic nervous system function. Handb Clin Neurol. (2019) 160:407–18. 10.1016/B978-0-444-64032-1.00027-8
20.
Shim SH Park SY Moon SN Oh JH Lee JY Kim HH et al Baseline heart rate variability in children and adolescents with vasovagal syncope. Korean J Pediatr. (2014) 57(4):193–8. 10.3345/kjp.2014.57.4.193
21.
Lagi A Tamburini C Fattorini L Cencetti S . Autonomic control of heart rate variability in vasovagal syncope: a study of the nighttime period in 24-hour recordings. Clin Auton Res. (1999) 9(4):179–83. 10.1007/BF02330481
22.
Ali MK Chen JDZ . Roles of heart rate variability in assessing autonomic nervous system in functional gastrointestinal disorders: a systematic review. Diagnostics (Basel). (2023) 13(2):293. 10.3390/diagnostics13020293
23.
Maduro PA Maduro LAR Lima PE Silva ACC Silva R Rocha ASL et al Cardiac autonomic modulation and cognitive performance in community-dwelling older adults: a preliminary study. Neurol Int. (2025) 17(5):74. 10.3390/neurolint17050074
24.
Brignole M Moya A de Lange FJ Deharo JC Elliott PM Fanciulli A et al 2018 ESC guidelines for the diagnosis and management of syncope. Eur Heart J. (2018) 39(21):1883–948. 10.1093/eurheartj/ehy037
25.
John LA Mullis A Payne J Tung R Aksu T Winterfield JR . Cardioneuroablation for cardioinhibitory vasovagal syncope. J Cardiovasc Electrophysiol. (2021) 32(6):1748–53. 10.1111/jce.15044
26.
Tu B Lai ZH Chen AY Weng ZY Cai SM Zhang ZX et al Effectiveness of cardioneuroablation in different subtypes of vasovagal syncope. J Geriatr Cardiol. (2024) 21(6):651–7. 10.26599/1671-5411.2024.06.004
27.
Garcia A Marquez MF Fierro EF Baez JJ Rockbrand LP Gomez-Flores J . Cardioinhibitory syncope: from pathophysiology to treatment-should we think on cardioneuroablation?J Interv Card Electrophysiol. (2020) 59(2):441–61. 10.1007/s10840-020-00758-2
28.
Guo Y Lin T Lin N Lin H . Effectiveness analysis of deceleration capacity and traditional heart rate variability in diagnosing vasovagal syncope. Front Cardiovasc Med. (2024) 11:1333684. 10.3389/fcvm.2024.1333684
29.
Chen Z Li Y Liu Y Shen G Xiong G Wu B et al Efficacy of cardioneuroablation for vasodepressor vasovagal syncope. Front Neurosci. (2025) 19:1514513. 10.3389/fnins.2025.1514513
30.
Engel GL . Psychologic stress, vasodepressor (vasovagal) syncope, and sudden death. Ann Intern Med. (1978) 89(3):403–12. 10.7326/0003-4819-89-3-403
31.
Barbey JT . Vasodepressor syncope. Diagnosis and management. Cardiol Clin. (1997) 15(2):251–6. 10.1016/s0733-8651(05)70333-7
32.
Liu R Zhu C . The role of heart rate variability in diagnosing vasovagal syncope and its correlation with hematological parameters. Chin J Modern Med. (2021) 31(16):88–93. 10.3969/j.issn.1005-8982.2021.16.017
33.
Jardine DL Wieling W Brignole M Lenders JWM Sutton R Stewart J . The pathophysiology of the vasovagal response. Heart Rhythm. (2018) 15(6):921–9. 10.1016/j.hrthm.2017.12.013
34.
Kenny RA McNicholas T . The management of vasovagal syncope. QJM. (2016) 109(12):767–73. 10.1093/qjmed/hcw089
35.
Ciliberti MAP Santoro F Di Martino LFM Rinaldi AC Salvemini G Cipriani F et al Predictive value of very low frequency at spectral analysis among patients with unexplained syncope assessed by head-up tilt testing. Arch Cardiovasc Dis. (2018) 111(2):95–100. 10.1016/j.acvd.2017.04.006
36.
Akıncı S Çoner A Balcıoğlu AS Akbay E Müderrisoğlu İ H . Heart rate variability and heart rate turbulence in patients with vasovagal syncope. Kardiologiia. (2021) 61(8):54–9. 10.18087/cardio.2021.8.n1523
37.
Virag N Sutton R Vetter R Markowitz T Erickson M . Prediction of vasovagal syncope from heart rate and blood pressure trend and variability: experience in 1,155 patients. Heart Rhythm. (2007) 4(11):1375–82. 10.1016/j.hrthm.2007.07.018
38.
Rodrigues E Lima D Barbosa P Gonzaga K Guerra RO Pimentel M et al HRV monitoring using commercial wearable devices as a health indicator for older persons during the pandemic. Sensors (Basel). (2022) 22(5):2001. 10.3390/s22052001
39.
Abhishekh HA Nisarga P Kisan R Meghana A Chandran S Trichur R et al Influence of age and gender on autonomic regulation of heart. J Clin Monit Comput. (2013) 27(3):259–64. 10.1007/s10877-012-9424-3
40.
Selvaraj N Jaryal A Santhosh J Deepak KK Anand S . Assessment of heart rate variability derived from finger-tip photoplethysmography as compared to electrocardiography. J Med Eng Technol. (2008) 32(6):479–84. 10.1080/03091900701781317
41.
Lehrer PM Gevirtz R . Heart rate variability biofeedback: how and why does it work?Front Psychol. (2014) 5:756. 10.3389/fpsyg.2014.00756
42.
Lehrer PM Vaschillo E Vaschillo B . Resonant frequency biofeedback training to increase cardiac variability: rationale and manual for training. Appl Psychophysiol Biofeedback. (2000) 25(3):177–91. 10.1023/A:1009554825745
43.
Vaschillo E Lehrer P Rishe N Konstantinov M . Heart rate variability biofeedback as a method for assessing baroreflex function: a preliminary study of resonance in the cardiovascular system. Appl Psychophysiol Biofeedback. (2002) 27(1):1–27. 10.1023/A:1014587304314
Summary
Keywords
vasovagal syncope, heart rate variability, Holter, head-up tilt test, case-control study
Citation
Yusufuaji Y, Tang B, Men L, Yang L, Musha Z and Fan P (2026) Evaluation of the clinical value of heart rate variability in predicting vasovagal syncope. Front. Cardiovasc. Med. 12:1684990. doi: 10.3389/fcvm.2025.1684990
Received
13 August 2025
Revised
15 November 2025
Accepted
08 December 2025
Published
21 January 2026
Volume
12 - 2025
Edited by
Kyungmoo Paul Ryu, Abbott, United States
Reviewed by
Richard Gevirtz, Alliant International University, United States
Jun Hwan Cho, Chung-Ang University Hospital, Republic of Korea
Updates
Copyright
© 2026 Yusufuaji, Tang, Men, Yang, Musha and Fan.
This is an open-access article distributed under the terms of the Creative Commons Attribution License (CC BY). The use, distribution or reproduction in other forums is permitted, provided the original author(s) and the copyright owner(s) are credited and that the original publication in this journal is cited, in accordance with accepted academic practice. No use, distribution or reproduction is permitted which does not comply with these terms.
* Correspondence: Ping Fan xjarrhyvip@163.com
†These authors have contributed equally to this work and share first authorship
Disclaimer
All claims expressed in this article are solely those of the authors and do not necessarily represent those of their affiliated organizations, or those of the publisher, the editors and the reviewers. Any product that may be evaluated in this article or claim that may be made by its manufacturer is not guaranteed or endorsed by the publisher.