Abstract
Background:
The triglyceride-glucose (TyG) index demonstrates strong links to heightened cardiovascular risk and progressive renal dysfunction. However, its prognostic implications in individuals diagnosed with cardiovascular-kidney-metabolic (CKM) syndrome who underwent Percutaneous Coronary Intervention (PCI) have yet to be fully elucidated.
Methods:
A retrospective investigation was conducted involving CKM patients who underwent PCI between January 2014 and September 2017. The TyG index categories were established utilizing X-tile software for classification purposes. The principal endpoints comprised 5-year all-cause mortality (ACM) and cardiac mortality (CM). Associations between the TyG index and ACM/CM were evaluated using Cox proportional hazards models, and further examined through restricted cubic spline (RCS) analyses.
Results:
Of the 2,040 patients analyzed, 1,186 (58.14%) were male and 854 (41.86%) female, with 55.83% aged ≥65 years. After analysis with multivariate Cox regression, elevated TyG index measurements demonstrated a notable association with heightened probabilities of ACM and CM occurrence. In comparison to the medium TyG index group, individuals categorized within the low TyG index group exhibited markedly elevated risks for ACM [hazard ratio [HR] = 1.82, 95% confidence interval [95%CI]: 1.15–2.88] and CM (HR = 2.68, 95%CI: 1.32–5.43). Additionally, a higher ACM risk was noted in the high TyG index group (HR = 1.39, 95%CI: 1.01–1.92). The RCS analysis identified no nonlinear association between the TyG index and either outcome (P-values for nonlinearity test: 0.177 and 0.153, respectively).
Conclusions:
The TyG index independently predicted increased risks of all-cause and cardiac mortality, thus highlighting its utility for risk stratification in CKM syndrome patients following PCI.
1 Introduction
Coronary artery disease (CAD) and chronic kidney disease (CKD) represent substantial health challenges worldwide, substantially impacting global disability and mortality rates (1, 2). Epidemiological evidence has revealed that renal impairment of varying severity is commonly observed in individuals diagnosed with CAD, while cardiovascular disease (CVD) remains the leading factor in both illness and death among individuals with CKD (3). Percutaneous coronary intervention (PCI) stands as an essential treatment approach for CAD, aimed at alleviating coronary artery stenosis or occlusion and enhancing myocardial perfusion (4). Nevertheless, clinical findings have indicated that, despite technically successful PCI, considerable residual cardiovascular risk persists, as reflected in the increased incidence of major adverse cardiovascular events (MACE) and all-cause mortality (ACM) (5–7).
In recent years, cardiovascular-kidney-metabolic (CKM) syndrome has garnered increasing scholarly interest owing to the intricate pathophysiological interplay among cardiac, renal, and metabolic dysfunctions. Numerous investigations indicate that insulin resistance (IR) constitutes a fundamental pathological nexus linking cardiovascular complications with renal functional decline (8–12). Patients diagnosed with CKM syndrome commonly exhibit a constellation of IR, persistent low-grade inflammation, and heightened oxidative stress, collectively expediting the advancement of atherosclerosis and potentially exerting a profound influence on clinical prognosis. The triglyceride-glucose (TyG) index, computed from fasting triglycerides (TG) and fasting plasma glucose, has been recognized as a straightforward yet robust proxy for IR, and has been repeatedly correlated with the onset, exacerbation, and unfavorable outcomes of CVD. Recent clinical findings have indicated that a heightened TyG index independently forecasts coronary artery disease severity and MACE occurrence among general and diabetic cohorts alike (13). Nevertheless, its predictive validity for long-term prognosis following PCI remains inadequately characterized in this distinct, high-risk group presenting simultaneous cardiac, renal, and metabolic impairments. Hence, this investigation sought to examine the prognostic significance of the TyG index regarding outcomes in CKM patients receiving PCI treatment.
2 Methodologies and materials
2.1 Research methodology and participants
In this retrospective analysis, a sum of 2,529 CKM patients receiving PCI treatment at Cangzhou Central Hospital from January 2014 through September 2017 underwent initial evaluation. The selection standards included: (1) individuals aged 18 years or above; (2) confirmed CAD requiring PCI intervention; and (3) calculated glomerular filtration rate below 90 mL/min/1.73 m². Subjects were not eligible if they presented any of these factors: (1) history of coronary artery bypass grafting; (2) staged or unplanned PCI readmission; or (3) incomplete TG or glucose data. Following the application of these criteria, 2,040 individuals were ultimately included in the analysis (Figure 1).
Figure 1
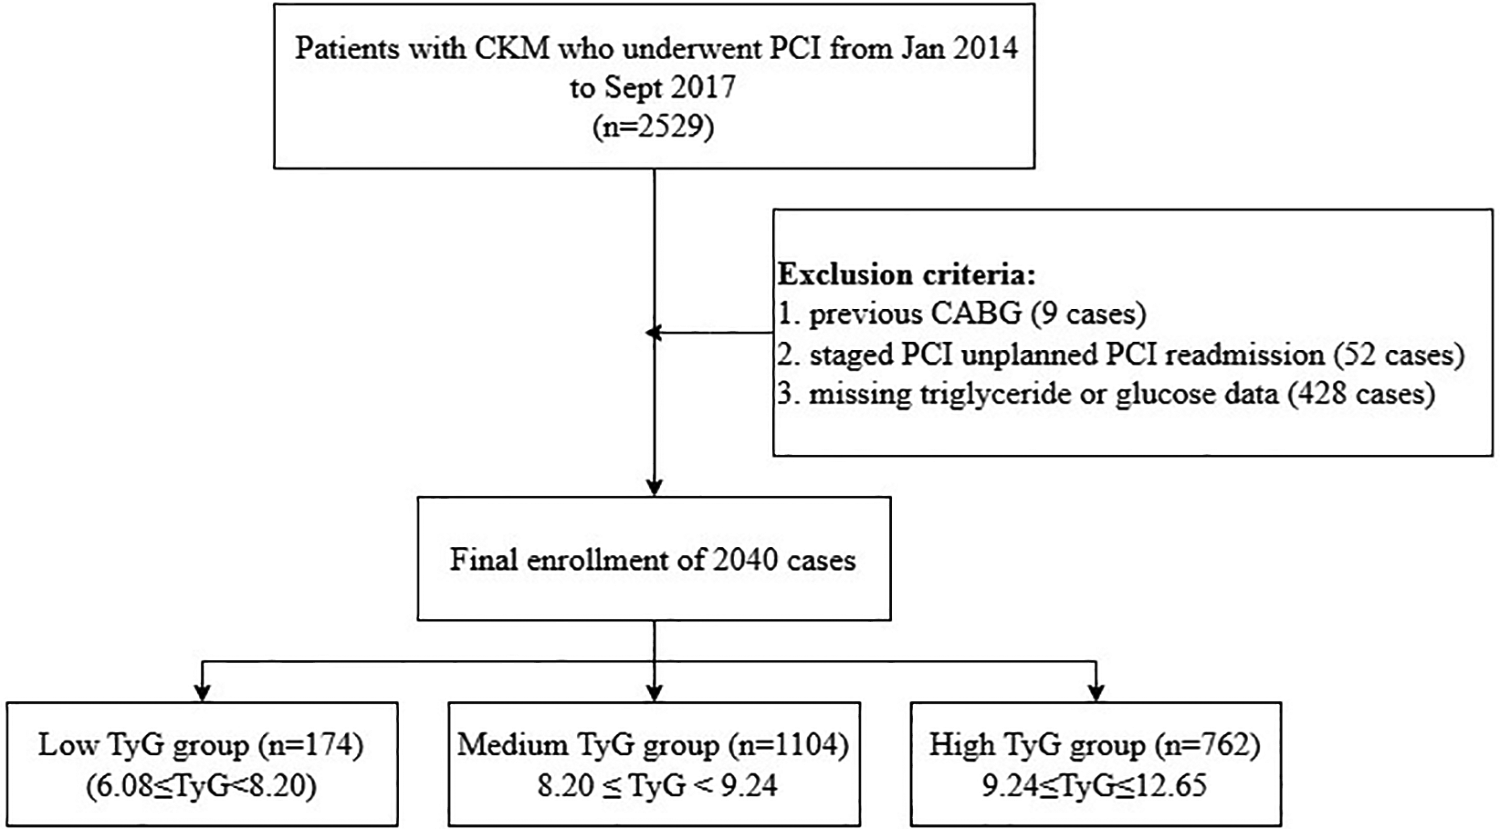
Study flowchart.
2.2 Data collection and definitions
The data utilized for analytical purposes in this study were procured from medical records, encompassing demographic characteristics, smoking status, comorbid conditions, and other relevant baseline parameters. Fasting venous blood specimens were procured and subsequently examined in the clinical laboratory to determine levels of low-density lipoprotein cholesterol (LDL-C), TG, high-density lipoprotein cholesterol (HDL-C), total cholesterol (TC), and fasting blood glucose (FBG).
The TyG index was computed based on the following formula (14, 15):ACM was stratified based on TyG index thresholds, which had been determined through predictive modeling using X-tile software. The cohort was split into three categories: low TyG group (6.08 ≤ TyG < 8.20, n = 174), medium TyG group (8.20 ≤ TyG < 9.24, n = 1,104), and high TyG group (9.24 ≤ TyG ≤ 12.65, n = 762).
Ethical approval for this investigation was sanctioned by the Ethics Committee of Cangzhou Center, affiliated with Hebei Medical University. Each participant completed consent documentation.
2.3 Statistical analysis
Regarding continuous variables, central tendency and dispersion were denoted as mean ± standard deviation when data exhibited normal distribution, while non-normally distributed parameters were represented through median and interquartile range. Group comparisons utilized one-way ANOVA for normally distributed measurements, whereas the Kruskal–Wallis test analyzed non-normally distributed data. Categorical parameters were displayed as frequencies (percentages), with analyses performed via chi-square testing. To preliminarily identify variables potentially associated with clinical outcomes, univariate Cox regression was executed. To minimize the risk of Type II error associated with stringent thresholds, a relaxed criterion (P < 0.10) was adopted for initial variable screening. Those found to be significant were subsequently incorporated into the multivariate Cox model with TyG, yielding hazard ratios (HRs) and 95% confidence intervals (CIs). Kaplan–Meier methodology was applied to construct cumulative survival curves. To examine possible nonlinear links between the TyG index and ACM, restricted cubic spline (RCS) regression was implemented. Subgroup analyses were carried out to assess variations in TyG index effects across populations, stratified by the following factors: sex (male, female), hypertension (yes, no), diabetes (yes, no), prior MI (yes, no), prior PCI (yes, no), and previous stroke (yes, no). The handling of missing data was performed as follows. Patients with missing values for the key variables required to calculate the TyG index (fasting triglycerides or fasting glucose) were excluded from the initial cohort selection, as detailed in Figure 1. For the remaining patients included in the final analysis (n = 2,040), the completeness of data for other covariates was high. Continuous variables were imputed using predictive mean matching, and categorical variables were imputed with the mode (the most frequent category).
All statistical evaluations were executed utilizing R software (v4.4.1), with statistical significance established at a two-sided P < 0.05.
3 Results
3.1 Baseline characteristics
Table 1 presents the baseline clinical characteristics of CKM patients who underwent PCI. Upon stratification by TyG index tertiles, statistically significant variations in age and sex distribution were identified across the subgroups (P < 0.001). The age composition was as follows: 18–45 years (2.25%), 45–65 years (41.91%), and ≥65 years (55.83%), with a greater proportion of males compared to females (58.14% vs. 41.86%). Notably, the prevalence of cardiovascular risk factors (CRFs) exhibited a progressive increase with rising TyG levels, particularly for diabetes mellitus (48.3% vs. 32.6% vs. 19.1%, P < 0.001) and hypertension (82.4% vs. 76.8% vs. 69.2%, P < 0.001). These patterns indicate that elevated TyG indices are linked to a more adverse CRF.
Table 1
| Valuables | Total (n = 2,040) | Low TyG (n = 174) | Medium TyG (n = 1,104) | High TyG (n = 762) | P |
|---|---|---|---|---|---|
| 6.08 ≤ TyG < 8.20 | 8.20 ≤ TyG < 9.24 | 9.24 ≤ TyG ≤ 12.65 | |||
| Age | |||||
| <45 | 46 (2.25%) | 4 (2.30%) | 20 (1.81%) | 22 (2.89%) | <0.001 |
| 45∼65 | 855 (41.91%) | 53 (30.46%) | 435 (39.40%) | 367 (48.16%) | |
| ≥65 | 1,139 (55.83%) | 117 (67.24%) | 649 (58.79%) | 373 (48.95%) | |
| Gender | |||||
| Male | 1,186 (58.14%) | 126 (72.41%) | 656 (59.42%) | 404 (53.02%) | <0.001 |
| Female | 854 (41.86%) | 48 (27.59%) | 448 (40.58%) | 358 (46.98%) | |
| Diabetes | |||||
| No | 1,564 (76.67%) | 160 (91.95%) | 957 (86.68%) | 447 (58.66%) | <0.001 |
| Yes | 476 (23.33%) | 14 (8.05%) | 147 (13.32%) | 315 (41.34%) | |
| Hypertension | |||||
| No | 648 (31.76%) | 71 (40.80%) | 372 (33.70%) | 205 (26.90%) | <0.001 |
| Yes | 1,392 (68.24%) | 103 (59.20%) | 732 (66.30%) | 557 (73.10%) | |
| COPD | |||||
| No | 2,011 (98.58%) | 172 (98.85%) | 1,085 (98.28%) | 754 (98.95%) | 0.461 |
| Yes | 29 (1.42%) | 2 (1.15%) | 19 (1.72%) | 8 (1.05%) | |
| Previous PCI | |||||
| No | 1,780 (87.25%) | 157 (90.23%) | 955 (86.50%) | 668 (87.66%) | 0.357 |
| Yes | 260 (12.75%) | 17 (9.77%) | 149 (13.50%) | 94 (12.34%) | |
| Previous MI | |||||
| No | 1,885 (92.40%) | 161 (92.53%) | 1,015 (91.94%) | 709 (93.04%) | 0.674 |
| Yes | 155 (7.60%) | 13 (7.47%) | 89 (8.06%) | 53 (6.96%) | |
| Previous stroke | |||||
| No | 1,816 (89.02%) | 159 (91.38%) | 975 (88.32%) | 682 (89.50%) | 0.421 |
| Yes | 224 (10.98%) | 15 (8.62%) | 129 (11.68%) | 80 (10.50%) | |
| Smoking | |||||
| No | 1,802 (88.33%) | 154 (88.51%) | 964 (87.32%) | 684 (89.76% | 0.270 |
| Yes | 238 (11.67%) | 20 (11.49%) | 140 (12.68%) | 78 (10.24%) | |
| Systolic pressure | 131.00 (122.00–147.00) | 133.50 (126.00–150.00) | 132.00 (124.00–147.00) | 130.00 (120.00–147.00) | 0.193 |
| Diastolic pressure | 80.00 (70.00–88.00) | 80.00 (70.00–89.75) | 80.00 (70.00–87.00) | 80.00 (70.00–89.00) | 0.914 |
| Total cholesterol | 4.40 (3.75–5.10) | 3.90 (3.30–4.60)a,b | 4.21 (3.70–4.90)b | 4.60 (4.00–5.40) | <0.001 |
| Hemoglobin | 132.00 (122.00–142.00) | 131.83 (122.00–139.75) | 132.00 (122.00–142.00) | 132.00 (122.00–143.00) | 0.138 |
| ALT | 22.70 (15.00–39.05) | 18.05 (12.25–32.60)a,b | 21.45 (14.60–37.24)b | 25.25 (16.05–43.88) | <0.001 |
| AST | 23.00 (17.40–46.32) | 23.00 (17.00–39.17) | 22.30 (17.00–45.08) | 23.75 (18.00–50.25) | 0.071 |
| HDL-C | 0.93 (0.79–1.08) | 1.04 (0.91–1.26)a,b | 0.96 (0.82–1.10)b | 0.87 (0.74–1.01) | <0.001 |
| LDL-C | 2.51 (2.05–3.10) | 2.27 (1.78–2.76)a,b | 2.52 (2.05–3.11) | 2.59 (2.09–3.12) | <0.001 |
Baseline characteristics of patients receiving PCI who have CKM.
COPD, chronic obstructive pulmonary disease; MI, myocardial infarction; ALT, alanine aminotransferase; AST, aspartate aminotransferase.
Indicate statistically significant differences from the medium TyG group and high TyG group, respectively.
3.2 Link between TyG index and CRFs
Correlation analyses utilizing Spearman and Pearson methods were executed to evaluate the links between the TyG index and various CRFs. As depicted in Table 2, the TyG index exhibited positive links to Hemoglobin, ALT, AST, and LDL-C, whereas negative associations were identified with age, TC, and HDL-C.
Table 2
| Valuables | Correlation coefficient (r) | P value |
|---|---|---|
| Age | −0.135 | <0.001 |
| Systolic pressure | −0.031 | 0.157 |
| Diastolic pressure | −0.013 | 0.547 |
| Total cholesterol | −0.135 | <0.001 |
| Hemoglobin | 0.050 | 0.025 |
| ALT | 0.051 | 0.020 |
| AST | 0.045 | 0.044 |
| HDL-C | −0.280 | <0.001 |
| LDL-C | 0.088 | <0.001 |
Link between the TyG index and cardiovascular risk factors.
3.3 Univariate cox regression analysis
Univariate Cox regression analysis identified several variables markedly linked to ACM, as depicted in Supplementary Table 1. These included: age ≥65 years (HR = 2.42, 95%CI: 1.66–3.52, P < 0.001), chronic obstructive pulmonary disease (COPD) (HR = 3.79, 95%CI: 1.78–8.10, P < 0.001), alanine aminotransferase (ALT) (HR = 1.002, 95%CI: 1.001–1.003, P < 0.001), and aspartate aminotransferase (AST) (HR = 1.002, 95%CI: 1.001–1.003, P < 0.001).
Moreover, as indicated in Supplementary Table 2, age ≥65 years (HR = 2.42, 95%CI: 1.33–4.42, P = 0.004) and individuals with COPD (HR = 4.15, 95%CI: 1.30–13.24, P = 0.016) emerged as independent predictors of cardiac mortality (CM).
3.4 Link between TyG index and outcome
Long-term survival outcomes were assessed through Kaplan–Meier curve analysis. Statistically significant variations in 5-year ACM were identified across the three groups stratified by TyG index (log-rank P < 0.001). Specifically, comparisons between the low-TyG and medium-TyG groups revealed notable differences in both ACM (log-rank P = 0.008) and CM (log-rank P = 0.012), as illustrated in Figure 2.
Figure 2
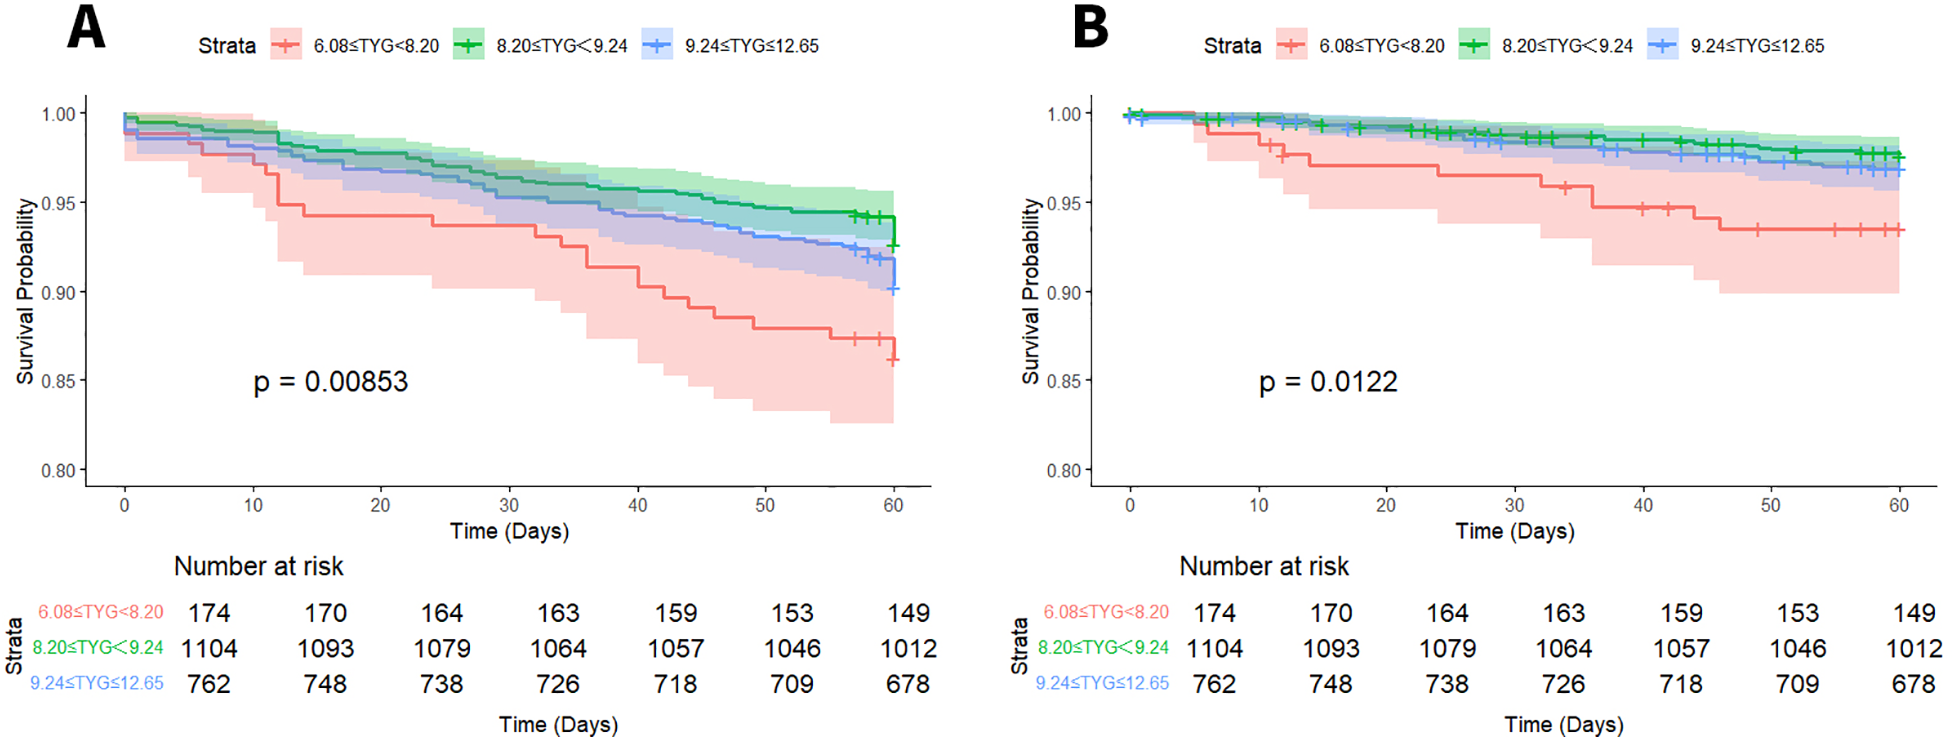
Kaplan–Meier survival curves for ACM (A) and CM (B) based on TyG index stratification.
Multivariate Cox regression models were applied to examine the links between TyG index levels and both ACM and CM in CKM patients undergoing PCI. Details of the unadjusted and adjusted models are depicted in Table 3. For ACM, in the unadjusted Model 1, the low-TyG group (6.08 ≤ TyG < 8.20) exhibited a markedly elevated risk of ACM vs. the medium-TyG group (8.20 ≤ TyG < 9.24) (HR = 1.96, 95%CI: 1.25–3.10; P < 0.05). After controlling for age, increased risks remained evident in both the low-TyG and high-TyG groups (TyG ≥ 9.24), with HRs of 1.85 (95%CI: 1.17–2.91) and 1.46 (95%CI: 1.06–2.00), respectively (all P < 0.05). Further adjustment in Model 3 for age, COPD, AST, ALT, and hemoglobin preserved the statistical significance of the associations (low-TyG: HR = 1.88, 95%CI: 1.19–2.97; high-TyG: HR = 1.37, 95%CI: 1.01–1.89; all P < 0.05). Regarding CM, the low-TyG group consistently exhibited an elevated risk across all models: unadjusted (HR = 2.80, 95%CI: 1.38–5.67), age-adjusted (HR = 2.65, 95%CI: 1.31–5.38), and model 3 adjusted (HR = 2.75, 95%CI: 1.35–5.28) (all P < 0.05).
Table 3
| Group | Model 1 | Model 2 | Model 3 | |||
|---|---|---|---|---|---|---|
| HR (95% CI) | P | HR (95% CI) | P | HR (95% CI) | P | |
| ACM | ||||||
| 6.08 ≤ TyG < 8.20 | 1.96 (1.25,3.10) | 0.004 | 1.85 (1.17,2.91) | 0.008 | 1.88 (1.19,2.97) | 0.007 |
| 8.20 ≤ TyG < 9.24 | Reference | Reference | Reference | |||
| 9.24 ≤ TyG ≤ 12.65 | 1.34 (0.98,1.84) | 0.067 | 1.46 (1.06,2.00) | 0.020 | 1.37 (1.01,1.89) | 0.05 |
| CM | ||||||
| 6.08 ≤ TyG < 8.20 | 2.80 (1.38,5.67) | 0.004 | 2.65 (1.31,5.38) | 0.007 | 2.75 (1.35,5.58) | 0.005 |
| 8.20 ≤ TyG < 9.24 | Reference | Reference | Reference | |||
| 9.24 ≤ TyG ≤ 12.65 | 1.30 (0.74,2.27) | 0.36 | 1.38 (0.79,2.43) | 0.25 | 1.38 (0.78,2.43) | 0.267 |
Findings from multivariate Cox regression assessing the link between the TyG index and endpoints.
ACM: Model 1: no adjustment; Model 2: adjustment for age; Model 3: adjustment for age, COPD, AST, ALT, SYNTAX Score. CM: model 1: no adjustment; model 2: adjustment for age; model 3: adjustment for age, COPD.
TyG index and ACM correlation patterns in CKM patients after PCI were assessed through RCS regression analysis to examine potential nonlinear associations. As illustrated in Figure 3, no evidence of a nonlinear link was identified between the TyG index and either ACM or CM (P for nonlinearity > 0.05 for all comparisons).
Figure 3
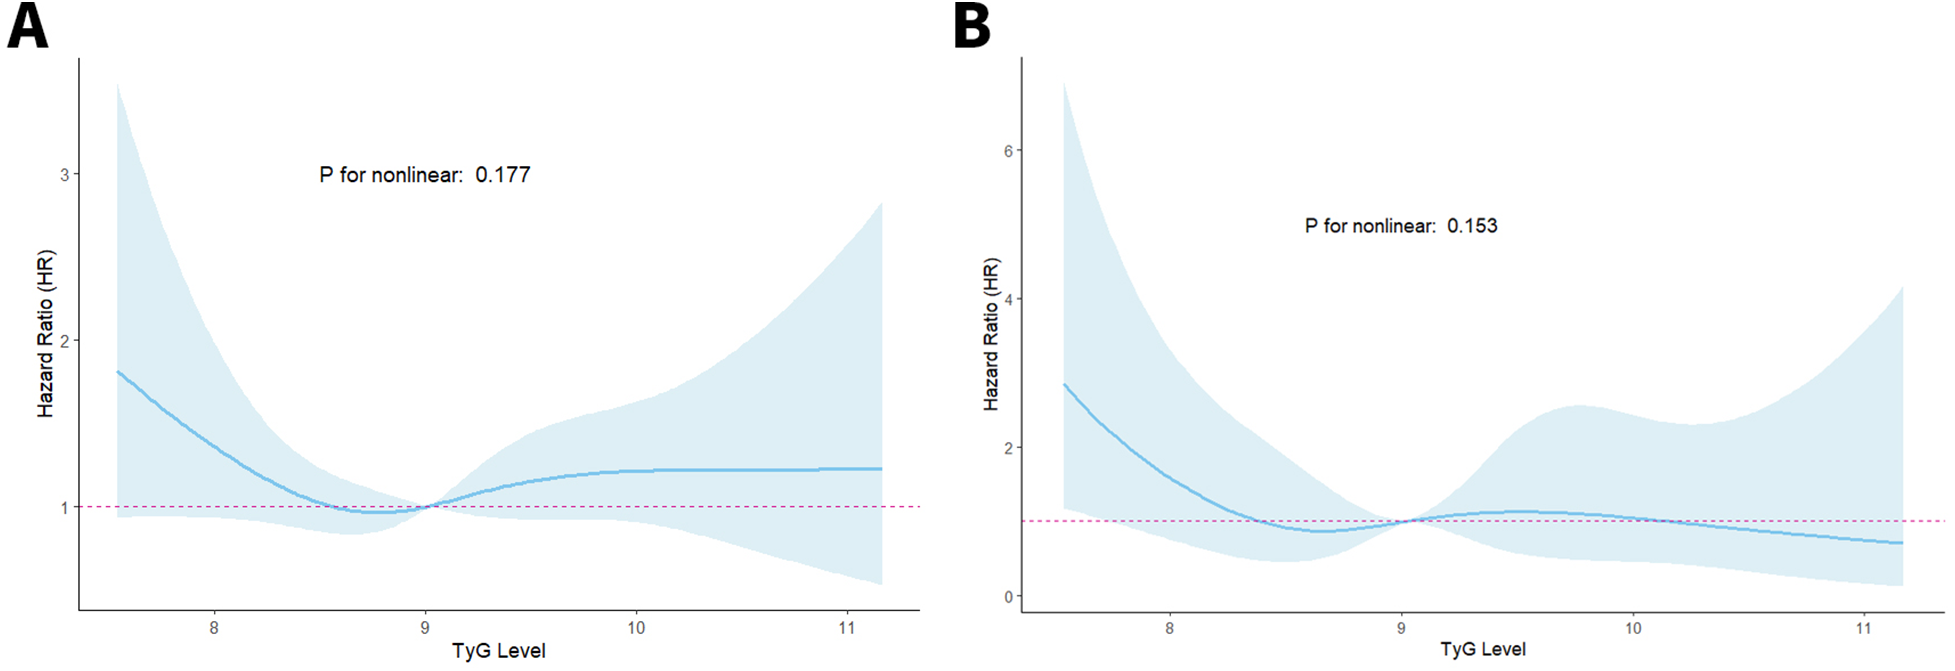
RCS curves of the TyG index connected to ACM (A) and CM (B) risks.
3.5 Subgroup analysis
Subgroup stratification analyses were executed to systematically investigate the link between TyG index levels and both ACM and CM across varying clinical profiles. Patients were categorized according to sex, history of hypertension, diabetes mellitus, previous myocardial infarction, prior PCI, and prior stroke.
Regarding ACM (Supplementary Table 3, Figure 4), among patients in the low-TyG group, markedly elevated ACM risks emerged in specific subsets vs. the medium-TyG group (all P < 0.05): individuals experiencing hypertension (HR = 1.81, 95%CI: 1.00–3.26), subjects lacking diabetes (HR = 1.67, 95%CI: 1.01–2.75), individuals without MI history (HR = 1.98, 95%CI: 1.23–3.17), patients with no previous PCI (HR = 1.95, 95%CI: 1.20–3.15), and individuals lacking stroke history (HR = 1.99, 95%CI: 1.24–3.19). The high-TyG group demonstrated elevated ACM risks among female subjects (HR = 1.95, 95%CI: 1.20–3.15) and individuals with hypertension (HR = 1.53, 95%CI: 1.04–2.24) (all P < 0.05).
Figure 4
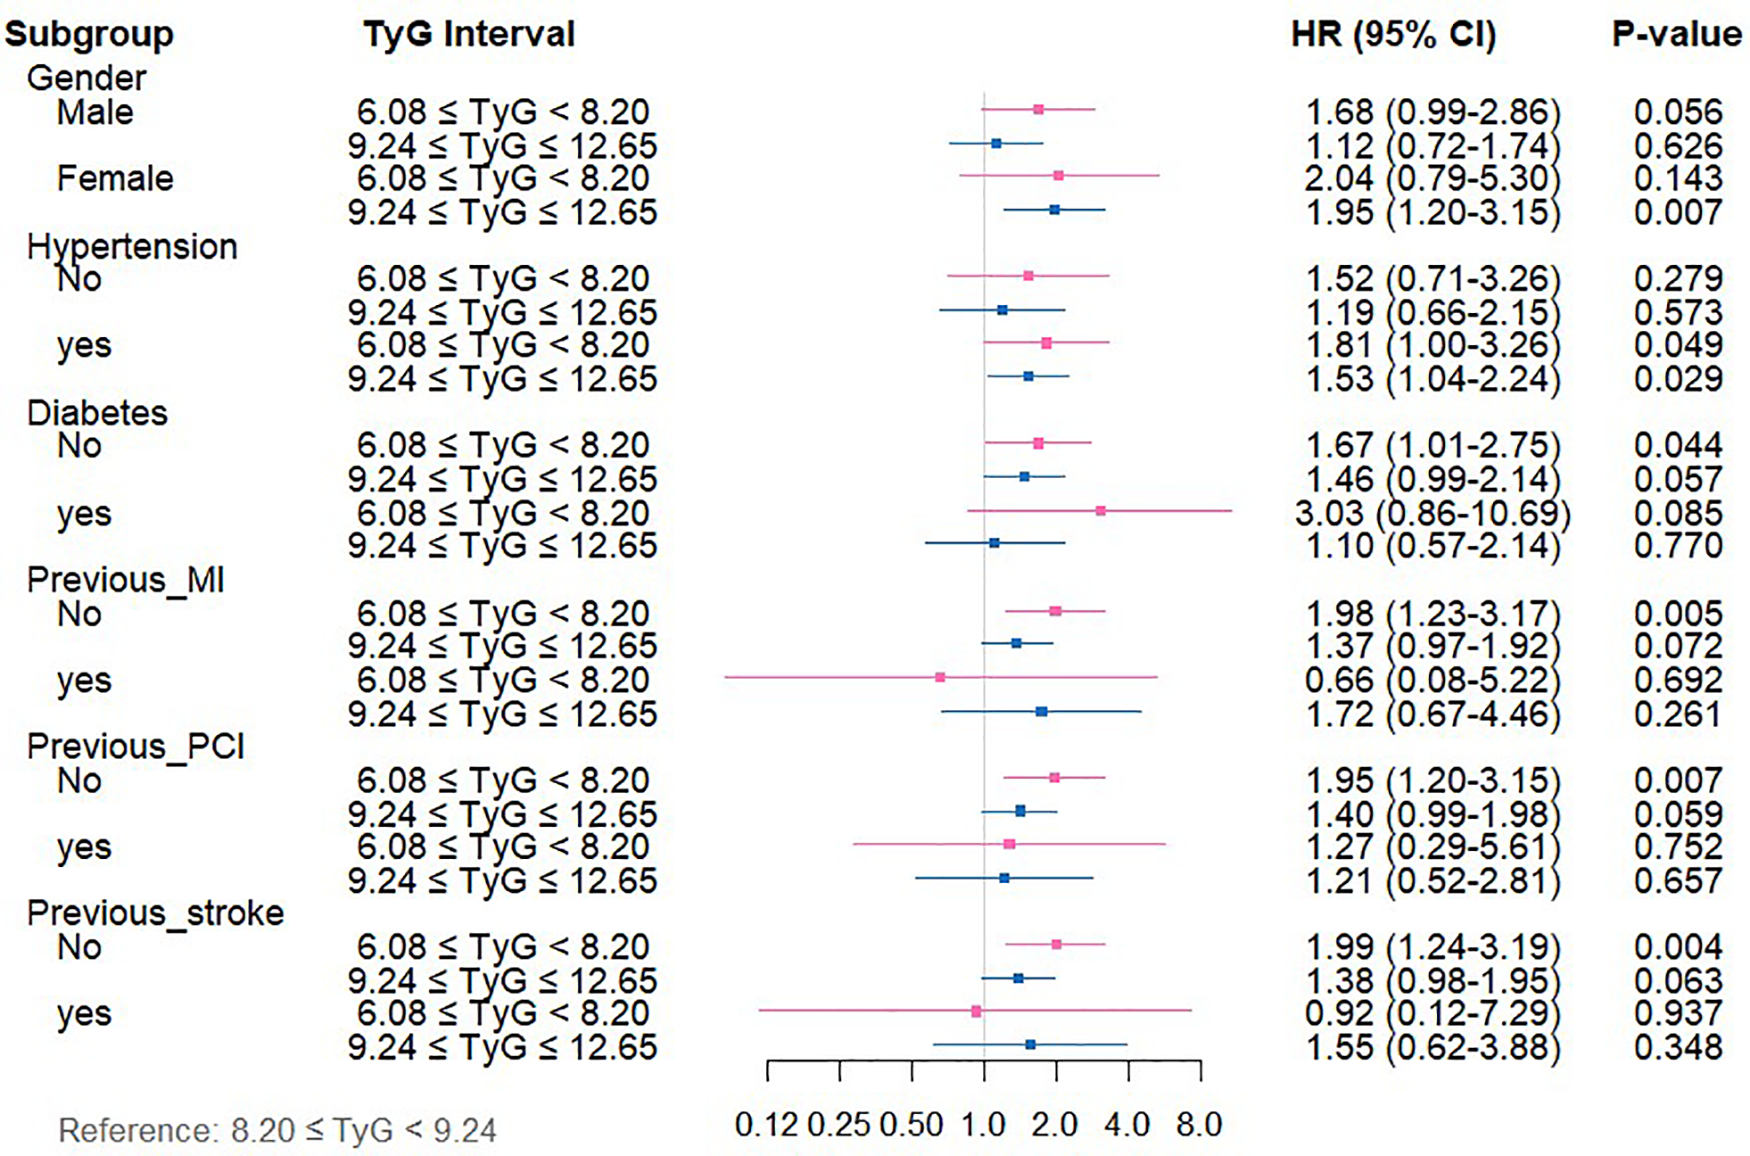
Forest plot depicting TyG index measurements and ACM risk across distinct patient subgroups.
For CM (Supplementary Table 4, Figure 5), relative to the medium-TyG group, the low-TyG group exhibited markedly higher CM risks in the following subgroups (all P < 0.05): males (HR = 3.03, 95%CI: 1.31–6.98), individuals with hypertension (HR = 3.51, 95%CI: 1.31–9.36), those with diabetes (HR = 5.71, 95%CI: 1.04–31.746), those without diabetes (HR = 2.31, 95%CI: 1.06–5.02), and subjects without previous PCI (HR = 2.73, 95%CI: 1.29–5.77).
Figure 5
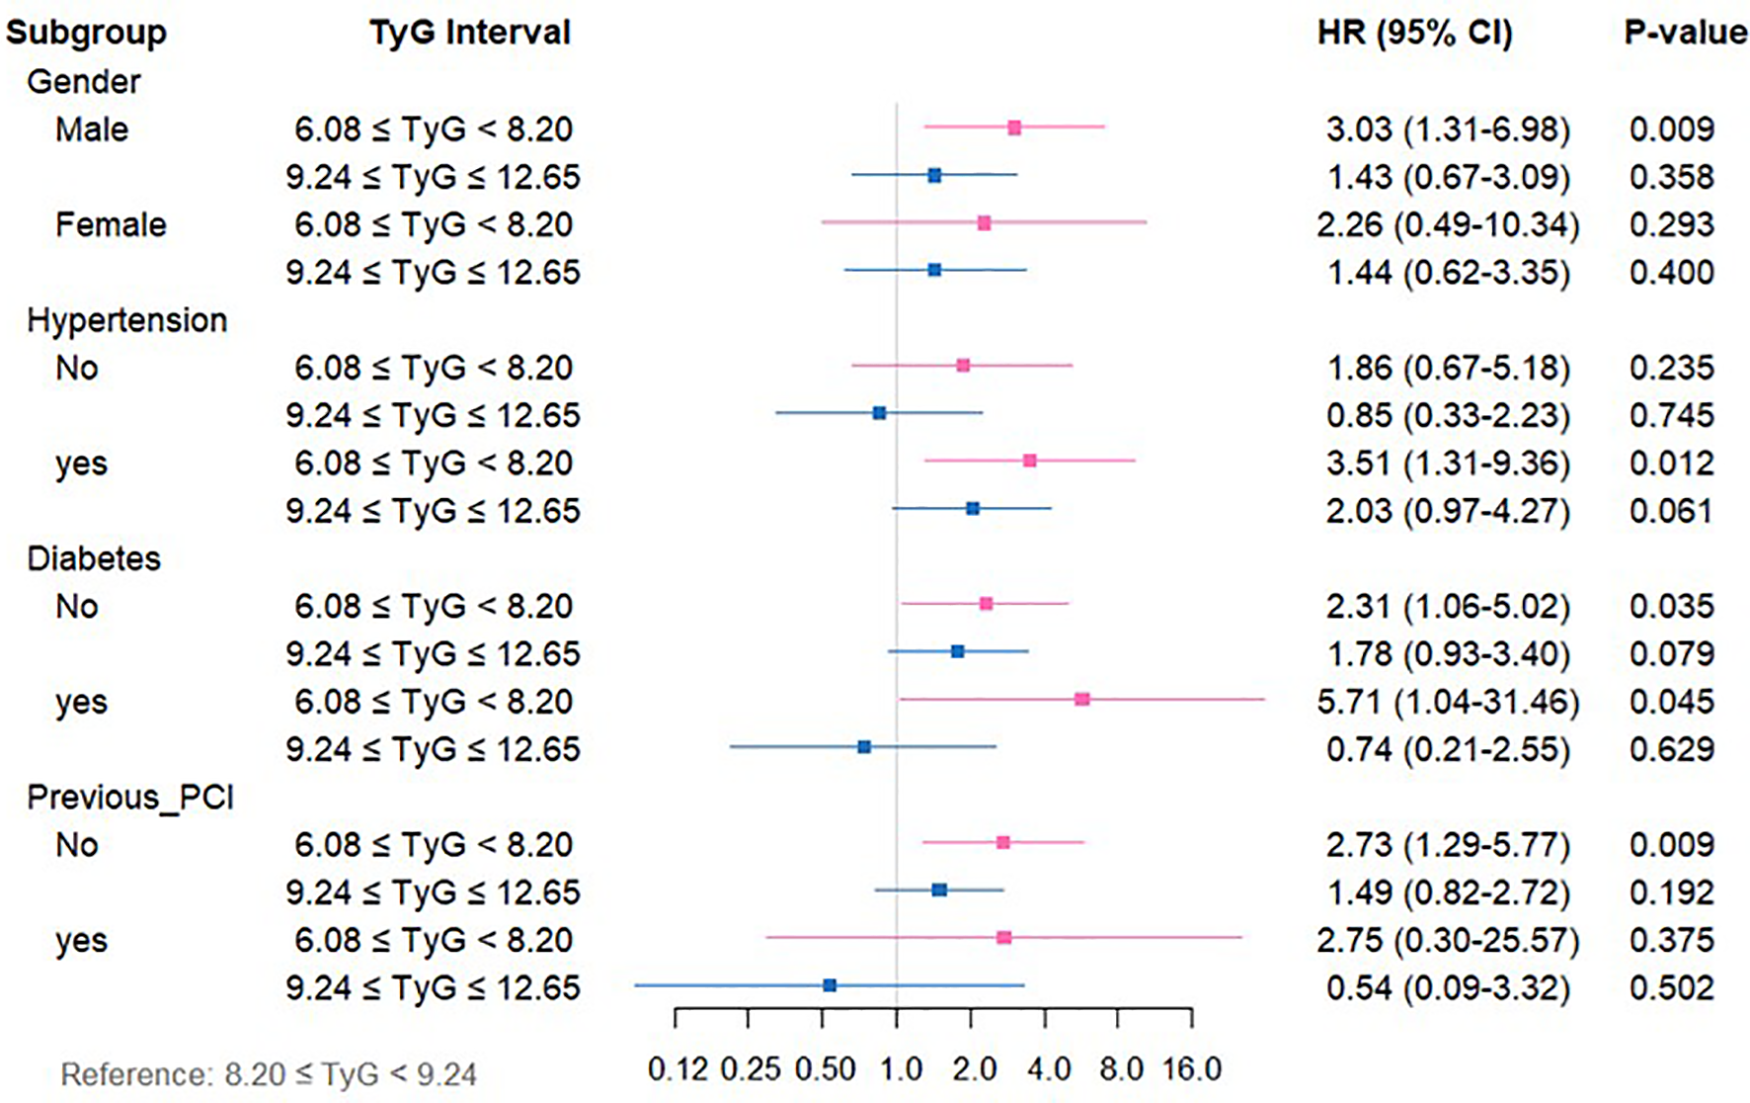
Forest plot depicting TyG index measurements and CM risk across distinct patient subgroups.
4 Discussion
This study represents the first to specifically target CKM patients as the research cohort and to report five-year follow-up outcomes, thereby offering clinically stable and reliable guidance. Moreover, the TyG index exhibits considerable value as a predictive marker in CKM patients, attributable to its ease of calculation, reproducibility, and cost-effectiveness. Although considerable evidence exists linking the TyG index to CVD outcomes, its prognostic relevance in those with CKM remains insufficiently investigated. In this study comprising 2,040 individuals with CKM, the following findings were observed: (1) The TyG index, recognized as a dependable surrogate for IR, was markedly linked to established CAD risk factors, aligning with prior research; (2) TyG levels were associated with both ACM and CM. Specifically, the low-TyG group exhibited markedly elevated risks of ACM and CM vs. the medium-TyG group, whereas the high-TyG group was independently linked to elevated ACM risk; (3) The associations between TyG levels and ACM/CM were particularly pronounced within certain clinical subpopulations, such as individuals with a history of hypertension, absence of diabetes, and no previous PCI.
CKM is recognized as a multisystem disorder arising from intricate pathophysiological interactions among metabolic disturbances (e.g., obesity and IR), CKD, and CVD, ultimately contributing to systemic multi-organ impairment. In this framework, IR, established as a key factor in atherosclerosis development, demonstrates notable correlation with both CAD initiation and advancement (16). The TyG index functions as a reliable and uncomplicated proxy indicator for IR (17). Recent medical findings indicate that TyG index values are linked to unfavorable cardiovascular results, encompassing coronary heart disease and cardiac failure. Research performed by Su et al. examining 731 coronary heart disease patients demonstrated that TyG index measurements corresponded to CAD intensity and successfully detected patients facing elevated risks of multivessel disease (18). Additionally, a forward-looking cohort investigation by Zhang et al. (N = 1,932) examining individuals with acute myocardial infarction and type 2 diabetes determined that higher TyG index measurements predicted elevated CM and ACM risk levels (19).
This study represents the first to establish that elevated and diminished TyG indices independently correlate with increased mortality risk among individuals with CKM, a finding that markedly contrasts with the conclusions of most earlier studies. Although numerous investigations (20–22) have identified a monotonic positive connection between the TyG index and cardiovascular events, such analyses have predominantly concentrated on general cardiovascular populations. The observed divergence may be attributable to the distinct multisystem pathological interplay present in CKM patients. Specifically, the increased risk associated with high TyG levels is consistent with classical IR theory, which facilitates the development of atherosclerosis and heart failure via disruptions in lipid and glucose metabolism (23). In contrast, the mechanism underlying the heightened risk linked to low TyG levels has been supported by several studies, including a retrospective analysis involving 19,420 participants, which reported a nonlinear relationship between TyG index and ACM or CM (24). Preliminary indications of such a nonlinear trend have also been detected in patients with metabolic diseases coexisting with CKD. For instance, the study by Xia et al. identified an inverse correlation between TG levels and mortality risk in individuals with CAD, introducing the concept of the “TG paradox” (25). Particularly noteworthy is the recognition of distinct TyG risk patterns in populations with renal insufficiency and metabolic dysregulation. Prior research identified a nonlinear (J-shaped) link between TyG index and CKD among subjects with impaired glucose metabolism and hypertension (26), while findings from Shang et al. (27) uncovered a U-shaped pattern between TyG index and disease prevalence in diabetic nephropathy, suggesting that synergistic injury involving the cardiovascular-kidney-metabolic axis may intensify the pathological consequences of extreme TyG values. Collectively, these findings imply that in cardiovascular populations with concurrent renal dysfunction and metabolic abnormalities, the risk trajectory of the TyG index may diverge from conventional linear interpretations. The elevated risk in the low TyG group, while unexpected, may reflect a state of “metabolic frailty” in advanced CKM syndrome. In these patients, low triglyceride and glucose levels could indicate poor nutritional status and chronic illness severity rather than metabolic health. This aligns with the “obesity paradox” seen in other chronic diseases, where traditional risk factors reverse direction (28, 29).
5 Limitations
This study has several limitations that should be carefully considered when interpreting the findings. Firstly, this was a single-center, retrospective study, which may introduce selection bias and limit the generalizability of our findings. Future multi-center prospective studies are needed to validate these results. Second, although we performed extensive subgroup analyses to explore the consistency of the TyG index's prognostic value, these analyses were exploratory and were not adjusted for multiple comparisons. Therefore, the results should be interpreted with caution, as the risk of Type I errors (false-positive findings) is increased. Some subgroups also had relatively small sample sizes, which may limit the statistical power and increase the risk of Type II errors. A further limitation pertains to the use of X-tile software for determining the TyG index cut-off values. While this data-driven approach objectively identifies thresholds that best separate groups based on the outcome (all-cause mortality), it may optimize the association specifically within our dataset, potentially leading to overfitting and an overestimation of the true effect sizes. Therefore, the prognostic utility of these specific cut-off values requires validation in future independent cohorts. Finally, the relatively small sample size in the low TyG group (n = 174) may limit the statistical stability of its risk estimates, and these findings require validation in larger cohorts. In addition, our analysis could not adjust for certain potential confounders, including BMI, medication use (e.g., statins, antidiabetic drugs), and albuminuria, due to data limitations.
6 Conclusion
TyG index is markedly linked to adverse clinical outcomes in patients with CKM, and this association persists even after adjustment for multiple confounding variables. Therefore, in managing CKM patients, clinicians should not only intensify control of conventional CRFs but also consider close monitoring of the TyG index. Nonetheless, whether modification of TyG index levels can effectively reduce mortality risk remains to be determined and warrants verification through prospective interventional studies.
Statements
Data availability statement
The raw data supporting the conclusions of this article will be made available by the authors, without undue reservation.
Ethics statement
The studies involving humans were approved by the Ethics Committee of Cangzhou Central Hospital, affiliated with Hebei Medical University. The studies were conducted in accordance with the local legislation and institutional requirements. The participants provided their written informed consent to participate in this study. Written informed consent was obtained from the individual(s) for the publication of any potentially identifiable images or data included in this article.
Author contributions
CY: Methodology, Conceptualization, Formal analysis, Writing – original draft. HL: Methodology, Writing – original draft, Conceptualization, Formal analysis. YW: Data curation, Writing – review & editing, Investigation. ZW: Investigation, Writing – review & editing, Data curation. YH: Project administration, Writing – review & editing. LR: Project administration, Writing – review & editing. CA: Data curation, Writing – review & editing. XM: Writing – review & editing, Validation. JC: Validation, Writing – review & editing. QL: Validation, Writing – review & editing. GL: Writing – review & editing, Visualization. YY: Visualization, Writing – review & editing. LY: Supervision, Writing – review & editing, Conceptualization.
Funding
The author(s) declared that financial support was received for this work and/or its publication. Natural Science Foundation of Hebei Province, China (H2021110008), special project for Clinical and Basic Sci&Tech Innovation of Guangdong Medical University (GDMULCJC2024112, GDMULCJC2025138), and Undergraduate Innovation and Entrepreneurship Education Base Project of Guangdong Medical University (JDXM2024087F, JDXM2024092F, JDXM2024093F).
Conflict of interest
The author(s) declared that this work was conducted in the absence of any commercial or financial relationships that could be construed as a potential conflict of interest.
Generative AI statement
The author(s) declared that generative AI was not used in the creation of this manuscript.
Any alternative text (alt text) provided alongside figures in this article has been generated by Frontiers with the support of artificial intelligence and reasonable efforts have been made to ensure accuracy, including review by the authors wherever possible. If you identify any issues, please contact us.
Publisher’s note
All claims expressed in this article are solely those of the authors and do not necessarily represent those of their affiliated organizations, or those of the publisher, the editors and the reviewers. Any product that may be evaluated in this article, or claim that may be made by its manufacturer, is not guaranteed or endorsed by the publisher.
Supplementary material
The Supplementary Material for this article can be found online at: https://www.frontiersin.org/articles/10.3389/fcvm.2025.1687231/full#supplementary-material
References
1.
Shahjehan RD Sharma S Bhutta BS . Coronary Artery Disease. (2025).
2.
Jager KJ Kovesdy C Langham R Rosenberg M Jha V Zoccali C . A single number for advocacy and communication-worldwide more than 850 million individuals have kidney diseases. Kidney Int. (2019) 96(5):1048–50. 10.1016/j.kint.2019.07.012
3.
Sarnak MJ Amann K Bangalore S Cavalcante JL Charytan DM Craig JC et al Chronic kidney disease and coronary artery disease: jACC state-of-the-art review. J Am Coll Cardiol. (2019) 74(14):1823–38. 10.1016/j.jacc.2019.08.1017
4.
Ahmad M Mehta P Reddivari A Mungee S . Percutaneous Coronary Intervention. (2025).
5.
Movahed MR Aghdasi S Shanmugasundaram M Hashemzadeh M . Higher inpatient mortality following percutaneous coronary intervention in patients with advanced chronic kidney disease. Coron Artery Dis. (2024) 35(8):629–32. 10.1097/MCA.0000000000001379
6.
Iyer M Ziada K Cho L Tamis-Holland J Khot U Krishnaswamy A et al Chronic kidney disease predisposes to acute congestive heart failure, cardiogenic shock, and mortality in patients undergoing percutaneous coronary intervention. Am J Cardiol. (2024) 233:19–27. 10.1016/j.amjcard.2024.09.025
7.
Mousavi FS Bagheri B Jalalian R Nabati M Moradi A Mousavi F et al Assessing renal function as a predictor of adverse outcomes in diabetic patients undergoing percutaneous coronary intervention. Acta Cardiol. (2024) 79(7):824–32. 10.1080/00015385.2024.2410603
8.
Ormazabal V Nair S Elfeky O Aguayo C Salomon C Zuniga FA . Association between insulin resistance and the development of cardiovascular disease. Cardiovasc Diabetol. (2018) 17(1):122. 10.1186/s12933-018-0762-4
9.
Hill MA Yang Y Zhang L Sun Z Jia G Parrish AR et al Insulin resistance, cardiovascular stiffening and cardiovascular disease. Metab Clin Exp. (2021) 119:154766. 10.1016/j.metabol.2021.154766
10.
Su X Rao H Zhao C Zhang X Li D . The association between the metabolic score for insulin resistance and mortality in patients with cardiovascular disease: a national cohort study. Front Endocrinol (Lausanne). (2024) 15:1479980. 10.3389/fendo.2024.1479980
11.
Song SH Goo YJ Oh TR Suh SH Choi HS Kim CS et al Insulin resistance is associated with incident chronic kidney disease in population with normal renal function. Kidney Res Clin Pract. (2023) 44(3):491–9. 10.23876/j.krcp.22.298
12.
Liu S Sun H Liu J Wang G . Accessing the relationship between six surrogate insulin resistance indexes and the incidence of rapid kidney function decline and the progression to chronic kidney disease among middle-aged and older adults in China: results from the China health and retirement longitudinal study. Diabetes Res Clin Pract. (2024) 212:111705. 10.1016/j.diabres.2024.111705
13.
Sun Y Ji H Sun W An X Lian F . Triglyceride glucose (TyG) index: a promising biomarker for diagnosis and treatment of different diseases. Eur J Intern Med. (2025) 131:3–14. 10.1016/j.ejim.2024.08.026
14.
Liu L Yu G Ji X Wang Y He H . Associations of six insulin resistance-related indices with the risk and progression of cardio-renal-metabolic multimorbidity: evidence from the UK biobank. Cardiovasc Diabetol. (2025) 24(1):377. 10.1186/s12933-025-02928-w
15.
Ding L Zhang H Liu Y Jiang Z Yu F Qi Y et al Associations between triglyceride-glucose-related indices and all-cause and cardiovascular mortality among individuals with atrial fibrillation and metabolic syndrome: a cohort study of the UK biobank. Cardiovasc Diabetol. (2025) 24(1):414. 10.1186/s12933-025-02963-7
16.
Scott DA Ponir C Shapiro MD Chevli PA . Associations between insulin resistance indices and subclinical atherosclerosis: a contemporary review. Am J Prev Cardiol. (2024) 18:100676. 10.1016/j.ajpc.2024.100676
17.
Simental-Mendia LE Rodriguez-Moran M Guerrero-Romero F . The product of fasting glucose and triglycerides as surrogate for identifying insulin resistance in apparently healthy subjects. Metab Syndr Relat Disord. (2008) 6(4):299–304. 10.1089/met.2008.0034
18.
Su J Li Z Huang M Wang Y Yang T Ma M et al Triglyceride glucose index for the detection of the severity of coronary artery disease in different glucose metabolic states in patients with coronary heart disease: a RCSCD-TCM study in China. Cardiovasc Diabetol. (2022) 21(1):96. 10.1186/s12933-022-01523-7
19.
Zhang Y Ding X Hua B Liu Q Gao H Chen H et al Predictive effect of triglyceride-glucose index on clinical events in patients with type 2 diabetes mellitus and acute myocardial infarction: results from an observational cohort study in China. Cardiovasc Diabetol. (2021) 20(1):43. 10.1186/s12933-021-01236-3
20.
Zhang R Shi S Chen W Wang Y Lin X Zhao Y et al Independent effects of the triglyceride-glucose index on all-cause mortality in critically ill patients with coronary heart disease: analysis of the MIMIC-III database. Cardiovasc Diabetol. (2023) 22(1):10. 10.1186/s12933-023-01737-3
21.
Jiao Y Su Y Shen J Hou X Li Y Wang J et al Evaluation of the long-term prognostic ability of triglyceride-glucose index for elderly acute coronary syndrome patients: a cohort study. Cardiovasc Diabetol. (2022) 21(1):3. 10.1186/s12933-021-01443-y
22.
Cai XL Xiang YF Chen XF Lin XQ Lin BT Zhou GY et al Prognostic value of triglyceride glucose index in population at high cardiovascular disease risk. Cardiovasc Diabetol. (2023) 22(1):198. 10.1186/s12933-023-01924-2
23.
Tao LC Xu JN Wang TT , Hua F, Li JJ. Triglyceride-glucose index as a marker in cardiovascular diseases: landscape and limitations. Cardiovasc Diabetol. (2022) 21(1):68. 10.1186/s12933-022-01511-x
24.
Liu XC He GD Lo K Huang YQ Feng YQ . The triglyceride-glucose index, an insulin resistance marker, was non-linear associated with all-cause and cardiovascular mortality in the general population. Front Cardiovasc Med. (2020) 7:628109. 10.3389/fcvm.2020.628109
25.
Xia TL Li YM Huang FY Chai H Huang BT Li Q et al The triglyceride paradox in the mortality of coronary artery disease. Lipids Health Dis. (2019) 18(1):21. 10.1186/s12944-019-0972-0
26.
Zhu Q Chen Y Cai X Cai L Hong J Luo Q et al The non-linear relationship between triglyceride- glucose index and risk of chronic kidney disease in hypertensive patients with abnormal glucose metabolism: a cohort study. Front Med (Lausanne). (2022) 9:1018083. 10.3389/fmed.2022.1018083
27.
Shang J Yu D Cai Y Wang Z Zhao B Zhao Z et al The triglyceride glucose index can predict newly diagnosed biopsy-proven diabetic nephropathy in type 2 diabetes: a nested case control study. Medicine (Baltimore). (2019) 98(46):e17995. 10.1097/MD.0000000000017995
28.
Luo C Li Q Wang Z Duan S Ma Q . Association between triglyceride glucose-body mass index and all-cause mortality in critically ill patients with acute myocardial infarction: retrospective analysis of the MIMIC-IV database. Front Nutr. (2024) 11:1399969. 10.3389/fnut.2024.1399969
29.
Pan W Ji TF Hu BT Yang J Lu L Wei J . Association between triglyceride glucose body mass index and 1 year all cause mortality in stage 4 CKM syndrome patients. Sci Rep. (2025) 15(1):17019. 10.1038/s41598-025-01549-3
Summary
Keywords
all-cause mortality, cardiac mortality, cardiovascular-kidney-metabolic syndrome, insulin resistance, triglyceride-glucose index
Citation
Yao C, Liu H, Wang Y, Wen Z, Huang Y, Ren L, An C, Mo X, Chen J, Lin Q, Lu G, Yin Y and Yan L (2026) Prognostic value of triglyceride-glucose index in patients with cardiovascular-kidney-metabolic syndrome undergoing percutaneous coronary intervention. Front. Cardiovasc. Med. 12:1687231. doi: 10.3389/fcvm.2025.1687231
Received
17 August 2025
Revised
05 December 2025
Accepted
08 December 2025
Published
12 January 2026
Volume
12 - 2025
Edited by
Jianqin Wei, University of Miami, Coral Gables, United States
Reviewed by
Zengming Xue, The Peoples Hospital of Langfang City, China
Kuang Zemin, Capital Medical University, China
Roshan Kumar Mahat, Teerthanker Mahaveer Medical College & Research Centre, India
Updates
Copyright
© 2026 Yao, Liu, Wang, Wen, Huang, Ren, An, Mo, Chen, Lin, Lu, Yin and Yan.
This is an open-access article distributed under the terms of the Creative Commons Attribution License (CC BY). The use, distribution or reproduction in other forums is permitted, provided the original author(s) and the copyright owner(s) are credited and that the original publication in this journal is cited, in accordance with accepted academic practice. No use, distribution or reproduction is permitted which does not comply with these terms.
* Correspondence: Liqiu Yan yanliqiu110@163.com
†These authors have contributed equally to this work
Disclaimer
All claims expressed in this article are solely those of the authors and do not necessarily represent those of their affiliated organizations, or those of the publisher, the editors and the reviewers. Any product that may be evaluated in this article or claim that may be made by its manufacturer is not guaranteed or endorsed by the publisher.