Abstract
Background:
Although B-lines in lung ultrasound may result from diverse etiologies, the presence of left ventricular enlargement and reduced left ventricular ejection fraction (LVEF) generally supports their origin in cardiogenic pulmonary edema (CPE). However, these sonographic findings can also occur in patients with chronic heart failure (CHF) concurrent pneumonia, potentially leading to inappropriate clinical decisions of fluid removal. This study aimed to investigate the diagnostic value of echocardiography-derived right ventricular stroke volume (RVSV) and left ventricular stroke volume (LVSV) difference (ΔSV) in differentiating CPE from pneumonia among CHF patients with acute dyspnea.
Methods:
This retrospective observational study enrolled CHF patients presenting with acute dyspnea, subsequently classified as either CPE or pneumonia based on comprehensive diagnostic evaluation. The diagnosis was established by attending physicians through integrated assessment of pulmonary imaging, laboratory biomarkers, and clinical examination findings. Additionally, 30 asymptomatic CHF patients without dyspnea were included as controls. Standard echocardiographic measurements included RVSV, LVSV, tricuspid annular plane systolic excursion (TAPSE) and mitral annular plane systolic excursion (MAPSE), and the ΔSV (difference between RVSV and LVSV) and the ratio of TAPSE to MAPSE (TAPSE/MAPSE) were calculated, respectively. The average value of the ratio between the early diastolic peak velocity of the mitral valve and the diastolic peak velocity of the septal/lateral (E/e′) was considered as the left ventricular filling pressure.
Results:
Among 133 CHF patients with acute dyspnea in the study, 58 had CPE. Between CHF-CPE group and CHF-pneumonia group, the ROC analysis showed that the area under the curve (AUC) of ΔSV was 0.772 (sensitivity 67.24%, specificity 78.67%), and of TAPSE/MAPSE was 0.724 (sensitivity 53.45%, specificity 82.67%). Between CHF-CPE group and CHF-conrtol group, the AUC of ΔSV was 0.830 (sensitivity 87.93%, specificity 76.67%), and of TAPSE/MAPSE was 0.656 (sensitivity 53.45%, specificity 80.00%). Multivariate logistic regression analysis showed that ΔSV was an independent influencing factor, whether between the CHF-CPE group and the CHF-pneumonia group (odds ratio = 1.076, 95% CI: 1.019–1.137), or between the CHF-CPE group and the CHF-conrtol group (odds ratio = 1.066, 95% CI: 1.007–1.129).
Conclusions:
In CHF patients with acute dyspnea, the difference between RVSV and LVSV measured by echocardiography is helpful in distinguishing CPE from pneumonia. Nevertheless, further investigation with a larger cohort is necessary to confirm our conclusion.
1 Introduction
Heart failure is a clinical syndrome characterized by structural (e.g., cardiac enlargement, myocardial hypertrophy) and/or functional (impaired systolic or diastolic function) abnormalities of the heart. These changes result from primary cardiac causes or various secondary factors that lead to hemodynamic overload and myocardial decompensation. In the United States, approximately 6.2 million adults are affected by heart failure (1). Chronic heart failure (CHF) refers to a persistent state of cardiac dysfunction where compromised heart function cannot adequately support routine daily activities. Patients may experience stable symptoms, gradual deterioration, or acute decompensation (2). While CHF patients maintain sufficient organ perfusion and oxygenation at rest, their cardiac function is invariably impaired to varying degrees. To compensate for reduced cardiac output, CHF typically induces left ventricular (LV) remodeling and dilatation—processes that help restore cardiac output to near-normal levels (3). Acute dyspnea secondary to CHF constitutes a primary reason for hospitalization. The most critical precipitating factors include worsening heart failure symptoms and the development of cardiogenic pulmonary edema (CPE). CPE occurs when LV dysfunction creates a mismatch in fluid dynamics, leading to pulmonary circulatory congestion and subsequent fluid extravasation into pulmonary interstitium and alveoli.
Impaired LV function is widely recognized as the primary contributor to CPE development. Notably, LV diastolic dysfunction appears to play a more significant role than systolic dysfunction, as evidenced by studies on mechanical ventilation weaning-induced pulmonary edema (4, 5). However, beyond LV involvement, right ventricular (RV) function also critically influences acute pulmonary edema pathogenesis. Although elevated LV filling pressure and left atrial pressure directly drive pulmonary edema formation, these pressures are fundamentally sustained by RV-generated hemodynamic forces (3). A key mechanism underlying pulmonary fluid accumulation is the mismatch between RV stroke volumes (RVSV) and LV stroke volumes (LVSV) (6), where excessive RV output relative to LV capacity leads to pulmonary circulatory congestion. Despite this understanding, few studies have quantitatively assessed whether RV-LV volumetric mismatch correlates with pulmonary edema occurrence in CHF patients. Further research is needed to clarify this relationship and its clinical implications.
Pneumonia represents another critical etiology of acute respiratory failure in patients with CHF. Among CHF cases requiring emergency care due to cardiac decompensation, respiratory infections (including pneumonia) account for 35.4%, whereas pulmonary edema alone contributes to 11.3% (7). Lung ultrasound (LUS) serves as a highly sensitive tool for detecting pulmonary edema in CHF patients, as even minimal extravascular lung water generates observable B-lines. However, B-lines are not pathognomonic for pulmonary edema—they can also manifest in pneumonia, particularly interstitial pneumonitis. In CHF patients with concurrent pneumonia, echocardiography and LUS findings may be misleading. The presence of impaired LV function and typical heart failure signs could lead clinicians to erroneously attribute B-lines solely to pulmonary edema, overlooking the coexisting pulmonary infection. Misinterpreting B-lines as purely CPE may prompt overzealous diuresis, potentially resulting in excessive volume depletion and subsequent hypovolemic shock.
Bedside echocardiography serves as a readily available, non-invasive, and convenient method for hemodynamic monitoring. Echocardiographically measured LVSV and derived cardiac output demonstrate good correlation with pulse indicator continuous cardiac output (PiCCO) measurements (8), making this technique particularly valuable for rapid assessment of stroke volume and cardiac output in emergency settings. We hypothesize that CPE results from a mismatch between RVSV and LVSV, whereas CHF patients with pneumonia (without pulmonary edema) maintain balanced ventricular outputs. To test this hypothesis, we employed echocardiography to measure RVSV and LVSV, calculating their differential value (ΔSV) to investigate potential disparities between CHF patients with CPE and those with pneumonia.
2 Materials and methods
2.1 Study population
This retrospective observational study included patients with CHF and acute dyspnea admitted to a tertiary hospital from March 1, 2023 to May 30, 2024 as the observation subjects. The study was performed according to the principles of the Declaration of Helsinki. This study was was approved by the Ethics Committee of our hospital (No. 2024–167) and registered at the China Clinical Trial Registration Centre (No. ChiCTR2400085662). All point-of-care ultrasound examinations were performed as part of routine clinical practice upon clinical physician request, with prior informed consent obtained from patients or their legal guardians.
Our emergency and critical care ultrasound team, composed of ultrasound physicians, is responsible for performing bedside ultrasonography for acute cardiopulmonary complications and respiratory distress across all clinical departments. From the cohort of patients who underwent cardiopulmonary ultrasound for acute dyspnea, we selected those meeting established CHF diagnostic criteria for further analysis (Figure 1).
Figure 1
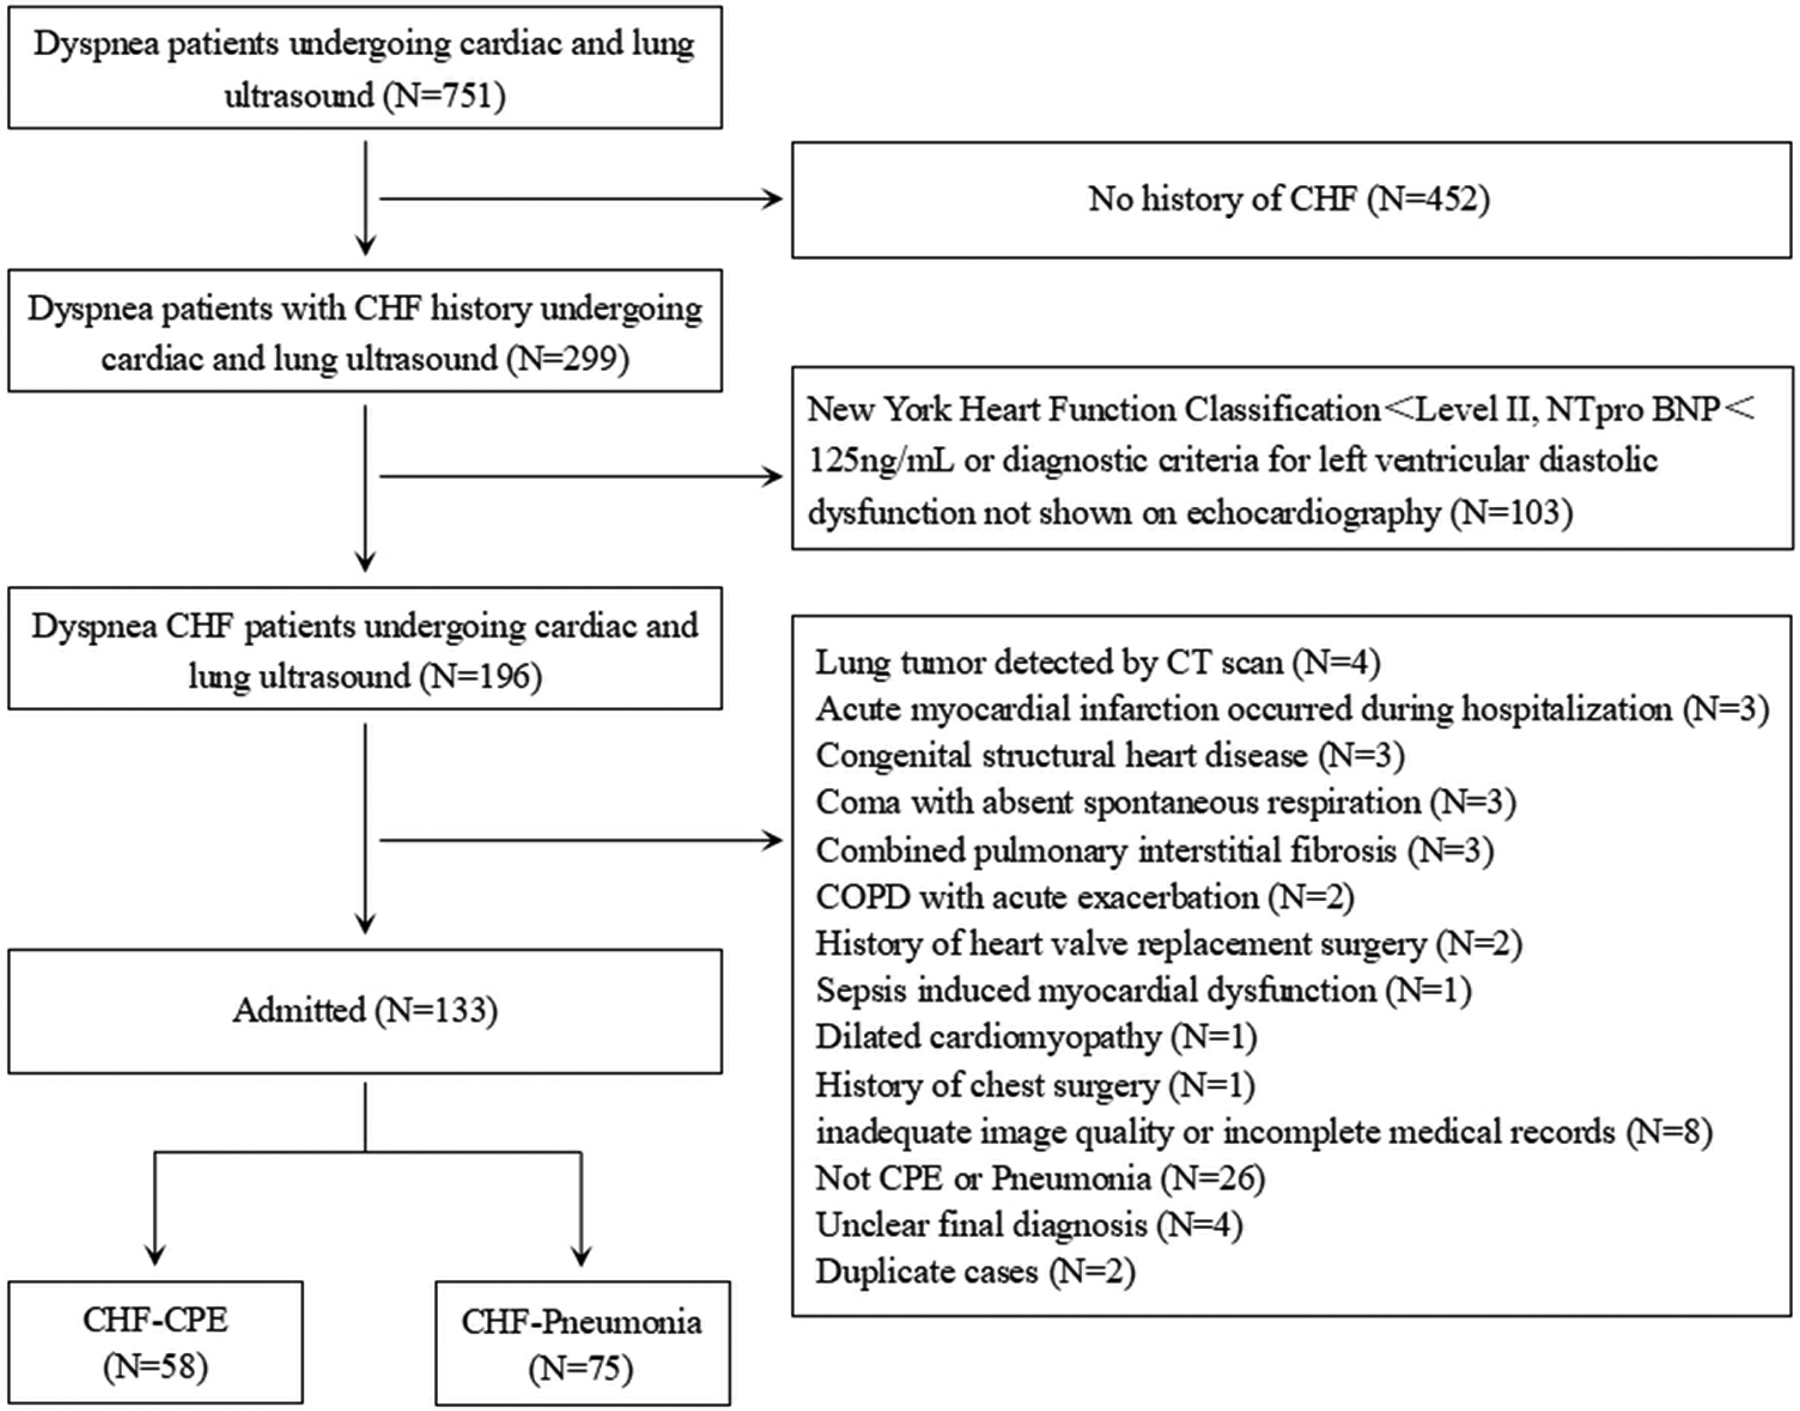
Flowchart of the study. CHF: chronic heart failure; COPD: chronic obstructive pulmonary disease; CPE: cardiogenic pulmonary edema.
The inclusion criteria were as follows: (1) confirmed CHF diagnosis with a documented history ≥3 months; (2) New York Heart Association (NYHA) functional class ≥II, with admission laboratory findings of either brain natriuretic peptide (BNP) ≥35 ng/L or N-terminal pro-B-type natriuretic peptide (NT-proBNP) ≥125 ng/L, along with echocardiographic evidence of LV diastolic dysfunction ≥grade I; (3) acute dyspnea meeting at least one of the following: subjective dyspnea or orthopnea, respiratory rate ≥20 breaths/min; oxygen saturation ≤93%, oxygenation index ≤300 mmHg; (4) pulmonary infiltrative shadows on chest CT or chest x-ray, or moist crackles on lung auscultation.
Exclusion criteria: (1) age <18 years; (2) structural heart disease (e.g., congenital defects, vascular anomalies, dilated/hypertrophic cardiomyopathy, or left ventricular noncompaction); (3) acute coronary syndrome (including myocardial infarction); (4) persistent atrial fibrillation or paroxysmal atrial fibrillation attack period; (5) moderate-to-large pericardial effusion; (6) chronic interstitial fibrosis, pneumothorax, subcutaneous emphysema, lung tumors, or prior thoracic/mediastinal surgery; (7) unclear etiology of dyspnea after clinical evaluation; (8) inability to undergo cardiopulmonary ultrasound or poor image quality.
The etiological diagnosis of dyspnea was jointly interpreted by one cardiovascular physician and one critical care physician based on clinical manifestations, electrocardiogram, cardiopulmonary imaging, laboratory tests (including NT-proBNP, complete blood count, myocardial enzyme markers, C-reactive protein, procalcitonin, bacterial culture, etc.), medical record review, and treatment response. The diagnosis of CPE was established based on a combination of the following: (1) typical clinical manifestations, such as orthopnea and bilateral pulmonary rales on auscultation; (2) supportive findings from laboratory tests, and imaging studies demonstrating pulmonary infiltrates or cardiomegaly on chest x-ray or CT and reduced ejection fraction on echocardiography; and (3) a positive response to diuretic therapy, evidenced by the alleviation of symptoms following administration. The diagnosis of pneumonia was established based on clinical symptoms (e.g., fever, cough, purulent sputum), radiographic evidence of new pulmonary infiltrates on chest imaging. The diagnoses of CPE and pneumonia were rigorously established in accordance with prevailing international guidelines (9, 10), supplemented by a consensus from in-hospital senior specialists to ensure diagnostic accuracy in complex cases. Patients who met the criteria for CHF with CPE were enrolled in the CHF combined with CPE (CHF-CPE) group, those with significant acute pulmonary edema in both lungs accompanied by minor localized pulmonary inflammation could also be included in the CHF-CPE group after evaluation. CHF patients without pulmonary edema but presenting with dyspnea due to pneumonia, and in whom CPE episodes were ruled out, were assigned to the CHF combined with pneumonia (CHF-pneumonia) group. Cases concurrently exhibiting both conditions with indistinguishable disease severity were excluded.
Additionally, 30 patients with a documented history of CHF for more than 3 months who were in a non-heart failure exacerbation period (during routine physical examination or outpatient follow-up) were selected. Inclusion criteria: (1) NYHA functional class ≥II without apparent heart failure symptoms at the time of visit; (2) stable respiratory and circulatory function with no manifestations of dyspnea; (3) normal ranges of inflammatory markers and myocardial enzyme indicators in laboratory tests; (4) LUS showing no significant pulmonary exudative manifestations or only 1–2 B-lines (considered due to gravitational factors) at one or both lung bases. Exclusion criteria were the same as those for the observation group mentioned above.
2.2 Echocardiography
The ultrasound examination was performed using Philips EPIQ7 or Philips CX50 (Philips ultrasound diagnostic system, Netherlands), with a phased-array S5-1 probe (1–5 MHz) for cardiac ultrasound. The sonographers and image analysts were blinded to the clinical diagnoses. According to the guidelines Echocardiography (11), the following cardiac ultrasound parameters were measured: LV ejection fraction (LVEF), LV end-diastolic volume (LVEDV), RV diameter (RVD), right atrial diameter (RAD), tricuspid annular plane systolic excursion (TAPSE), mitral annular plane systolic excursion (MAPSE), tricuspid regurgitation velocity (TRV), pulmonary artery systolic pressure (PASP), peak systolic velocity of RV free wall tissue (RV-s'), early and late diastolic peak flow velocities of the mitral valve (E and A), and peak diastolic velocities of the mitral annulus at the septal and lateral walls (septal e′ and lateral e′). The E/A and E/e′ was also calculated.
In the apical four-chamber view, the left atrial area (LAA) was traced at end-diastole and end-systole, including the maximum LAA (LAAmax) and minimum LAA (LAAmin), to calculate the variation of LAA (LAA-V) using the formula: LAA-V = (LAAmax—LAAmin)/LAAmax. Due to the need for urgent treatment in patients with acute dyspnea, bedside ultrasound examination time was limited, making it impractical to measure LA volume. Based on our experience, using single-plane fractional area change may be meaningful.
The long-axis view of the inferior vena cava (IVC) was obtained in the subxiphoid sagittal plane. A segment of the IVC with significant respiratory variation, located 1–3 cm from the right atrial junction, was selected as the measurement site. The end-expiratory diameter of the IVC (IVCD) was measured, and the degree of IVC collapse during inspiration was observed to calculate the variation rate of the inferior vena cava (IVC-V) using the formula: IVC-V = (IVCD—IVCD at end-inspiration)/IVCD. For patients receiving non-invasive mechanical ventilation, measurements were taken after briefly discontinuing ventilatory support or reducing ventilator settings. The original ventilator parameters were immediately restored after obtaining stable ultrasound images to minimize the impact of mechanical ventilation on IVC measurements.
The velocity time integral (VTI) of both the LV outflow tract (LVOT) and RV outflow tract (RVOT) must be measured. Using color Doppler mode, blood flow from the LVOT toward the aorta and from the RVOT toward the pulmonary artery was visualized. The sample line was aligned with the direction of blood flow, and pulsed-wave Doppler mode was used to acquire images for measuring LVOT-VTI and RVOT-VTI, respectively. The diameter of the LVOT and RVOT was measured at the aortic valve annulus and pulmonary valve annulus, respectively. The fomula as follows (
Figure 2):
Cross-sectional area (CSA): CSA = π × (diameter/2)2.
Left ventricular stroke volume (LVSV): LVSV = (VTI × CSA) of LVOT.
Right ventricular stroke volume (RVSV): RVSV = (VTI × CSA) of RVOT.
The difference between RVSV and LVSV is expressed as Delta SV (ΔSV): ΔSV = RVSV—LVSV.
Figure 2
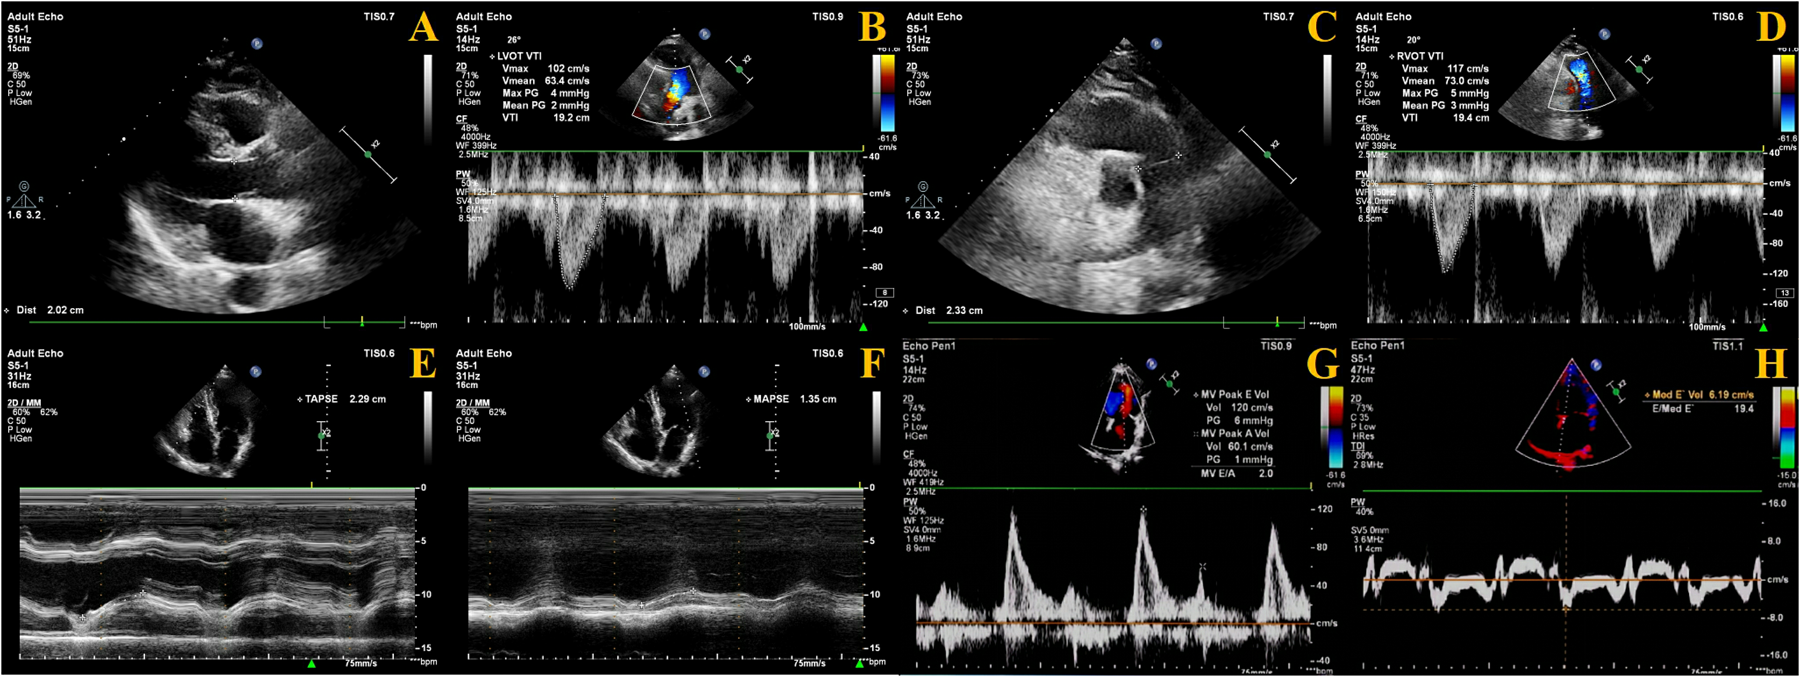
Measurement methods of echocardiography. (A) LVOT diameter measurement; (B) LVOT-VTI measurement; (C) ROVT diameter measurement; (D) RVOT-VTI measurement; (E) TAPSE measurement; (F) MAPSE measurement; (G) E velocity measurement; (H) Septal e′ measurement.
Regarding cardiac coupling ultrasound parameters, ΔSV represents the difference in stroke volume between the RV and LV per cardiac cycle. Based on the study by Zhang et al. (12), we selected TAPSE and MAPSE—parameters reflecting the longitudinal systolic function of the RV and LV, respectively—and calculated their ratio (TAPSE/MAPSE) (Figure 2).
2.3 LUS examination
In this study, LUS was performed using a convex C5-1 probe (1–5 MHz) for transthoracic pulmonary scanning. A 12-area scanning protocol was adopted: the anterior and lateral chest walls were examined in supine or sitting position, while the posterior chest was examined in sitting or lateral decubitus position. Using the parasternal line, anterior axillary line, posterior axillary line, and paravertebral line as vertical boundaries, and the nipple level as the horizontal boundary, the lung ultrasound zones were divided into upper and lower regions of the anterior chest, lateral chest, and posterior chest, totaling 12 areas.
Each lung area was scored based on sonographic patterns: (1) 0-point: A-lines or ≤2 B-lines, indicating normal aeration; (2) 1-point: ≥3 discrete, well-defined B-lines, suggesting interstitial edema at the interlobular septal level; (3) 2-point: confluent B-lines with blurred margins, indicating alveolar-interstitial edema; (4) 3-point: lung consolidation with air bronchograms or shred sign, with or without pleural effusion, suggesting extensive alveolar collapse and loss of ventilation. The LUS score was calculated by summing the scores from all 12 areas.
2.4 Other parameters evaluated
We collected demographic and clinical data for each patient, including age, gender, department of origin, oxygen delivery method, NYHA cardiac function classification, and major comorbidities. Vital signs during the ultrasound examination were recorded, comprising respiratory rate, heart rate, systolic blood pressure, diastolic blood pressure, fraction of inspired oxygen, and oxygen saturation.
2.5 Statistical analysis
Statistical analysis were performed using SPSS, version 21.0 software (IBM Corp., Armonk, NJ, USA). The normality of continuous variables was assessed using the Kolmogorov–Smirnov test. Normally distributed continuous variables were expressed as mean ± standard deviation (SD), with intergroup comparisons conducted using independent samples t-test for two groups and one-way analysis of variance (ANOVA) followed by LSD-t test for multiple comparisons among three groups. Non-normally distributed continuous variables were presented as median [interquartile range (IQR)], analyzed by Mann–Whitney U test for two-group comparisons and Kruskal–Wallis test for three-group comparisons. Categorical variables were expressed as [n (%)], with χ2 test employed for intergroup comparisons. Binary logistic regression analysis was performed with variables from the univariable analysis (P < 0.1) to identify independent influencing factors. The predictive value was evaluated using receiver operating characteristic (ROC) curve analysis. Correlation analysis was conducted using Spearman's method, with the absolute value of coefficient r interpreted as follows: very strong (0.8–1.0), strong (0.6–0.8), moderate (0.4–0.6), weak (0.2–0.4), and very weak or no correlation (0–0.2). A two-tailed P-value < 0.05 was considered to indicate statistical significance. Intraclass Correlation Coefficient (ICC) were calculated and classified as poor (ICC < 0.40), weak (ICC = 0.40–0.59), good (ICC = 0.60–0.74), and excellent (ICC = 0.75–1.00).
3 Results
3.1 Baseline characteristics of the study population
The study initially included 751 patients presenting with acute dyspnea who underwent both echocardiography and lung ultrasound examinations, among whom 196 met the diagnostic criteria for CHF and inclusion criteria; after excluding 63 cases (including 4 with CT-confirmed pulmonary tumors, 3 newly diagnosed acute myocardial infarction, 3 congenital structural heart disease, 3 coma with absent spontaneous respiration, 3 pulmonary interstitial fibrosis, 2 acute exacerbation of chronic obstructive pulmonary disease (COPD), 2 prior heart valve replacement, 1 sepsis-induced cardiac dysfunction, 1 dilated cardiomyopathy, 1 thoracic surgery history, 8 inadequate ultrasound images or incomplete records, 26 non CPE or pneumonia pulmonary diagnoses, 4 undetermined final diagnoses, and 2 duplicate enrollments) (Figure 1), the final analysis included 133 participants (77 males and 56 females), with an additional 30 subjects having CHF history without dyspnea selected from contemporaneous physical examinations or outpatient follow-ups were included in the CHF-control group (Table 1).
Table 1
| Parameter | CHF-CPE group (n = 58) | CHF-pneumonia group (n = 75) | CHF-control group (n = 30) | P-value |
|---|---|---|---|---|
| Age, years | 73.00 ((61.75, 77.50) | 72.00 (60.00, 81.00) | 68.00 (61.75, 75.50) | 0.291 |
| Male, n(%) | 29 (50.0%) | 48 (64.0%) | 17 (56.7%) | 0.267 |
| Department source, n(%) | <0.001 | |||
| Emergency/Intensive Care Unit | 8 (13.8%) | 12 (16.0%) | 0 (0) | |
| Cardiovascular medicine | 25 (43.1%) | 39 (52.0%) | 18 (60.0%) | |
| Respiratory medicine | 2 (3.4%) | 9 (12.0%) | 0 (0) | |
| Nephrology medicine | 15 (25.9%) | 13 (17.3%) | 2 (6.7%) | |
| Other internal or surgical medicine | 7 (12.1%) | 2 (2.7%) | 2 (6.7%) | |
| Other outpatient | 1 (1.7%) | 0 (0) | 8 (26.7%) | |
| Respiratory Support, n(%) | 0.682 | |||
| Spontaneous breath | 10 (17.2%) | 9 (12.0%) | – | |
| Nasal cannula/mask oxygen inhalation | 42 (72.4%) | 57 (76.0%) | – | |
| High flow oxygen therapy/mechanical ventilation | 6 (10.3%) | 9 (12.0%) | – | |
| New York Heart Association | <0.001 | |||
| Class II | 5 (8.6%) | 13 (17.3%) | 11 (36.7%) | |
| Class III | 28 (48.3%) | 29 (38.7%) | 19 (63.3%) | |
| Class IV | 25 (43.1%) | 33 (44.0%) | 0 (0) | |
| Comorbidities, n(%) | ||||
| Coronary heart disease | 43 (74.1%) | 50 (66.7%) | 21 (70.0%) | 0.648 |
| Hypertension | 41 (70.7%) | 47 (62.7%) | 21 (70.0%) | 0.573 |
| Chronic kidney disease | 21 (36.2%) | 20 (26.7%) | 5 (16.7%) | 0.143 |
| Cerebrovascular disease | 2 (3.4%) | 5 (6.7%) | 1 (3.3%) | 0.637 |
| Diabetes | 15 (25.9%) | 15 (20.0%) | 7 (23.3%) | 0.723 |
| Respiratory rate, times/min | 22.50 (21.00, 25.25) | 22.00 (21.00, 25.00) | 19.00 (18.00, 19.25)a,b | <0.001 |
| Heart rate, beats/min | 85.00 (74.00, 98.00) | 80.00 (72.00, 92.00) | 76.00 (62.50, 86.00)a,b | 0.011 |
| Systolic blood pressure, mm Hg | 134.43 ± 23.69 | 127.20 ± 20.09 | 130.27 ± 21.68 | 0.167 |
| Diastolic blood pressure, mm Hg | 76.64 ± 13.94 | 71.85 ± 12.33a | 74.17 ± 10.96 | 0.011 |
| Fraction of inspired oxygen | 0.29 (0.29, 0.33) | 0.29 (0.29, 0.33) | 0.21 (0.21, 0.21)a,b | <0.001 |
| Oxygen saturation, % | 96.00 (91.99, 98.00) | 96.34 (93.49, 98.00) | 98.75 (96.58, 99.00)a,b | <0.001 |
Basic clinical characteristics of research subjects.
P < 0.05, compared with CHF-CPE group.
P < 0.05, compared with CHF-pneumonia group.
3.2 Comparison of hemodynamic and echocardiographic parameters among the three groups
The CHF-CPE group demonstrated significantly higher values in IVCDmax, LAAmin, E velocity, E/A ratio, E/e′ ratio, TAPSE/MAPSE ratio, PASP, and ΔSV compared to both the CHF-pneumonia group and the CHF-control group (P < 0.05), while showing lower values in IVC-V, LAA-V, Septum e′, Lateral e′, and LVSV (P < 0.05). Additionally, the CHF-CPE group exhibited significantly lower MAPSE and LVOT-VTI values than the CHF-pneumonia group (P < 0.05). Compared to the CHF-control group, the CHF-CPE group had higher TRV but lower TAPSE/PASP ratio (P < 0.05). The CHF-pneumonia group showed significantly greater IVCDmax, TRV, and PASP values than the CHF-control group (P < 0.05). Furthermore, the CHF-CPE group had a significantly higher LUS score than the CHF-pneumonia group (P < 0.05). No statistically significant differences were observed in the remaining parameters among the groups (P > 0.05) (Table 2).
Table 2
| Parameter | CHF-CPE group (n = 58) | CHF-pneumonia group (n = 75) | CHF-control group (n = 30) | P-value |
|---|---|---|---|---|
| IVCDmax, mm | 20.84 ± 3.94 | 17.41 ± 4.22a | 15.38 ± 3.90a,b | <0.001 |
| IVC-V, % | 25.95 (19.97, 33.46) | 43.88 (31.62, 53.25)a | 44.17 (38.53, 56.81)a | <0.001 |
| LAD, mm | 44.00 (41.00, 47.00) | 43.00 (40.00, 47.00) | 45.50 (40.00, 48.00) | 0.687 |
| LAAmax, cm2 | 23.30 (20.30, 27.88) | 22.10 (19.30, 24.60) | 21.05 (19.28, 24.03) | 0.054 |
| LAAmin, cm2 | 18.60 (16.00,22.93) | 15.90 (13.20, 18.70)a | 14.20 (12.75, 17.63)a | <0.001 |
| LAA-V, % | 21.53 (15.73, 25.59) | 28.75 (22.07, 33.47)a | 30.14 (28.05, 33.59)a | <0.001 |
| LVEDV, mL | 132.50 (111.75, 161.75) | 124 (97.00, 154.00) | 124 (107.00, 154.00) | 0.570 |
| E, cm/s | 113.00 (96.00, 128.25) | 83.00 (69.00, 104.00)a | 70.00 (63.75, 90.25)a | <0.001 |
| A, cm/s | 70.00 (42.00, 101.00) | 67.00 (49.00, 93.00) | 60.00 (40.00, 85.25) | 0.453 |
| Septal e’, cm/s | 5.00 (3.98, 5.83) | 5.20 (4.60, 6.30)a | 5.95 (4.65, 7.00)a | 0.002 |
| Lateral e’, cm/s | 7.05 (6.00, 8.00) | 8.20 (7.00, 9.00)a | 8.35 (7.18, 9.95)a | <0.001 |
| E/A | 1.61 (1.14, 2.55) | 1.34 (0.78, 1.98)a | 1.27 (0.64, 2.13)a | 0.019 |
| E/e’ | 19.36 (16.81, 22.32) | 13.18 (10.80, 15.42) a | 10.16 (8.62, 12.94)a | <0.001 |
| LVEF, % | 46.00 (37.00, 59.25) | 47.00 (39.00, 59.00) | 48.00 (39.00, 59.00) | 0.925 |
| TAPSE, mm | 19.10 (16.28, 21.53) | 17.50 (15.50, 20.90) | 18.35 (15.60, 20.08) | 0.433 |
| MAPSE, mm | 9.40 (7.80,11.65) | 11.90 (9.10, 14.30)a | 10.45 (8.90, 13.80) | 0.005 |
| TAPSE/MAPSE | 1.94 (1.62, 2.37) | 1.58 (1.31, 1.86)a | 1.81 (1.37, 1.90)a | <0.001 |
| RV-s', cm/s | 12.65 (9.95, 15.00) | 11.30 (10.10, 14.10) | 12.15 (9.83, 14.23) | 0.712 |
| TRV, m/s | 3.00 (2.80, 3.30) | 2.80 (2.40, 3.30) | 2.45 (2.08, 2.80)a,b | 0.001 |
| PASP, mm Hg | 48.64 (39.36, 57.39) | 41.44 (31.04, 53.44)a | 31.60 (24.12, 39.36)a,b | <0.001 |
| LVOT-VTI, cm | 13.45 (10.88, 17.38) | 16.20 (13.40, 19.40)a | 14.15 (12.30, 20.33) | 0.004 |
| RVOT-VTI, cm | 14.25 (12.10, 19.10) | 15.00 (12.50, 17.90) | 13.85 (10.90, 18.98) | 0.604 |
| RVSV, mL | 70.17 (61.03, 85.82) | 69.18 (57.31, 82.75) | 65.46 (49.12, 85.99) | 0.529 |
| LVSV, mL | 53.07 (41.55, 63.78) | 65.08 (53.69, 75.07)a | 66.80 (52.07, 86.91)a | <0.001 |
| ΔSV, mL | 17.50 (10.29, 28.70) | 5.59 (−4.20, 13.50) a | −2.67 (−6.45, 5.15)a | <0.001 |
| LUS score, score | 14.00 (10.00, 18.00) | 10.00 (7.00, 14.00) | – | <0.001 |
Cardiopulmonary ultrasound indicators and cardiac coupled ultrasound indicators.
P < 0.05, compared with CHF-CPE group.
P < 0.05, compared with CHF-pneumonia group.
IVCD, inferior vena cava diameter; IVC-V, variation rate of inferior vena cava; LAD, left atrial diameter; LAA, left atrial area; LAA-V, variation of left atrial area; LVEDV, left ventricular end diastolic volume; E, early diastolic peak flow velocities of the mitral valve; A, late diastolic peak flow velocities of the mitral valve; e′, peak diastolic velocities of the mitral annulus; LVEF, left ventricular ejection fraction; TAPSE, tricuspid annular plane systolic excursion; MAPSE, mitral annular plane systolic excursion; RV-s’, right ventricular s’; TRV, tricuspid regurgitation velocity; PASP, pulmonary artery systolic pressure; LVOT-VTI, left ventricular outflow tract velocity time integral; RVOT-VTI, right ventricular outflow tract velocity time integral; RVSV, right ventricular stroke volume; LVSV, left ventricular stroke volume; ΔSV, The difference value between right ventricular stroke volume and left ventricular stroke volume; LUS, lung ultrasound.
3.3 Area under the ROC curve
3.3.1 Comparisons between the CHF-CPE and CHF-pneumonia groups
In cardiac coupling ultrasound parameters, ΔSV demonstrated the highest diagnostic performance with an area under the ROC curve (AUC) of 0.772 (95% CI: 0.691–0.853), sensitivity of 67.24%, and specificity of 78.67%. TAPSE/MAPSE showed an AUC of 0.724 (95% CI: 0.638–0.810), with sensitivity of 53.45% and specificity of 82.67% (Figures 3A,B and Table 3). In other single parameters, E/e′ showed an AUC of 0.901 (95% CI: 0.850–0.952), sensitivity of 84.48%, and specificity of 84.00%. LAA-V demonstrated an AUC of 0.759 (95% CI: 0.680–0.839), sensitivity of 50.67%, and specificity of 91.38%.
Figure 3
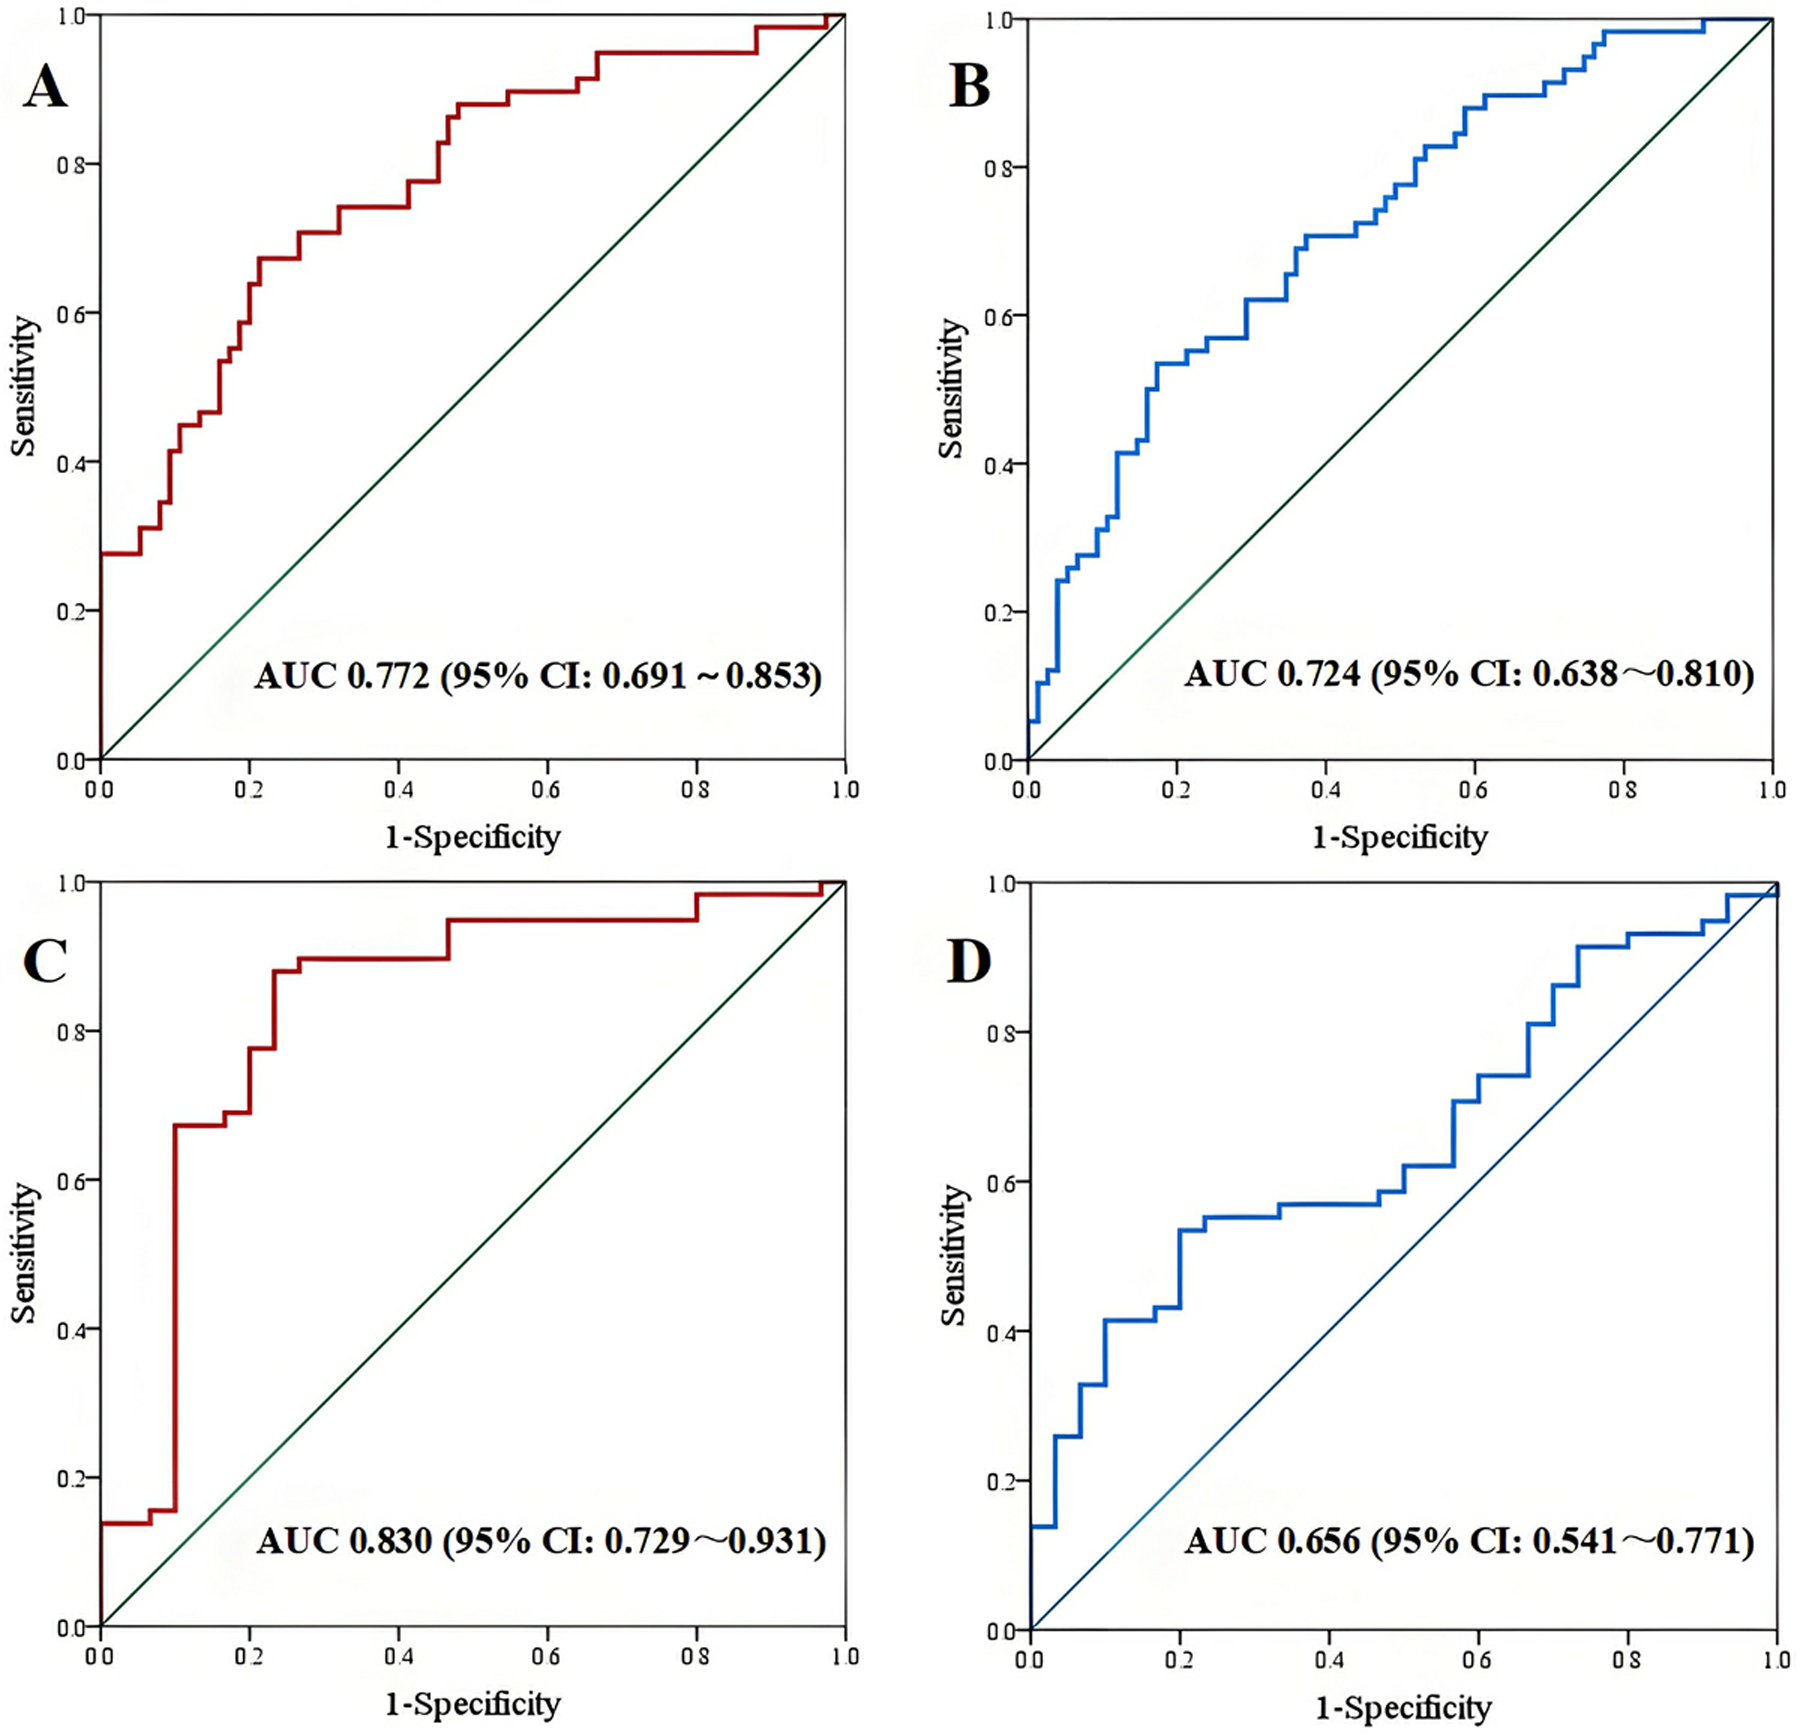
ROC curve. (A,B) AUC of ΔSV and TAPSE/MAPSE between CHF-CPE group and CHF-pneumonia group; (C,D) AUC of ΔSV and TAPSE/MAPSE between CHF-CPE group and CHF-control group.
Table 3
| Parameter | Cut-off value | Sensitivity | Specificity | Yoden index | AUC | 95% CI | P-value |
|---|---|---|---|---|---|---|---|
| ΔSV (mL) | 14.129 | 67.24 | 78.67 | 0.459 | 0.772 | 0.691–0.853 | <0.001 |
| TAPSE/MAPSE | 1.930 | 53.45 | 82.67 | 0.361 | 0.724 | 0.638–0.810 | <0.001 |
| E/e’ | 15.980 | 84.48 | 84.00 | 0.698 | 0.901 | 0.850–0.952 | <0.001 |
| LAA-V (%) | 28.696 | 50.67 | 91.38 | 0.421 | 0.759 | 0.680–0.839 | <0.001 |
| LUS score (score) | 13.500 | 62.07 | 74.67 | 0.368 | 0.734 | 0.650–0.818 | <0.001 |
Diagnostic efficacy of ROC curve between CHF-CPE group and CHF-pneumonia group.
ΔSV, The difference value between right ventricular stroke volume and left ventricular stroke volume; TAPSE/MAPSE, the ratio of tricuspid annular plane systolic excursion to mitral annular plane systolic excursion; E/e’, the ratio of early diastolic peak flow velocities of the mitral valve to peak diastolic velocities of the mitral annulus at septal and lateral; LAA-V, variation of left atrial area; LUS, lung ultrasound.
3.3.2 Comparisons between the CHF-CPE and CHF-control groups
In cardiac coupling parameters, ΔSV showed superior diagnostic performance with an AUC of 0.830 (95% CI: 0.729–0.931), sensitivity of 87.93%, and specificity of 76.67%. The TAPSE/MAPSE showed an AUC of 0.656 (95% CI: 0.541–0.771), sensitivity of 53.45%, and specificity of 80.00% (Figures 3C,D and Table 4). In other single parameters, E/e' showed an AUC of 0.918 (95% CI: 0.842–0.994), sensitivity of 96.55%, and specificity of 80.00%. LAA-V showed an AUC of 0.900 (95% CI: 0.835–0.964), sensitivity of 93.33%, and specificity of 72.41%.
Table 4
| Parameter | Cut-off value | Sensitivity | Specificity | Yoden index | AUC | 95% CI | P-value |
|---|---|---|---|---|---|---|---|
| ΔSV (mL) | 5.039 | 87.93 | 76.67 | 0.646 | 0.830 | 0.729–0.931 | <0.001 |
| TAPSE/MAPSE | 1.917 | 53.45 | 80.00 | 0.334 | 0.656 | 0.541–0.771 | 0.017 |
| E/e’ | 13.043 | 96.55 | 80.00 | 0.766 | 0.918 | 0.842–0.994 | <0.001 |
| LAA-V (%) | 24.565 | 93.33 | 72.41 | 0.657 | 0.900 | 0.835–0.964 | <0.001 |
Diagnostic efficacy of ROC curve between CHF-CPE group and CHF-control group.
SV, The difference value between right ventricular stroke volume and left ventricular stroke volume; TAPSE/MAPSE, the ratio of tricuspid annular plane systolic excursion to mitral annular plane systolic excursion; E/e′, the ratio of early diastolic peak flow velocities of the mitral valve to peak diastolic velocities of the mitral annulus at septal and lateral; LAA-V, variation of left atrial area; LUS, lung ultrasound.
3.4 Univariate and multivariable logistic regression analysis
3.4.1 Comparisons between the CHF-CPE and CHF-pneumonia groups
The multivariable logistic regression analysis revealed that ΔSV (OR: 1.076, 95% CI: 1.019–1.137, P = 0.008), E/e’ (OR: 1.663, 95% CI: 1.301–2.125, P < 0.001), LAA-V (OR: 0.837, 95% CI: 0.741–0.944, P = 0.004), and IVC-V (OR: 0.935, 95% CI: 0.888–0.985, P = 0.012) were independent risk factors for CPE in CHF patients (Table 5).
Table 5
| Factors | Univariate analysis | Multivariate analysis | ||||
|---|---|---|---|---|---|---|
| Odds Ratio | 95%CI | P-value | Odds Ratio | 95%CI | P-value | |
| IVCD | 1.231 | 1.116–1.359 | <0.001 | |||
| IVC-V | 0.925 | 0.897–0.954 | <0.001 | 0.935 | 0.888–0.985 | 0.012 |
| LAAmin | 1.101 | 1.023–1.185 | 0.011 | |||
| LAA-V | 0.860 | 0.808–0.915 | <0.001 | 0.837 | 0.741–0.944 | 0.004 |
| E/A | 1.809 | 1.198–2.733 | 0.005 | |||
| E/e’ | 1.667 | 1.400–1.984 | <0.001 | 1.663 | 1.301–2.125 | <0.001 |
| TAPSE/MAPSE | 6.114 | 2.589–14.435 | <0.001 | |||
| LVSV | 0.961 | 0.940–0.983 | 0.001 | |||
| ΔSV | 1.081 | 1.046–1.117 | <0.001 | 1.076 | 1.019–1.137 | 0.008 |
| LUS score | 1.218 | 1.116–1.330 | <0.001 | |||
Univariate and multivariable logistic regression analysis between CHF-CPE group and CHF-pneumonia group.
IVCD, inferior vena cava diameter; IVC-V, variation rate of inferior vena cava; LAD, left atrial diameter; LAAmin, minimum left atrial area; LAA-V, variation of left atrial area; E/A, the ratio of early diastolic peak flow velocities of the mitral valve to late diastolic peak flow velocities of the mitral valve; E/e′, the ratio of early diastolic peak flow velocities of the mitral valve to peak diastolic velocities of the mitral annulus at septal and lateral; TAPSE/MAPSE, the ratio of tricuspid annular plane systolic excursion to mitral annular plane systolic excursion; LVSV, left ventricular stroke volume; ΔSV, The difference value between right ventricular stroke volume and left ventricular stroke volume; LUS, lung ultrasound.
3.4.2 Comparisons between the CHF-CPE and CHF-control groups
The multivariable regression analysis demonstrated that ΔSV (OR: 1.066, 95% CI: 1.007–1.129, P = 0.027), E/e′ (OR: 1.475, 95% CI: 1.161–1.874, P = 0.001), and LAA-V (OR: 0.773, 95% CI: 0.635–0.941, P = 0.010) were independently associated with CPE in CHF patients (Table 6).
Table 6
| Factors | Univariate analysis | Multivariate analysis | ||||
|---|---|---|---|---|---|---|
| Odds Ratio | 95%CI | P-value | Odds Ratio | 95%CI | P-value | |
| IVCD | 1.421 | 1.218–1.658 | <0.001 | |||
| IVC-V | 0.888 | 0.845–0.934 | <0.001 | |||
| LAAmin | 1.233 | 1.083–1.404 | 0.002 | |||
| LAA-V | 0.710 | 0.608–0.829 | <0.001 | 0.773 | 0.635–0.941 | 0.010 |
| E/e’ | 1.659 | 1.353–2.035 | <0.001 | 1.475 | 1.161–1.874 | 0.001 |
| TAPSE/MAPSE | 4.277 | 1.356–13.488 | 0.013 | |||
| LVSV | 0.966 | 0.944–0.989 | 0.004 | |||
| ΔSV | 1.085 | 1.043–1.129 | <0.001 | 1.066 | 1.007–1.129 | 0.027 |
| TAPSE/PASP | 0.018 | 0.002–0.223 | 0.002 | |||
Univariate and multivariable logistic regression analysis between CHF-CPE group and CHF-control group.
IVCD, inferior vena cava diameter; IVC-V, variation rate of inferior vena cava; LAD, left atrial diameter; LAAmin, minimum left atrial area; LAA-V, variation of left atrial area; E/A, the ratio of early diastolic peak flow velocities of the mitral valve to late diastolic peak flow velocities of the mitral valve; E/e′, the ratio of early diastolic peak flow velocities of the mitral valve to peak diastolic velocities of the mitral annulus at septal and lateral; TAPSE/MAPSE, the ratio of tricuspid annular plane systolic excursion to mitral annular plane systolic excursion; LVSV, left ventricular stroke volume; ΔSV, The difference value between right ventricular stroke volume and left ventricular stroke volume; LUS, lung ultrasound.
3.5 Correlation analysis
Correlation analysis demonstrated a moderate positive correlation between △SV and E/e′ (r = 0.435, P < 0.001), while TAPSE/MAPSE showed a weak positive correlation with E/e′ (r = 0.399, P < 0.001) (Figure 4).
Figure 4
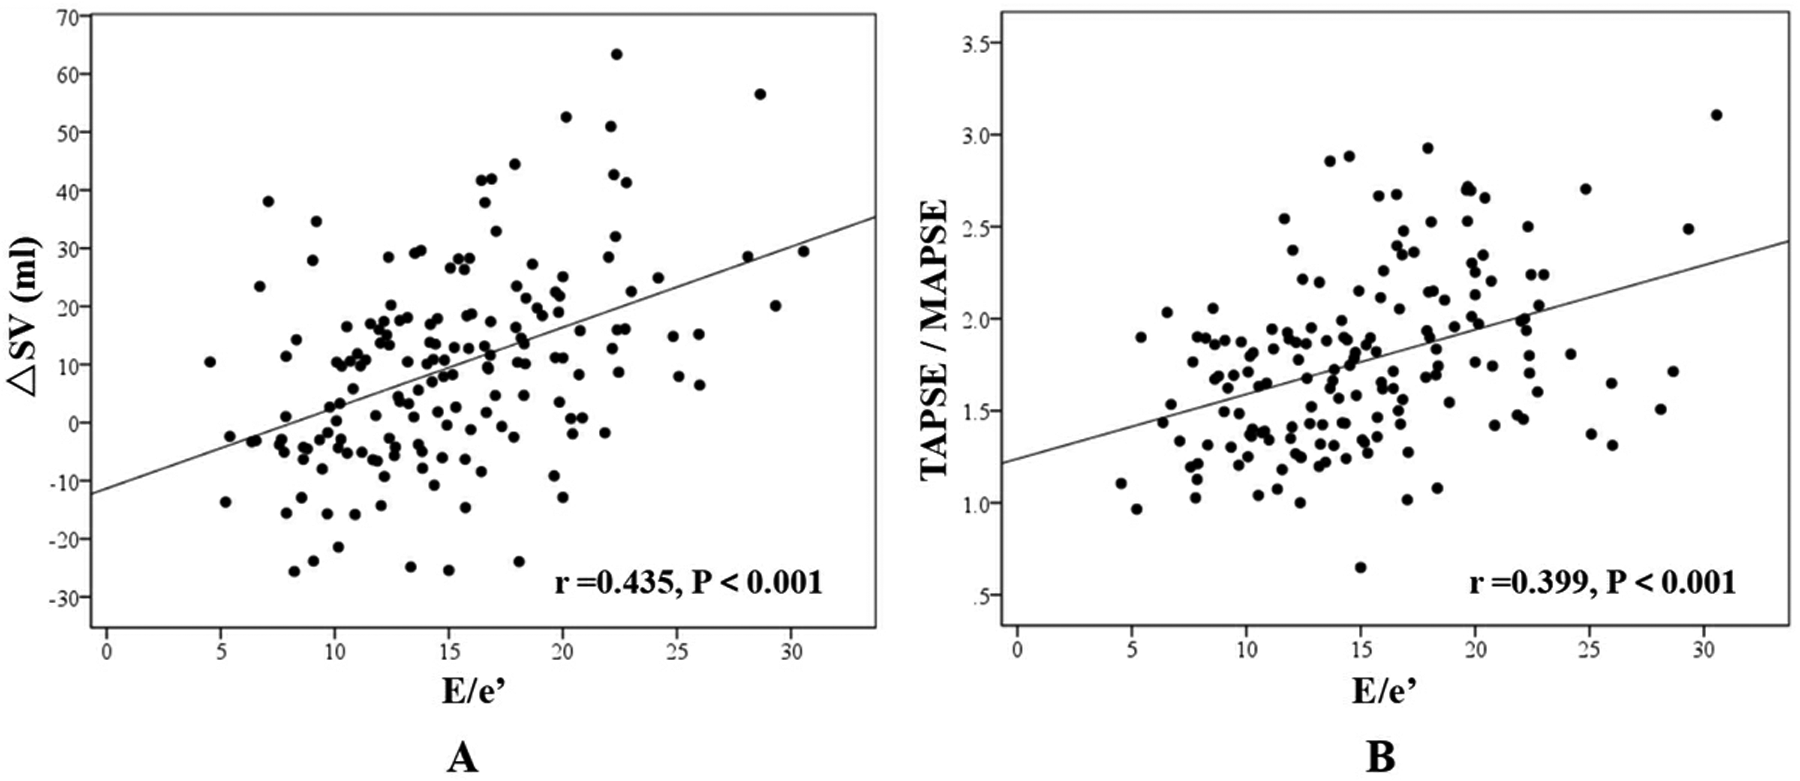
Correlation analysis. (A) The correlation between ΔSV and E/e′; (B) The correlation between TAPSE/MAPSE and E/e′.
3.6 Repeatability test in intra- and inter-researcher
The study showed an excellent consistency of LVOT-VTI, RVOT-VTI, LVSV and RVSV in intra-researcher (ICC = 0.981, 0.929, 0.934 and 0.924, P < 0.001), and an excellent consistency of LVOT-VTI, RVOT-VTI, LVSV and RVSV in inter-researchers between the two ultrasound physician (ICC = 0.889, 0.860, 0.906 and 0.878, P < 0.001) (Table 7).
Table 7
| Factors | LVOT-VTI | RVOT-VTI | LVSV | RVSV |
|---|---|---|---|---|
| intra-researcher n = 17 | 0.981 (0.949–0.993) | 0.929 (0.818–0.973) | 0.934 (0.831–0.975) | 0.924 (0.808–0.972) |
| P < 0.001 | P < 0.001 | Pv0.001 | P < 0.001 | |
| inter-researchers n = 17 | 0.889 (0.709–0.959) | 0.860 (0.663–0.946) | 0.906 (0.756–0.965) | 0.878 (0.703–0.954) |
| P < 0.001 | P < 0.001 | P < 0.001 | P < 0.001 |
Repeatability test in intra-researcher and inter-researchers (ICC).
ICC, Intraclass Correlation Coefficient.
4 Discussion
CPE is the primary cause of acute dyspnea leading to hospitalization in CHF patients due to worsening cardiac function. However, long-term CHF patients may also develop pneumonia, which was not uncommon during the COVID-19 pandemic. CHF patients with pneumonia may exhibit an enlarged left heart and reduced LV function (including both systolic and diastolic dysfunction) on ultrasound, along with B-lines in unilateral or bilateral lung tissue on LUS. A history of CHF and typical ultrasound findings may mislead physicians to attribute B-lines to CPE, thereby prompting a decision to administer dehydration therapy. The essence of B-lines in LUS is pulmonary interstitial pathology, which can occur in pulmonary edema, pneumonia, alveolar hemorrhage, or pulmonary fibrosis. When using LUS to differentiate between CPE and pneumonia, the distribution pattern of B-lines is often key: CPE typically presents with diffuse B-lines in both lungs, whereas pneumonia manifests as irregular unilateral or bilateral focal B-line patterns. However, accurate differentiation becomes challenging when pneumonia diffusely involves the entire lung. In such cases, cardiac ultrasound plays a crucial diagnostic role.
Our study found that the CHF-CPE group exhibited significant differences in multiple cardiac ultrasound parameters compared to both the pneumonia and control groups, with the primary distinctions lying in left heart indicators. This observation aligns with previous studies (13, 14), which reported that patients with heart failure-induced pulmonary edema typically present with an enlarged left ventricle and impaired LV function. The contribution of E/e′ to extravascular lung water accumulation was greater than that of LVEF, a finding also supported by prior studies on mechanical ventilation weaning (4, 5). Elevated E/e′ levels are associated with higher LV filling pressures, reflecting reduced tolerance to fluid overload within the cardiopulmonary circulation.
Hemodynamically induced pulmonary edema is typically described as resulting from increasing LV filling pressures due to LV failure, leading to elevated pulmonary capillary hydrostatic pressure and subsequent fluid extravasation into the pulmonary interstitium. LV end-diastolic pressure (LVEDP) is generally considered the determinant of left atrial pressure and pulmonary venous pressure, which further governs pulmonary capillary pressure, ultimately contributing to acute pulmonary edema. However, isolated LV failure and elevated LV filling pressures alone do not entirely dictate the development of pulmonary edema. Clinically, we have observed that some patients with severe LV dysfunction exhibit no pulmonary fluid accumulation, whereas others with seemingly milder LV impairment (e.g., heart failure with preserved ejection fraction, HFpEF) present with significant pulmonary congestion. This phenomenon suggests that the development of pulmonary edema depends not only on LV pressure but also on sufficient SV from the RV, which serves as another critical factor (15). If the SV generated by RV contraction cannot be fully accommodated by the left atrium, excess fluid accumulates in the pulmonary circulation and interstitium (16). Conversely, impaired RV function is associated with worse clinical outcomes in CHF patients (17).
In the physiological state, the SV of RV and LV are maintained in balance through the Frank-Starling mechanism, ensuring pulmonary circulation homeostasis (6). For patients with pulmonary edema exhibiting an imbalance between RVSV and LVSV, hemodynamic monitoring is essential (18). Conventional imaging modalities for assessing RVSV and LVSV include computed tomography (CT) and magnetic resonance imaging (MRI) (19, 20). However, these techniques are costly and inconvenient, requiring patient transport to imaging departments—a particular challenge for CHF patients experiencing dyspnea. Given the safety and convenience of ultrasound technology, we should focus on the disparity between RV and LV parameters, which may better indicate the risk of pulmonary edema in CHF patients presenting with respiratory distress.
In this study, the CHF-CPE group demonstrated significantly higher E/e' ratios and lower LVOT-VTI and LVSV values (P < 0.05), while no statistically significant differences in LVEF were observed among the three groups (P > 0.05). These findings suggest that LV function, particularly impaired diastolic function and reduced SV, plays a crucial role in the development of pulmonary edema. In contrast, LVEF, which reflects the percentage of LV contraction and myocardial systolic performance, showed no significant correlation with pulmonary edema formation. Regarding RV parameters, echocardiographic indices including TAPSE, RV-s', RVOT-VTI, and RVSV showed no statistically significant differences among the groups (P > 0.05). This indicates that CHF patients with concurrent CPE maintain relatively preserved RV function, which can result in a mismatch between the right and left heart when LV function is reduced. Furthermore, elevated E/e′ ratios, typically indicative of increased LV filling pressure, may depend on adequate SV provision by the RV (21).
In this study, we employed echocardiography to quantify the SV difference between the RV and LV. The VTI and outflow tract cross-sectional area were measured at both the RVOT and LVOT to calculate respective SV. The ROC analysis revealed that the ΔSV difference demonstrated discriminative value between CHF-CPE and CHF-pneumonia groups, with an AUC of 0.772. Multivariate analysis identified this parameter as an independent predictor for CPE development in CHF patients (OR = 1.076, P = 0.008). Similarly, the ΔSV difference showed stronger discriminatory power between CHF-CPE and CHF-control groups (AUC = 0.830). This measure remained an independent risk factor for CPE (OR = 1.066, P = 0.027). These findings align with established hemodynamic theories regarding acute pulmonary edema development in heart failure patients (6, 15).
We introduced the TAPSE/MAPSE ratio as a novel indicator to assess the differential contractile function between the right and left ventricles. TAPSE and MAPSE represent the longitudinal displacement of the RV and LV free walls, respectively. In our cohort, the TAPSE/MAPSE demonstrated discriminative capacity between CHF-CPE and CHF-pneumonia groups, yielding an AUC of 0.724. When comparing CHF-CPE with CHF-control groups, the ratio showed an AUC of 0.656. In clinical practice, we often employ qualitative “eye-balling” assessments during echocardiography. Notably, we observed that some pulmonary edema patients exhibited more pronounced longitudinal motion in the RV free walls compared to the LV free walls, particularly in the apical four-chamber view. The TAPSE/MAPSE ratio provides quantitative validation of these visual observations. These findings align with the results reported by Zhang et al. (12), who demonstrated that TAPSE/MAPSE achieved an AUC of 0.761 (sensitivity 62.8%, specificity 77.9%) for predicting CPE in ICU patients. The key distinction of our study lies in its exclusive focus on CHF patients, whereas Zhang's cohort included ICU admissions that potentially comprised cases without underlying cardiac pathology or chronic ventricular dysfunction.
Correlation analysis revealed significant positive associations between both ΔSV and TAPSE/MAPSE ratio with E/e′ across all CHF cases (r = 0.435 and 0.399 respectively, P < 0.001). E/e′, as a surrogate marker of LV filling pressure, demonstrated strong correlation with pulmonary edema development. Additionally, we introduced a novel echocardiographic parameter, LAA-V (left atrial area variation), which was significantly reduced in the CHF-CPE group. Measured in the apical four-chamber view, LAA-V quantifies the percentage change in left atrial area from maximal to minimal dimensions during the cardiac cycle, reflecting the efficiency of atrial emptying into the LV. Lower LAA-V values correlated with greater pulmonary venous congestion. While left atrial volume variation might provide more comprehensive assessment, our study faced technical challenges in obtaining optimal image quality, particularly in the apical two-chamber view, due to: (1) suboptimal echocardiographic windows in acutely dyspneic CHF patients, and (2) Time constraints imposed by urgent clinical management. We recommend future investigations to evaluate left atrial volume variation parameters for more precise hemodynamic assessment.
LUS demonstrates significant diagnostic value in differentiating CPE from pneumonia (22, 23). Characteristic sonographic findings reveal distinct patterns: CPE typically presents with bilateral, symmetrical B-lines (24), whereas pneumonia manifests as focal/multifocal B-lines with concomitant consolidation (25). When evaluating acute dyspnea, echocardiography provides crucial complementary information—the detection of LV dysfunction strongly suggests CPE (26–28). However, diagnostic challenges arise in CHF patients due to pre-existing cardiac remodeling (including ventricular dilation and systolic dysfunction). While LUS score effectively quantifies pulmonary deaeration, it shows limited specificity for distinguishing CPE from pneumonia. In our study, although the CPE group exhibited higher LUS scores than the pneumonia group, this parameter failed to emerge as an independent predictor. This likely reflects distinct distribution patterns: (1) CPE patients predominantly showed diffuse 1–2 point scores across all 12 lung areas. (2) Pneumonia patients typically presented with minimal B-lines or normal A-lines (0 points) in anterior areas of chest, and consolidation and/or pleural effusion (3 points) in gravity-dependent regions. Notably, pneumonia patients demonstrated considerable interindividual variability in scoring. Our findings underscore that integrated cardio-pulmonary ultrasound (combining echocardiography with LUS) provides superior diagnostic performance for respiratory differentiation in this population.
5 Limitations
First, this is a single-centre, retrospective, observational study, and therefore the results cannot be generalised beyond the background of the research. It is important to acknowledge that the findings may be influenced by retrospective bias, an inherent limitation of the retrospective design. Furthermore, The study cohort was recruited from diverse clinical departments, including emergency medicine, intensive care, as well as general wards (e.g., cardiology and respiratory departments) managing patients with acute-onset dyspnea. Although all diagnoses were confirmed by board-certified intensivists and cardiologists, potential interdepartmental variations in disease severity and management should not be overlooked. Third, a subset of patients had already received mechanical ventilation upon emergency department admission. Although ventilator settings were maintained at minimal supportive parameters during ultrasound examinations, the interaction between mechanical ventilation and strong spontaneous respiratory efforts may have influenced cardiopulmonary ultrasound measurements. Finally, the sample size in our study was limited, particularly in the control group. This limitation underscores the necessity for future large-scale prospective research to validate the efficacy of this technology.
6 Conclusion
In patients with CHF, echocardiography may aid in differentiating between CPE and pneumonia. Our retrospective study suggests that the difference between RVSV and LVSV provides modest but significant discriminative capacity. However, these findings, potentially influenced by the sample size, require prospective multicenter validation before this parameter can be considered for guiding clinical decision-making to mitigate the risks of misdiagnosis.
Statements
Data availability statement
The original contributions presented in the study are included in the article/Supplementary Material, further inquiries can be directed to the corresponding author.
Ethics statement
The studies involving humans were approved by Ethics Committee of Hebei General Hospital. The studies were conducted in accordance with the local legislation and institutional requirements. The participants provided their written informed consent to participate in this study.
Author contributions
YaY: Data curation, Resources, Visualization, Writing – original draft, Writing – review & editing. HaZ: Data curation, Supervision, Visualization, Writing – original draft, Writing – review & editing. JH: Data curation, Visualization, Writing – review & editing. LL: Methodology, Visualization, Writing – review & editing. HeZ: Methodology, Supervision, Writing – original draft. YuY: Methodology, Visualization, Writing – review & editing.
Funding
The author(s) declare that no financial support was received for the research and/or publication of this article.
Conflict of interest
The authors declare that the research was conducted in the absence of any commercial or financial relationships that could be construed as a potential conflict of interest.
Generative AI statement
The author(s) declare that no Generative AI was used in the creation of this manuscript.
Any alternative text (alt text) provided alongside figures in this article has been generated by Frontiers with the support of artificial intelligence and reasonable efforts have been made to ensure accuracy, including review by the authors wherever possible. If you identify any issues, please contact us.
Publisher’s note
All claims expressed in this article are solely those of the authors and do not necessarily represent those of their affiliated organizations, or those of the publisher, the editors and the reviewers. Any product that may be evaluated in this article, or claim that may be made by its manufacturer, is not guaranteed or endorsed by the publisher.
Supplementary material
The Supplementary Material for this article can be found online at: https://www.frontiersin.org/articles/10.3389/fcvm.2025.1693941/full#supplementary-material
References
1.
Virani SS Alonso A Benjamin EJ Bittencourt MS Callaway CW Carson AP et al Heart disease and stroke statistics-2020 update: a report from the American Heart Association. Circulation. (2020) 141(9):e139–596.10.1161/CIR.0000000000000757
2.
MacIver DH Dayer MJ . An alternative approach to understanding the pathophysiological mechanisms of chronic heart failure. Int J Cardiol. (2012) 154(2):102–10. 10.1016/j.ijcard.2011.05.075
3.
Sasmita BR Zhao Y Gong M Luo S Huang B . Edema index predicts mortality in patients with chronic heart failure: a prospective, observational study. Glob Heart. (2024) 19(1):5. 10.5334/gh.1287
4.
Roche-Campo F Bedet A Vivier E Brochard L Mekontso Dessap A . Cardiac function during weaning failure: the role of diastolic dysfunction. Ann Intensive Care. (2018) 8(1):2. 10.1186/s13613-017-0348-4
5.
Moschietto S Doyen D Grech L Dellamonica J Hyvernat H Bernardin G . Transthoracic echocardiography with Doppler tissue imaging predicts weaning failure from mechanical ventilation: evolution of the left ventricle relaxation rate during a spontaneous breathing trial is the key factor in weaning outcome. Crit Care. (2012) 16(3):R81. 10.1186/cc11339
6.
MacIver DH Clark AL . The vital role of the right ventricle in the pathogenesis of acute pulmonary edema. Am J Cardiol. (2015) 115(7):992–1000. 10.1016/j.amjcard.2015.01.026
7.
Shafazand M Patel H Ekman I Swedberg K Schaufelberger M . Patients with worsening chronic heart failure who present to a hospital emergency department require hospital care. BMC Res Notes. (2012) 5:132. 10.1186/1756-0500-5-132
8.
Gomes FKA Fagundes AAP Jr. Amorim FF . Cardiac output and stroke volume assessments by transthoracic echocardiography and pulse index continuous cardiac output monitor in critically ill adult patients: a comparative study. J Intensive Care Med. (2024) 39(4):341–8. 10.1177/08850666231204787
9.
McDonagh TA Metra M Adamo M Gardner RS Baumbach A Böhm M et al 2021 ESC guidelines for the diagnosis and treatment of acute and chronic heart failure. Eur Heart J. (2021) 42(36):3599–726. 10.1093/eurheartj/ehab368
10.
Metlay JP Waterer GW Long AC Anzueto A Brozek J Crothers K et al Diagnosis and treatment of adults with community-acquired pneumonia. An official clinical practice guideline of the American thoracic society and Infectious Diseases Society of America. Am J Respir Crit Care Med. (2019) 200(7):e45–67. 10.1164/rccm.201908-1581ST
11.
Lang RM Badano LP Mor-Avi V Afilalo J Armstrong A Ernande L et al Recommendations for cardiac chamber quantification by chocardiography in adults: an update from the American society of echocardiography and the European association of cardiovascular imaging. J Am Soc Echocardiogr. (2015) 28(1):1–39.e14. 10.1016/j.echo.2014.10.003
12.
Zhang H Lian H Wang X Zhang Q Liu D . Tricuspid annular plane systolic excursion/mitral annular plane systolic excursion ratio in critically ill patients: an index of right- and left-ventricular function mismatch and a risk factor for cardiogenic pulmonary edema. BMC Anesthesiol. (2023) 23(1):175. 10.1186/s12871-023-02142-9
13.
Picano E Pellikka PA . Ultrasound of extravascular lung water: a new standard for pulmonary congestion. Eur Heart J. (2016) 37(27):2097–104. 10.1093/eurheartj/ehw164
14.
Martindale JL Wakai A Collins SP Levy PD Diercks D Hiestand BC et al Diagnosing acute heart failure in the emergency department: a systematic review and meta-analysis. Acad Emerg Med. (2016) 23(3):223–42. 10.1111/acem.12878
15.
MacIver DH Dayer MJ Harrison AJ . A general theory of acute and chronic heart failure. Int J Cardiol. (2013) 165(1):25–34. 10.1016/j.ijcard.2012.03.093
16.
Figueras J Weil MH . Blood volume prior to and following treatment of acute cardiogenic pulmonary edema. Circulation. (1978) 57(2):349–55. 10.1161/01.cir.57.2.349
17.
Gavazzi A Berzuini C Campana C Inserra C Ponzetta M Sebastiani R et al Value of right ventricular ejection fraction in predicting short-term prognosis of patients with severe chronic heart failure. J Heart Lung Transplant. (1997) 16(7):774–85.
18.
Yamamoto M Ishizu T Seo Y Nakagawa D Sato K Kawamatsu N et al Pathophysiological role of right ventricular function and interventricular functional mismatch in the development of pulmonary edema in acute heart failure. J Cardiol. (2022) 79(6):711–8. 10.1016/j.jjcc.2021.11.021
19.
Reiter SJ Rumberger JA Feiring AJ Stanford W Marcus ML . Precision of measurements of right and left ventricular volume by cine computed tomography. Circulation. (1986) 74(4):890–900. 10.1161/01.cir.74.4.890
20.
Jeltsch M Ranft S Klass O Aschoff AJ Hoffmann MH . Evaluation of accordance of magnetic resonance volumetric and flow measurements in determining ventricular stroke volume in cardiac patients. Acta Radiol. (2008) 49(5):530–9. 10.1080/02841850801998847
21.
Jani V Konecny F Shelby A Kulkarni A Hammel J Schuster A et al Influence of right ventricular pressure and volume overload on right and left ventricular diastolic function. J Thorac Cardiovasc Surg. (2022) 163(4):e299–308. 10.1016/j.jtcvs.2021.07.040
22.
Beshara M Bittner EA Goffi A Berra L Chang MG . Nuts and bolts of lung ultrasound: utility, scanning techniques, protocols, and findings in common pathologies. Crit Care. (2024) 28(1):328. 10.1186/s13054-024-05102-y
23.
Heldeweg MLA Smit MR Kramer-Elliott SR Haaksma ME Smit JM Hagens LA et al Lung ultrasound signs to diagnose and discriminate interstitial syndromes in ICU patients: a diagnostic accuracy study in two cohorts. Crit Care Med. (2022) 50(11):1607–17. 10.1097/CCM.0000000000005620
24.
Assaad S Kratzert WB Shelley B Friedman MB Perrino A . Assessment of pulmonary edema: principles and practice. J Cardiothorac Vasc Anesth. (2018) 32(2):901–14. 10.1053/j.jvca.2017.08.028
25.
Lichtenstein DA . BLUE-protocol and FALLS-protocol: two applications of lung ultrasound in the critically ill. Chest. (2015) 147(6):1659–70. 10.1378/chest.14-1313
26.
Wang XT Liu DW Zhang HM Chai WZ . Integrated cardiopulmonary sonography: a useful tool for assessment of acute pulmonary edema in the intensive care unit. J Ultrasound Med. (2014) 33(7):1231–9. 10.7863/ultra.33.7.1231
27.
Pivetta E Goffi A Nazerian P Castagno D Tozzetti C Tizzani P et al Lung ultrasound integrated with clinical assessment for the diagnosis of acute decompensated heart failure in the emergency department: a randomized controlled trial. Eur J Heart Fail. (2019) 21(6):754–66. 10.1002/ejhf.1379
28.
Pivetta E Gof A Lupia E Tizzani M Porrino G Ferreri E et al Lung ultrasound-implemented diagnosis of acute decompensated heart failure in the ED: a SIMEU multicenter study. Chest. (2015) 148(1):202–10. 10.1378/chest.14-2608
Summary
Keywords
cardiogenic pulmonary edema, chronic heart failure, stroke volume, lung ultrasound, echocardiography
Citation
Yan Y, Zhao H, He J, Li L, Zhao H and Ye Y (2025) Comparison of the right–left ventricular stroke volume difference evaluated by echocardiography in patients with chronic heart failure complicated with cardiogenic pulmonary edema and pneumonia. Front. Cardiovasc. Med. 12:1693941. doi: 10.3389/fcvm.2025.1693941
Received
27 August 2025
Revised
05 October 2025
Accepted
24 November 2025
Published
05 December 2025
Volume
12 - 2025
Edited by
Stefano Albani, Azienda USL della Valle d'Aosta, Italy
Reviewed by
Hong Zhang, Tianjin Chest Hospital, China
Mohamed Naseem, Tanta University, Egypt
Genki Inui, Tottori University, Japan
Updates
Copyright
© 2025 Yan, Zhao, He, Li, Zhao and Ye.
This is an open-access article distributed under the terms of the Creative Commons Attribution License (CC BY). The use, distribution or reproduction in other forums is permitted, provided the original author(s) and the copyright owner(s) are credited and that the original publication in this journal is cited, in accordance with accepted academic practice. No use, distribution or reproduction is permitted which does not comply with these terms.
* Correspondence: Yuquan Ye drultras1961@163.com
Disclaimer
All claims expressed in this article are solely those of the authors and do not necessarily represent those of their affiliated organizations, or those of the publisher, the editors and the reviewers. Any product that may be evaluated in this article or claim that may be made by its manufacturer is not guaranteed or endorsed by the publisher.