Abstract
Background:
The impact of medical care by hypertension specialists on the risk of subsequent major adverse cardiovascular events (MACE) among uncontrolled hypertensive patients remains unclear. We aimed to investigate the association between care by hypertension specialists and the risk of MACE among patients with uncontrolled hypertension.
Methods:
Using the Urumqi Hypertension Database (UHDATA), we studied a retrospective cohort of patients aged 45–79 years who were admitted for uncontrolled hypertension at People's Hospital of Xinjiang Uygur Autonomous Region, China, between 2015 and 2019. Based on hospitalization departments, we identified patients who had been exposed to medical care by hypertension specialists at least once and divided patients into a hypertension specialists group and a non-specialists group. Cox proportional hazards modeling was used to estimate the risk for MACE (a four-component outcome of cardiovascular death, non-fatal stroke, non-fatal myocardial infarction, and coronary revascularization) in the cohort using the propensity score method of stabilized inverse probability of treatment weighting (sIPTW).
Results:
A total of 10,680 patients with uncontrolled hypertension were analyzed, with a median follow-up of 4.0 years. Of these, 5,646 (52.9%) patients received medical care by hypertension specialists and experienced fewer MACE than the non-specialists group [21.5 vs. 39.7 per 1,000-person-year, adjusted hazard ratio (HR) 0.67, 95% confidence interval (CI) 0.57–0.79] after sIPTW. Results persisted for the MACE component, non-fatal stroke (HR 0.62, 95% CI 0.49–0.79), non-fatal myocardial infarction (HR 0.48, 95% CI 0.33–0.69), and coronary revascularization (HR 0.71, 95% CI 0.55–0.93). In subgroup analyses, no significant interaction effect was observed between medical care by hypertension specialists and key subgroup factors on MACE.
Conclusions:
This study demonstrated a significant association between medical care by hypertension specialists and a reduced risk of MACE in patients with uncontrolled hypertension. Our results suggest that medical care by hypertension specialists may play an essential role in improving cardiovascular outcomes among this high cardiovascular disease risk population.
1 Introduction
Hypertension is the leading global modifiable risk factor for cardiovascular disease (CVD) and premature death (1, 2). Uncontrolled blood pressure (BP) is associated with adverse cardiovascular outcomes (3, 4). Although pharmaceutical treatment and lifestyle modifications have demonstrated effectiveness as blood pressure interventions in numerous randomized clinical trials (5, 6), the rate of uncontrolled hypertension remains high at approximately 80% worldwide (7, 8). Furthermore, CVD incidence demonstrates a consistent age-dependent upward trend, with a particularly striking elevation among adults aged 45 years and older (9). The large population with uncontrolled hypertension is a major contributor to the continuing increase in cardiovascular disease burden (10), underscoring that a substantial number of cardiovascular events are preventable (11).
Previous studies have demonstrated that a physician's specialty impacts patient outcomes in cardiovascular disease (12–14). Several observational studies have indicated hypertension specialists provide advantages in controlling blood pressure and managing other cardiovascular risk factors (15–17). Hypertension specialists possess advanced expertise in the management of hypertension and play an essential role in evaluating and managing secondary causes of hypertension, as well as optimizing treatment based on customary care practices (18). However, the impact of care provided by hypertension specialists for patients with uncontrolled hypertension remains uncertain, and the long-term evidence regarding the risk of cardiovascular events is still lacking. This study employed a retrospective cohort of patients with uncontrolled hypertension to examine the association between care provided by hypertension specialists and the risk of subsequent major adverse cardiovascular events (MACE) in this population.
2 Materials and methods
2.1 Study design and participants
We conducted a retrospective cohort study by evaluating electronic medical records data of hypertensive patients who were admitted to the non-surgical department for hypertension at People's Hospital of Xinjiang Uygur Autonomous Region between January 2015 and December 2019, utilizing the Urumqi Hypertension Database (UHDATA) (19). Comprehensive details of this database have been published and are summarized in the online Supplementary Material (Supplementary Methods). All participants in this study were residents of Urumqi, with equitable access to the hospital's outpatient services. Patients attended the internal medicine clinic based on personal healthcare needs or preferences, or were referred from primary care facilities for uncontrolled or complex hypertension. The inclusion criteria were as follows: (1) patients aged 45–79 years and resident in Urumqi (n = 19,722); (2) patients with uncontrolled hypertension (n = 13,888), defined as having a mean systolic/diastolic BP of ≥140/90 mmHg, or ≥130/80 mmHg if they have existing CVD, diabetes mellitus (DM), chronic kidney disease (CKD), or a high risk of developing CVD (20, 21). Blood pressure was recorded in the research department as the average of three consecutive automated readings on the left arm at 30-s intervals, taken after ≥5 min of seated rest with back support, feet flat, and the arm positioned at heart level. The exclusion criteria included a prior history of myocardial infarction (n = 487), coronary revascularization (n = 539), or stroke (n = 669) at baseline, as well as no record of follow-up data (n = 1,513).
This investigation was performed in compliance with the Declaration of Helsinki and received approval from the hospital’s ethics committee (ethical approval NO. KY2022080904). Given the study's retrospective nature, no additional informed consent was required.
2.2 Data collection
Baseline information for all participants included the following variable: sociodemographic data encompassed age, sex, marital status, occupation, cigarette use, and alcohol consumption; anthropometric measurements comprised body mass index (BMI, calculated by the weight in kilograms divided by the square of height in meters), systolic blood pressure, and diastolic blood pressure; medical history included comorbidities such as ischemic heart disease (IHD, ICD-10:I20-I25), chronic cerebral hypoperfusion (CCH, ICD-10:I67.8), CKDs (ICD-10:N18), DM (ICD-10:E10-E11), and duration of hypertension, as well as antihypertensive therapy; and medical visit records included all visit types, inpatient admission and discharge departments, the presence of consultations or referrals, and all disease diagnoses and corresponding ICD-10 codes. Peripheral venous blood was collected at baseline following a 12-h fast for biochemical testing, which included serum triglycerides (TG), total cholesterol (TC), low-density lipoprotein cholesterol (LDL-c), high-density lipoprotein cholesterol (HDL-c), fasting glucose, uric acid (UA), serum creatinine, and the estimated glomerular filtration rate (eGFR, calculated using the 2021 Chronic Kidney Disease Epidemiology Collaboration creatinine equation: eGFR = 142*[min (Scr/0.7, 1) ^(−0.241)]*[max (Scr/0.7, 1)^(−1.200)]*(0.9938^age) *1.012[if female]; eGFR = 142* [min (Scr/0.9, 1) ^(−0.302)]*[max (Scr/0.9, 1) ^(−1.200)] *(0.9938^age)[if male]).
2.3 Exposure and groups
The exposure was care provided by hypertension specialists at the Hypertension Center of the hospital. This care involved guideline-based, systematic management procedures in addition to usual care. Its core components included (1) a comprehensive assessment of blood pressure control, overall cardiovascular risk, and hypertensive complications; (2) timely screening and identification of secondary causes of hypertension; and (3) integrating etiology treatment into management strategies, and optimizing treatment regimens. The key difference between hypertension specialist care and usual care was the systematic diagnosis and treatment of hypertension, particularly the identification and intervention of secondary hypertension. All specialists involved had extensive experience, and detailed descriptions of the center, specialists, and care procedures are provided in the Supplementary Material (Supplementary Methods and Supplementary Figure S1).
We identified patients based on their admission or discharge departments in the electronic medical records between 1 January 2015 and 31 December 2019, determined whether they had received medical care from hypertension specialists, and then divided them into the two groups. Hypertension specialists group: Patients with at least one hospitalization at the hypertension center within the aforementioned period were enrolled in the hypertension specialists group. The index date was defined as the date of initial admission to the hypertension center. Non-specialists group: Patients with no record of hospitalization at the hypertension center throughout the aforementioned period and who received usual care from non-specialists in the same clinical setting during the same period were enrolled into the non-specialists group. Physicians in the non-specialists group comprised those specializing in Cardiology, Nephrology, Endocrinology, Neurology, General Medicine, and other internal medicine subspecialties. The index date was defined as the date of initial admission to the non-specialists department. The follow-up period began on the index date and ended on 30 April 2023.
2.4 Outcomes
The primary outcome of this analysis was a composite of the first occurrence of MACE from the index date through the follow-up period, which included cardiovascular death, non-fatal stroke (ICD-10: I60-I63), non-fatal myocardial infarction (ICD-10:I21-I22), and coronary revascularization (22–24). The secondary outcomes included the individual components of the primary composite outcome. Coronary revascularization was defined as percutaneous coronary intervention with stent implantation and coronary artery bypass grafting (CABG), identified by comparing the surgical records with the medical records. Deaths were classified into cardiovascular and non-cardiovascular categories, and the date of cardiovascular death was obtained from provincial death records. Cardiovascular death was defined as being attributed to a cardiovascular etiology, including acute myocardial infarction, stroke, heart failure, malignant arrhythmia, sudden cardiac death, or other cardiovascular causes (pulmonary embolism and aortic dissection). Definitions of study outcomes are provided in the online Supplementary Material (Supplementary Methods). Data on MACE diagnosis during the follow-up were primarily obtained from UHDATA, national physical examination records, and the social medical insurance system of Urumqi. For participants who experienced these outcomes multiple times during the follow-up period, only the first occurrence was used for the analysis of MACE. Patients were observed from their index date until the occurrence of MACE or the last follow-up, which was censored as of 30 April 2023.
2.5 Statistical analysis
Continuous variables are presented as mean ± SD or median [interquartile range (IQR)], while categorical variables are presented as numbers (percentage). Statistical comparisons between groups used the independent Student's t-test or Mann–Whitney test for continuous data, and the Pearson's chi-square test for categorical data, as appropriate.
The cumulative incidence of cardiovascular outcomes was estimated via the Kaplan–Meier method and compared using the log-rank test. Cox proportional hazards regression models were used to estimate hazard ratio (HRs) along with 95% confidence intervals (CIs) for the cardiovascular outcomes. The proportional hazards assumption was checked by examining plots of the scaled Schoenfeld residuals against time for the covariates (GLOBAL P = 0.543). The adjusted model included sex, age, BMI, systolic BP, diastolic BP, marital status, occupation, duration of hypertension, antihypertensive therapy, current smoker, current drinker, TG, LDL-c, HDL-c, UA, and comorbidities at baseline. Meanwhile, win ratio analyses were conducted to assess the effect of medical care by hypertension specialists on the hierarchical composite outcome of cardiovascular death > non-fatal stroke > non-fatal myocardial infarction > coronary revascularization (the “>” symbol denotes the order of the win ratio hierarchy, which decreases from left to right). In addition, subgroup analyses were performed to further evaluate the association between care by hypertension specialists and outcomes based on sex, age, BMI, current smoking status, current drinking status, duration of hypertension, and type of hypertension. Furthermore, sensitivity analyses were performed to verify the robustness of results by excluding participants with MACE ≤1 year, IHD, CCH, CKD, or DM at baseline. A competing risk analysis using Fine–Gray modeling (25, 26) was also performed to estimate unadjusted and multivariable-adjusted subdistribution hazard ratios (sHRs) and 95% CI after sIPTW for MACE, accounting for non-cardiovascular death as a competing risk. E-values were calculated to assess the effect of unmeasured confounding variables on the results (27). Missing data for baseline covariables were handled using multiple imputations based on the method of chained equations. Five imputation datasets were created, with 0.14% of the covariables imputed (Supplementary Table S2). No outcomes were imputed. The propensity score method of stabilized inverse probability of treatment weighting (sIPTW) was used to ensure a similar distribution of baseline characteristics between the two groups (28). All variables in the multiple Cox regression model were checked for multicollinearity, which was defined as variance inflation factor >5 and tolerance <0.10 (Supplementary Table S5). Multiple imputation, Cox proportional hazards regression, inverse probability of treatment weighting, and win ratio analyses were performed using SPSS 26.0 and R (version 4.2.2) statistical software; all analyses were two-tailed, and p < 0.05 was considered statistically significant.
3 Results
3.1 Baseline characteristics of the cohort
Between 1 January 2015 and 31 December 2019, a total of 10,680 (87.6%) participants completed follow-up and were enrolled in the analysis, including 5,646 (52.9%) participants in the specialists group and 5,034 (47.1%) in the non-specialists group (selection of the study population is shown in Figure 1). The mean age of the cohort was 59.4 years (SD 9.6), and 51.2% (5,472) of the participants were men (Table 1). The differences in the clinical characteristics between the two groups when admitted are shown in Table 1. Notably, before sIPTW, patients in the specialists group had significantly higher baseline BP (systolic BP, 152.2 ± 16.9 mmHg vs. 146.5 ± 16.8 mmHg, p < 0.001), TC (4.6 ± 1.0 mmol/L vs. 4.5 ± 1.1 mmol/L, p < 0.05), LDL-c (2.8 ± 0.8 mmol/L vs. 2.7 ± 0.9 mmol/L, p < 0.001), and UA (338.6 ± 88.1 mmol/L vs. 328.4 ± 92.0 mmol/L, p < 0.001) values compared to the non-specialists group. After sIPTW, there were no meaningful differences in the distribution of measured baseline clinical characteristics between the two groups, with all maximum absolute standardized differences <0.1 (Table 1). Other baseline characteristics between the two groups are provided in the Supplementary Material (Supplementary Tables S3, S4).
Figure 1
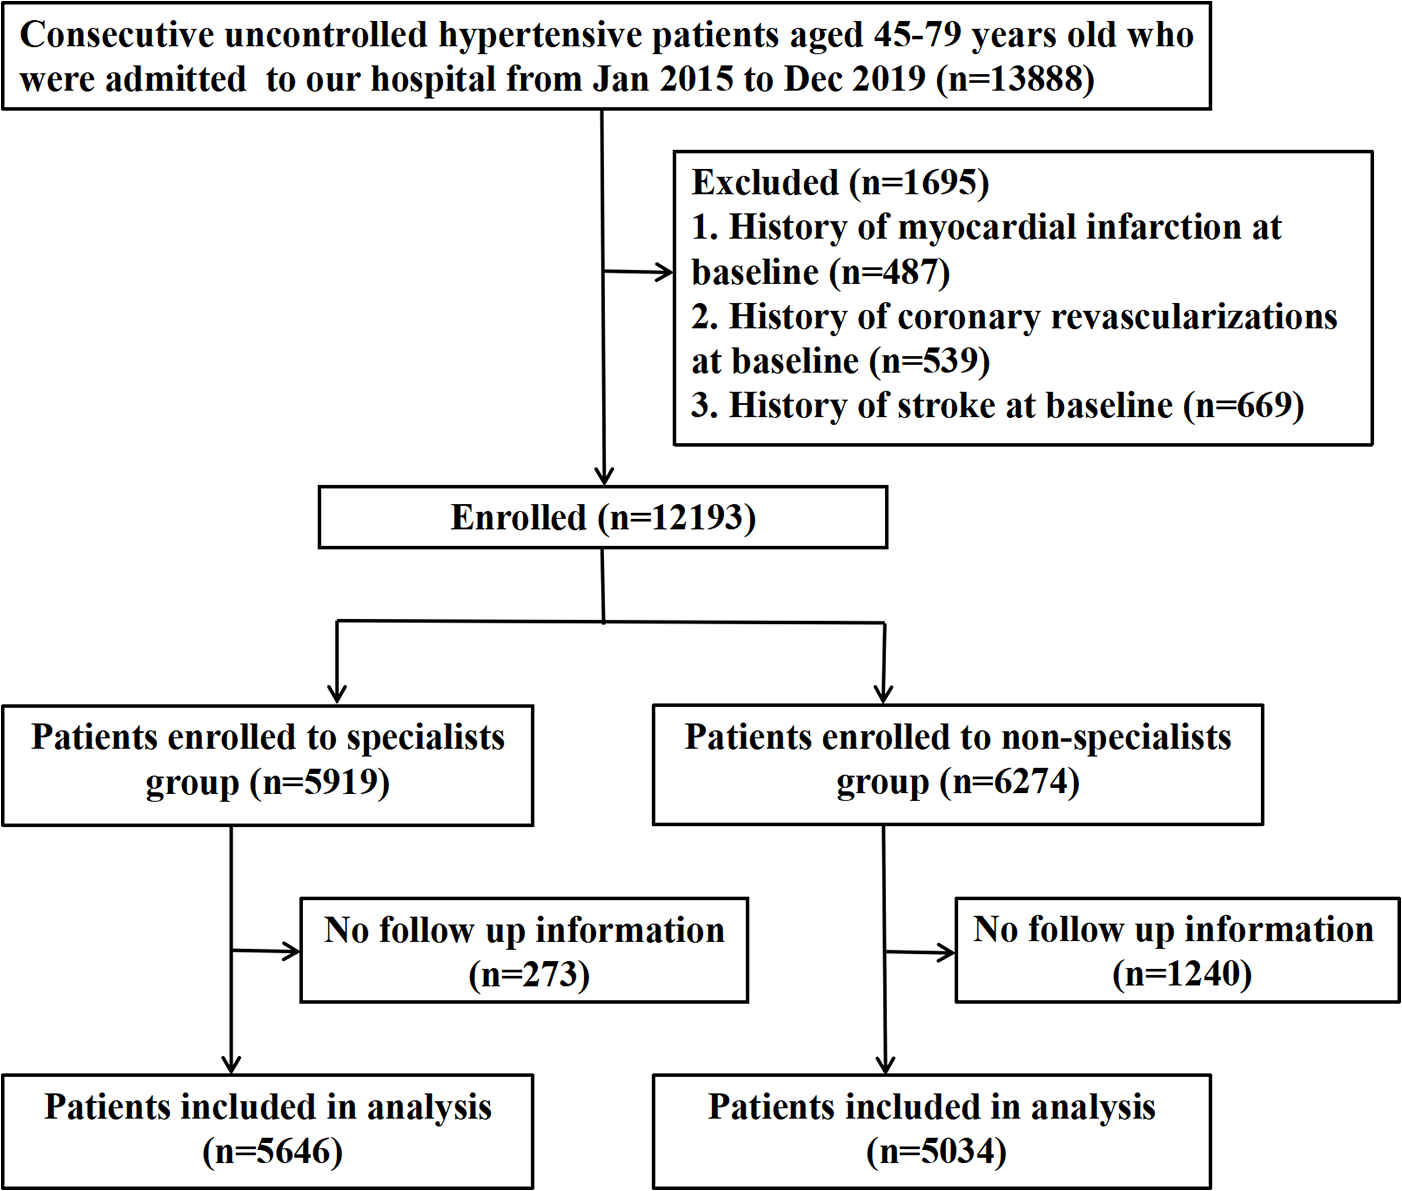
Flowchart of participant identification and inclusion criteria.
Table 1
| Before sIPTW | After sIPTW | ||||||||
|---|---|---|---|---|---|---|---|---|---|
| Total cohort | Specialists group | Non-specialists group | Specialists group | Non-specialists group | |||||
| Characteristics | (n = 10,680) | (n = 5,646) | (n = 5,034) | p-Value* | SMD** | (n = 5,718.1) | (n = 5,042.7) | p-Value* | SMD** |
| Male, no. (%) | 5,472 (51.2) | 2,967 (52.6) | 2,505 (49.8) | 0.004 | 0.056 | 2,894.9 (50.7) | 2,550.1 (50.5) | 0.88 | 0.005 |
| Age, mean (SD), years | 59.4 (9.6) | 56.8 (8.9) | 62.4 (9.4) | <0.001 | 0.612 | 59.8 (9.8) | 59.6 (9.3) | 0.55 | 0.019 |
| Married, no. (%) | 10,302 (96.5) | 5,460 (96.7) | 4,842 (96.2) | 0.16 | 0.028 | 5,537.6 (96.8) | 4,874.5 (96.7) | 0.66 | 0.010 |
| Occupation, no. (%) | |||||||||
| Employed | 4,226 (39.6) | 2,697 (47.8) | 1,534 (30.5) | <0.001 | 0.374 | 2,208.9 (38.6) | 1,938.0 (38.4) | 0.64 | 0.026 |
| Retired | 4,627 (43.3) | 2,026 (35.9) | 2,602 (51.7) | 2,582.3 (45.2) | 2,238.9 (44.4) | ||||
| Unemployed/homemaker | 1,827 (17.1) | 923 (16.3) | 898 (17.8) | 926.9 (16.2) | 865.9 (17.2) | ||||
| Current smoking status, no. (%) | 2,060 (19.3) | 1,264 (22.4) | 796 (15.8) | <0.001 | 0.168 | 1,068.4 (18.7) | 944.0 (18.7) | 0.97 | 0.001 |
| Current drinking status, no. (%) | 2,292 (21.5) | 1,451 (25.7) | 841 (16.7) | <0.001 | 0.221 | 1,189.9 (20.8) | 1,081.1 (21.4) | 0.60 | 0.015 |
| Comorbidities, no. (%) | |||||||||
| Ischemic heart diseases | 2,397 (22.4) | 614 (10.9) | 1,783 (35.4) | <0.001 | 0.608 | 1,403.6 (24.6) | 1,150.2 (22.8) | 0.21 | 0.041 |
| Chronic cerebral hypoperfusion | 5,496 (51.5) | 3,698 (65.5) | 1,798 (35.7) | <0.001 | 0.624 | 3,005.4 (52.7) | 2,641.4 (52.4) | 0.90 | 0.004 |
| Chronic kidney diseases | 505 (4.7) | 217 (3.8) | 288 (5.7) | <0.001 | 0.088 | 309.7 (5.4) | 248.7 (4.9) | 0.53 | 0.022 |
| Diabetes | 3,487 (32.6) | 1,186 (21.0) | 2,301 (45.7) | <0.001 | 0.543 | 1,979.5 (34.6) | 1,633.4 (32.4) | 0.12 | 0.047 |
| Duration of hypertension, median (IQR), years | 5.8 (2.0, 10.0) | 5.0 (1.0, 10.0) | 6.0 (2.0, 11.0) | <0.001 | 0.113 | 6.0 (2.0, 13.0) | 6.0 (2.0, 10.0) | 0.14 | 0.053 |
| Antihypertensive therapy, no. (%) | 6,742 (63.1) | 3,922 (69.5) | 2,820 (56.0) | <0.001 | 0.281 | 3,758.8 (65.8) | 3,215.6 (63.7) | 0.10 | 0.045 |
| Clinical characteristics, mean (SD) | |||||||||
| Systolic BP (mmHg) | 149.5 (17.1) | 152.2 (16.9) | 146.5 (16.8) | <0.001 | 0.339 | 149.5 (16.8) | 150.0 (18.5) | 0.44 | 0.030 |
| Diastolic BP (mmHg) | 87.7 (12.5) | 89.8 (12.9) | 85.3 (11.7) | <0.001 | 0.368 | 87.3 (13.3) | 87.6 (12.6) | 0.52 | 0.023 |
| Fasting glucose (mmol/L) | 5.8 (2.5) | 5.4 (1.9) | 6.4 (2.9) | <0.001 | 0.410 | 6.0 (3.1) | 5.8 (2.4) | 0.28 | 0.053 |
| Triglyceride (mmol/L) | 1.9 (1.5) | 1.9 (1.5) | 1.9 (1.5) | 0.55 | 0.012 | 1.9 (1.5) | 1.9 (1.4) | 0.51 | 0.018 |
| Total cholesterol (mmol/L) | 4.6 (1.1) | 4.6 (1.0) | 4.5 (1.1) | 0.037 | 0.040 | 4.6 (1.1) | 4.5 (1.1) | 0.58 | 0.018 |
| LDL-cholesterol (mmol/L) | 2.7 (0.9) | 2.8 (0.8) | 2.7 (0.9) | <0.001 | 0.082 | 2.7 (0.8) | 2.7 (0.9) | 0.92 | 0.003 |
| HDL-cholesterol (mmol/L) | 1.1 (0.3) | 1.0 (0.3) | 1.1 (0.3) | 0.32 | 0.019 | 1.1 (0.3) | 1.1 (0.3) | 0.93 | 0.002 |
| Uric acid (μmol/L) | 333.7 (90.1) | 338.6 (88.1) | 328.4 (92.0) | <0.001 | 0.113 | 335.3 (87.9) | 334.7 (94.1) | 0.83 | 0.007 |
| Body mass index (kg/m2) | 26.9 (3.8) | 26.8 (3.7) | 27.0 (4.0) | 0.020 | 0.045 | 27.0 (3.8) | 26.9 (3.9) | 0.63 | 0.015 |
| eGFR (mL/min per 1·73 m2) | 96.8 (12.2) | 99.2 (10.4) | 94.2 (13.4) | <0.001 | 0.418 | 96.2 (11.5) | 96.6 (13.1) | 0.35 | 0.029 |
Baseline characteristics of the study population.
Data are expressed as mean ± SD, median (IQR), and number (percentage) as appropriate. BP, blood pressure; LDL-cholesterol, low-density lipoprotein cholesterol; HDL cholesterol, high-density lipoprotein cholesterol; eGFR, estimated glomerular filtration rate; sIPTW, stabilized inverse probability of treatment weighting; SMD, standardized mean difference.
p-Values for categorical data generated using the Pearson's chi-square test for two independent proportions and for numeric data using the Student's t-test or Mann–Whitney U-test for two independent groups.
SMD <0.1 indicates balance between groups.
3.2 Association between medical care by hypertension specialists and the risk of MACE
Table 2 shows the relationship between hypertension specialist medical care and four-component MACE. During a median follow-up of 4.0 years (interquartile range, 2.4–5.7 years), the primary outcome was confirmed in 439 participants (21.5 per 1,000 person-years) in the hypertension specialists group and 806 participants (39.7 per 1,000 person-years) in the non-specialists group. The difference between the two groups was statistically significant before and after sIPTW (log-rank test, p < 0.001, Figure 2). The secondary outcomes included 753 cases of non-fatal stroke, 216 cases of non-fatal myocardial infarction, 362 cases of coronary revascularization, and 118 cases of cardiovascular death. Similar significant differences were also observed for secondary outcomes, including non-fatal stroke (12.2 vs. 24.0 per 1,000 person-years), non-fatal myocardial infarction (3.1 vs. 7.0 per 1,000 person-years), and coronary revascularization (6.4 vs. 10.7 per 1,000 person-years), except for cardiovascular death (log-rank test, p < 0.001, Figure 2). The risk of MACE was significantly lower in the hypertension specialists group (HR after sIPTW = 0.73, 95% CI 0.61–0.87, p < 0.001), and the association was stable and became stronger after the multiple Cox regression analysis (adjusted HR = 0.67, 95% CI 0.57–0.79, p < 0.001). A similar tendency was observed for secondary outcomes (all p < 0.05), except for cardiovascular death.
Table 2
| Specialists group (n = 5,646) | Non-specialists group (n = 5,034) | |||||||
|---|---|---|---|---|---|---|---|---|
| Outcomesa | Cases with event, n (%) | Incidence rate (cases/1,000 person years) | Cases with event, n (%) | Incidence rate (cases/1,000 person years) | Unadjusted HR (95% CI) | p-Values | Adjusted HRb(95% CI) | p-Values |
| Primary outcome | ||||||||
| Four-component MACEc | 439 (7.8) | 21.5 | 806 (16.0) | 39.7 | 0.73 (0.61–0.87) | <0.001 | 0.67 (0.57–0.79) | <0.001 |
| Secondary outcomes | ||||||||
| Non-fatal stroke | 253 (4.5) | 12.2 | 500 (9.9) | 24.0 | 0.69 (0.53–0.89) | 0.001 | 0.62 (0.49–0.79) | <0.001 |
| Non-fatal myocardial infarction | 65 (1.2) | 3.1 | 151 (3.0) | 7.0 | 0.47 (0.33–0.68) | <0.001 | 0.48 (0.33–0.69) | <0.001 |
| Coronary revascularization | 133 (2.4) | 6.4 | 229 (4.5) | 10.7 | 0.73 (0.55–0.96) | 0.027 | 0.71 (0.55–0.93) | 0.012 |
| Cardiovascular death | 43 (0.8) | 2.0 | 75 (1.5) | 3.4 | 1.47 (0.83–2.60) | 0.19 | 1.31 (0.74–2.32) | 0.35 |
Unadjusted and adjusted hazard ratio of major adverse cardiovascular events between specialists group and non-specialists group after sIPTW.
MACE, major adverse cardiovascular events; sIPTW, stabilized inverse probability of treatment weighting; CI, confidence interval; HR, hazard ratio.
The number (%) of people with at least one event.
Adjusted for sex, age, baseline body-mass index, systolic BP, diastolic BP, duration of hypertension, married, occupation, antihypertensive therapy, current smoker, current drinker, triglyceride, low-density lipoprotein cholesterol, high-density lipoprotein cholesterol, uric acid, and baseline comorbidities.
Four-component MACE including non-fatal stroke, non-fatal myocardial infarction, coronary revascularization, and cardiovascular death.
Figure 2
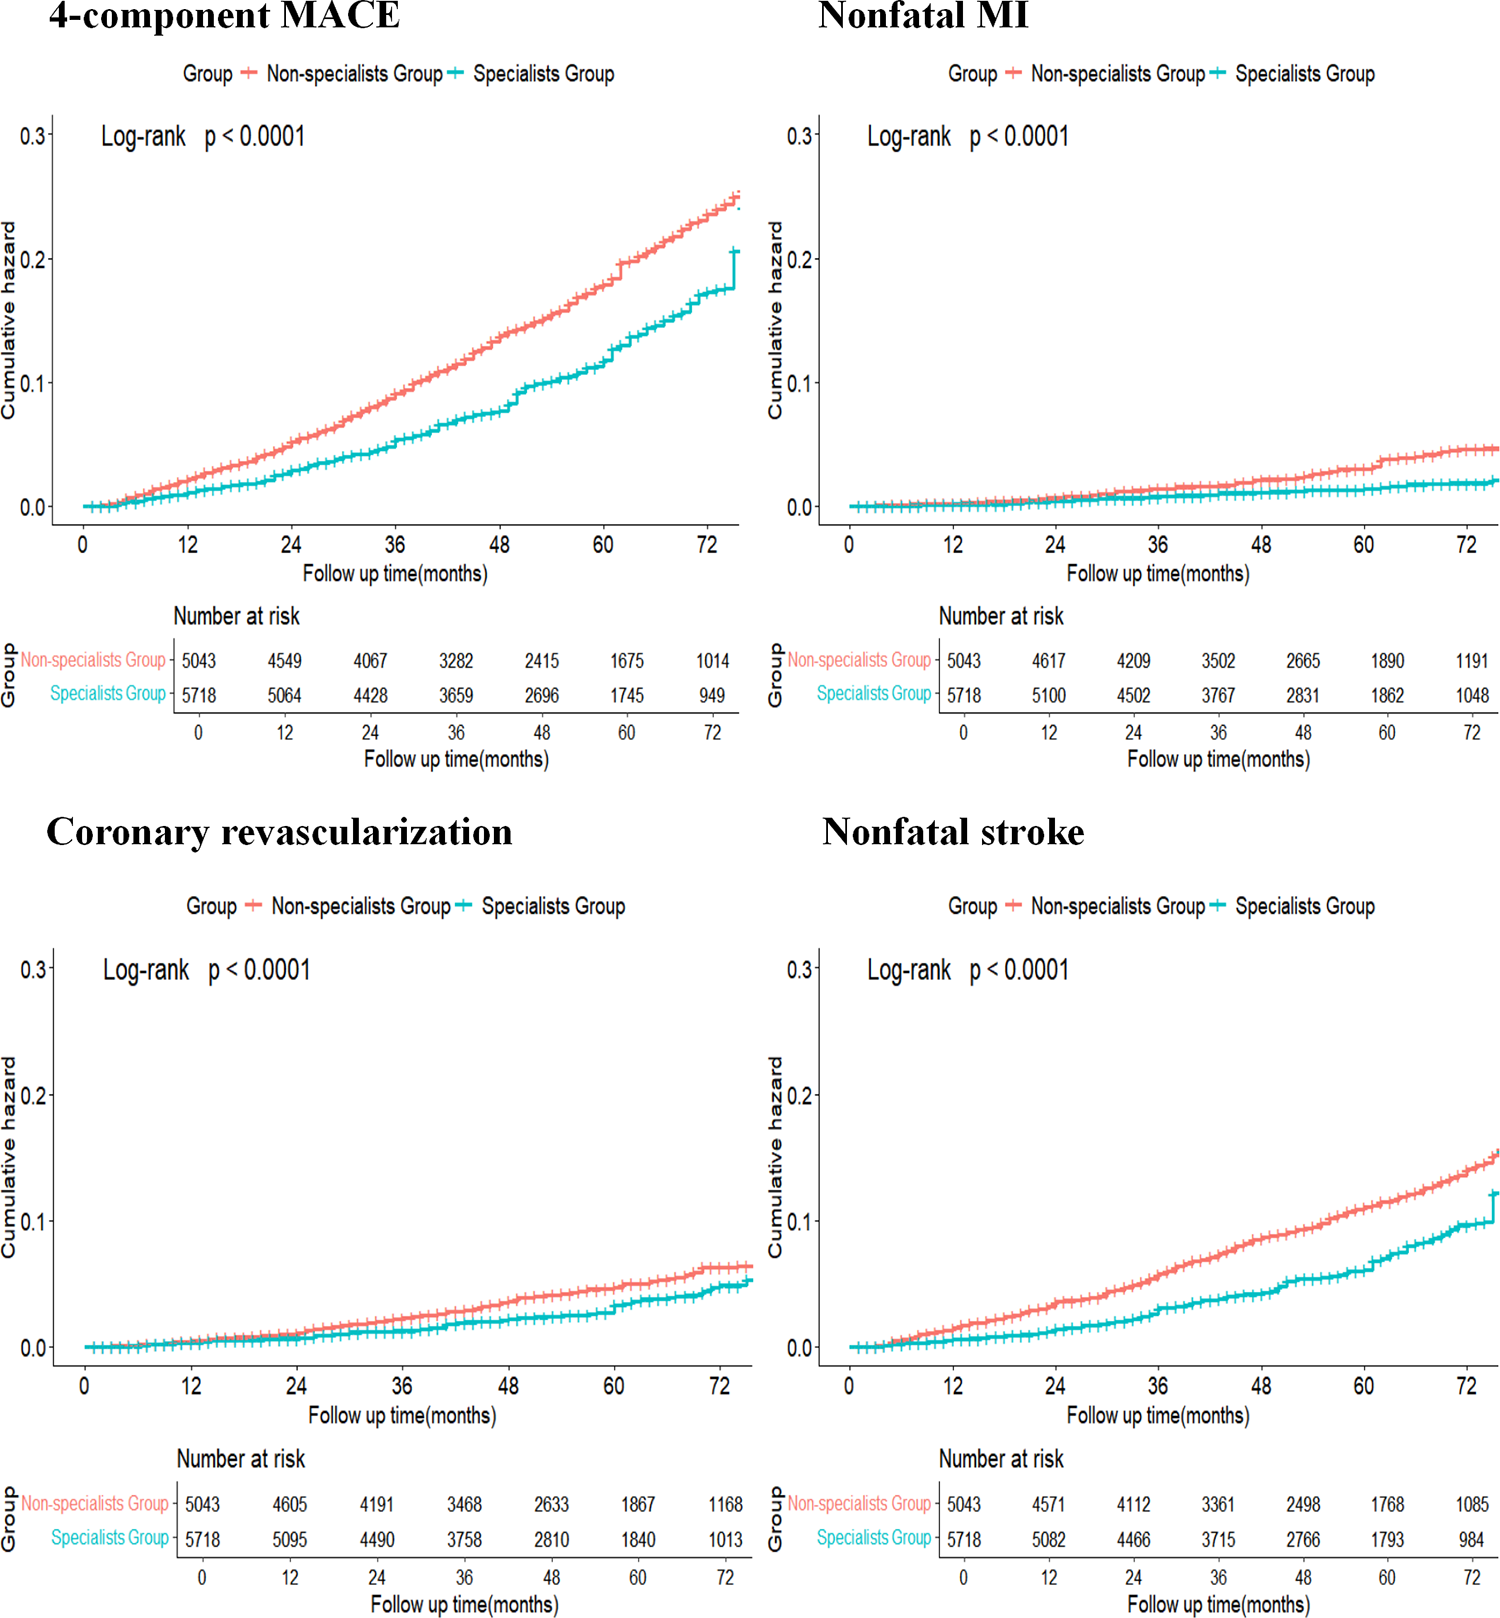
Kaplan–Meier curve comparing the specialists group and the non-specialists group after sIPTW. Blue line indicates cumulative hazard for the specialists group after sIPTW; orange line indicates cumulative hazard for the non-specialists group after sIPTW.
Supplementary Figure S2 demonstrates the main analysis of the win ratio. All patients in the specialists group were paired with all patients in the non-specialists group, resulting in 5,646 × 5,034 = 28,421,964 patient pairs. The specialists group had a win proportion of 8.89%, whereas the non-specialists group had a win proportion of 4.65%. The specialists group had an adjusted win ratio of 1.91 over the non-specialists group (95% CI 1.69–2.16, p < 0.001) after sIPTW (Supplementary Figure S2).
3.3 Subgroup analyses between medical care by hypertension specialists and the risk of MACE
Figure 3 shows subgroup analyses assessing the effect of potential confounders, which might affect the relationship between care by hypertension specialists and the risk of MACE. The findings mentioned previously are consistent across subgroups categorized by age, sex, BMI, duration of hypertension, current smoking status, current drinking status, and type of hypertension at baseline, with no significant interaction effect noted (p for all interactions >0.05, Figure 3). Similar results were observed for secondary outcomes (Supplementary Figures S4–S6).
Figure 3
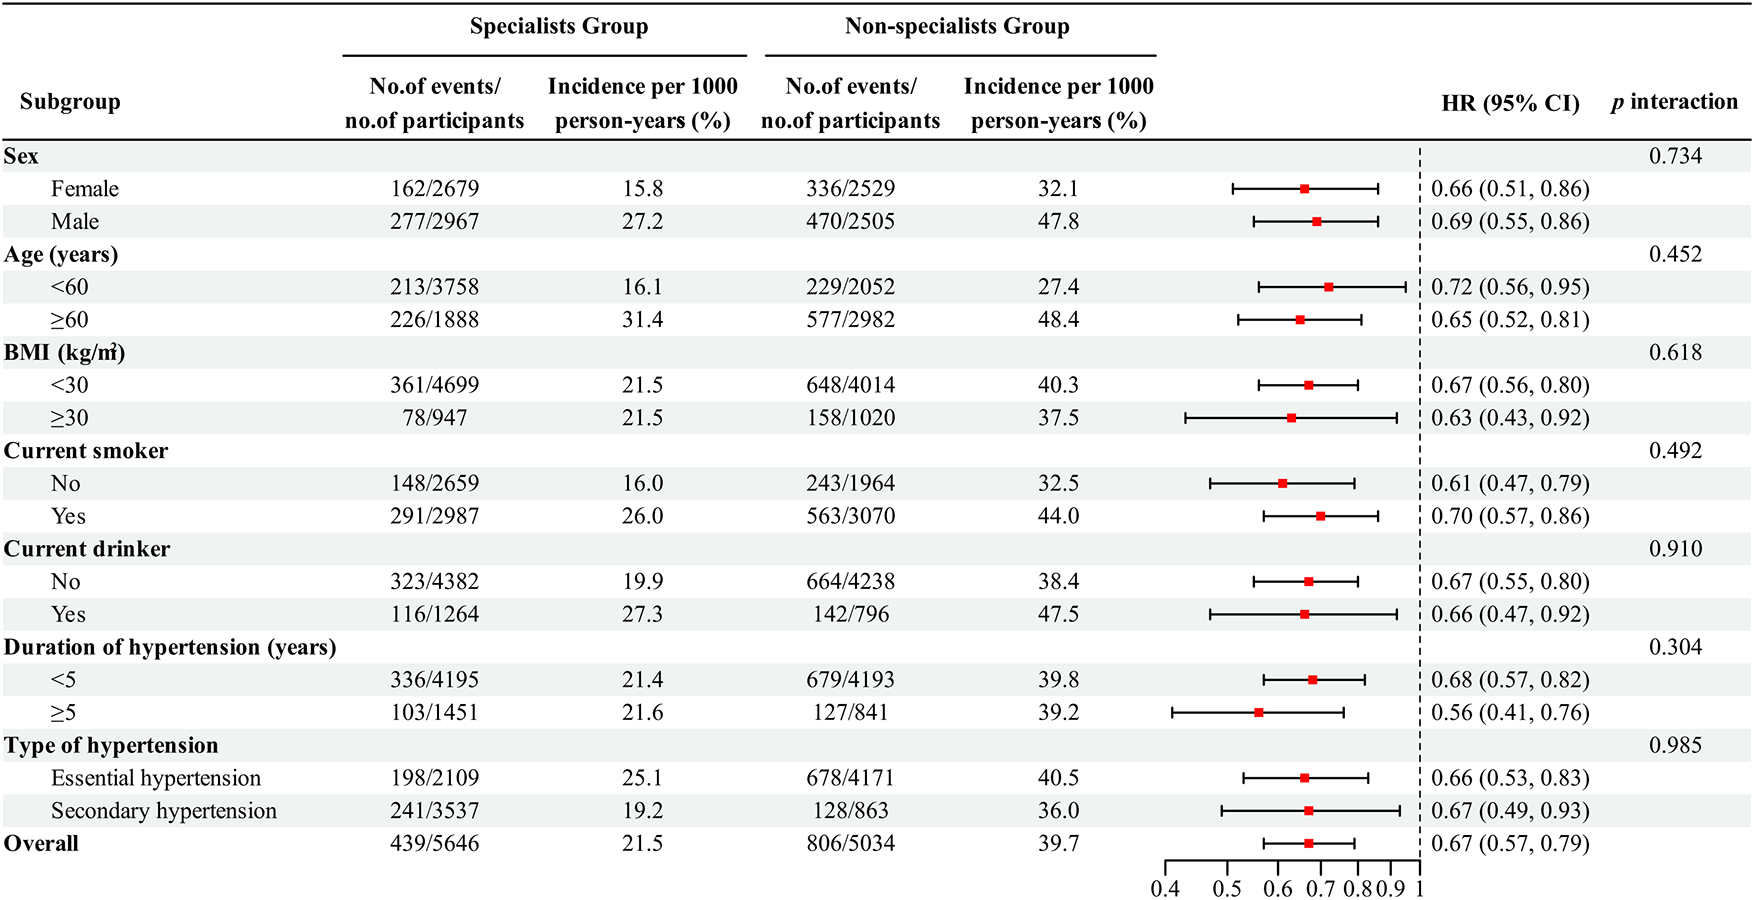
Subgroup analysis of major adverse cardiovascular events in patients with uncontrolled hypertension after sIPTW.
3.4 Sensitivity analyses between medical care by hypertension specialists and the risk of MACE
In all sensitivity analyses, the association between medical care by hypertension specialists and the risk of MACE remained robust and consistent (Supplementary Tables S6, S7). In the competing risk analysis accounting for non-cardiovascular death as a competing event, medical care by hypertension specialists remained significantly associated with a reduced risk of MACE (adjusted sHR = 0.63, 95% CI: 0.55–0.72, p < 0.001) (Supplementary Table S8). This sHR indicated that non-cardiovascular death did not substantially alter the association between care by hypertension specialists and MACE risk.
The E-value for unmeasured confounding in the multiple Cox regression examining the association between care by hypertension specialists and MACE was 2.35 for the point estimate and 1.85 for the lower bound of the 95% CI (Supplementary Table S9). The E-value indicates that our primary finding is robust to moderate unmeasured confounding and unlikely to be driven by residual bias from uncollected variables.
4 Discussion
In this real-world retrospective cohort study, we found that patients receiving care from hypertension specialists had a 33% lower risk of MACE compared with those receiving usual care from the non-specialists. In addition, care provided by hypertension specialists was associated with a decreased incidence of the secondary outcomes, including a 38% reduction in non-fatal stroke, a 52% reduction in non-fatal myocardial infarction, and a 29% reduction in coronary revascularization. Subgroup analyses further confirmed that both patients with essential and secondary hypertension significantly benefited from care provided by hypertension specialists. These findings validate the clinical value of hypertension specialist care in high-risk populations and extend the evidence from previous studies on hypertension management strategies.
Existing multilevel strategies led by non-physicians (e.g., village doctors, nurses) have been shown to effectively improve BP control and cardiovascular outcomes in general hypertensive populations within primary care settings (29–31). Our study extends this evidence by focusing on patients with uncontrolled hypertension, a high-risk subgroup for whom routine strategies may be insufficient due to complex clinical challenges like drug resistance or undetected secondary causes. The observed cardiovascular risk reduction underscores that hypertension specialist care serves as an advanced, multicomponent intervention tailored to the unmet needs of this challenging population. Prior studies established that referral to hypertension specialists improves BP control, supporting the value of specialist engagement (15, 17). Our study builds upon this by focusing on MACE, demonstrating that such care also translates into tangible long-term cardiovascular benefits.
Three interrelated mechanisms may explain the observed benefits: The first benefit is the strict adherence to guideline-directed evidence-based practice. Specialists demonstrate better adherence to evidence-based practice (32, 33) and excel at optimizing and refining antihypertensive regimens, which positively affects the patient's adherence to treatment (34). The second benefit is timely identification and management of the underlying causes of secondary hypertension. Secondary hypertension is associated with an increased risk of cardiovascular disease and more severe target organ damage, with certain forms being independent of blood pressure control (35, 36). Patients with suspected secondary hypertension are more readily identified and diagnosed in hypertension specialist settings (37, 38). Despite a higher secondary hypertension diagnosis rate (62.65%) in the specialists group, the associated risk of MACE was effectively mitigated, supporting the notion that identifying the underlying cause of secondary hypertension may lead to successful interventions targeting the potential etiology and reducing cardiovascular morbidity (39). Since certain forms of secondary hypertension are often asymptomatic, diagnostic delay or misdiagnosis in routine clinical practice is particularly common in non-specialist settings, consequently leading to preventable end-organ injury and poorer clinical outcomes (40, 41). The third benefit is comprehensive management of clustered risk factors. Hypertension specialists achieve both superior BP control (15, 17) and address other modifiable cardiovascular risk factors (18). Despite higher baseline risk profiles (TG, TC, LDL-c, and UA), patients under specialist care achieved a 52% lower risk of myocardial infarction, indicating care benefits beyond mere BP reduction.
Our findings support a stratified management approach: Routine hypertension cases can be effectively managed in primary care settings, while patients with uncontrolled BP or suspected complexity should be referred to specialists. This strategy addresses knowledge gaps among frontline providers and ensures that high-risk patients receive optimized care. From a public health perspective, given the global burden of uncontrolled hypertension, incorporating the identification and intervention of secondary hypertension into hypertension care through specialists could meaningfully diminish the population-level burden of cardiovascular disease.
The study has several key strengths that reinforce its findings and implications. First, it used a large cohort sample size and longer follow-up time, which increased the generalizability and statistical power of the results. Second, the research findings demonstrated robustness and consistency across a comprehensive range of sensitivity and subgroup analyses, thereby enhancing confidence in their reliability. Third, the study's patient-centered approach, focused on individuals with uncontrolled hypertension, uniquely identified the specific benefits of specialist medical care in reducing the risk of MACE and demonstrated the substantial clinical value of such specialist care within a high-risk CVD population. Taken together, these strengths highlight the significant contribution of the study to clinical practice and health policy for individuals with hypertension.
This study has several limitations. First, the single-center, retrospective design of this study may restrict causal inference and the generalizability of our findings. Future multicenter studies covering both tertiary and community settings could further validate our conclusions. Second, while the sIPTW adjustment successfully balanced baseline confounding between the two groups, unmeasured or residual confounding may still exist due to the lack of data on socioeconomic status (e.g., income level, educational attainment), health behaviors, and medication adherence, and these factors might affect the study findings. For instance, patients with higher socioeconomic status may be more likely to seek specialist care, which positively affects the patient's adherence to treatment; these factors could also contribute to improved cardiovascular outcomes. E-value was calculated to assess the robustness of our findings to unmeasured confounding, and 2.35 was considered modestly robust, suggesting that the effect of unmeasured confounders is unlikely to alter the findings. Third, exposure status was only assessed at baseline. Furthermore, due to the limitations of the UHDATA Database, we were unable to evaluate whether patients sought care at the hypertension departments of other medical institutions after the index date, which may have led to an underestimation of the effect observed in our study.
5 Conclusion
In conclusion, this study demonstrated a significant association between medical care provided by hypertension specialists and a reduced risk of MACE in patients with uncontrolled hypertension. Our findings suggest that hypertension specialist care might play an essential role in improving cardiovascular outcomes among this high CVD risk population.
Statements
Data availability statement
The original contributions presented in the study are included in the article/Supplementary Material, further inquiries can be directed to the corresponding author.
Ethics statement
The studies involving humans were approved by ethics committee of People's Hospital of Xinjiang Uygur Autonomous Region. The studies were conducted in accordance with the local legislation and institutional requirements. The ethics committee/institutional review board waived the requirement for written informed consent for participation from the participants or the participants' legal guardians/next of kin; because of the study's retrospective nature, no additional informed consent was required.
Author contributions
LC: Writing – review & editing, Investigation, Conceptualization, Writing – original draft, Validation, Data curation. LY: Data curation, Writing – original draft. QZ: Writing – review & editing, Supervision, Investigation. S-sL: Data curation, Writing – review & editing. D-lW: Software, Validation, Writing – review & editing. JH: Writing – review & editing, Project administration. MH: Methodology, Writing – review & editing. N-fL: Validation, Conceptualization, Writing – review & editing, Funding acquisition. The Hypertension Specialists Medical Care Study Research Group: Writing – review & editing, Resources.
Funding
The author(s) declared that financial support was received for this work and/or its publication. This work was supported by the Project of Scientific and Technological Innovation Team in the “Tianshan Talents” Training Program of Xinjiang Uygur Autonomous Region, China (2023TSYCTD0016). This funding agency had no role in the design of the study and collection, analysis, and interpretation of data, or writing the manuscript.
Acknowledgments
Thanks are due to the participants and researchers of the UHDATA database. Notably, part of these findings, presented in abstract form, received the American Heart Association 2024 Paul Dudley White International Scholar Award.
Conflict of interest
The author(s) declared that this work was conducted in the absence of any commercial or financial relationships that could be construed as a potential conflict of interest.
Generative AI statement
The author(s) declared that generative AI was not used in the creation of this manuscript.
Any alternative text (alt text) provided alongside figures in this article has been generated by Frontiers with the support of artificial intelligence and reasonable efforts have been made to ensure accuracy, including review by the authors wherever possible. If you identify any issues, please contact us.
Publisher’s note
All claims expressed in this article are solely those of the authors and do not necessarily represent those of their affiliated organizations, or those of the publisher, the editors and the reviewers. Any product that may be evaluated in this article, or claim that may be made by its manufacturer, is not guaranteed or endorsed by the publisher.
Supplementary material
The Supplementary Material for this article can be found online at: https://www.frontiersin.org/articles/10.3389/fcvm.2026.1697092/full#supplementary-material
The Members of Hypertension Specialists Medical Care Study Research Group
De-lian Zhang, Qin Luo, Meng-hui Wang, Jun-li Hu, Guo-liang Wang, Ying-chun Wang, Nuerguli Maimaiti, Ke-ming Zhou, Lei Wang, Xiao-guang Yao, Wen Jiang, Le Sun.
References
1.
Forouzanfar MH Liu P Roth GA Ng M Biryukov S Marczak L et al Global burden of hypertension and systolic blood pressure of at least 110–115 mm Hg, 1990–2015. JAMA. (2017) 317(2):165–82. 10.1001/jama.2016.19043
2.
GBD 2019 Risk Factors Collaborators. Global burden of 87 risk factors in 204 countries and territories, 1990–2019: a systematic analysis for the Global Burden of Disease Study 2019. Lancet. (2020) 396:1223–49. 10.1016/S0140-6736(20)30752-2
3.
Benjamin EJ Virani SS Callaway CW Chamberlain AM Chang AR Cheng S et al Heart disease and stroke statistics-2018 update: a report from the American Heart Association. Circulation. (2018) 137(12):e67–492. 10.1161/CIR.0000000000000558
4.
Berenson GS Srinivasan SR Bao W Newman WP 3rd Tracy RE Wattigney WA . Association between multiple cardiovascular risk factors and atherosclerosis in children and young adults. The Bogalusa heart study. N Engl JMed. (1998) 338(23):1650–6. 10.1056/NEJM199806043382302
5.
Gay HC Rao SG Vaccarino V MK A . Effects of different dietary interventions on blood pressure: systematic review and meta-analysis of randomized controlled trials. Hypertension. (2016) 67:733–9. 10.1161/HYPERTENSIONAHA.115.06853
6.
Ettehad D Emdin CA Kiran A Anderson SG Callender T Emberson J et al Blood pressure lowering for prevention of cardiovascular disease and death: a systematic review and meta-analysis. Lancet. (2016) 387:957–67. 10.1016/S0140-6736(15)01225-8
7.
NCD Risk Factor Collaboration (NCD-RisC). Worldwide trends in hypertension prevalence and progress in treatment and control from 1990 to 2019: a pooled analysis of 1201 population-representative studies with 104 million participants. Lancet. (2021) 398:957–80. 10.1016/S0140-6736(21)01330-1
8.
World Health Organization. Global Report on Hypertension: The Race Against a Silent Killer. Geneva, Switzerland: World Health Organization (2023). p. 1–276.
9.
Zheng C Wang X Gu R Wang W Tian Y Pei X et al The burden of cardiovascular disease in China: incidence estimates from national surveillance (2023). J Am Coll Cardiol. (2025) 8:S0735-1097(25)07615-6. 10.1016/j.jacc.2025.08.060
10.
Zhou D Xi B Zhao M Wang L Veeranki SP . Uncontrolled hypertension increases risk of all-cause and cardiovascular disease mortality in US adults: the NHANES III linked mortality study. Sci Rep. (2018) 8(1):9418. 10.1038/s41598-018-27377-2
11.
Wang TJ Vasan RS . Epidemiology of uncontrolled hypertension in the United States. Circulation. (2005) 112(11):1651–62. 10.1161/CIRCULATIONAHA.104.490599
12.
Birkhead JS Weston C Lowe D . Impact of specialty of admitting physician and type of hospital on care and outcome for myocardial infarction in England and Wales during 2004–5: observational study. Br Med J. (2006) 332(7553):1306–11. 10.1136/bmj.38849.440914.AE
13.
Eaton CB Murphy JB Hunt VR . Outcome of acute myocardial infarction according to the specialty of the admitting physician. N Engl J Med. (1997) 336(22):1608–9. 10.1056/NEJM199705293362214
14.
Perino AC Fan J Schmitt SK Askari M Kaiser DW Deshmukh A et al Treating specialty and outcomes in newly diagnosed atrial fibrillation: from the TREAT-AF study. J Am Coll Cardiol. (2017) 70(1):78–86. 10.1016/j.jacc.2017.04.054
15.
Denker MG Haddad DB Townsend RR Cohen DL . Blood pressure control 1 year after referral to a hypertension specialist. J Clin Hypertens (Greenwich). (2013) 15(9):624–9. 10.1111/jch.12146
16.
Irons BK Meyerrose G Laguardia S Hazel K Seifert CF . A collaborative cardiologist-pharmacist care model to improve hypertension management in patients with or at high risk for cardiovascular disease. Pharm Pract (Granada). (2012) 10(1):25–32. 10.4321/s1886-36552012000100005
17.
Sakima A Yamazato M Kohagura K Ishida A Matayoshi T Tana T et al Achievement rate of target blood pressure in patients with hypertension treated by hypertension specialists and non-specialists in a real-world setting. Hypertens Res. (2023) 46(11):2460–9. 10.1038/s41440-023-01362-3
18.
Elliott WJ Egan B Giles TD Bakris GL White WB Sansone TM . Rationale for establishing a mechanism to increase reimbursement to hypertension specialists. J Clin Hypertens (Greenwich). (2013) 15(6):397–403. 10.1111/jch.12090
19.
Li N Zhu Q Dang Y Zhou Y Cai X Heizhati M et al Development and implementation of a dynamically updated big data intelligence platform using electronic medical records for secondary hypertension. Rev Cardiovasc Med. (2024) 25(3):104. 10.31083/j.rcm2503104
20.
Margolis KL Dehmer SP Sperl-Hillen J O'Connor PJ Asche SE Bergdall AR et al Cardiovascular events and costs with home blood pressure telemonitoring and pharmacist management for uncontrolled hypertension. Hypertension. (2020) 76(4):1097–103. 10.1161/HYPERTENSIONAHA.120.15492
21.
Al-Makki A DiPette D Whelton PK Murad MH Mustafa RA Acharya S et al Hypertension pharmacological treatment in adults: a world health organization guideline executive summary. Hypertension. (2022) 79(1):293–301. 10.1161/HYPERTENSIONAHA.121.18192
22.
Malozowski S Malozowski S Reboussin DM . Cardiovascular safety of testosterone-replacement therapy. N Engl J Med. (2023) 389(12):1149. 10.1056/NEJMc2309389
23.
Nissen SE Lincoff AM Brennan D Ray KK Mason D Kastelein JJP et al Bempedoic acid and cardiovascular outcomes in statin-intolerant patients. N Engl J Med. (2023) 388(15):1353–64. 10.1056/NEJMoa2215024
24.
Zhang Y Zhu Z Gao C . Polypill strategy in secondary cardiovascular prevention. N Engl J Med. (2022) 387(23):2197. 10.1056/NEJMc2213446
25.
Austin PC Fine JP . Practical recommendations for reporting fine-gray model analyses for competing risk data. Stat Med. (2017) 36:4391–400. 10.1002/sim.7501
26.
Abdel-Qadir H Fang J Lee DS Tu JV Amir E Austin PC et al Importance of considering competing risks in time-to-event analyses: application to stroke risk in a retrospective cohort study of elderly patients with atrial fibrillation. Circ Cardiovasc Qual Outcomes. (2018) 11(7):e004580. 10.1161/CIRCOUTCOMES.118.004580
27.
Mathur MB Ding P Riddell CA VanderWeele TJ . Web site and R package for computing E-values. Epidemiology. (2018) 29(5):e45–7. 10.1097/EDE.0000000000000864
28.
Xu S Ross C Raebel MA Shetterly S Blanchette C Smith D . Use of stabilized inverse propensity scores as weights to directly estimate relative risk and its confidence intervals. Value Health. (2010) 13(2):273–7. 10.1111/j.1524-4733.2009.00671.x
29.
Sun Y Mu J Wang DW Ouyang N Xing L Guo X et al A village doctor-led multifaceted intervention for blood pressure control in rural China: an open, cluster randomised trial. Lancet. (2022) 399(10339):1964–75. 10.1016/S0140-6736(22)00325-7
30.
He J Ouyang N Guo X Sun G Li Z Mu J et al Effectiveness of a non-physician community health-care provider-led intensive blood pressure intervention versus usual care on cardiovascular disease (CRHCP): an open-label, blinded-endpoint, cluster-randomised trial. Lancet. (2023) 401(10380):928–38. 10.1016/S0140-6736(22)02603-4
31.
Yu EYT Wan EYF Mak IL Chao DVK Ko WWK Leung M et al Assessment of hypertension complications and health service use 5 years after implementation of a multicomponent intervention. JAMA Netw Open. (2023) 6(5):e2315064. 10.1001/jamanetworkopen.2023.15064
32.
Yoshida T Nishigaki N Saita S Shimasaki Y Hasebe N . Perspectives of patients and physicians regarding hypertensive management from an online survey for excellence: a subanalysis of the PARADOX study by physician categories. Hypertens Res. (2020) 43(5):431–41. 10.1038/s41440-019-0365-9
33.
Nishigaki N Shimasaki Y Yoshida T Hasebe N . Physician and patient perspectives on hypertension management and factors associated with lifestyle modifications in Japan: results from an online survey. Hypertens Res. (2020) 43(5):450–62. 10.1038/s41440-020-0398-0
34.
Burnier M Prejbisz A Weber T Azizi M Cunha V Versmissen J et al Hypertension healthcare professional beliefs and behaviour regarding patient medication adherence: a survey conducted among European Society of Hypertension Centres of Excellence. Blood Press. (2021) 30(5):282–90. 10.1080/08037051.2021.1963209
35.
Monticone S D'Ascenzo F Moretti C Williams TA Veglio F Gaita F et al Cardiovascular events and target organ damage in primary aldosteronism compared with essential hypertension: a systematic review and meta-analysis. Lancet Diabetes Endocrinol. (2018) 6(1):41–50. 10.1016/S2213-8587(17)30319-4
36.
Cingolani OH . Cardiovascular risks and organ damage in secondary hypertension. Endocrinol Metab Clin North Am. (2019) 48(4):657–66. 10.1016/j.ecl.2019.08.015
37.
Zhang L Li J Li N Sun N Xie L Han Q et al Trends in cause-related comorbidities in hospitalized patients with secondary hypertension in China from 2013 to 2016: a retrospective analysis of hospital quality monitoring system data. J Hypertens. (2021) 39(10):2015–21. 10.1097/HJH.0000000000002891
38.
Kotliar C Obregón S Koretzky M Botto F Di Leva A Boscaro M et al Improved identification of secondary hypertension: use of a systematic protocol. Ann Transl Med. (2018) 6(15):293. 10.21037/atm.2018.06.25
39.
Sarathy H Salman LA Lee C Cohen JB . Evaluation and management of secondary hypertension. Med Clin North Am. (2022) 106(2):269–83. 10.1016/j.mcna.2021.11.004
40.
Gupta G Teo AED Swee DS Loh LM Chuah M Loh WJ et al Prolonged hypokalemia and delayed diagnosis of primary aldosteronism: clinical course and risk factors. J Clin Endocrinol Metab. (2024) 109(8):e1574–81. 10.1210/clinem/dgad752
41.
Lin X Ullah MHE Wu X Xu F Shan SK Lei LM et al Cerebro-cardiovascular risk, target organ damage, and treatment outcomes in primary aldosteronism. Front Cardiovasc Med. (2022) 8:798364. 10.3389/fcvm.2021.798364
Summary
Keywords
a retrospective cohort, hypertension specialists, major adverse cardiovascular events, medical care, uncontrolled hypertension
Citation
Cai L, Yao L, Zhu Q, Liu S-s, Wang D-l, Hong J, Heizhati M, Li N-f and the Hypertension Specialists Medical Care Study Research Group (2026) Association between care by hypertension specialists and major adverse cardiovascular events in patients with uncontrolled hypertension. Front. Cardiovasc. Med. 13:1697092. doi: 10.3389/fcvm.2026.1697092
Received
01 September 2025
Revised
06 January 2026
Accepted
20 January 2026
Published
09 February 2026
Volume
13 - 2026
Edited by
Otto Alexander Sanchez, Minneapolis Heart Institute Foundation (MHIF), United States
Reviewed by
Zhecong Yu, Hangzhou Center for Disease Control and Prevention (HZCDC), China
Anas Abed, Al-Ahliyya Amman University, Jordan
Updates
Copyright
© 2026 Cai, Yao, Zhu, Liu, Wang, Hong, Heizhati, Li and the Hypertension Specialists Medical Care Study Research Group.
This is an open-access article distributed under the terms of the Creative Commons Attribution License (CC BY). The use, distribution or reproduction in other forums is permitted, provided the original author(s) and the copyright owner(s) are credited and that the original publication in this journal is cited, in accordance with accepted academic practice. No use, distribution or reproduction is permitted which does not comply with these terms.
* Correspondence: Nan-fang Li lnanfang2016@sina.com
Disclaimer
All claims expressed in this article are solely those of the authors and do not necessarily represent those of their affiliated organizations, or those of the publisher, the editors and the reviewers. Any product that may be evaluated in this article or claim that may be made by its manufacturer is not guaranteed or endorsed by the publisher.