Abstract
Purpose:
Neutrophils are well-established biomarkers of systemic inflammation, whereas serum albumin levels are commonly used as reliable indicators of nutritional status. The neutrophil percentage-to-albumin ratio (NPAR), a novel composite biomarker integrating inflammatory and nutritional parameters, has shown promising predictive value across a range of clinical settings. However, its association with outcomes in patients with acute coronary syndrome (ACS) remains unclear. This study aimed to evaluate the prognostic utility of NPAR for predicting major adverse cardiovascular events (MACEs) in patients with ACS.
Patients and methods:
From January 2016 to December 2018, 1553 consecutive patients with ACS undergoing percutaneous coronary intervention (PCI) were enrolled at the Affiliated Hospital of Chengde Medical University. The NPAR was calculated as the admission neutrophil percentage divided by serum albumin concentration. Serum albumin was measured in g/L and converted to g/dL (dividing by 10) for NPAR calculation to align with conventional units. The primary follow-up endpoints were MACEs, comprising all-cause mortality and heart failure readmission.
Results:
During follow-up, 1,524 patients completed the study; 55 of them experienced MACEs. The NPAR levels differed significantly between the MACE and non-MACE groups (P < 0.001). Receiver operating characteristic (ROC) analysis demonstrated an area under the curve (AUC) of 0.700 for the NPAR in predicting MACEs (95% CI: 0.635–0.766; P < 0.001), with an optimal cutoff value of 17.326 determined using the Youden index. Kaplan–Meier analysis revealed significantly lower cumulative event-free survival in the high NPAR group (≥17.326) compared to the low NPAR group (<17.326) [log-rank P < 0.001]. Multivariable Cox regression identified four independent predictors of MACEs: age ≥ 65 years [hazard ratio [HR]: 2.944, 95% confidence interval [CI]: 1.653–5.245, P < 0.001]; left ventricular ejection fraction <40% (HR: 6.114, 95% CI: 2.786–13.419, P < 0.001); serum creatinine > 110 μmol/L (HR: 3.768, 95% CI: 1.336–10.631, P = 0.012), and NPAR ≥ 17.326 (HR: 3.014, 95% CI: 1.418–6.405, P = 0.004). Restricted cubic spline analysis confirmed a positive dose-response relationship, showing progressively increased MACE risk with rising NPAR levels (P < 0.001).
Conclusion:
NPAR ≥ 17.326 is an independent prognostic risk factor for patients with ACS undergoing PCI and may be a valuable clinical marker for identifying high-risk patients.
Graphical Abstract
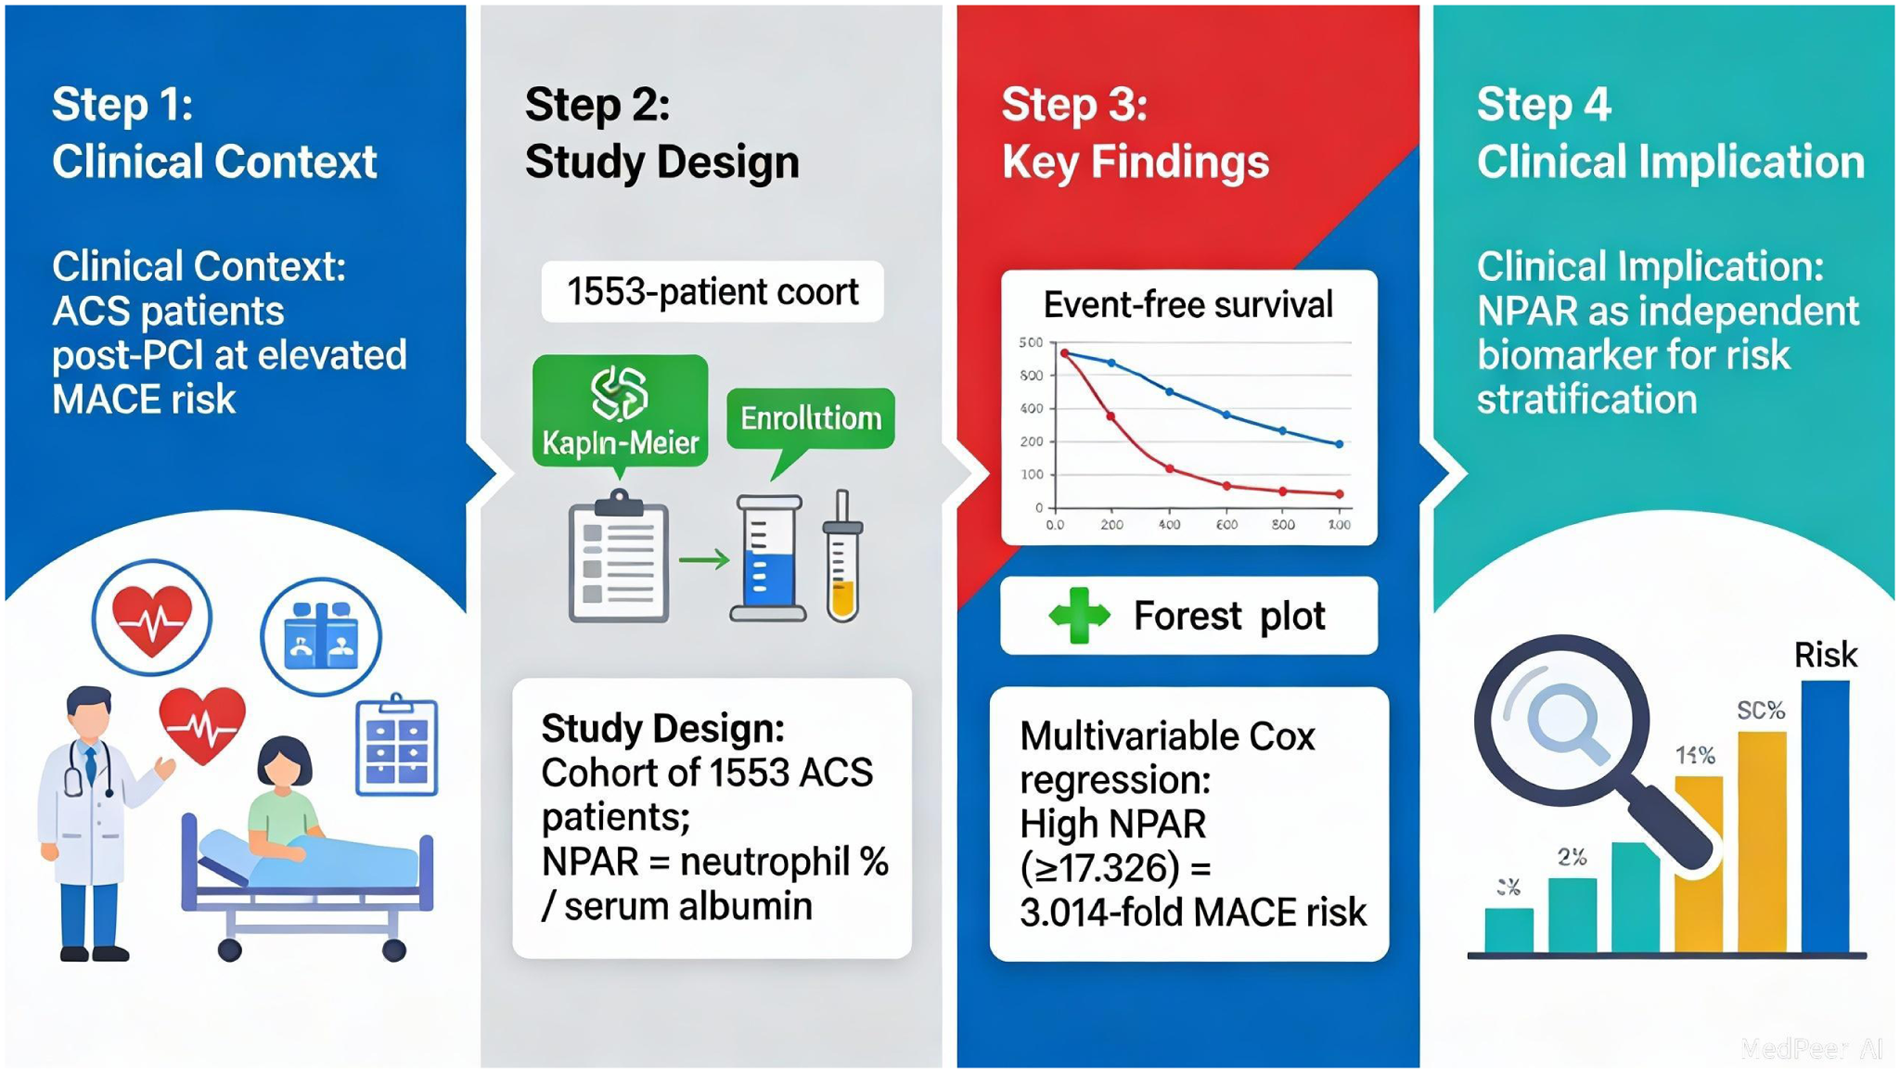
Graphical summary.
1 Introduction
Despite significant advancements in diagnostic techniques and therapeutic strategies, acute coronary syndrome (ACS) remains a leading cause of global mortality, imposing substantial economic and public health burdens on healthcare systems worldwide (1). Inflammation plays a pivotal role in the progression, destabilization, and rupture of atherosclerotic plaques, which are key events leading to thrombotic complications. However, the clinical utility of conventional inflammatory biomarkers for predicting prognosis in patients with ACS is often limited by insufficient specificity and suboptimal cost-effectiveness.
The neutrophil-to-albumin ratio (NPAR), a novel composite biomarker calculated by dividing the percentage of neutrophils by serum albumin concentration, captures two essential pathophysiological processes: systemic inflammation (reflected by elevated neutrophil levels) and impaired nutritional status or heightened inflammatory response (indicated by hypoalbuminemia). A growing body of evidence indicates that elevated NPAR levels are significantly associated with the presence and severity of non-alcoholic fatty liver disease [NAFLD] (2, 3), increased risk of diabetic retinopathy (DR) in individuals with diabetes mellitus (4), higher incidence of stroke-associated pneumonia, and poor functional outcomes following spontaneous intracerebral hemorrhage (5), as well as increased all-cause mortality among critically ill patients with acute kidney injury (6). Furthermore, in respiratory diseases such as chronic obstructive pulmonary disease (COPD), elevated NPAR has been identified as an independent predictor of all-cause mortality, cardiovascular mortality, and mortality due to chronic lower respiratory diseases, demonstrating superior predictive performance for 5-year all-cause mortality (7). Among critically ill patients diagnosed with coronary artery disease (CAD), elevated admission NPAR levels have been independently linked to significantly increased risks of all-cause mortality at 30, 90, and 365 days after admission (8). In addition, in patients with advanced heart failure—a severe cardiovascular condition frequently associated with ischemic heart disease—elevated NPAR has been validated as an independent prognostic marker for 1-year mortality, showing favorable discriminatory ability (AUC = 0.785) (9). Although the prognostic value of the NPAR has been well-established across various clinical settings, particularly in major cardiovascular diseases such as CAD and heart failure, its potential association with clinical outcomes in patients with ACS has not been adequately investigated. Therefore, this study aimed to evaluate the relationship between NPAR levels and the risk of major adverse cardiovascular events (MACE) in patients diagnosed with ACS who underwent percutaneous coronary intervention (PCI).
2 Materials and methods
2.1 Study population
In the present study, a total of 1,553 patients diagnosed with ACS who underwent PCI between January 2016 and December 2018 at the Department of Cardiology, the Affiliated Hospital of Chengde Medical University (Hebei, China), were consecutively enrolled. All patients underwent coronary angiography and PCI, which were performed by experienced cardiologists.
The inclusion criteria were as follows: (1) age ≥ 18 years; (2) diagnosis of clinical ACS subtypes, including ST-segment elevation myocardial infarction (STEMI), non-ST-segment elevation myocardial infarction, and unstable angina (UA), based on the 2013 ACCF/AHA Guideline for the Management of ST-Elevation Myocardial Infarction and the 2014 AHA/ACC Guideline for the Management of Patients with Non-ST-Elevation Acute Coronary Syndromes; and (3) presence of ≥50% luminal stenosis in at least one major coronary artery branch confirmed using coronary angiography.
Patients meeting any of the following criteria were excluded: (1) in-hospital death; (2) severe structural heart disease (including hypertrophic cardiomyopathy, myocarditis, or severe valvular disease); (3) active systemic inflammatory conditions such as acute/severe infections, connective tissue disorders, and secondary coronary vasculitis; (4) end-stage organ dysfunction, including severe hepatic impairment (Child–Pugh C) and end-stage renal disease (eGFR < 15 mL/min/1.73 m²); (5) prior coronary artery bypass grafting; and (6) critical baseline data missing (>10% variables).
This study was approved by the Ethics Committee of the Affiliated Hospital of Chengde Medical University (approval Number: CYFYLL2021036) and conducted in accordance with the ethical principles stated in the Declaration of Helsinki. All participants provided written informed consent prior to enrollment.
2.2 Baseline demographics and clinical characteristics
The cardiovascular research team collected comprehensive data on the demographic and clinical characteristics of the enrolled patients. Hypertension was defined as a resting systolic blood pressure ≥ 140 mmHg and/or diastolic blood pressure ≥ 90 mmHg or a prior physician diagnosis of hypertension with current antihypertensive therapy (10). Type 2 diabetes mellitus was defined as either: (1) the presence of classic diabetes symptoms (e.g., polyuria, polydipsia, unexplained weight loss) plus a random plasma glucose level ≥ 11.1 mmol/L; (2) a fasting plasma glucose level ≥ 7.0 mmol/L; (3) a 2 h plasma glucose level ≥ 11.1 mmol/L during a 75 g oral glucose tolerance test; or (4) in the absence of classic symptoms, the confirmation of hyperglycemia meeting any of the above criteria (fasting, random, or 2 h OGTT) on at least two separate occasions (11). Dyslipidemia was defined as a serum total cholesterol level ≥ 5.18 mmol/L, high-density lipoprotein cholesterol level ≤ 1.04 mmol/L, low-density lipoprotein cholesterol (LDL-C) level ≥ 3.37 mmol/L, or triglyceride level ≥ 1.7 mmol/L or a prior physician diagnosis of dyslipidemia with current lipid-lowering medication (12).
2.3 Follow-up and endpoints
Follow-ups were conducted by cardiovascular physicians using a standardized protocol to minimize bias. Data were collected during clinical visits at 1, 3, 6, and 12 months, and annually thereafter. The primary endpoint was major adverse cardiovascular events (MACE), defined as a composite of all-cause mortality and heart failure-related rehospitalization.
2.4 Statistical analysis
The Kolmogorov–Smirnov test was used to assess the normality of continuous variables. Variables that followed a normal distribution were presented as mean ± standard deviation, whereas those with skewed distributions were summarized using the median and interquartile range. Differences in non-normally distributed continuous variables between the MACEs and non-MACEs groups were analyzed using the Mann–Whitney U test. Categorical variables were expressed as frequencies and percentages and compared using the chi-square (χ²) test. The Kaplan–Meier method was used to estimate the cumulative incidence of adverse cardiovascular events across groups, and the log-rank test was applied to assess statistically significant differences between survival curves. Receiver operating characteristic (ROC) analysis was performed to evaluate the diagnostic accuracy of NPAR, with the optimal cutoff value determined by maximizing the Youden index (sensitivity + specificity − 1). To assess the robustness of the optimal cut-off value of NPAR determined by the Youden index, we conducted Bootstrap internal validation. Using random sampling with replacement, 1,000 Bootstrap samples (each n = 1,524) were generated from the final analysis cohort. In each sample, the ROC analysis was rerun to recalculate the optimal NPAR cut-off value for predicting MACE. Time-dependent ROC curves were further constructed to assess the predictive performance of the NPAR across different time points. A potential dose-response relationship between the NPAR and the risk of MACEs among patients with ACS undergoing PCI was explored using restricted cubic spline (RCS) regression. Univariate and multivariate Cox proportional hazards models were conducted to determine the prognostic value of the NPAR in predicting the risk of MACEs.
All statistical analyses were performed using SPSS (version 27.0.1, SPSS Inc., Chicago, IL, USA), GraphPad Prism 8.0 (GraphPad Software Inc., La Jolla, CA, USA), and R version 4.3.3. A two-sided P value < 0.05 was considered statistically significant, and no correction was made for multiple comparisons.
2.5 Data imputation for missing values
The rate of missing baseline variables in this study was below 5% for all included variables. To maximize data utilization and minimize potential bias, we performed data imputation as follows: for missing values in continuous variables, imputation was performed with the median value within clinically relevant subgroups (e.g., ACS subtypes); for missing values in categorical variables, imputation was performed with the mode of that variable. All subsequent statistical analyses were conducted based on the imputed dataset.
3 Results
3.1 Patients' characteristics
Of the 1,553 patients with ACS, 29 were excluded from the analysis. Exclusions were due to concomitant infectious diseases (n = 8), coexisting hematologic disorders (n = 6), a diagnosis of acute myocardial infarction with malignant tumors (n = 5), or loss to follow-up (n = 10). Ultimately, 1,524 patients who completed the follow-up were included, with a median follow-up duration of 1,123 days (approximately 3.0 years) (Figure 1).
Figure 1
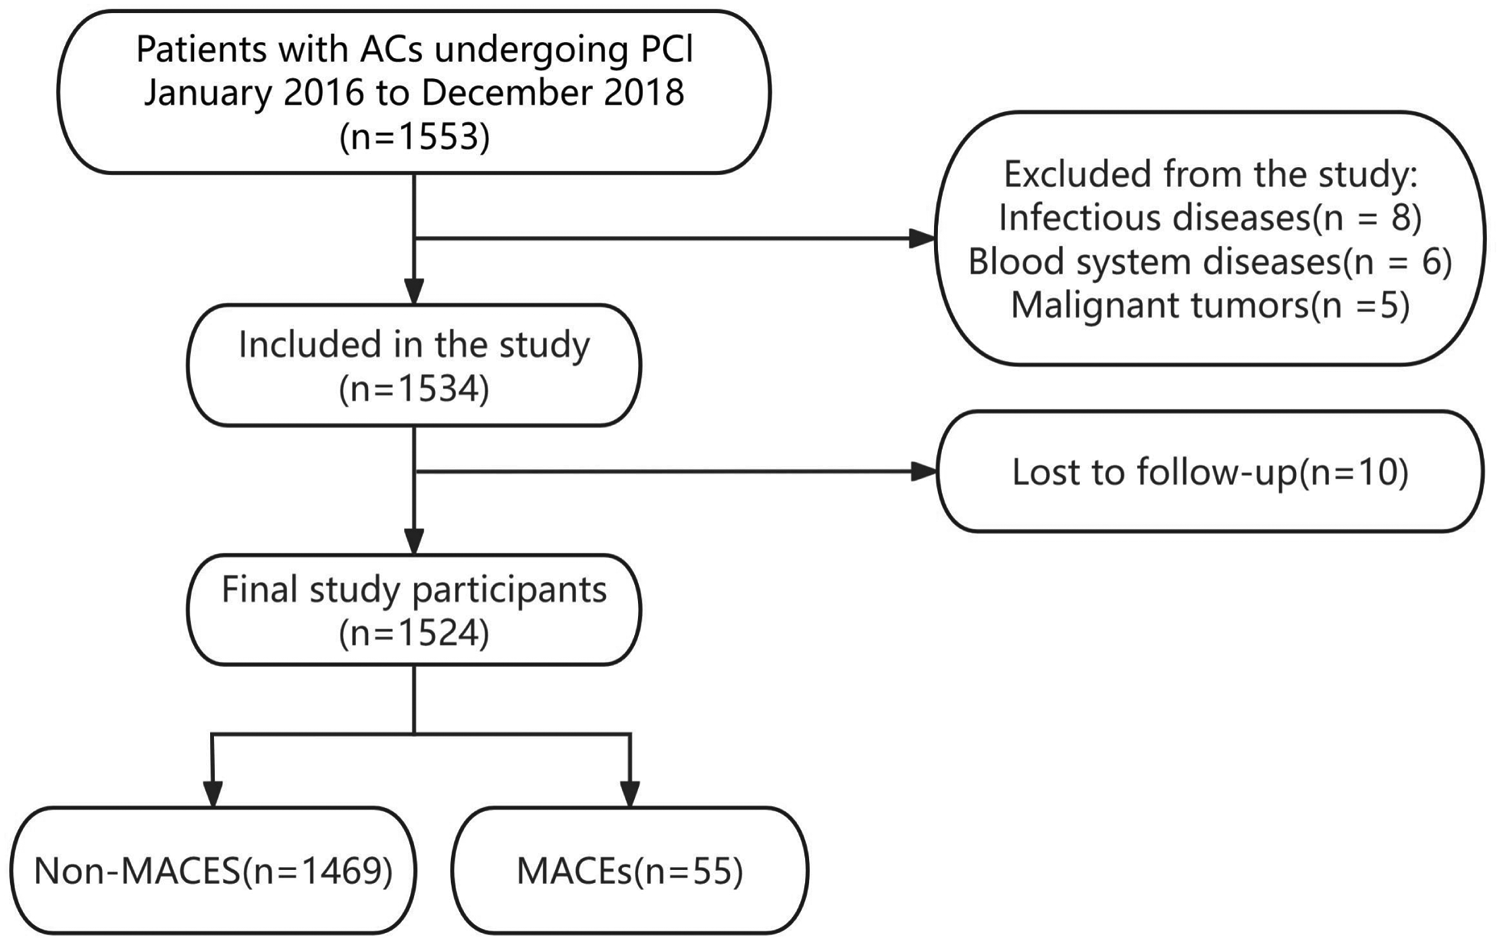
Study flowchart.
Among the 1,524 patients with ACS who underwent PCI, 55 experienced MACEs, including 51 all-cause deaths and four rehospitalizations attributable to heart failure. Table 1 presents the baseline clinical characteristics stratified by MACE occurrence. Significant intergroup differences (P < 0.05) were observed in age, serum creatinine (sCr), left ventricular ejection fraction (LVEF), ischemic stroke, creatine kinase MB (CK-MB), unstable angina (UA), and NPAR values between the MACEs and non-MACEs groups.
Table 1
| Variables | MACEs group (n = 55) | Non-MACEs group (n = 1,469) | χ2/Z | P-value |
|---|---|---|---|---|
| Demographic | ||||
| Male | 40 (72.7%) | 1,102 (75.0%) | 0.148 | 0.700 |
| Age (years) | 65.30 ± 8.11 | 58.67 ± 10.32 | −5.097 | <0.001 |
| Dyslipidemia | 34 (61.8%) | 833 (56.7%) | 0.565 | 0.452 |
| Hypertension | 31 (56.4%) | 865 (58.9%) | 0.139 | 0.709 |
| Diabetes mellitus | 14 (25.5%) | 375 (25.5%) | 0.001 | 0.990 |
| Ischemic stroke | 14 (25.5%) | 204 (13.9%) | 5.787 | 0.016 |
| Family history of CAD | 4 (7.3%) | 212 (14.4%) | 2.234 | 0.135 |
| Laboratory data | ||||
| WBC (109/L) | 8.89 ± 3.35 | 8.82 ± 3.34 | −1.018 | 0.209 |
| HGB (g/L) | 141.09 ± 13.79 | 146.83 ± 15.06 | −1.505 | 0.593 |
| PLT (109/L) | 208.62 ± 55.06 | 219.99 ± 55.59 | −0.356 | 0.722 |
| NEUT (109/L) | 6.36 (4.86,8.96) | 4.99 (3.69,7.42) | −3.274 | 0.001 |
| TC (mmol/L) | 4.42 ± 1.19 | 4.45 ± 1.05 | −0.330 | 0.742 |
| TG (mmol/L) | 1.28 (0.79,2.20) | 1.60 (1.05,2.44) | −2.003 | 0.052 |
| HDL-C (mmol/L) | 1.12 ± 0.28 | 1.12 ± 0.31 | −0.601 | 0.548 |
| LDL-C (mmol/L) | 2.46 ± 0.94 | 2.41 ± 0.85 | −0.014 | 0.989 |
| CK-MB (U/L) | 40.00 (11.00,123.49) | 16.27 (10.00,48.96) | −2.325 | 0.020 |
| sCr (umol/L) | 81.91 ± 29.25 | 69.21 ± 16.47 | −2.820 | 0.005 |
| UA (umol/L) | 334.08 ± 87.97 | 329.50 ± 92.21 | −0.418 | 0.676 |
| TP (g/L) | 69.95 (64.93,78.38) | 71.30 (66.70,75.45) | −0.132 | 0.895 |
| ALB (g/L) | 41.67 ± 4.62 | 40.75 ± 3.75 | −3.309 | 0.001 |
| NPAR | 26.423 ± 37.73 | 16.562 ± 5.38 | −1.937 | <0.001 |
| LVEF | 52.55 ± 12.20 | 57.21 ± 8.69 | −2.590 | 0.010 |
| LVEDD | 51.30 ± 6.59 | 50.90 ± 4.97 | −0.088 | 0.930 |
| Clinical classification of ACS | ||||
| UA | 14 (25.5%) | 595 (40.5%) | 5.004 | 0.025 |
| STEMI | 29 (52.7%) | 646 (44.0%) | 1.646 | 0.200 |
| Non-STEMI | 12 (21.8%) | 228 (15.5%) | 1.585 | 0.208 |
| Coronary angiography | ||||
| One-vessel lesion | 13 (23.6%) | 461 (31.4%) | 1.484 | 0.223 |
| Two-vessel lesion | 19 (34.5%) | 469 (31.9%) | 0.167 | 0.683 |
| Three-vessel lesion | 23 (41.8%) | 539 (36.7%) | 0.599 | 0.439 |
Baseline Patient characteristics of the MACEs and non-MACEs groups.
Data are presented as n (%) or median (range).
Data are expressed as count (percentage) for categorical variables, mean ± standard deviation or median (interquartile range) for numerical variables.
CAD, coronary artery disease; WBC, white blood cell; HGB, hemoglobin; PLT, platelet; NEUT, neutrophils; TC, total cholesterol; TG, triglyceride; HDL-C, high-density lipoprotein cholesterol; LDL-C, low density lipoprotein cholesterol; CK-MB, creatine kinase MB; Cr, creatinine; UA, uric acid; TP, total protein; ALB, albumin; NPAR, neutrophil percentage-to-albumin ratio; LVEF, left ventricular ejection fraction; UA, unstable angina; STEMI, ST-segment elevation myocardial infarction; Non-STEMI, non-ST-segment elevation myocardial infarction.
3.2 ROC curve, survival analysis, and time-dependent ROC
The ROC curve was constructed to evaluate the discriminatory ability of the NPAR in predicting MACEs. The area under the curve (AUC) for the NPAR was 0.700 [P < 0.001, 95% confidence interval (CI): 0.635–0.766] (Figure 2). According to the Youden index, the optimal diagnostic cut-off value for the NPAR was 17.326, yielding a sensitivity of 57.853% and a specificity of 82.143%. Accordingly, patients with ACS were categorized into the low NPAR (<17.326) and high NPAR (≥17.326) groups based on this threshold.
Figure 2
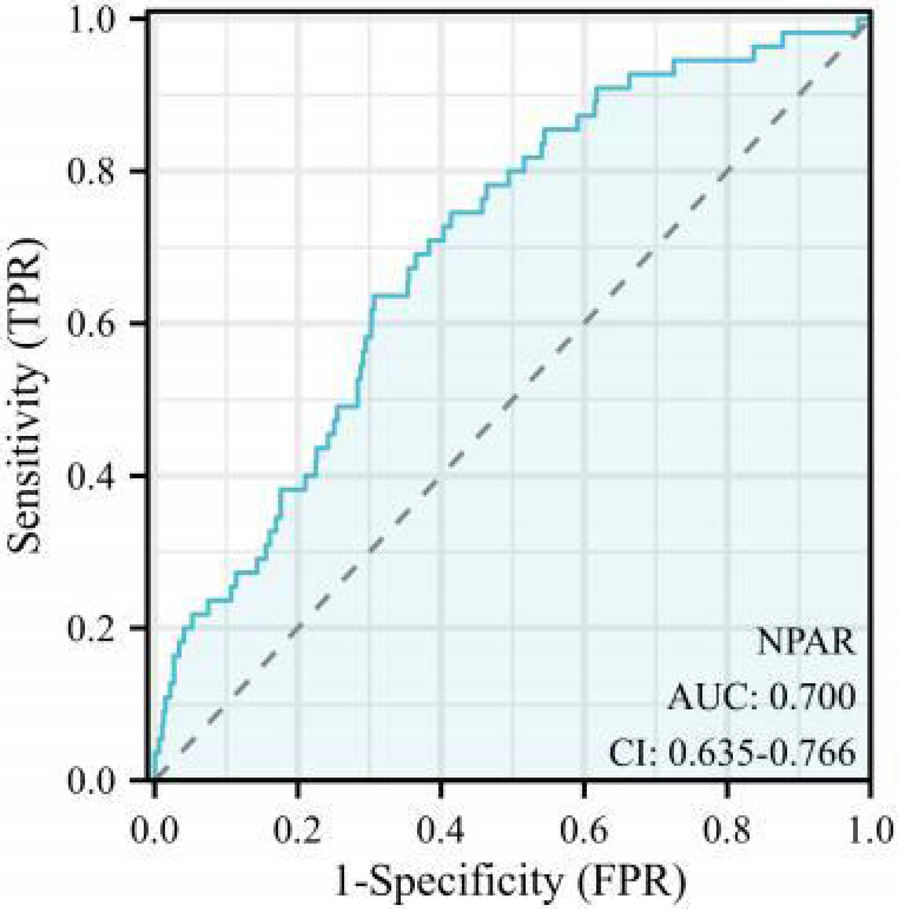
Receiver operating characteristic (ROC) curve. NPAR, neutrophil percentage-to-albumin.
3.3 Bootstrap internal validation
Bootstrap resampling analysis (1,000 iterations) was performed to validate the stability of the NPAR-based prediction model. The calibrated ROC curve showed an AUC of 0.703, which was highly consistent with the original AUC of 0.700 (Figure 3). At the optimal cut-off value (17.326), the sensitivity and specificity were 0.75 and 0.59, respectively, further confirming the robustness of the NPAR as a predictive marker within this cohort.
Figure 3
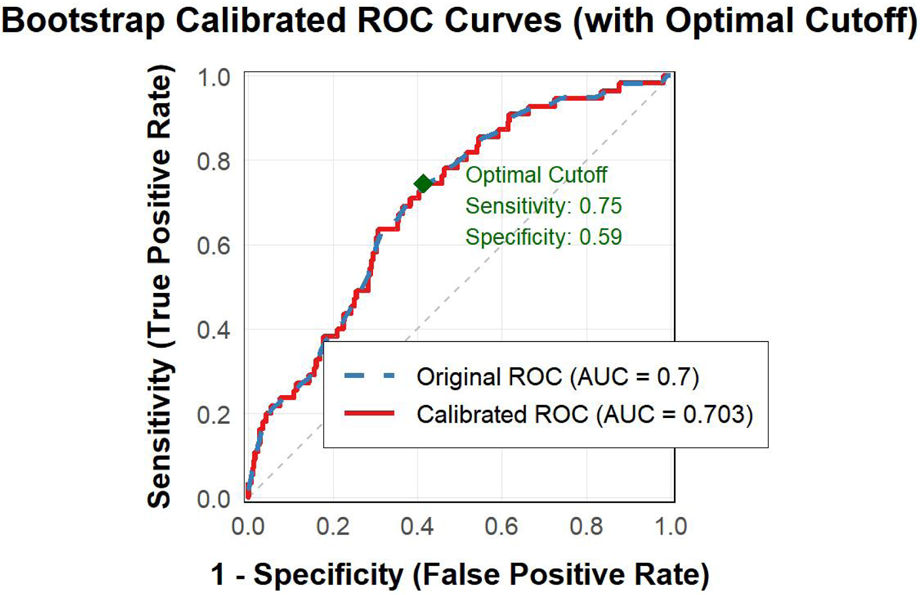
Bootstrap calibrated ROC curves.
The Kaplan–Meier curve (Figure 4) demonstrated that the high NPAR group exhibited significantly lower cumulative survival rates compared to the low NPAR group (log-rank P < 0.001).
Figure 4
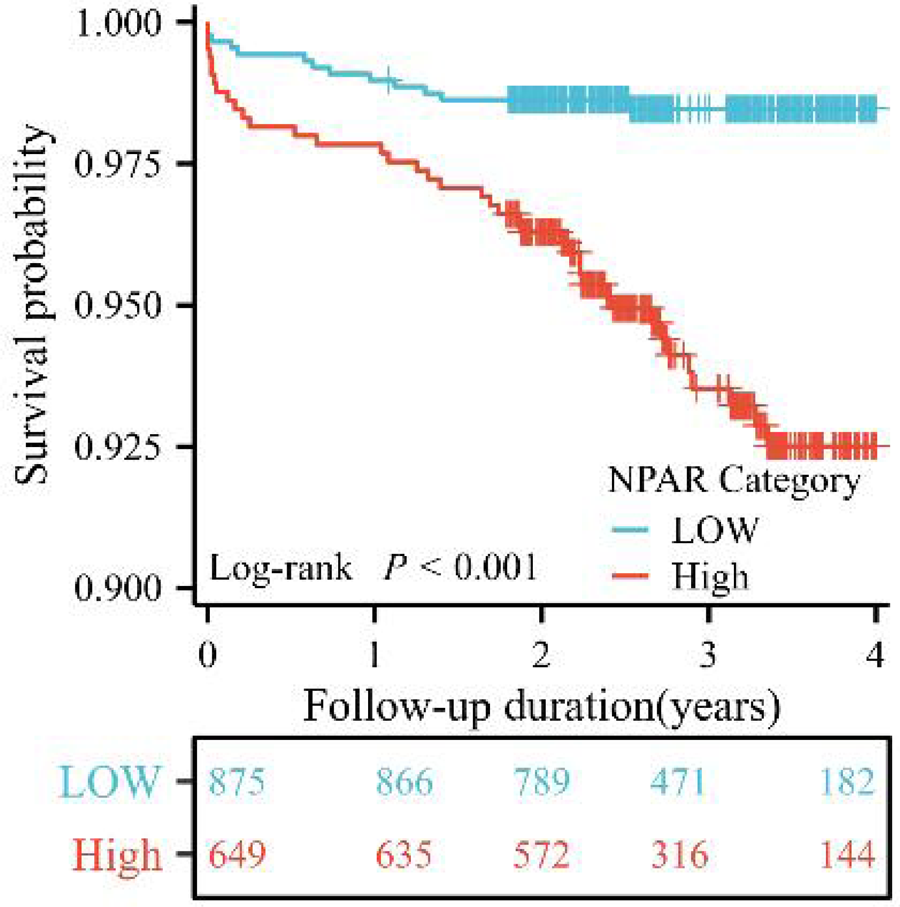
Kaplan–Meier curves of cumulative survival by NPAR in patients with ACS undergoing PCI (log-rank P < 0.001).
A time-dependent ROC analysis was subsequently performed to assess the temporal evolution of predictive performance. Figure 5A illustrates the time-dependent ROC curves, with 1-, 2-, and 3-year AUC values of 0.582, 0.644, and 0.715, respectively. As shown in Figure 5B, the time-dependent AUC analysis revealed that the NPAR maintained consistent predictive performance for the incidence of MACEs across various time intervals. Collectively, these results suggest that the NPAR demonstrates strong and sustained predictive utility for MACEs.
Figure 5
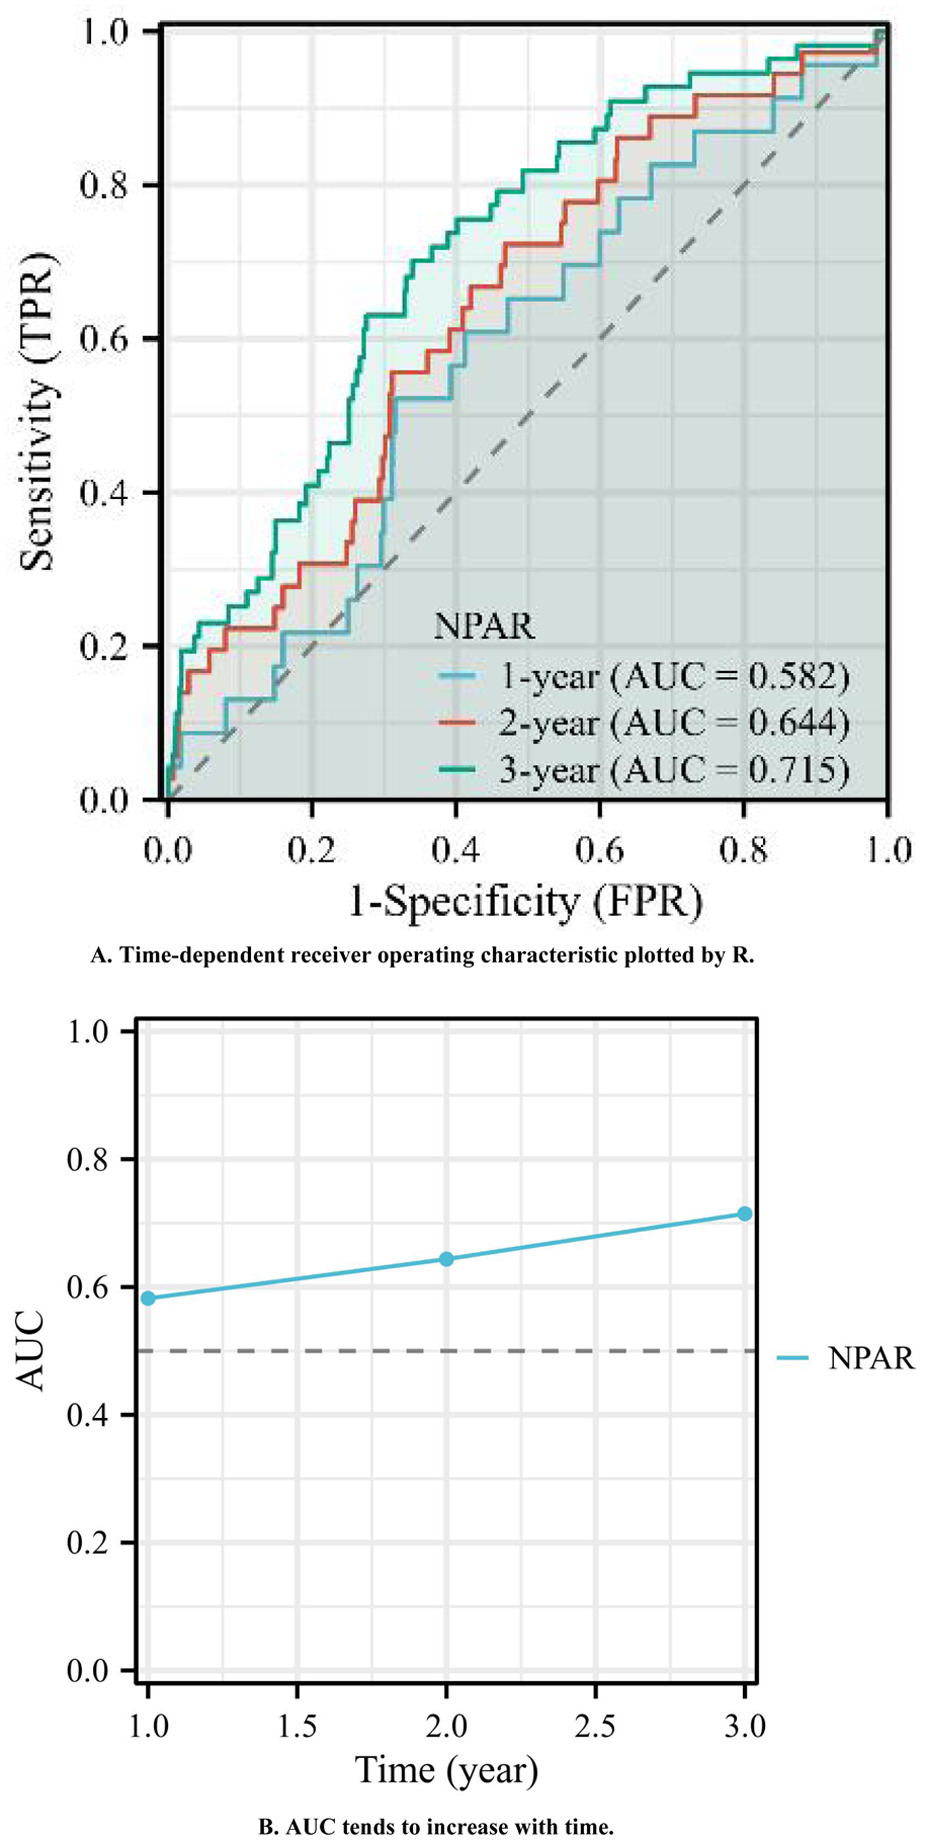
(A) Time-dependent receiver operating characteristic plotted by R. (B) AUC tends to increase with time.
3.4 Univariate and multivariate Cox hazard proportional models
As shown in Table 1, age, white blood cell count, ischemic stroke, sCr, CK-MB level, NPAR, LVEF, and UA showed significant differences. We transformed the continuous variables into categorical variables according to the following criteria: age ≥ 65 years old; white blood cell count ≥ 10 × 109/L, CK-MB ≥ 32 U/L, LVEF < 40%, and sCr > 110 μmol/L. Thereafter, we repeated univariate COX analysis. The results still showed significant differences (all P < 0.05) (Table 2).
Table 2
| Variables | Univariate HR (95% CI) | P-value |
|---|---|---|
| Age ≥ 65 years | 3.323 (1.957–5.642) | <0.001 |
| Ischemic stroke | 2.089 (1.139–3.832) | 0.017 |
| sCr > 110 μmol/L | 2.989 (1.080–8.273) | 0.035 |
| CK-MB > 32 U/L | 2.463 (1.416–4.282) | 0.001 |
| LVEF < 40% | 8.182 (3.831–17.473) | <0.001 |
| UA | 0.490 (0.267–0.899) | 0.021 |
| NPAR ≥ 17.326 | 4.051 (2.208–7.432) | <0.001 |
Univariate Cox hazard proportional model for predictive factors of MACEs.
Additionally, factors demonstrating clinical prognostic significance in univariate Cox proportional hazards analysis—age ≥ 65 years, LVEF < 40%, sCr > 110 μmol/L, and NPAR ≥ 17.326—were included in the multivariate Cox proportional hazards model. The results revealed the following independent predictors of MACEs: age ≥ 65 years (HR: 2.944, 95% CI: 1.653–5.245, P < 0.001); LVEF < 40% (HR: 6.114, 95% CI: 2.786–13.419, P < 0.001); sCr > 110 μmol/L (HR: 3.768, 95% CI: 1.336–10.631, P = 0.012); and NPAR ≥ 17.326 (HR: 3.014, 95% CI: 1.418–6.405, P = 0.004) (Table 3, Figure 6). Therefore, an elevated NPAR (≥17.326) independently correlated with an increased MACE risk in patients with ACS.
Table 3
| Variables | Multivariate HR (95% CI) | P-value |
|---|---|---|
| sCr > 110 μmol/L | 3.768 (1.336–10.631) | 0.012 |
| LVEF < 40% | 6.114 (2.786–13.419) | <0.001 |
| Age ≥ 65 years | 2.944 (1.653–5.245) | <0.001 |
| NPAR ≥ 17.326 | 3.014 (1.418–6.405) | 0.004 |
Multivariate Cox hazard proportional model for predictive factors of MACEs.
MACEs, major adverse cardiovascular events; LVEF, left ventricular ejection fraction; NPAR, neutrophil percentage-to-albumin ratio; sCr, serum creatinine; UA, unstable angina; CK-MB, creatine kinase MB.
Figure 6
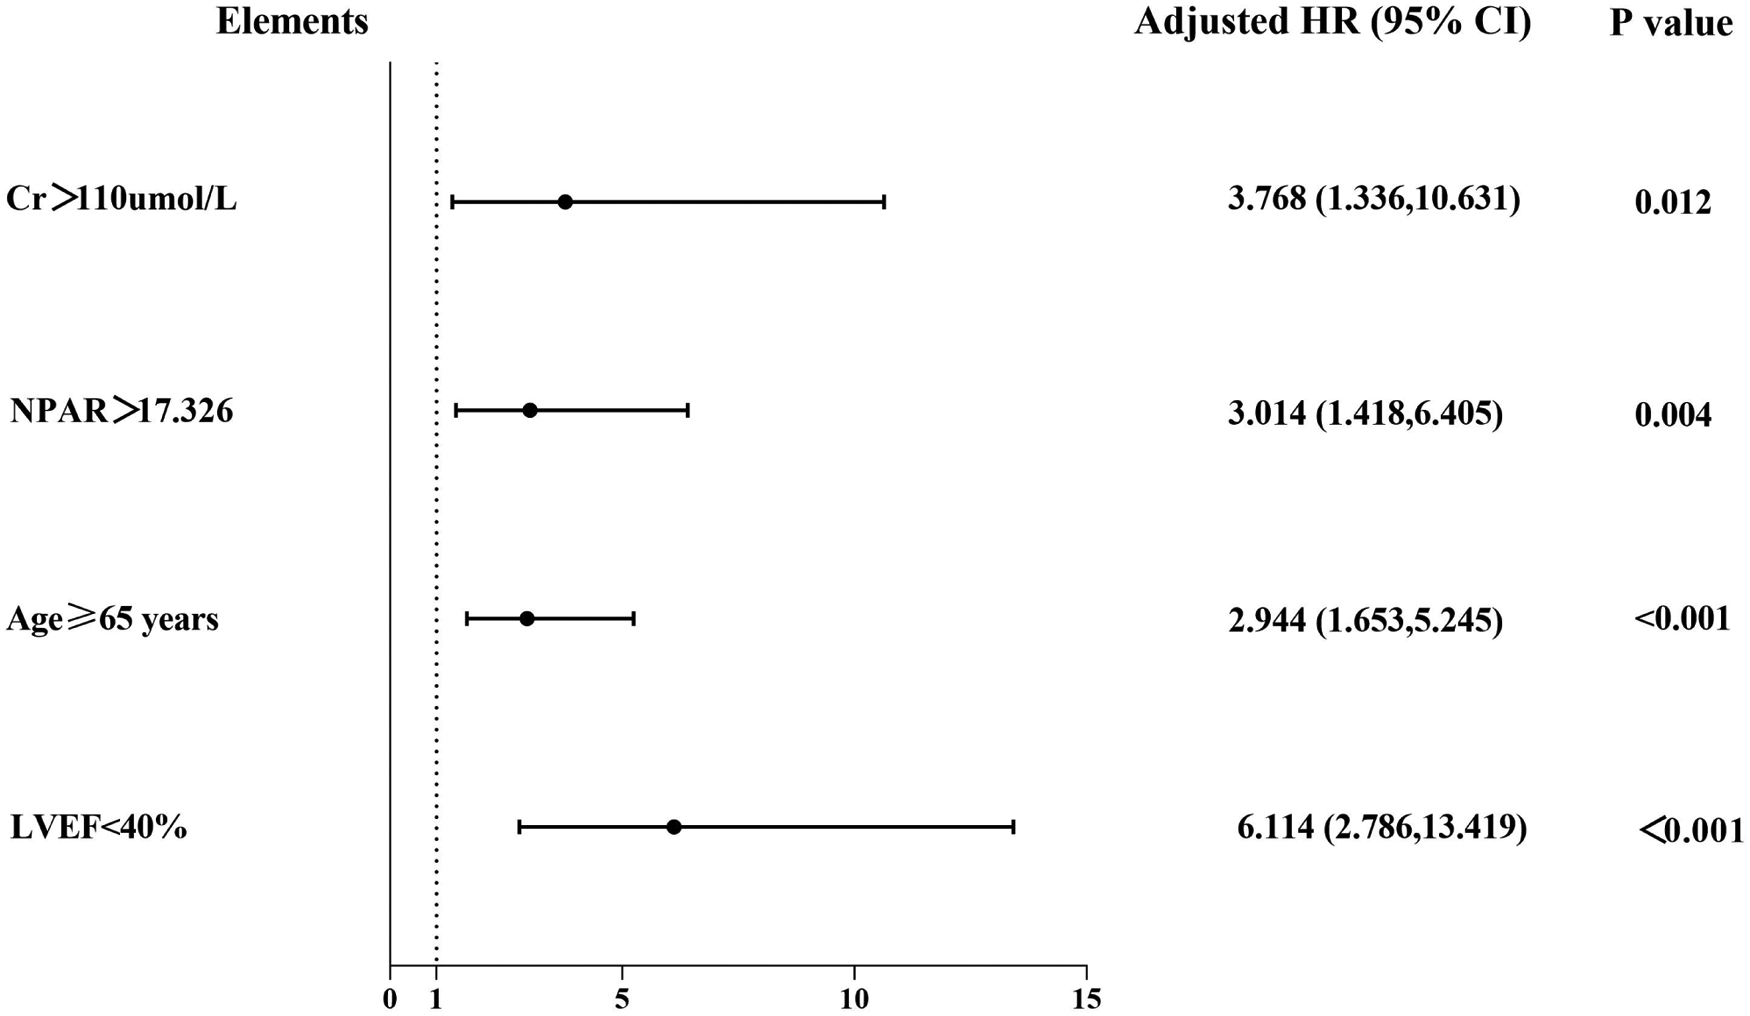
Forest graphs according to Cox proportional hazards regression model to test the risk factors for MACEs.
3.5 RCS
We further assessed the nonlinear relationship between the NPAR and MACEs using RCS. Elevated NPAR levels were significantly associated with increased MACE risk (P < 0.001 and Pnonlinear = 0.0056; Figure 7). The RCS curve demonstrated a monotonic increase in MACE risk with rising NPAR values. Collectively, these findings establish elevated NPAR as an independent risk factor for MACEs in PCI-treated patients with ACS.
Figure 7
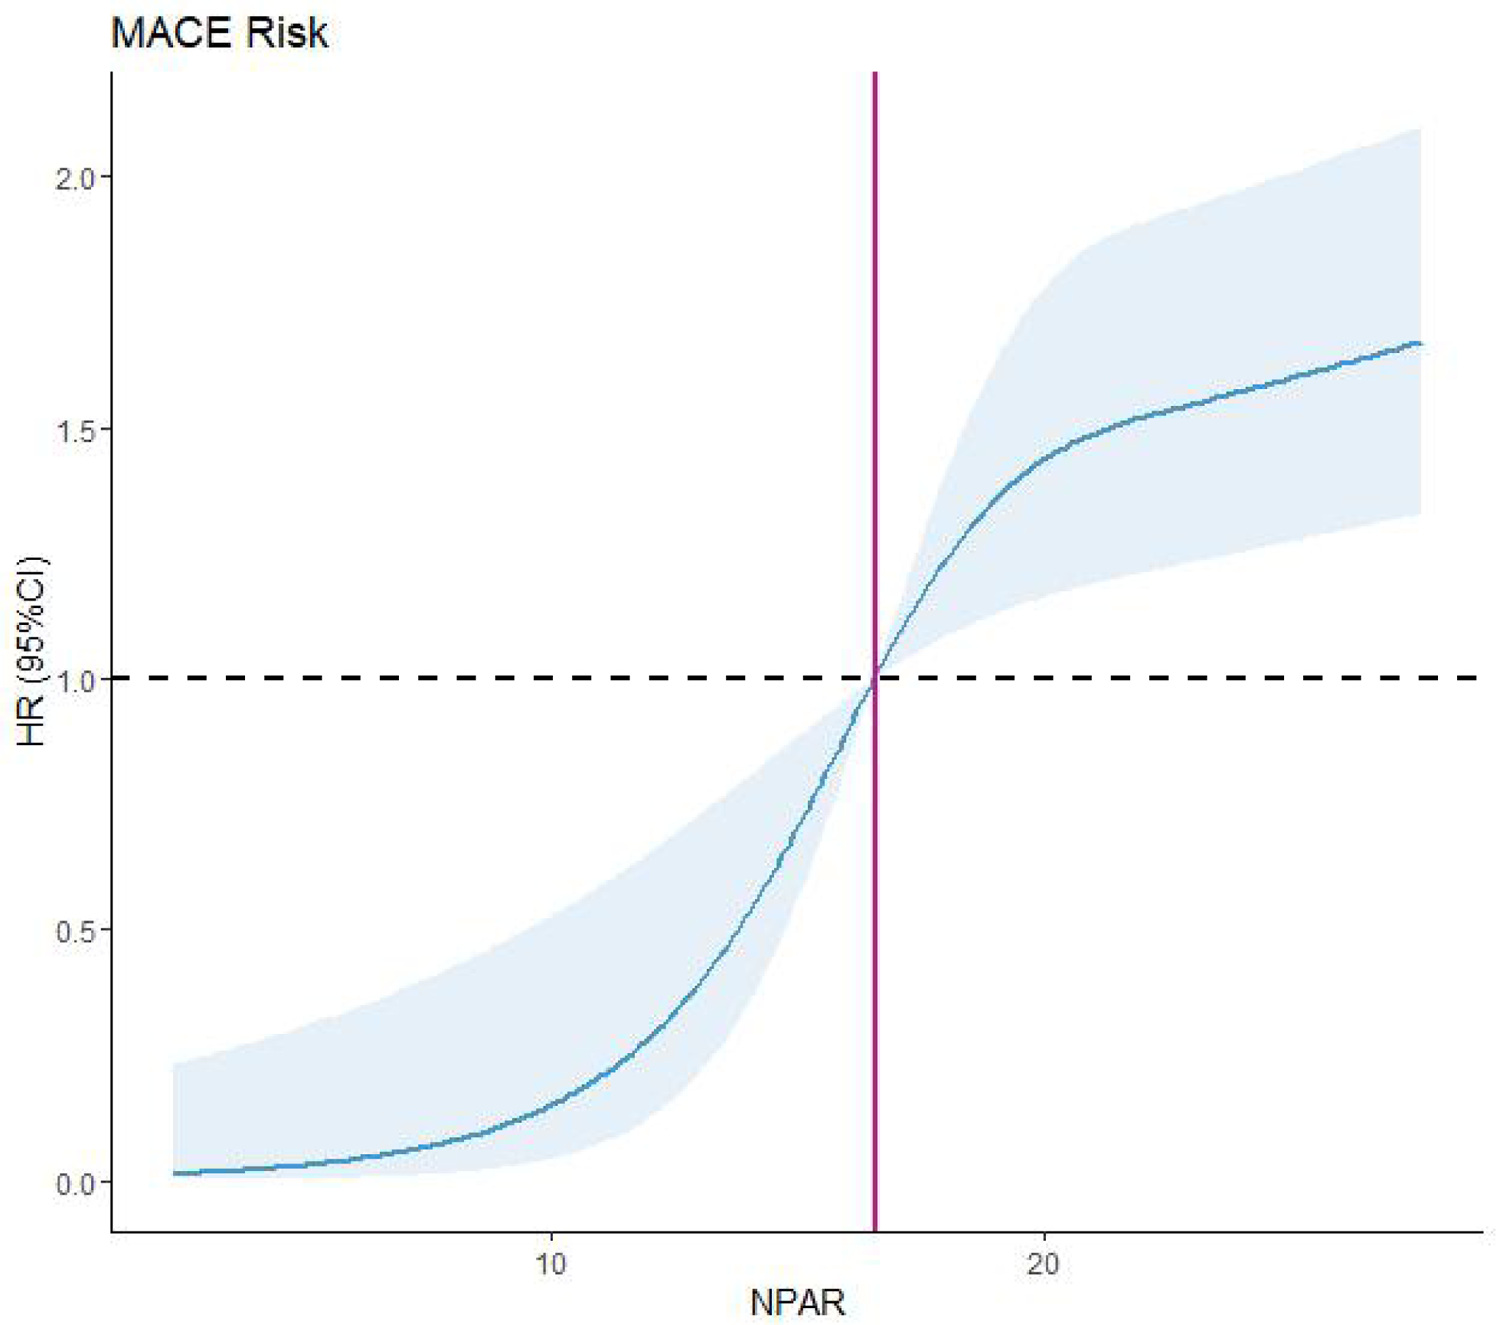
Restricted cubic spline (RCS). MACEs, major adverse cardiovascular events; NPAR, neutrophil percentage-to-albumin.
4 Discussion
In the present study, we investigated the prognostic value of the NPAR in patients with ACS undergoing PCI. The key findings are as follows: (1) elevated NPAR was independently associated with adverse clinical outcomes and served as an independent risk factor for poor prognosis in this patient population; (2) the prognostic performance of the NPAR demonstrated relative stability and sustained predictive value over time; (3) the NPAR demonstrated significant predictive power for all-cause mortality following PCI in patients with ACS; and (4) higher NPAR levels were significantly correlated with older age, elevated sCr levels, and reduced LVEF. To our knowledge, this is the first study to comprehensively evaluate the association between this novel biomarker ratio (NPAR) and long-term prognosis in ACS patients undergoing PCI.
Accumulating evidence underscores the pivotal role of chronic, low-grade inflammation in the initiation, progression, and destabilization of atherosclerotic plaques, culminating in acute events such as myocardial infarction (13, 14). This process is characterized by complex interactions among immune cells, cytokines, and vascular components, which promote endothelial dysfunction, plaque rupture, and thrombosis (14). Consequently, inflammatory biomarkers have emerged as crucial indicators for risk stratification and prognosis, complementing traditional factors such as LDL-C (13–16). While LDL-C deposition within the arterial intima represents a primary initiating event, the subsequent oxidation of LDL particles triggers a robust inflammatory response (13). This recruits circulating leukocytes—particularly monocytes and neutrophils—to the vessel wall, driving the inflammatory cascade and contributing to plaque vulnerability (13, 14, 16). This understanding solidified inflammation as a bona fide therapeutic target in secondary prevention. Among the various inflammatory cells implicated in cardiovascular disease, neutrophils—the most abundant leukocyte subset—have garnered significant attention due to their strong predictive value for adverse outcomes, particularly mortality (15–17). Studies consistently demonstrate that the neutrophil-to-lymphocyte ratio (NLR)—a readily available and inexpensive marker reflecting systemic inflammation and stress—serves as a powerful independent predictor of poor outcomes in patients with ST-elevation myocardial infarction (STEMI) undergoing primary PCI. An elevated NLR upon admission is strongly associated with impaired coronary blood flow after PCI (no-reflow phenomenon) (15, 17) and significantly higher rates of in-hospital MACEs, including mortality (15, 17). Mechanistically, the prognostic importance of neutrophils likely stems from their direct involvement in vascular injury. Growing evidence firmly supports a central role for neutrophils and related biomarkers as key mediators of inflammation-driven cardiovascular injury and mortality.
Serum albumin, synthesized exclusively by the liver, is a critical multifunctional protein whose circulating levels reflect a complex interplay between nutritional status and systemic inflammation (18). Hypoalbuminemia frequently indicates an underlying inflammatory state, characterized by elevated pro-inflammatory cytokines such as IL-6 and TNF-alpha. These cytokines suppress hepatic albumin synthesis and increase capillary permeability, thereby reducing circulating albumin levels (18). In patients with cancer, decreased serum albumin levels are significantly associated with an increased risk of venous thromboembolism and overall mortality, independent of kidney or liver function and other inflammatory markers (19). Similarly, in patients with inflammatory bowel disease (IBD), the serum albumin-to-globulin ratio is significantly lower compared to that in non-IBD controls and demonstrates a negative correlation with established disease activity indices (20). In the context of cardiovascular diseases, hypoalbuminemia is associated with impaired patient quality of life and reduced overall longevity. In patients with acutely decompensated heart failure, hypoalbuminemia is prevalent and independently associated with a significantly increased risk of 1-year mortality (21). Furthermore, among patients hospitalized with ACS, serum albumin levels ≤ 3.50 g/dL at admission are strongly and independently predictive of the development of new-onset heart failure and in-hospital mortality (22). This body of research highlights the potential clinical utility of composite biomarkers that integrate albumin with inflammation indices.
The NPAR has emerged as an accessible biomarker integrating inflammatory and nutritional pathways. Growing evidence supports its prognostic utility across cardiovascular conditions. In atrial fibrillation, elevated NPAR independently predicted all-cause mortality, reflecting its capacity to capture systemic inflammation implicated in arrhythmia progression (23). Similarly, among patients with chronic heart failure, NPAR > 3.5 conferred a 2.1-fold increased mortality risk after multivariable adjustment, outperforming conventional inflammatory markers such as CRP (24). Although the NPAR demonstrates an established prognostic value in acute coronary events including STEMI (25), its utility in post-PCI ACS populations remains underexplored. Beyond cardiovascular contexts, NPAR elevation correlates with advanced liver fibrosis in NAFLD (2), asthma severity (26), depression (27), malignancy (28), and chronic kidney disease (28). This cross-disease validity indicates that NPAR reflects fundamental pathophysiological processes such as neutrophilic inflammation compounded by hypoalbuminemia-driven endothelial dysfunction and oxidative stress (24, 29). Collectively, the NPAR represents a cost-effective prognostic biomarker, with persistently elevated levels consistently associated with adverse outcomes across cardio-metabolic conditions.
This finding is consistent with our results. We used several methods to investigate the correlation between the NPAR and prognosis. The results showed that the NPAR may be a useful clinical indicator for predicting the risk of MACE in patients with ACS after PCI. Multivariate Cox proportional hazards model analysis revealed that age, sCr > 110 μmol/L, LVEF < 40%, and high NPAR were the main prognostic factors. It is noteworthy that our study did not include other established inflammatory biomarkers such as C-reactive protein (CRP) or the neutrophil-to-lymphocyte ratio (NLR) for direct comparison, as these were not routinely collected in our retrospective cohort. This limitation notwithstanding, NPAR retains a distinct practical advantage: it is derived exclusively from a complete blood count and serum albumin measurement—tests that are routinely performed, inexpensive, and universally available at admission for ACS patients. Thus, NPAR offers an immediately applicable tool for early risk stratification without necessitating additional specialized assays. Future prospective studies incorporating a broader panel of inflammatory markers are needed to definitively establish the incremental or comparative prognostic value of NPAR.
Age significantly modifies the clinical presentation, management, and outcomes of ACS. Large multinational registries demonstrate that advancing age fundamentally alters clinical phenotypes: each decade of life decreases the likelihood of STEMI presentation by 18%, with older patients predominantly manifesting non-ST-elevation ACS (30). This shift has important clinical implications, as older patients often exhibit atypical symptoms, complex coronary anatomy, and increased vulnerability to complications (31). Beyond chronological age, the concept of “vascular age,” which quantifies biological arterial aging, offers more accurate cardiovascular risk stratification than chronological age alone (32). Importantly, age remains an independent predictor of adverse events. Consistent evidence shows that older patients with ACS experience higher rates of in-hospital mortality, heart failure, and bleeding complications compared to younger patients, even after adjusting for comorbidities and treatment strategies (31). A better understanding of these mechanisms may help identify strategies to reduce age-related risks and improve long-term outcomes following PCI.
LVEF represents a critical biomarker for stratifying the severity of left ventricular dysfunction in patients with ACS following PCI, significantly affecting therapeutic decisions and prognostic predictions. Current guidelines underscore the necessity of LVEF assessment in ACS management (33), recognizing its pivotal role in risk stratification and guiding interventions aimed at improving survival and preventing adverse cardiovascular events. Large-scale registry data confirm a strong inverse relationship between admission LVEF and mortality risk. Patients with preserved LVEF (≥50%) exhibit significantly lower short-term and 1-year mortality rates compared to those with mild-moderate dysfunction (LVEF 30%–49%), who show better outcomes than those with severe LVEF impairment (<30% or <40%) (34, 35). Consequently, LVEF serves as a fundamental parameter for identifying high-risk patients with ACS who may benefit from more intensive monitoring and aggressive secondary prevention strategies (34, 36). Furthermore, although risk factors associated with low LVEF at presentation are increasingly recognized (34, 35), the specific risk factors contributing to mortality within distinct LVEF categories differ. This underscores the need for tailored risk assessment and management strategies based not only on the LVEF value but also on the specific clinical context and accompanying factors. Therefore, LVEF remains an indispensable biomarker in ACS, providing critical information on the degree of myocardial damage, stratifying short and long-term mortality risk, and guiding therapeutic decisions. Addressing these gaps is essential to enhance risk prediction accuracy and optimize the management of patients with ACS, ultimately improving outcomes in this high-risk population, especially given the critical observation that each 1% reduction in LVEF significantly increases the risk of in-hospital death.
PCI plays a pivotal role in the management of ACS, significantly reducing mortality rates and the recurrence of ischemic events. However, this procedure is associated with inherent risks, including contrast-induced acute kidney injury, a well-documented complication linked to the administration of iodinated contrast media during coronary angiography and interventional procedures (37). sCr, a commonly used and easily accessible biomarker of renal function, serves as an essential parameter for risk stratification in patients undergoing PCI. Extensive observational cohort studies consistently demonstrate a linear association between elevated baseline sCr levels and increased all-cause mortality among patients receiving PCI. Importantly, this association remains statistically significant even after comprehensive adjustment for potential confounding factors and across multiple sensitivity analyses (38). Moreover, studies examining early post-procedural renal changes have shown that even minor subclinical increases in sCr within 24 h after coronary angiography or PCI—often deemed clinically irrelevant—are independently related to a markedly increased risk of long-term mortality (39). Collectively, these findings highlight that sCr, both as a baseline indicator and marker of acute renal alterations, offers substantial prognostic value that surpasses traditional cardiovascular risk factors.
This study confirmed the clinical utility of the NPAR as a novel, comprehensive, and clinically applicable biomarker for assessing the long-term risk of MACEs in patients with ACS who undergo PCI. Consistent with findings reported by Han et al. (40), the NPAR is calculated from routinely available and cost-effective hematological parameters, providing meaningful insights for early risk stratification and improved clinical decision-making. This facilitates the development of more effective therapeutic strategies aimed at preventing adverse cardiovascular outcomes while advancing precision medicine without imposing additional financial burden on healthcare systems. For patients with elevated NPAR levels, intensified monitoring protocols can be implemented, including increased follow-up frequency, proactive management of modifiable risk factors, and the incorporation of advanced imaging techniques. Furthermore, individualized secondary prevention measures—targeted nutritional support, albumin supplementation in cases of hypoproteinemia, initiation of anti-inflammatory therapies, and systematic screening for latent infections—can be integrated into clinical practice. Although the NPAR demonstrates promising potential for guiding risk stratification and individualized interventions, further research is required to fully establish its clinical validity and applicability.
Collectively, these findings underscore the prognostic value of the NPAR in identifying cardiovascular risk among patients with ACS who have undergone PCI.
5 Study limitations
The neutrophil percentage-to-albumin ratio (NPAR) is a straightforward composite index reflecting aspects of both malnutrition and systemic inflammation. Its primary strengths lie in its simplicity, objectivity, and immediate availability from routine admission blood tests, which are universally performed in the management of ACS. Despite these advantages, our study has several limitations. First, this was a single-center study with a limited sample size; therefore, the findings may not be fully generalizable to broader populations with different demographic characteristics, access to healthcare resources, or treatment practices. Second, the retrospective design introduces potential selection bias and relies on the accuracy and completeness of data extracted from electronic medical records. Unmeasured or inadequately measured confounders may also contribute to residual bias. Third, although the median follow-up of 3 years is sufficient to assess intermediate-term risk, the stability of NPAR's predictive performance over longer periods and its long-term prognostic value require further investigation. Fourth, the number of observed endpoint events was relatively low (n = 55), with the composite outcome predominantly driven by all-cause mortality (51 events). Although the events-per-variable ratio in our final multivariate model was acceptable, the limited event count increases the risk of overfitting and necessitates cautious interpretation of the estimates. External validation in larger cohorts is essential. Fifth, as a retrospective analysis, our study did not systematically collect other established inflammatory biomarkers—such as high-sensitivity C-reactive protein (hs-CRP) or the neutrophil-to-lymphocyte ratio (NLR)—which precludes a head-to-head comparison of their prognostic utility against NPAR. Although this limits our ability to contextualize NPAR within the existing biomarker landscape, it also underscores NPAR's inherent practicality: it is calculated from routine admission laboratory parameters that are universally available, inexpensive, and require no additional testing. Future prospective studies should include a standardized panel of inflammatory and nutritional biomarkers to rigorously evaluate the independent and additive prognostic value of NPAR. Sixth, although internal validation via bootstrap resampling indicated stability of the NPAR cut-off value within this dataset, external validation in independent, multi-center cohorts remains necessary. Finally, the exact mechanistic association between elevated NPAR values and the occurrence of MACEs warrants further exploration.
6 Conclusion
Elevated NPAR was independently associated with increased risks of all-cause mortality and heart failure-related readmission in patients with ACS following PCI. Therefore, the NPAR may serve as a clinically useful biomarker for identifying PCI-treated patients with ACS at a heightened risk of MACEs.
Statements
Data availability statement
The original contributions presented in the study are included in the article/Supplementary Material, further inquiries can be directed to the corresponding author.
Ethics statement
The studies involving humans were approved by the Affiliated Hospital of Chengde Medical University (Approval Number: CYFYLL2021036). The studies were conducted in accordance with the local legislation and institutional requirements. The participants provided their written informed consent to participate in this study.
Author contributions
WW: Conceptualization, Data curation, Methodology, Validation, Visualization, Writing – original draft. YZ: Data curation, Investigation, Visualization, Writing – original draft. KW: Investigation, Methodology, Software, Validation, Writing – original draft. LS: Formal analysis, Project administration, Resources, Supervision, Writing – review & editing. YZ: Conceptualization, Formal analysis, Resources, Supervision, Writing – review & editing. WS: Funding acquisition, Resources, Supervision, Validation, Writing – review & editing.
Funding
The author(s) declared that financial support was not received for this work and/or its publication.
Acknowledgments
The authors express sincere gratitude to the physicians and nursing staff of the Cardiology Research Team at the Affiliated Hospital of Chengde Medical University for their invaluable clinical support and research assistance.
Conflict of interest
The author(s) declared that this work was conducted in the absence of any commercial or financial relationships that could be construed as a potential conflict of interest.
Generative AI statement
The author(s) declared that generative AI was not used in the creation of this manuscript.
Any alternative text (alt text) provided alongside figures in this article has been generated by Frontiers with the support of artificial intelligence and reasonable efforts have been made to ensure accuracy, including review by the authors wherever possible. If you identify any issues, please contact us.
Publisher’s note
All claims expressed in this article are solely those of the authors and do not necessarily represent those of their affiliated organizations, or those of the publisher, the editors and the reviewers. Any product that may be evaluated in this article, or claim that may be made by its manufacturer, is not guaranteed or endorsed by the publisher.
Supplementary material
The Supplementary Material for this article can be found online at: https://www.frontiersin.org/articles/10.3389/fcvm.2026.1703203/full#supplementary-material
References
1.
Bergmark BA Mathenge N Merlini PA Lawrence-Wright MB Giugliano RP . Acute coronary syndromes. Lancet. (2022) 399:1347–58. 10.1016/S0140-6736(21)02391-6
2.
Liu CF Chien LW . Predictive role of neutrophil-percentage-to-albumin ratio (NPAR) in nonalcoholic fatty liver disease and advanced liver fibrosis in nondiabetic US adults: evidence from NHANES 2017–2018. Nutrients. (2023) 15:1892. 10.3390/nu15081892
3.
Cucoranu DC Pop M Niculescu R Kosovski I Toganel RO Licu R et al The association of nonalcoholic fatty liver disease with neutrophil-to-lymphocyte ratio and neutrophil-percentage-to-albumin ratio. Cureus. (2023) 15:e41197. 10.7759/cureus.41197
4.
He X Dai F Zhang X Pan J . The neutrophil percentage-to-albumin ratio is related to the occurrence of diabetic retinopathy. J Clin Lab Anal. (2022) 36:e24334. 10.1002/jcla.24334
5.
Lv XN Shen YQ Li ZQ Deng L Wang ZJ Cheng J et al Neutrophil percentage to albumin ratio is associated with stroke-associated pneumonia and poor outcome in patients with spontaneous intracerebral hemorrhage. Front Immunol. (2023) 14:1173718. 10.3389/fimmu.2023.1173718
6.
Wang B Li D Cheng B Ying B Gong Y . The neutrophil percentage-to-albumin ratio is associated with all-cause mortality in critically ill patients with acute kidney injury. Biomed Res Int. (2020) 2020:5687672. 10.1155/2020/5687672
7.
Lan CC Su WL Yang MC Chen SY Wu YK . Predictive role of neutrophil-percentage-to-albumin, neutrophil-to-lymphocyte and eosinophil-to-lymphocyte ratios for mortality in patients with COPD: evidence from NHANES 2011–2018. Respirology. (2023) 28:1136–46. 10.1111/resp.14589
8.
Sun T Shen H Guo Q Yang J Zhai G Zhang J et al Association between neutrophil percentage-to-albumin ratio and all-cause mortality in critically ill patients with coronary artery disease. Biomed Res. Int. (2020) 2020:8137576. 10.1155/2020/8137576
9.
Kurkiewicz K Gąsior M Szyguła-Jurkiewicz BE . Markers of malnutrition, inflammation, and tissue remodeling are associated with 1-year outcomes in patients with advanced heart failure. Pol Arch Intern Med. (2023) 133:16411. 10.20452/pamw.16411
10.
Unger T Borghi C Charchar F Khan NA Poulter NR Prabhakaran D et al 2020 international society of hypertension global hypertension practice guidelines. J Hypertens. (2020) 38:982–1004. 10.1097/HJH.0000000000002453
11.
American Diabetes Association . Diagnosis and classification of diabetes mellitus. Diabetes Care. (2014) 37(Suppl 1):S81–90. 10.2337/dc14-S081
12.
da Silva PM Duarte JS von Hafe P Gil V de Oliveira JN de Sousa G . Standardization of laboratory and lipid profile evaluation: a call for action with a special focus in 2016 ESC/EAS dyslipidaemia guidelines—full report. Atheroscler Supplements. (2018) 31:e1–12. 10.1016/j.atherosclerosissup.2018.04.001
13.
Reklou A Doumas M Imprialos K Stavropoulos K Patoulias D Athyros VG . Reduction of vascular inflammation, LDL-C, or both for the protection from cardiovascular events. Open Cardiovasc Med J. (2018) 12:29–40. 10.2174/1874192401812010029
14.
Martinez BK White CM . The emerging role of inflammation in cardiovascular disease. Ann Pharmacother. (2018) 52:801–9. 10.1177/1060028018765939
15.
Akpek M Kaya MG Lam YY Sahin O Elcik D Celik T et al Relation of neutrophil/lymphocyte ratio to coronary flow to in-hospital major adverse cardiac events in patients with ST-elevated myocardial infarction undergoing primary coronary intervention. Am J Cardiol. (2012) 110:621–7. 10.1016/j.amjcard.2012.04.041
16.
Ren F Mu N Zhang X Tan J Li L Zhang C et al Increased platelet-leukocyte aggregates are associated with myocardial no-reflow in patients with ST elevation myocardial infarction. Am J Med Sci. (2016) 352:261–6. 10.1016/j.amjms.2016.05.034
17.
Pan W Zhao D Zhang C Li W Yu J Wang S et al Application of neutrophil/lymphocyte ratio in predicting coronary blood flow and mortality in patients with ST-elevation myocardial infarction undergoing percutaneous coronary intervention. J Cardiol. (2015) 66:9–14. 10.1016/j.jjcc.2014.10.014
18.
Königsbrügge O Posch F Riedl J Reitter E Zielinski C Pabinger I et al Association between decreased serum albumin with risk of venous thromboembolism and mortality in cancer patients. Oncologist. (2016) 21:252–7. 10.1634/theoncologist.2015-0284
19.
Cabrerizo S Cuadras D Gomez-Busto F Artaza-Artabe I Marín-Ciancas F Malafarina V . Serum albumin and health in older people: review and meta analysis. Maturitas. (2015) 81(1):17–27. 10.1016/j.maturitas.2015.02.009
20.
Wang Y Li C Wang W Wang J Li J Qian S et al Serum albumin to globulin ratio is associated with the presence and severity of inflammatory bowel disease. J Inflamm Res. (2022) 15:1907–20. 10.2147/JIR.S347161
21.
Uthamalingam S Kandala J Daley M Patvardhan E Capodilupo R Moore SA et al Serum albumin and mortality in acutely decompensated heart failure. Am Heart J. (2010) 160:1149–55. 10.1016/j.ahj.2010.09.004
22.
González-Pacheco H Amezcua-Guerra LM Sandoval J Martínez-Sánchez C Ortiz-León XA Peña-Cabral MA et al Prognostic implications of serum albumin levels in patients with acute coronary syndromes. Am J Cardiol. (2017) 119:951–8. 10.1016/j.amjcard.2016.11.054
23.
Xu Y Lin Z Zhu C Song D Wu B Ji K et al The neutrophil percentage-to-albumin ratio is associated with all-cause mortality in patients with atrial fibrillation: a retrospective study. J Inflamm Res. (2023) 16:691–700. 10.2147/JIR.S394536
24.
Wang X Zhang Y Wang Y Liu J Xu X Liu J et al The neutrophil percentage-to-albumin ratio is associated with all-cause mortality in patients with chronic heart failure. BMC Cardiovasc Disord. (2023) 23:568. 10.1186/s12872-023-03472-9
25.
Cui H Ding X Li W Chen H Li H . The neutrophil percentage to albumin ratio as a new predictor of in-hospital mortality in patients with ST-segment elevation myocardial infarction. Med Sci Monit. (2019) 25:7845–52. 10.12659/MSM.917987
26.
Bi L Liang J Hu K . Neutrophil percentage-to-albumin ratio (NPAR) as a biomarker for asthma: a cross-sectional analysis of NHANES data. BMC Pulm Med. (2025) 25:269. 10.1186/s12890-025-03701-1
27.
Li J Xiang T Chen X Fu P . Neutrophil-percentage-to-albumin ratio is associated with chronic kidney disease: evidence from NHANES 2009–2018. PLoS One. (2024) 19:e0307466. 10.1371/journal.pone.0307466
28.
Li X Wu M Chen M Liu R Tao Q Hu Y et al The association between neutrophil-percentage-to-albumin ratio (NPAR) and mortality among individuals with cancer: insights from national health and nutrition examination survey. Cancer Med. (2025) 14:e70527. 10.1002/cam4.70527
29.
Liu Y Qiu Z Shen G Sun Y Mei J Liu Z et al Associations between neutrophil-percentage-to-albumin ratio level and all-cause mortality and cardiovascular disease-cause mortality in general population: evidence from NHANES 1999–2010. Front Cardiovasc Med. (2024) 11:1393513. 10.3389/fcvm.2024.1393513
30.
Rosengren A Wallentin L Simoons M Gitt AK Behar S Battler A et al Age, clinical presentation, and outcome of acute coronary syndromes in the Euroheart acute coronary syndrome survey. EurHeart J. (2006) 27:789–95. 10.1093/eurheartj/ehi774
31.
Ahmed E Alhabib KF El-Menyar A Asaad N Sulaiman K Hersi A et al Age and clinical outcomes in patients presenting with acute coronary syndromes. JCardiovasc Dis Res. (2013) 4:134–9. 10.1016/j.jcdr.2012.08.005
32.
Cuocolo A Klain M Petretta M . Coronary vascular age comes of age. J Nucl Cardiol. (2017) 24:1835–6. 10.1007/s12350-017-1078-6
33.
Malebranche D Hasan S Fung M Har B Champagne P Schnell G et al Patterns of left-ventricular function assessment in patients with acute coronary syndromes. CJC Open. (2021) 3:733–40. 10.1016/j.cjco.2020.12.028
34.
Perelshtein Brezinov O Klempfner R Zekry SB Goldenberg I Kuperstein R . Prognostic value of ejection fraction in patients admitted with acute coronary syndrome: a real world study. Medicine (Baltimore). (2017) 96:e6226. 10.1097/MD.0000000000006226
35.
Bermejo RA Cordero A García-Acuña JM Otero IG Román AV Martínez Á et al Determinants and prognostic impact of heart failure and left ventricular ejection fraction in acute coronary syndrome settings. Rev Esp Cardiol. (2017) 71:820–8. 10.1016/j.rec.2017.10.030
36.
Khaled S Matahen R . Cardiovascular risk factors profile in patients with acute coronary syndrome with particular reference to left ventricular ejection fraction. Indian Heart J. (2017) 70:45–9. 10.1016/j.ihj.2017.05.019
37.
Mccullough PA Choi JP Feghali GA Schussler JM Stoler RM Vallabahn RC et al Contrast-induced acute kidney injury. J Am Coll Cardiol. (2016) 68:1465–73. 10.1016/j.jacc.2016.05.099
38.
Yang C Zhang L Ding X Hui Z Gao J Liu Z . Long-term prognosis of patients undergoing percutaneous coronary intervention: the impact of serum creatinine levels on all-cause mortality. Med. Sci. Monit. (2024) 30:e943063. 10.12659/MSM.943063
39.
Guo XS Chen SQ Duan CY Li HL Bei WJ Liu Y et al Association of post-procedural early (within 24 h) increases in serum creatinine with all-cause mortality after coronary angiography. Clin Chim Acta. (2017) 474:96–101. 10.1016/j.cca.2017.08.036
40.
Han D Wu L Zhou H Li P Liu S Xue Y et al Neutrophil percentage-to-albumin ratio and the risk of all-cause and cardiovascular mortality: a 20-year follow-up cohort study of 36,428 US adults. BMC Public Health. (2025) 25:1483. 10.1186/s12889-025-22764-7
Summary
Keywords
acute coronary syndrome, major adverse cardiovascular events, neutrophil percentage-to-albumin, percutaneous coronary intervention, rehospitalization due to severe heart failure
Citation
Wang W, Zhao Y, Wang K, Sun L, Zhang Y and Shan W (2026) Neutrophil percentage-to-albumin ratio is an independent risk factor for MACEs in patients with acute coronary syndrome undergoing percutaneous coronary intervention. Front. Cardiovasc. Med. 13:1703203. doi: 10.3389/fcvm.2026.1703203
Received
11 September 2025
Revised
24 December 2025
Accepted
12 January 2026
Published
05 February 2026
Volume
13 - 2026
Edited by
Martino Pepe, University of Bari Aldo Moro, Italy
Reviewed by
Giuseppe Biondi-Zoccai, Sapienza University of Rome, Italy
Marco Mele, Azienda Ospedaliero-Universitaria Ospedali Riuniti di Foggia, Italy
Updates
Copyright
© 2026 Wang, Zhao, Wang, Sun, Zhang and Shan.
This is an open-access article distributed under the terms of the Creative Commons Attribution License (CC BY). The use, distribution or reproduction in other forums is permitted, provided the original author(s) and the copyright owner(s) are credited and that the original publication in this journal is cited, in accordance with accepted academic practice. No use, distribution or reproduction is permitted which does not comply with these terms.
* Correspondence: Weichao Shan cyfyshan@163.com
Disclaimer
All claims expressed in this article are solely those of the authors and do not necessarily represent those of their affiliated organizations, or those of the publisher, the editors and the reviewers. Any product that may be evaluated in this article or claim that may be made by its manufacturer is not guaranteed or endorsed by the publisher.