Abstract
Background:
Elevated blood pressure may share a similar pathophysiology with cardiovascular disease (CVD). Although the atherogenic index of plasma (AIP) has been associated with hypertension and CVD, evidence on the association between the AIP and prehypertension risk remains limited. This study aims to explore the relationship of the AIP with the risks of prehypertension and hypertension in a Chinese population.
Methods:
This study was based on a population-based cross-sectional survey data of Fujian province and was conducted between August 2020 and April 2021. The association between the AIP and prehypertension/hypertension risk was assessed through multivariate logistic regression. Four-knot restricted cubic splines (RCS) were performed to examine the potential dose–response relationships. Subgroup analyses were used to assess the heterogeneity of the associations across different population subgroups, and an receiver operating characteristic (ROC) curve analysis was used to determine the cutoff values for predicting prehypertension/hypertension. The mediating roles of the two types of inflammatory indicators were analyzed through mediation analysis. Several sensitivity analyses were also conducted to further assess the robustness of the results.
Results:
A total of 9,473 adults were included in the final analysis, including 3,273 diagnosed with prehypertension and 3,248 with hypertension. Overall, participants with elevated AIP levels demonstrated higher prehypertension detection rates and hypertension prevalence (all P < 0.05). The multivariate logistic regression model showed that the AIP was significantly positively associated with prehypertension [per 0.1-unit increment in the AIP: odds ratio (OR), 1.05, 95% confidence interval (CI): 1.03–1.07] and hypertension (per 0.1-unit increment in the AIP: OR, 1.11, 95% CI: 1.09–1.14), respectively. Compared with the lowest quartile of the AIP, participants in the highest quartile had a higher risk of prehypertension [OR: 1.58 (1.32, 1.90)] and hypertension [OR: 2.30 (1.86, 2.84)]. No evidence of a non-linear association was observed between the AIP and the risk of prehypertension (Pnon-linear = 0.178) or hypertension (Pnon-linear = 0.087). There were significant interactions between the AIP and both residential location and educational level regarding the risk of blood pressure classification (Pinteraction < 0.05). Furthermore, an ROC analysis indicated a higher clinical predictive value of the AIP for hypertension (AUC = 0.721, 95% CI: 0.708–0.734). White blood cell count mediated 10.91% and 15.52% of the total effect of the AIP on prehypertension and hypertension, respectively.
Conclusion:
The AIP is positively associated with the risk of prehypertension and hypertension among participants ≥ 18 years of age in China, with white blood cell count potentially mediating a part of this association, which indicates that monitoring and maintaining optimal AIP levels may help prevent the deterioration of blood pressure categories.
Introduction
Cardiovascular disease (CVD), a group of disorders affecting the heart and blood vessels, is one of the leading causes of mortality worldwide (1). The development of CVD is closely related to abnormalities in blood pressure regulation and metabolic homeostasis, which often coexist with dyslipidemia, diabetes, obesity, and unhealthy lifestyle behaviors (2). Among these, hypertension stands out as one of the most prevalent and influential independent risk factors for CVD, posing a major public health challenge (3). According to data from the World Health Organization (WHO), hypertension affects 33% of adults aged 30–79 years globally (4) and has been confirmed to be associated with increased mortality risk from cardiovascular and renal diseases (5–7). In addition, approximately 30%–50% of adults worldwide are in the prehypertensive stage (8, 9), and individuals in this group face two to three times the risk of developing hypertension compared with those with normal blood pressure (10). Notably, even systolic blood pressure (SBP) within the 115–130 mmHg is associated with elevated mortality risk (11–13). Had all adults worldwide maintained systolic blood pressure at the estimated theoretical minimum-risk level (110–115 mmHg) in 2019, approximately 19% of global deaths that year could have been prevented (12, 14). According to a China hypertension survey, 23.2% (approximately 244.5 million) of the Chinese adult population have hypertension, and an additional 41.3% (approximately 435.3 million) are diagnosed with prehypertension (9). Therefore, early intervention in hypertension, especially prehypertension, is critical for preventing or delaying the onset of cardiovascular diseases and their complications.
The pathological mechanisms underlying blood pressure regulation are complex (15–17). Recent studies highlight the central role of metabolic disorders in blood pressure modulation, with atherogenic lipid abnormalities promoting vascular remodeling through oxidative stress and endothelial dysfunction (18–20). In addition, inflammation represents an important mechanism linking atherosclerosis and hypertension, as it can exacerbate vascular injury and thereby contribute to the onset and progression of hypertension (21–23). The atherogenic index of plasma (AIP), a biomarker integrating the ratio of triglycerides to high-density lipoprotein cholesterol (TG/HDL-C), has received extensive attention from researchers in recent years. Previous studies have demonstrated that the AIP is a comprehensive index for assessing the risk of metabolic disorders, CVD (24, 25), and type 2 diabetes (T2DM) (26, 27).
Multiple cross-sectional and longitudinal studies across diverse populations have demonstrated that higher AIP levels are significantly and positively associated with both the prevalence and the incidence of hypertension (28–39). Notably, this association appears to exhibit population heterogeneity, with some studies reporting stronger associations in middle-aged individuals (40–64 years) and more pronounced correlations in women than in men (29, 35, 37–39). Therefore, the influence of population heterogeneity on the AIP–blood pressure relationship still requires a stratified analysis. Moreover, most existing studies treat blood pressure status as a binary outcome, thereby overlooking the potential risk gradient of the AIP across the continuum from normotension, through prehypertension, to hypertension. Comprehensive investigations into the relationship between the AIP and prehypertension, a critical stage for early intervention with maximal health benefits, are limited (38, 39). Therefore, we conducted a population-based cross-sectional study to explore the association of the AIP with the risk of prehypertension and hypertension in a Chinese population and to further explore the mediating role of inflammation in this relationship.
Methods
Study design and population
The data were obtained from the Fujian Provincial Surveillance Site of the China Cardiovascular Disease and Risk Factors Surveillance Program, a cross-sectional study jointly conducted by the National Center for Cardiovascular Diseases and the First Affiliated Hospital of Fujian Medical University from August 2020 to April 2021. This study enrolled permanent residents aged ≥18 years with ≥6 months of local residency in Fujian Province, China. A stratified multistage random sampling method was employed to select a provincially representative sample for assessing the prevalence of major cardiovascular diseases. All participant information was systematically collected through standardized face-to-face surveys by well-trained examiners, comprising three principal components: questionnaire surveys, physical examinations, and laboratory assessments. Laboratory tests included the collection of fasting blood and urine specimens for the measurement of multiple indicators. After cryopreservation and cold-chain transportation, complete blood count was tested locally, while the remaining biochemical indicators were uniformly tested in a designated laboratory to ensure comparability. Specifically, this study utilized comprehensive data from 9,736 individuals in the Fujian Provincial Surveillance Site during the 2020–2021 period. Following a rigorous screening process, 9,473 participants met the stringent inclusion criteria for final analysis. Figure 1 presents a detailed flowchart outlining the participant selection procedure for this study.
Figure 1
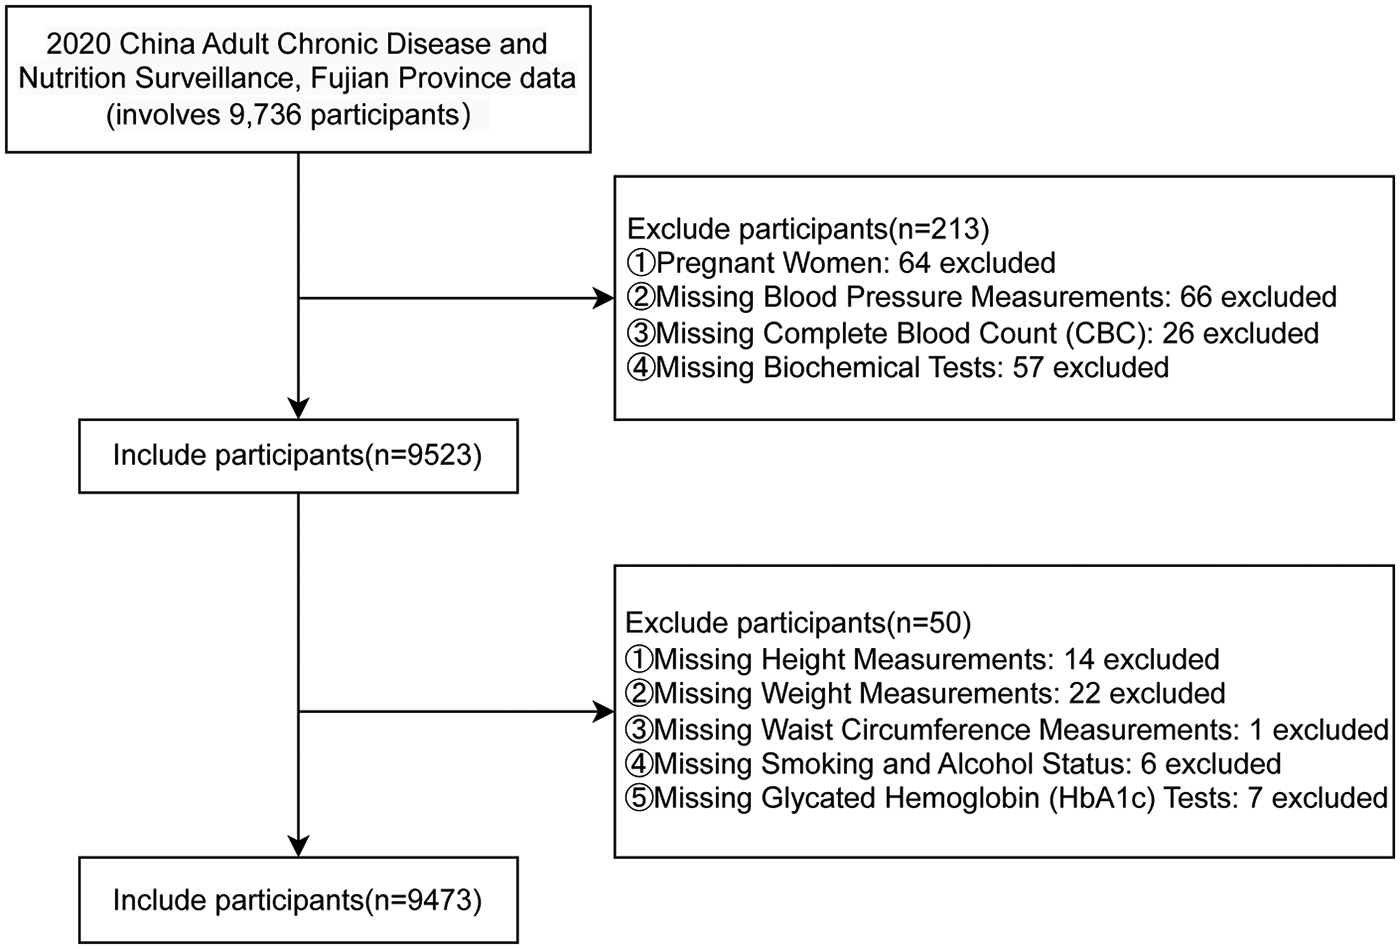
A flow diagram of study subjects included in the analysis.
Data collection
As described by previous literature (40), participants completed a standardized questionnaire developed by the National Coordinating Center of Fu Wai Hospital (Beijing, China) through face-to-face interviews conducted by trained staff. The questionnaire covered sociodemographic factors (e.g., gender, age, occupation, education, marital status, place of residence, economic status, and health insurance), behavioral factors (e.g., smoking, alcohol consumption, physical activity, and regular sleep), personal medical history (e.g., hypertension, diabetes, dyslipidemia, and hyperuricemia), and family history of hypertension. The physical examination included measurements of height, weight, waist circumference, and blood pressure. To reduce information bias, the data collection procedures were carried out independently, and investigators conducting questionnaires, blood pressure measurements, and laboratory assays were blinded to one another's data as well as to the study outcomes.
Definitions of prehypertension and hypertension
Blood pressure was measured using the OMRON HBP-1300 Professional Portable Blood Pressure Monitor (OMRON, Kyoto, Japan) three times on the right arm positioned at the heart level after the participant was sitting at rest for 5 min, with 30 s between each measurement with an observer present. Valid measurements were identified as those in which two out of three SBP and DBP readings differed by ≤10 mmHg, and the average of the three readings was used for analysis. According to the Chinese Guidelines for the Prevention and Treatment of Hypertension (2024 Revision) (41), hypertension was defined as systolic blood pressure (SBP) ≥ 140 mmHg and/or diastolic blood pressure (DBP) ≥ 90 mmHg and/or a documented history of hypertension with antihypertensive medication use within the preceding two weeks. Prehypertension was classified as SBP ranging from 120 to 139 mmHg and/or DBP ranging from 80 to 89 mmHg, while normal blood pressure was defined as SBP <120 mmHg and DBP <80 mmHg.
AIP calculation
The AIP was calculated as the logarithmic transformation of the ratio of TG to HDL-C, expressed as AIP = log(TG/HDL-C) (42). Because of its small magnitude, the AIP was multiplied by 10 (AIP × 10) when calculating the odds ratios (ORs) for continuous variables in this study (43).
Potential covariates
In this study, potential covariates were selected a priori based on existing literature and clinical expertise to comprehensively evaluate their potential influence on the study outcomes. These covariates included sociodemographic characteristics, anthropometric indicators, lifestyle behaviors, and laboratory parameters. Sociodemographic characteristics included sex (male or female), age groups (≥65, 40–64, and <40 years), residential location (urban or rural), education level (no schooling, primary school, junior high school, senior high school or technical school, and college or above), marital status (unmarried, married/remarried/cohabiting, separated, divorced, or widowed), and per capita annual household income (<10,000; 10,000–20,000; 20,000–30,000; 30,000–50,000; 50,000–100,000; or ≥100,000 yuan). Anthropometric indicators included body mass index (BMI), calculated as weight (kg) divided by height squared (m2), and categorized as underweight (<18.5), normal weight (18.5–23.9), and overweight (24.0–27.9), or obese (≥28.0). Waist circumference (WC) was measured horizontally at the midpoint between the iliac crest and the 12th rib along the midaxillary line, recorded to the nearest 0.1 cm at the end of expiration. A WC of <85 cm in men or <80 cm in women was defined as “normal”; 85–89.9 cm in men or 80–84.9 cm in women as “precentral obesity”; and ≥90 cm in men or ≥85 cm in women as “central obesity,” according to the Expert Consensus on the Prevention and Control of Obesity in Chinese Adults (44). Lifestyle factors covered sleep duration [good (7–9 h), insufficient (<7 h), or excessive (>9 h)], smoking status (never, former, or current smoker), alcohol consumption [none, daily (≥1 drink per day), weekly (≥1 drink per week), monthly (≥1 drink per month), or rarely (<1 drink per month)], and physical activity level [insufficient (<150 min/week of moderate-to-vigorous physical activity) or sufficient (≥150 min/week)]. Laboratory parameters included glycated hemoglobin (HbA1c), classified as diabetes (≥6.5%), prediabetes (5.7%–6.4%), or normal (<5.7%) (45); fasting triglycerides (TG); total cholesterol (TC); low-density lipoprotein cholesterol (LDL-C); high-density lipoprotein cholesterol (HDL-C); serum creatinine (Cr); and uric acid (UA). Blood biochemical parameters, including HbA1c, TC, TG, HDL-C, LDL-C, Cr, and UA, were measured using a Beckman AU680 analyzer. HbA1c was determined by high-performance liquid chromatography; oxidase methods were used for TC and TG; direct methods were applied for HDL-C and LDL-C; and the enzymatic method was used for Cr and UA.
Statistical analysis
Based on the quartiles of the AIP, all study participants were categorized into four groups. Normally distributed continuous variables were presented as mean ± standard deviation (SD), with group comparisons made using one-way ANOVA. Non-normally distributed continuous variables were presented as median (interquartile range, IQR), with group comparisons made using the Kruskal–Wallis H test. Categorical variables were presented as number (percentage), and group comparisons were performed using the chi-square test. The generalized variance inflation factor (GVIF) was applied to assess multicollinearity among covariates. All variables showed acceptable collinearity, with GVIF^[1/(2 × Df)] values below 2. The proportional odds assumption for ordinal logistic regression was evaluated using the Brant test. Given the violation of this assumption, multinomial logistic regression was applied in subsequent analyses. Three models were utilized in this study: Model 1 was adjusted for sex and age groups; Model 2 was adjusted for Model 1 + sociodemographic factors (residential location, education levels, per capita annual household income, and marital status) and lifestyle factors (sleep status, smoking, alcohol consumption, and physical activity); Model 3 was adjusted for Model 2 + anthropometric measures (BMI groups and WC groups) and laboratory parameters (HbA1c groups, TC, Cr, and UA). The results from the logistic regression analysis were presented as ORs and 95% confidence intervals (CIs). Subgroup analyses were conducted to evaluate potential effect modifications in the associations between the AIP and prehypertension/hypertension by sex, age groups (<40, 40–64, and ≥65 years) (46), BMI groups, smoking, alcohol consumption, residential location, sleep status, and HbA1c groups. Likelihood ratio tests were employed to assess statistical interactions between the AIP and stratification variables.
For further analyses, prehypertension and hypertension were treated as separate binary outcomes. Restricted cubic spline (RCS) analyses with four knots were conducted to explore potential non-linear relationships between the AIP (as a continuous variable) and prehypertension/hypertension risks. Receiver operating characteristic (ROC) curves were generated to identify optimal AIP cutoff values for predicting prehypertension and hypertension, with the optimal thresholds determined using the Youden index. The sensitivity and specificity of these thresholds were calculated, with diagnostic accuracy quantified by the area under the curve (AUC). The mediating roles of the two types of inflammatory indicators [white blood cells (WBCs) and neutrophils (NE)] were analyzed through mediation analysis. In sensitivity analyses, we compared the performance of restricted cubic spline models with different knot specifications based on the Akaike information criterion (AIC), Bayesian information criterion (BIC), likelihood ratio tests, and tests for non-linearity, with the likelihood ratio test given priority. This approach was adopted to mitigate potential bias arising from arbitrary knot placement. In addition, we evaluated the potential impact of unmeasured confounders on the mediation effect by calculating the sensitivity parameter ρ, which represents the correlation between the residuals of the mediator and the outcome models. We also reported R2_M*R2_Y* (the proportion of variance in the mediator and outcome jointly explained by using a hypothetical unmeasured confounder) and R2_M∼R2_Y∼ (the proportion of residual variance explained by using such a confounder after controlling for covariates). All statistical tests were two-tailed, with P < 0.05 considered statistically significant. Analyses were implemented using R software (version 4.4.2).
Results
Characteristics of participants
Table 1 presents the demographic and clinical characteristics of participants stratified by AIP quartiles. A total of 9,473 adults were included in the final analysis, comprising 4,697 males (49.6%) and 4,776 females (50.4%). The median age (±SD) was 48.51 ± 18.42 years. Of the 9,473 participants, 3,273 (34.55%) had prehypertension and 3,248 (34.28%) had hypertension. Except the variables of physical activity levels and annual household income per capita, all variables demonstrated statistically significant differences among AIP groups (Q1–Q4). Compared with the other groups, the participants in the AIP Q4 group were often male, older, and urban residents, had lower education levels, were current smokers and alcohol drinkers, had obesity and diabetes mellitus, and had higher levels of BMI, WC, SBP, DBP, HbA1c, Cr, and UA (all P < 0.05). Conversely, HDL-C was higher in the Q1 group and showed a negative association with the AIP (P < 0.001). Importantly, a higher proportion of individuals with prehypertension or hypertension were observed in the AIP Q4 group compared with the lower quartile AIP groups (P < 0.001).
Table 1
| Variable | Overall | Quartiles of the AIP | ||||
|---|---|---|---|---|---|---|
| Q1 [−0.7360, 0.0354] | Q2 [0.0354, 0.2460] | Q3 [0.2461, 0.4780] | Q4 [0.4781, 2.0200] | P-value | ||
| Included participants | 9,473 | 2,371 | 2,366 | 2,368 | 2,368 | |
| Sex, n (%) | <0.001 | |||||
| Male | 4,697 (49.6) | 784 (33.1) | 1,029 (43.5) | 1,280 (54.1) | 1,604 (67.7) | |
| Female | 4,776 (50.4) | 1,587 (66.9) | 1,337 (56.5) | 1,088 (45.9) | 764 (32.3) | |
| Age (years) | 44.62 ± 18.04 | 39.16 ± 17.67 | 44.17 ± 18.70 | 47.66 ± 18.31 | 47.48 ± 16.05 | <0.001 |
| Age groups, n (%) | <0.001 | |||||
| <40 years | 4,279 (45.2) | 1,407 (59.3) | 1,089 (46.0) | 915 (38.6) | 868 (36.7) | |
| 40–64 years | 3,640 (38.4) | 688 (29.0) | 879 (37.2) | 961 (40.6) | 1,112 (47.0) | |
| ≥65 years | 1,554 (16.4) | 276 (11.6) | 398 (16.8) | 492 (20.8) | 388 (16.4) | |
| Residential location, n (%) | <0.001 | |||||
| Urban | 3,515 (37.1) | 772 (32.6) | 864 (36.5) | 882 (37.2) | 997 (42.1) | |
| Rural | 5,958 (62.9) | 1,599 (67.4) | 1,502 (63.5) | 1,486 (62.8) | 1,371 (57.9) | |
| Marital status, n (%) | <0.001 | |||||
| Unmarried | 2,133 (22.5) | 783 (33.0) | 597 (25.2) | 412 (17.4) | 341 (14.4) | |
| Married/remarried/cohabiting | 6,790 (71.7) | 1,490 (62.8) | 1,616 (68.3) | 1,796 (75.8) | 1,888 (79.7) | |
| Separated | 20 (0.2) | 6 (0.3) | 6 (0.3) | 5 (0.2) | 3 (0.1) | |
| Divorced | 152 (1.6) | 36 (1.5) | 30 (1.3) | 41 (1.7) | 45 (1.9) | |
| Widowed | 378 (4.0) | 56 (2.4) | 117 (4.9) | 114 (4.8) | 91 (3.8) | |
| Education levels, n (%) | <0.001 | |||||
| No schooling | 1,178 (12.4) | 248 (10.5) | 326 (13.8) | 326 (13.8) | 278 (11.7) | |
| Primary school | 1,649 (17.4) | 350 (14.8) | 402 (17.0) | 479 (20.2) | 418 (17.7) | |
| Junior high school | 2,212 (23.4) | 465 (19.6) | 508 (21.5) | 562 (23.7) | 677 (28.6) | |
| Senior high school/technical school | 1,759 (18.6) | 461 (19.4) | 422 (17.8) | 436 (18.4) | 440 (18.6) | |
| College or above | 2,675 (28.2) | 847 (35.7) | 708 (29.9) | 565 (23.9) | 555 (23.4) | |
| Per capita annual household income, n (%) | 0.059 | |||||
| <10,000 RMB | 1,140 (12.0) | 275 (11.6) | 307 (13.0) | 317 (13.4) | 241 (10.2) | |
| 10,000–20,000 RMB | 2,066 (21.8) | 509 (21.5) | 533 (22.5) | 526 (22.2) | 498 (21.0) | |
| 20,000–30,000 RMB | 2,150 (22.7) | 541 (22.8) | 526 (22.2) | 532 (22.5) | 551 (23.3) | |
| 30,000–50,000 RMB | 1,848 (19.5) | 480 (20.2) | 460 (19.4) | 427 (18.0) | 481 (20.3) | |
| 50,000–100,000 RMB | 1,472 (15.5) | 372 (15.7) | 354 (15.0) | 351 (14.8) | 395 (16.7) | |
| ≥100,000 RMB | 797 (8.4) | 194 (8.2) | 186 (7.9) | 215 (9.1) | 202 (8.5) | |
| Smoking, n (%) | <0.001 | |||||
| None | 6,961 (73.5) | 2,021 (85.2) | 1,877 (79.3) | 1,642 (69.3) | 1,421 (60.0) | |
| Former | 338 (3.6) | 52 (2.2) | 78 (3.3) | 95 (4.0) | 113 (4.8) | |
| Current | 2,174 (22.9) | 298 (12.6) | 411 (17.4) | 631 (26.6) | 834 (35.2) | |
| Alcohol consumption, n (%) | <0.001 | |||||
| None | 6,408 (67.6) | 1,756 (74.1) | 1,704 (72.0) | 1,569 (66.3) | 1,379 (58.2) | |
| Rarely | 1,077 (11.4) | 274 (11.6) | 270 (11.4) | 272 (11.5) | 261 (11.0) | |
| Monthly | 880 (9.3) | 169 (7.1) | 186 (7.9) | 247 (10.4) | 278 (11.7) | |
| Weekly | 786 (8.3) | 108 (4.6) | 146 (6.2) | 193 (8.2) | 339 (14.3) | |
| Daily | 322 (3.4) | 64 (2.7) | 60 (2.5) | 87 (3.7) | 111 (4.7) | |
| Physical activity, n (%) | 0.319 | |||||
| Insufficient | 2,260 (23.9) | 540 (22.8) | 564 (23.8) | 562 (23.7) | 594 (25.1) | |
| Sufficient | 7,213 (76.1) | 1,831 (77.2) | 1,802 (76.2) | 1,806 (76.3) | 1,774 (74.9) | |
| Sleep status, n (%) | ||||||
| Good | 6,198 (65.4) | 1,607 (67.8) | 1,552 (65.6) | 1,501 (63.4) | 1,538 (64.9) | 0.012 |
| Insufficient | 2,599 (27.4) | 589 (24.8) | 636 (26.9) | 699 (29.5) | 675 (28.5) | |
| Excessive | 676 (7.1) | 175 (7.4) | 178 (7.5) | 168 (7.1) | 155 (6.5) | |
| Height (cm) | 161.46 ± 9.04 | 160.08 ± 8.71 | 160.79 ± 8.98 | 161.50 ± 9.20 | 163.46 ± 8.93 | <0.001 |
| Weight (kg) | 62.08 ± 12.38 | 55.55 ± 9.62 | 59.82 ± 10.95 | 63.54 ± 11.72 | 69.42 ± 12.63 | <0.001 |
| WC (cm) | 79.84 ± 10.91 | 72.88 ± 9.01 | 77.85 ± 9.99 | 81.89 ± 9.79 | 86.73 ± 9.77 | <0.001 |
| WC groups, n (%) | ||||||
| Normal | 5,672 (59.9) | 2,005 (84.6) | 1,583 (66.9) | 1,256 (53.0) | 828 (35.0) | |
| Precentral obesity | 1,629 (17.2) | 202 (8.5) | 406 (17.2) | 486 (20.5) | 535 (22.6) | |
| Central obesity | 2,172 (22.9) | 164 (6.9) | 377 (15.9) | 626 (26.4) | 1,005 (42.4) | <0.001 |
| BMI (kg/m2) | 23.72 ± 3.72 | 21.64 ± 3.10 | 23.08 ± 3.42 | 24.29 ± 3.47 | 25.88 ± 3.53 | <0.001 |
| BMI groups, n (%) | <0.001 | |||||
| Underweight | 568 (6.0) | 318 (13.4) | 156 (6.6) | 70 (3.0) | 24 (1.0) | |
| Normal | 4,816 (50.8) | 1,608 (67.8) | 1,380 (58.3) | 1,116 (47.1) | 712 (30.1) | |
| Overweight | 2,952 (31.2) | 356 (15.0) | 660 (27.9) | 879 (37.1) | 1,057 (44.6) | |
| Obese | 1,137 (12.0) | 89 (3.8) | 170 (7.2) | 303 (12.8) | 575 (24.3) | |
| HbA1c (%) | 5.61 ± 0.78 | 5.40 ± 0.56 | 5.52 ± 0.68 | 5.64 ± 0.71 | 5.88 ± 1.02 | <0.001 |
| HbA1c groups, n (%) | <0.001 | |||||
| Normal | 6,155 (65.0) | 1,894 (79.9) | 1,639 (69.3) | 1,429 (60.3) | 1,193 (50.4) | |
| Prediabetes | 2,706 (28.6) | 432 (18.2) | 635 (26.8) | 781 (33.0) | 858 (36.2) | |
| Diabetes | 612 (6.5) | 45 (1.9) | 92 (3.9) | 158 (6.7) | 317 (13.4) | |
| UA (μmol/L) | 352.24 ± 93.74 | 314.49 ± 79.91 | 337.49 ± 86.08 | 360.56 ± 88.92 | 396.45 ± 98.95 | <0.001 |
| Cr (μmol/L) | 75.48 ± 23.29 | 70.07 ± 17.80 | 74.19 ± 21.56 | 77.45 ± 23.40 | 80.19 ± 27.99 | <0.001 |
| TG (mmol/L) | 1.42 ± 1.35 | 0.57 ± 0.14 | 0.90 ± 0.18 | 1.33 ± 0.27 | 2.89 ± 2.01 | <0.001 |
| TC (mmol/L) | 4.92 ± 1.04 | 4.66 ± 0.93 | 4.79 ± 1.00 | 5.01 ± 1.03 | 5.24 ± 1.09 | <0.001 |
| HDL-C (mmol/L) | 1.41 ± 0.31 | 1.68 ± 0.29 | 1.47 ± 0.26 | 1.33 ± 0.23 | 1.16 ± 0.20 | <0.001 |
| LDL-C (mmol/L) | 3.06 ± 0.87 | 2.75 ± 0.77 | 3.02 ± 0.84 | 3.27 ± 0.88 | 3.22 ± 0.90 | <0.001 |
| WBC (1,000 cells/µL) | 6.68 ± 5.97 | 6.05 ± 1.53 | 6.45 ± 1.70 | 6.76 ± 1.66 | 7.44 ± 11.57 | <0.001 |
| NE (1,000 cells/µL) | 3.85 ± 3.70 | 3.60 ± 5.88 | 3.72 ± 1.37 | 3.89 ± 1.28 | 4.18 ± 4.04 | <0.001 |
| SBP (mmHg) | 128.95 ± 20.08 | 121.20 ± 17.91 | 127.46 ± 20.35 | 131.48 ± 19.84 | 135.69 ± 19.27 | <0.001 |
| DBP (mmHg) | 80.57 ± 10.91 | 76.39 ± 9.56 | 79.23 ± 10.62 | 81.27 ± 10.41 | 85.38 ± 11.01 | <0.001 |
| Blood pressure categories, n (%) | <0.001 | |||||
| Normal | 2,952 (31.2) | 1,168 (49.3) | 837 (35.4) | 592 (25.0) | 355 (15.0) | |
| Prehypertension | 3,273 (34.6) | 755 (31.8) | 841 (35.5) | 849 (35.9) | 828 (35.0) | |
| Hypertension | 3,248 (34.3) | 448 (18.9) | 688 (29.1) | 927 (39.1) | 1,185 (50.0) | |
Baseline characteristics of participants according to the change in the AIP.
AIP, atherogenic index of plasma; RMB, Renminbi; WC, waist circumference; BMI, body mass index; HbA1c, hemoglobin A1c; UA, uric acid; Cr, creatinine; TC, total cholesterol; TG, triglycerides; HDL-C, high-density lipoprotein cholesterol; LDL-C, low-density lipoprotein cholesterol; WBC, white blood cell; NE, Neutrophils; SBP, systolic blood pressure; DBP, diastolic blood pressure.
Association between AIP and prehypertension/hypertension
Significant positive associations were observed between the AIP and prehypertension or hypertension, irrespective of confounding factor adjustment (Table 2). The results of the multivariable logistic regression Model 3 showed that each 0.1-unit increment in the AIP was associated with a 5% increased risk of prehypertension (OR = 1.05, 95% CI = 1.03–1.07, P < 0.001) and an 11% elevated risk of hypertension (OR = 1.11, 95% CI = 1.09–1.14, P < 0.001). When the AIP was further categorized into quartiles, it was also associated with the risk of prehypertension or hypertension. Compared with the lowest quartile (Q1), the participants in the higher AIP quartiles (Q2–Q4) demonstrated an increased risk of both prehypertension and hypertension (P for trend <0.001). Notably, individuals in the highest AIP quartile (Q4) exhibited a 58% increased risk of prehypertension (ORQ4 VS. Q1 = 1.58, 95% CI = 1.32–1.90, P < 0.001) and a 152% higher risk of hypertension (ORQ4 VS. Q1 = 2.30, 95% CI = 1.86–2.84, P < 0.001).
Table 2
| Variable | Unadjusted model OR (95% CI) |
P-value | Model 1 OR (95% CI) |
P-value | Model 2 OR (95% CI) |
P-value | Model 3 OR (95% CI) |
P-value |
|---|---|---|---|---|---|---|---|---|
| Prehypertension | ||||||||
| AIP*10 | 1.17 (1.15, 1.19) | <0.001 | 1.10 (1.08, 1.12) | <0.001 | 1.11 (1.09, 1.13) | <0.001 | 1.05 (1.03, 1.07) | <0.001 |
| Q1 | Ref | Ref | Ref | Ref | ||||
| Q2 | 1.55 (1.36, 1.77) | <0.001 | 1.31 (1.14, 1.50) | <0.001 | 1.32 (1.15, 1.52) | 0.001 | 1.17 (1.02, 1.35) | 0.029 |
| Q3 | 2.22 (1.93, 2.55) | <0.001 | 1.62 (1.40, 1.88) | <0.001 | 1.66 (1.43, 1.93) | <0.001 | 1.30 (1.11, 1.52) | 0.001 |
| Q4 | 3.61 (3.09, 4.21) | <0.001 | 2.34 (1.99, 2.75) | <0.001 | 2.47 (2.09, 2.93) | <0.001 | 1.58 (1.32, 1.90) | <0.001 |
| P for trend | 5.74 (4.72, 6.99) | <0.001 | 3.07 (2.49, 3.77) | <0.001 | 3.30 (2.67, 4.09) | <0.001 | 1.82 (1.44, 2.30) | <0.001 |
| Hypertension | ||||||||
| AIP*10 | 1.30 (1.27, 1.32) | <0.001 | 1.23 (1.21, 1.26) | <0.001 | 1.24 (1.22, 1.27) | <0.001 | 1.11 (1.09, 1.14) | <0.001 |
| Q1 | Ref | Ref | Ref | Ref | ||||
| Q2 | 2.14 (1.85, 2.49) | <0.001 | 1.63 (1.38, 1.94) | <0.001 | 1.68 (1.41, 2.00) | <0.001 | 1.25 (1.04, 1.50) | 0.019 |
| Q3 | 4.08 (3.51, 4.74) | <0.001 | 2.63 (2.21, 3.12) | <0.001 | 2.72 (2.27, 3.25) | <0.001 | 1.56 (1.29, 1.89) | <0.001 |
| Q4 | 8.70 (7.41, 10.22) | <0.001 | 5.68 (4.72, 6.82) | <0.001 | 6.01 (4.96, 7.26) | <0.001 | 2.30 (1.86, 2.84) | <0.001 |
| P for trend | 18.33 (14.97, 22.43) | <0.001 | 10.36 (8.22, 13.07) | <0.001 | 11.1 (8.72, 14.12) | <0.001 | 3.08 (2.36, 4.04) | <0.001 |
Association between the AIP and prehypertension/hypertension.
Model 1 adjusts for age groups and sex. Model 2 adjusts for Model 1 + residential location, education levels, smoking, alcohol consumption, marital status, per capita annual household income, physical activity, and sleep status. Model 3 adjusts for Model 2 + BMI groups, WC groups, TC, Cr, UA, and HbA1c groups. AIP, atherogenic index of plasma; OR, odds ratio; CI, confidence interval; BMI, body mass index; WC, waist circumference; TC, total cholesterol; Cr, creatinine; UA, uric acid; HbA1c, hemoglobin A1c.
Subgroup analyses
Subgroup analyses and interaction tests were conducted based on age, sex, residential location, educational level, sleep status, smoking, alcohol consumption, HbA1c groups, BMI groups, and WC groups to assess whether the relationship between the AIP and prehypertension/hypertension was consistent across different population subgroups. As shown in Figure 2, the positive association between the AIP and prehypertension remained stable in all subgroups, except among former smokers and individuals who rarely consumed alcohol. A stratified analysis demonstrated stronger associations between the AIP and prehypertension in the 40–64-year age group (OR = 1.08, P < 0.001), individuals with insufficient sleep status (OR = 1.10, P < 0.001), non-smokers (OR = 1.05, P < 0.001), non-alcohol drinkers (OR = 1.07, P < 0.001), and those with normal HbA1c levels (OR = 1.05, P < 0.001), normal BMI (OR = 1.06, P < 0.001), and normal WC (OR = 1.06, P < 0.001). Moreover, robust associations between the AIP and hypertension were consistently observed among middle-aged adults (40–64 years, OR = 1.13, P < 0.001), participants with primary school education (OR = 1.16, P < 0.001), current smokers (OR = 1.11, P < 0.001), daily alcohol consumers (OR = 1.22, P = 0.006), individuals with HbA1c < 5.7% (OR = 1.15, P < 0.001), those with insufficient sleep (OR = 1.17, P = 0.001), overweight participants (OR = 1.14, P < 0.001), and all WC categories (OR = 1.10–1.11, all P < 0.001) (shown in Figure 3). Significant interaction effects were observed between the AIP and residential location (P for interaction = 0.005), as well as educational level (P for interaction = 0.015), on blood pressure classification. Quartile-based analyses further confirmed a graded increase in the risk of prehypertension and hypertension across ascending AIP categories, supporting the robustness of the main findings (Supplementary Tables S1, S2).
Figure 2
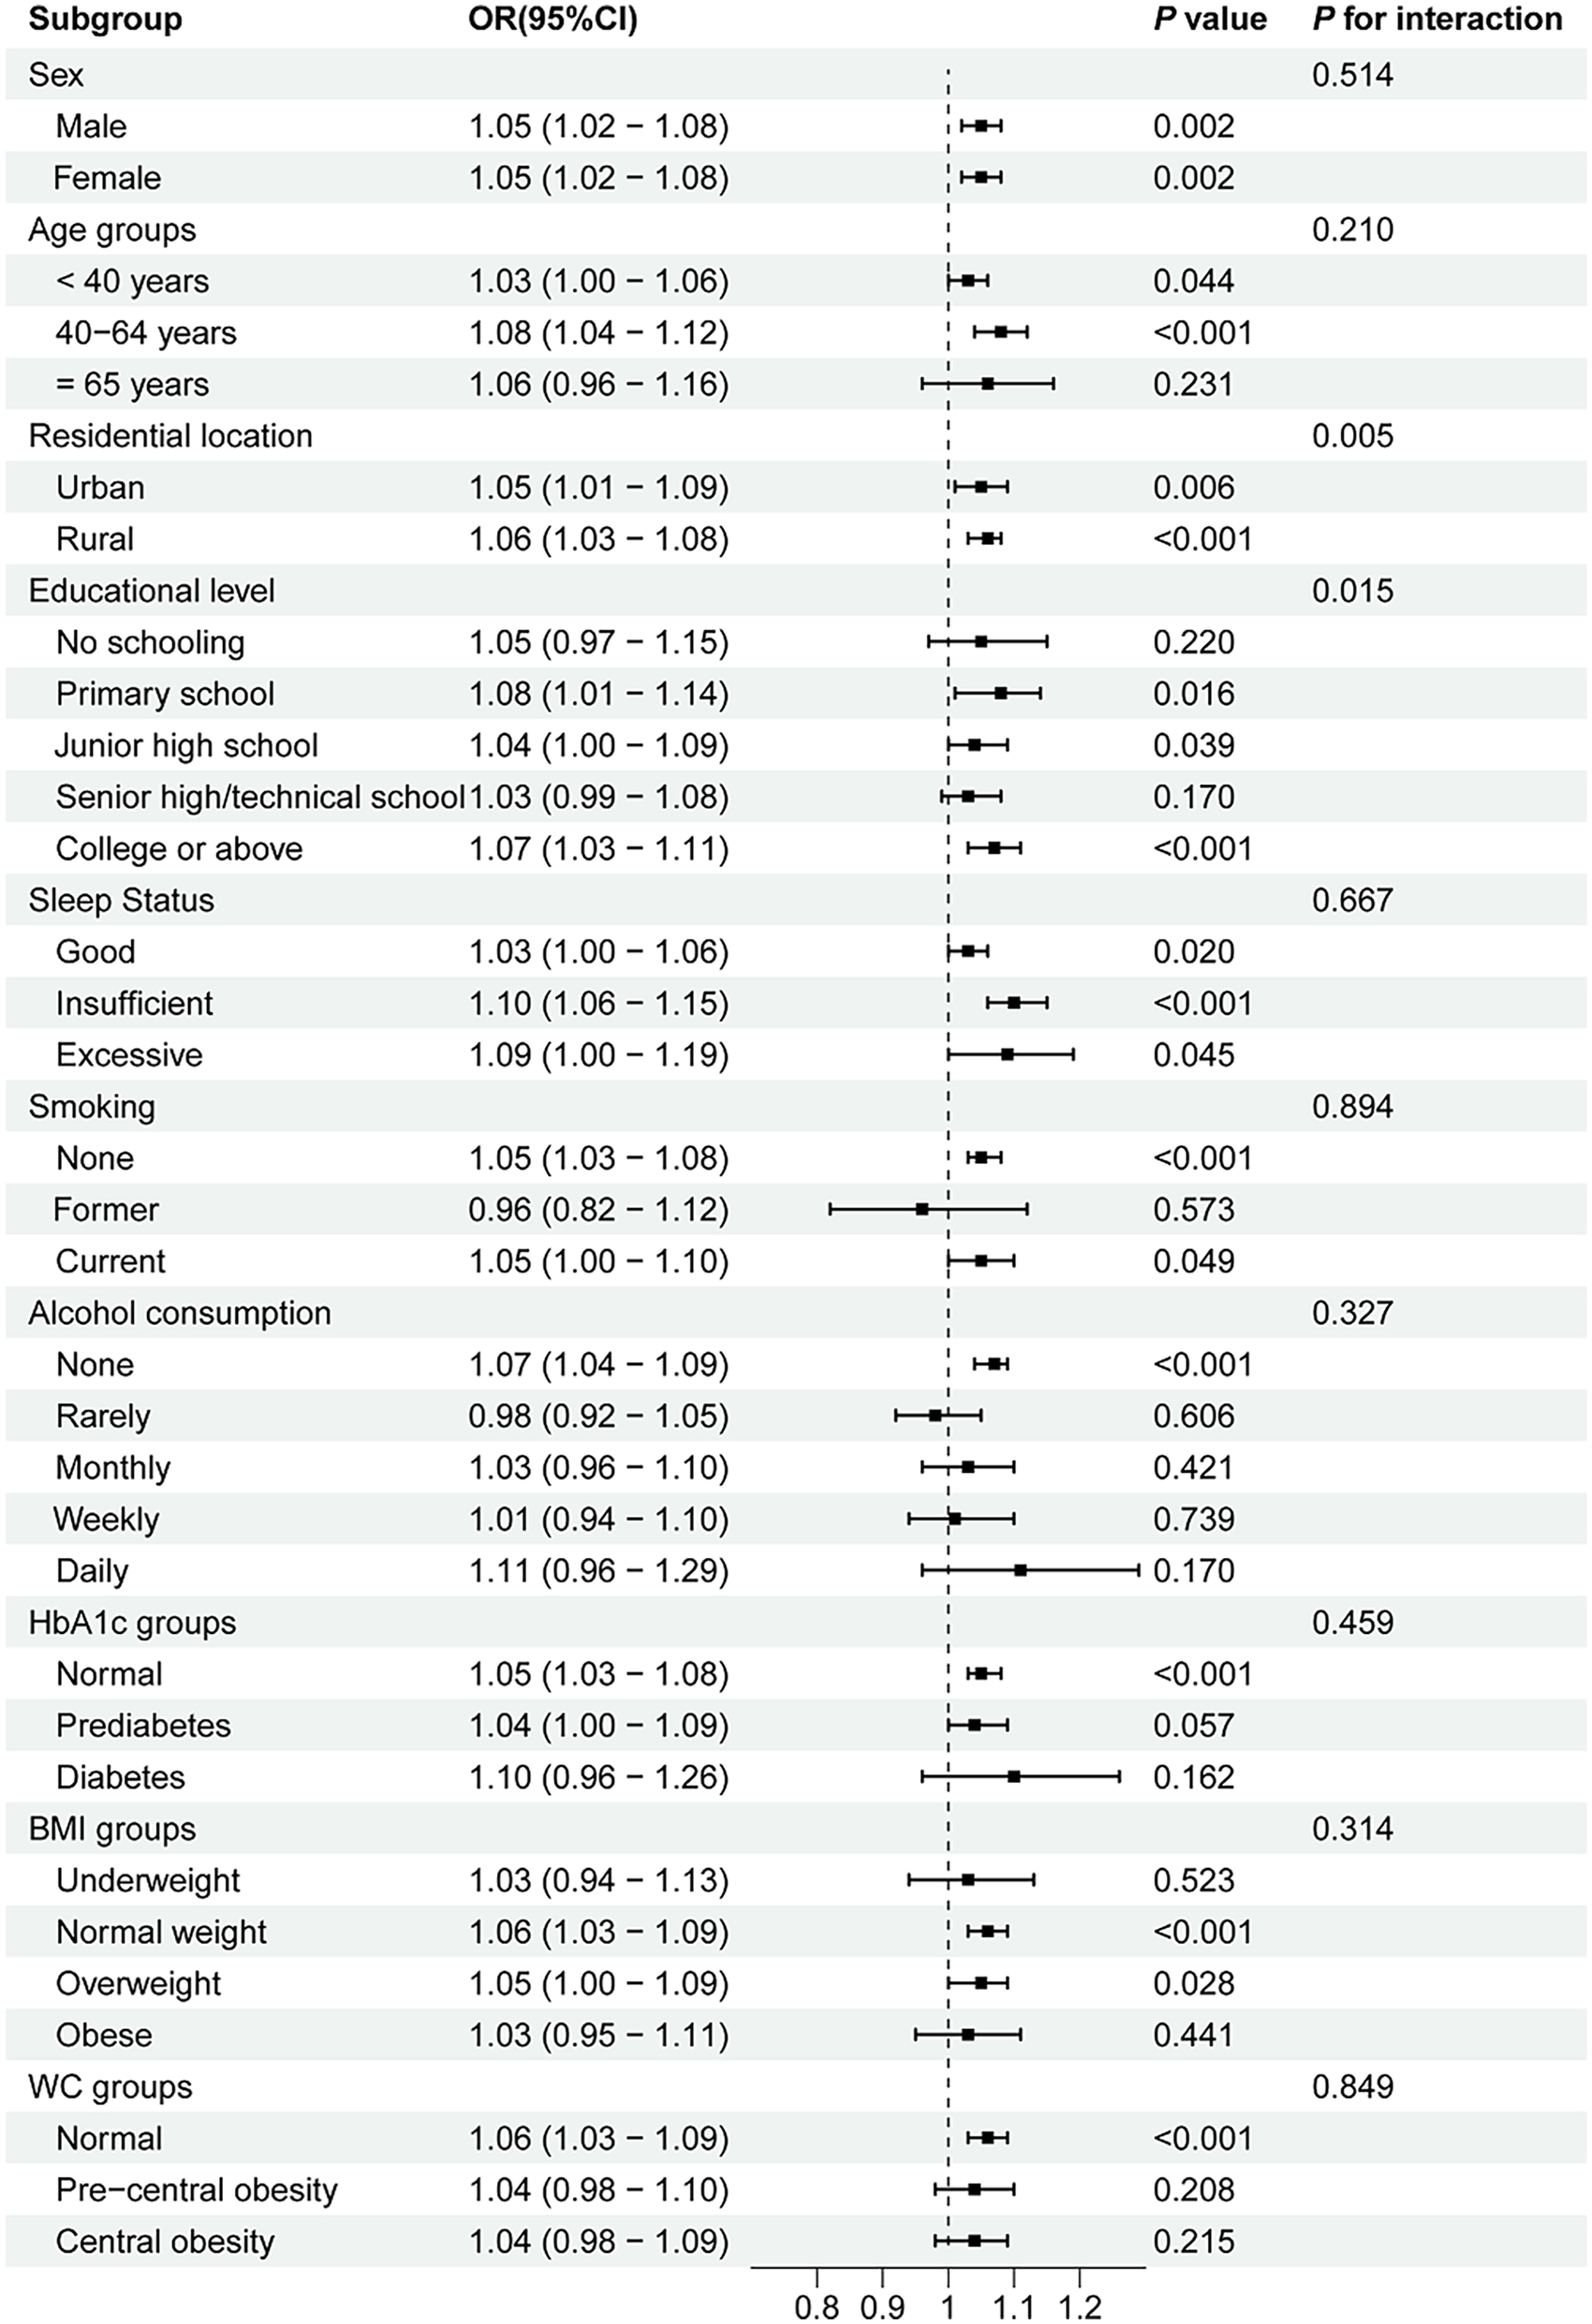
Subgroup analyses of the association between the AIP and prehypertension. AIP, atherogenic index of plasma; OR, odds ratio; CI, confidence interval; WC, waist circumference; BMI, body mass index; HbA1c, hemoglobin A1c.
Figure 3
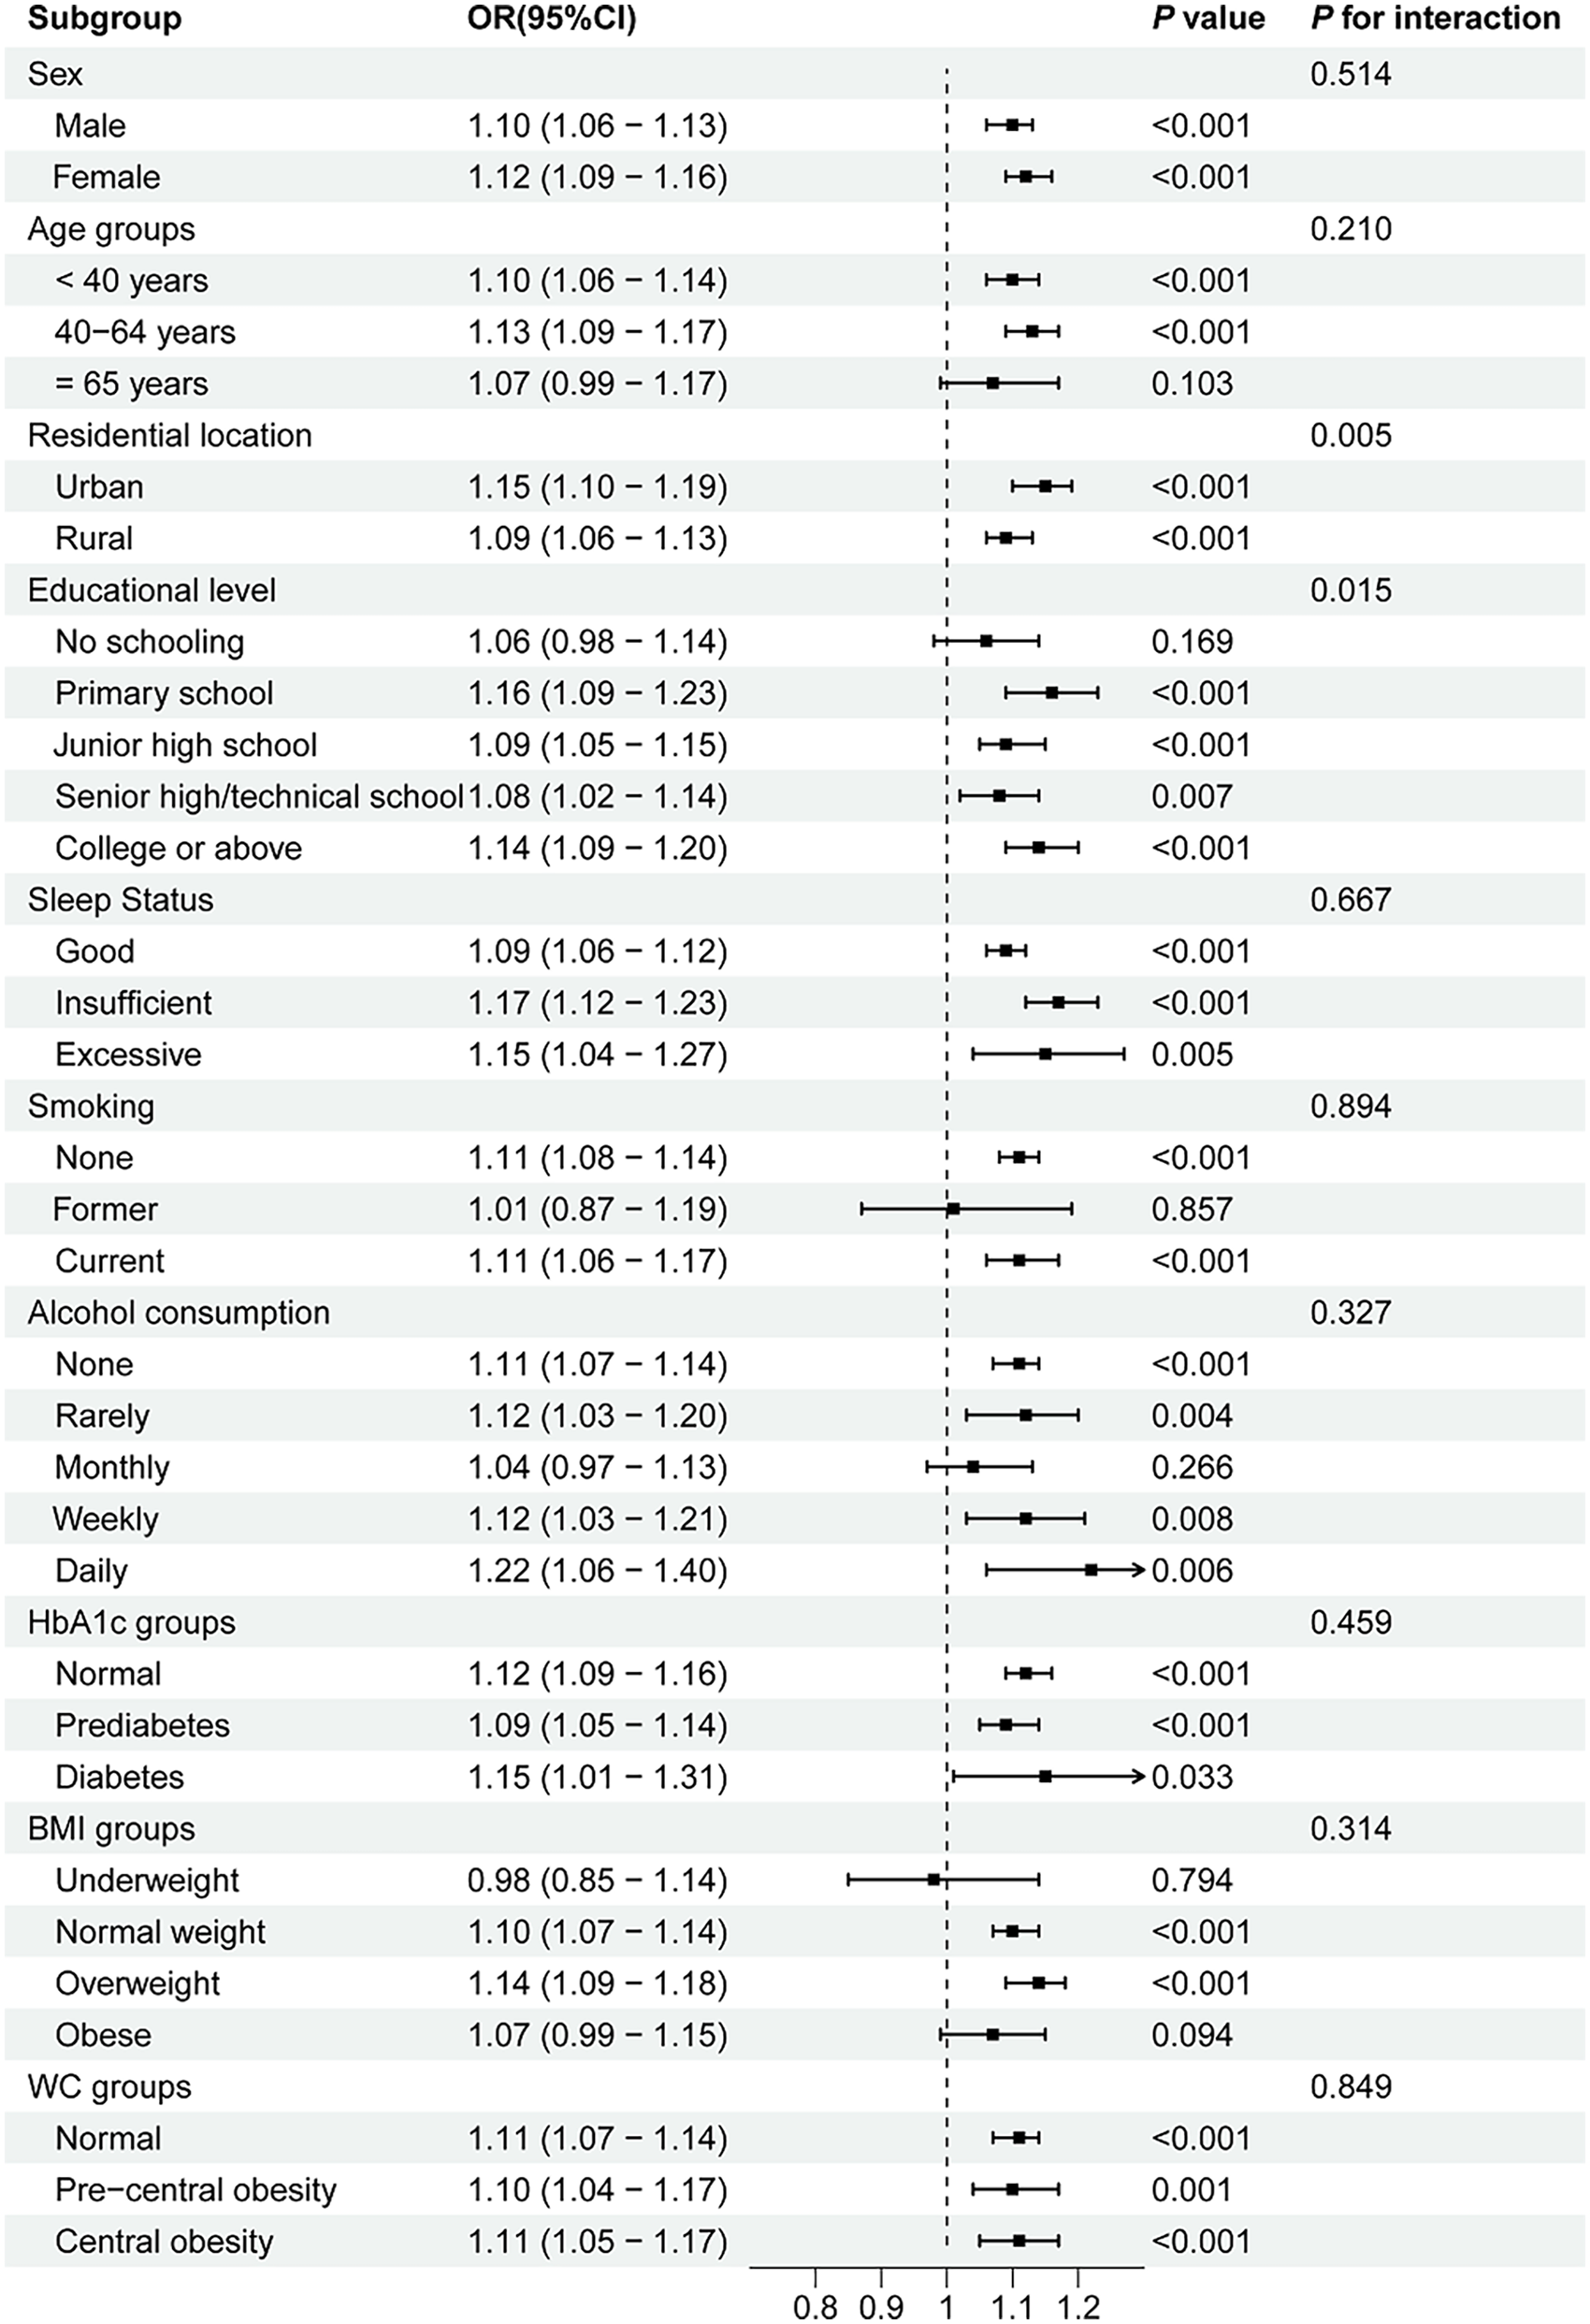
Subgroup analyses of the association between the AIP and hypertension. AIP, atherogenic index of plasma; OR, odds ratio; CI, confidence interval; WC, waist circumference; BMI, body mass index; HbA1c, hemoglobin A1c.
RCS analyses
The dose–response relationship between the AIP and prehypertension or hypertension was further explored using a four-knot RCS model. As shown in Figure 4, in the fully adjusted Model 3, the risk of prehypertension increased with an increasing AIP (P for total <0.001), and no non-linear association was observed (P for non-linear = 0.178). Similarly, after the full adjustment, the AIP was positively associated with the risk of hypertension in a dose–response manner (P for total <0.001, shown in Figure 5), with no evidence of a non-linear relationship (P for non-linear = 0.087, shown in Figure 5).
Figure 4
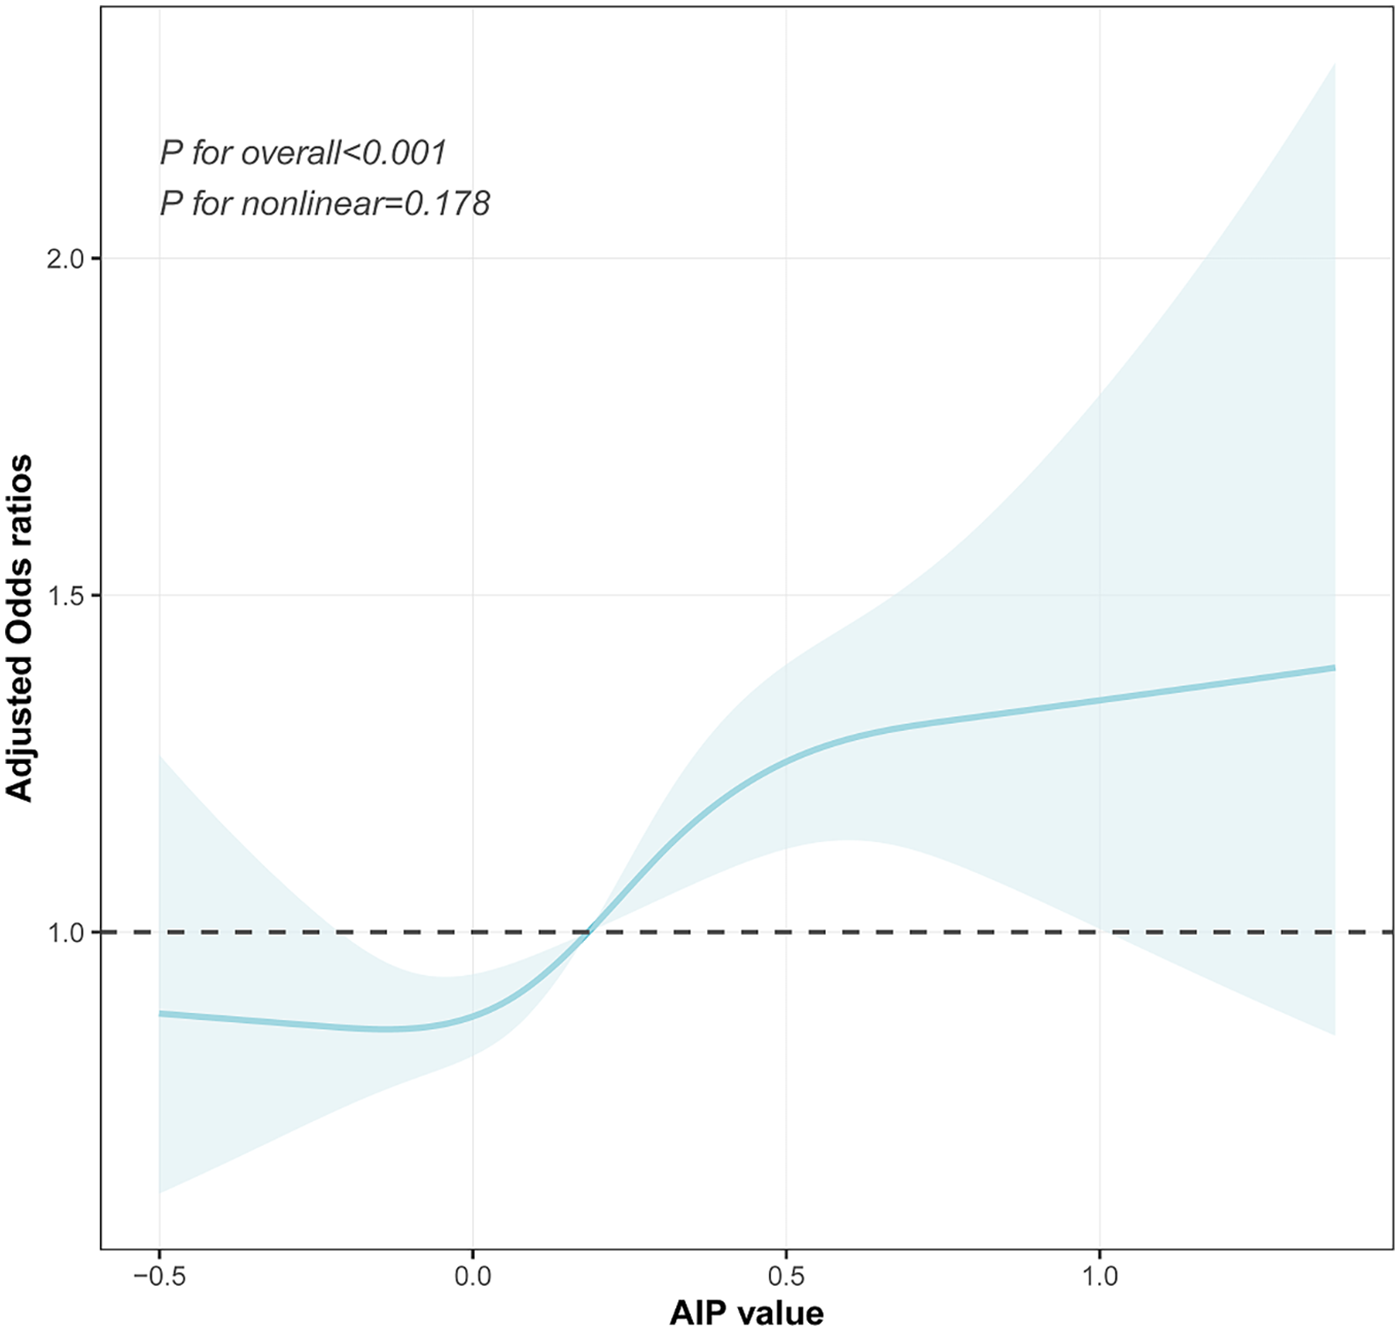
Visualizing the relationship between the AIP and prehypertension using a four-knot RCS (adjusted for Model 3). AIP, atherogenic index of plasma.
Figure 5
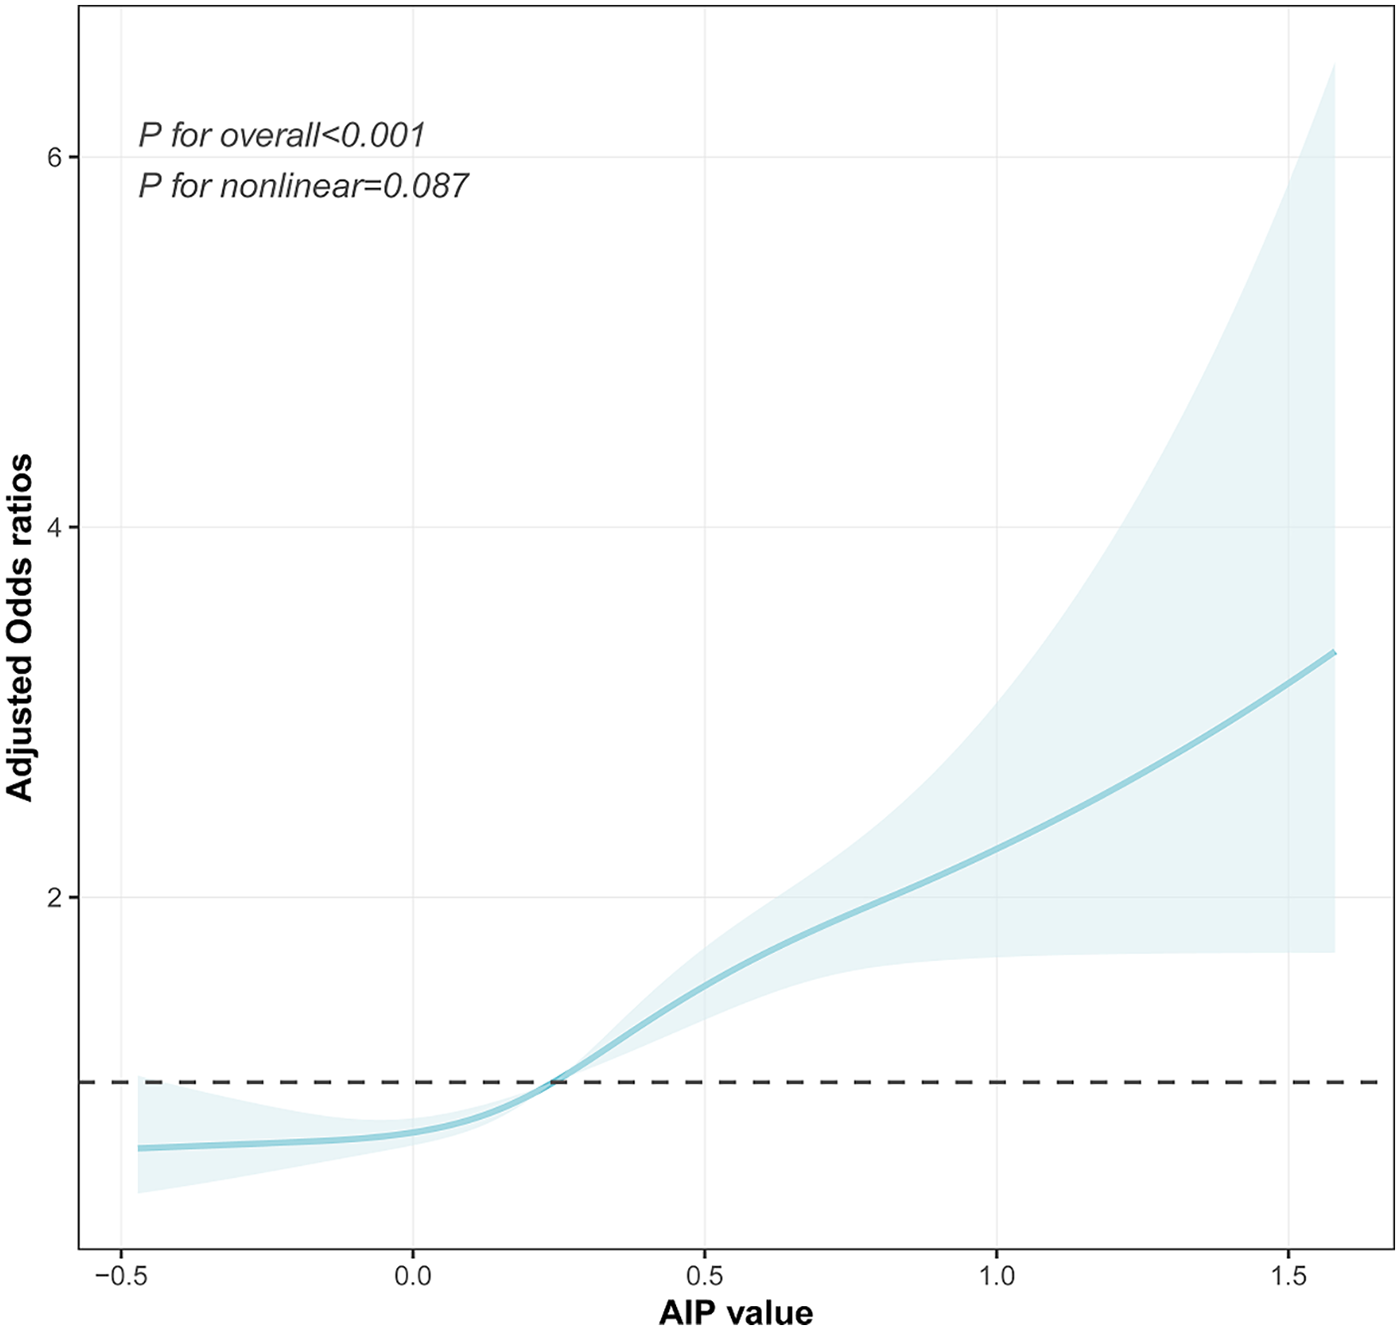
Visualizing the relationship between the AIP and hypertension using a four-knot RCS (adjusted for Model 3). AIP, atherogenic index of plasma.
ROC curve analyses
As illustrated in Figure 6A, the ROC curve analysis for the AIP in predicting prehypertension showed an AUC of 0.632 (95% CI: 0.618–0.646; P < 0.001) with an optimal cutoff value of 0.152 (sensitivity=0.632; specificity = 0.566). These results indicated the limited diagnostic utility of the AIP for prehypertension assessment. For hypertension (Figure 6B), the ROC analysis demonstrated improved discriminatory performance, with an AUC of 0.721 (95% CI: 0.708–0.734; P < 0.001) at a cutoff value of 0.272 (sensitivity = 0.623; specificity = 0.714).
Figure 6
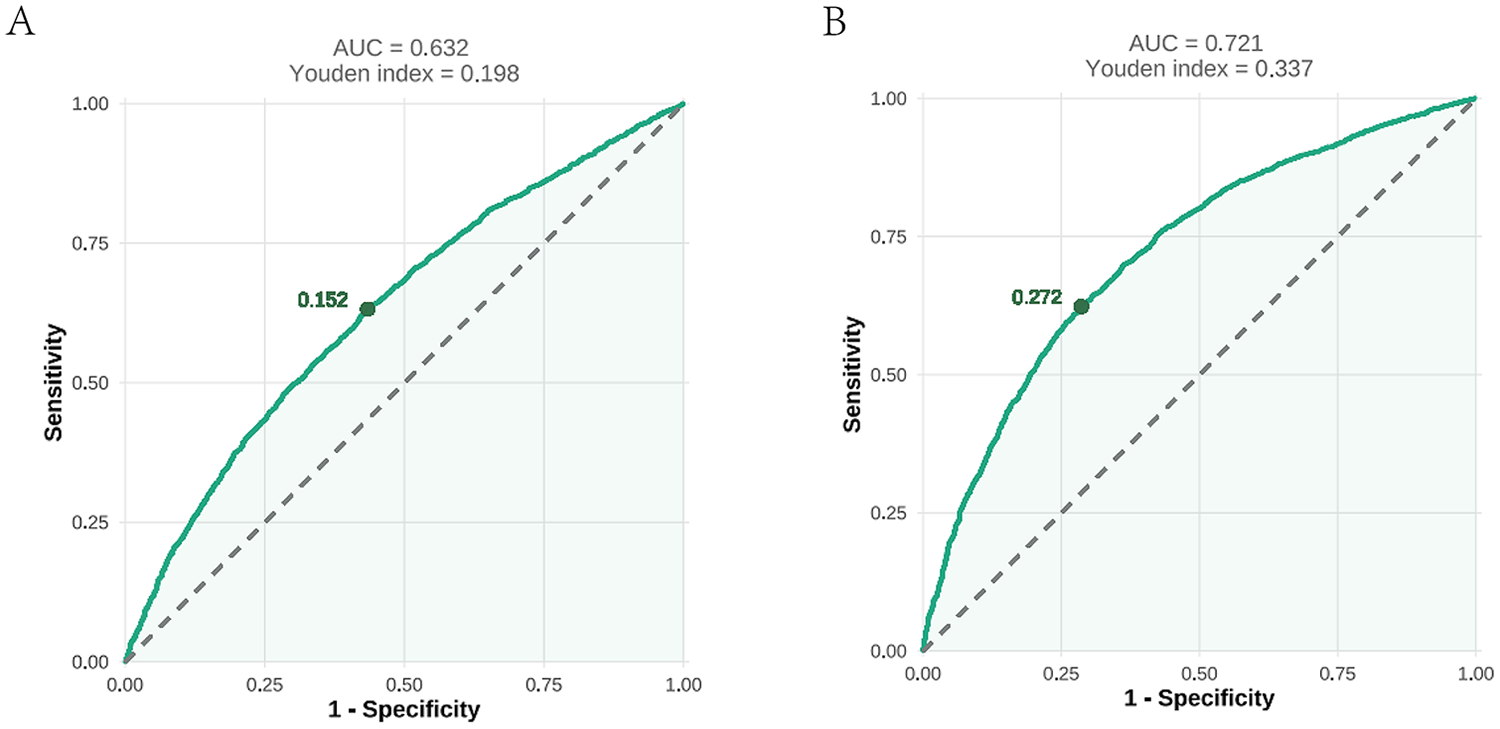
An ROC analysis of the AIP for predicting prehypertension (A) and hypertension (B). ROC, receiver operating characteristic; AUC, area under the curve; AIP, atherogenic index of plasma.
Mediation analyses through WBCs and NE
Mediation analyses revealed that WBCs played a significant mediating role in the relationship between the AIP and blood pressure status. For prehypertension, WBCs mediated 11.87% (95% CI: 5.40%–25.89%) of the total effect; this proportion increased to 15.32% (95% CI: 7.32%–27.96%) for hypertension (Figure 7 and Supplementary Table S3). In contrast, the mediating effect of NE was not significant in either model (P > 0.05) (Supplementary Table S3).
Figure 7
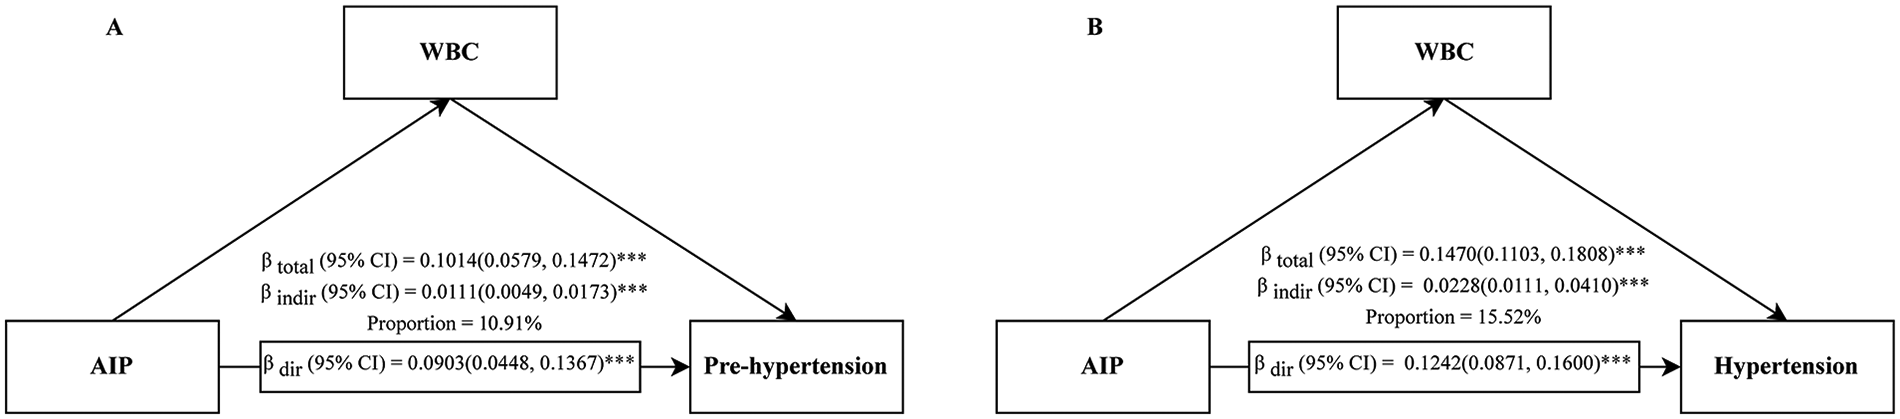
Mediation analysis of the association between the AIP and prehypertension (A)/hypertension (B) through WBCs. AIP, atherogenic index of plasma; CI, confidence interval; WBC, white blood cell; ***P < 0.001.
Sensitivity analyses
For hypertension, the four-knot model showed a significantly better fit than the three-knot model (likelihood ratio test P = 0.030), with the lowest AIC among candidate models (Table 3). For prehypertension, differences in the model fit between the three- and four-knot models were modest, and no strong evidence of non-linearity was observed (Table 3). Increasing the number of knots to five did not further improve model performance for either outcome. Overall, a four-knot restricted cubic spline model was selected as a balance between the model fit and parsimony. Sensitivity analyses suggested that the estimated mediation effect of WBCs for prehypertension was sensitive to potential unmeasured confounding (ρ = 0.1), indicating that this finding should be interpreted with caution. In contrast, the mediation effect for hypertension demonstrated moderate robustness to unmeasured confounding (ρ = 0.3) (Supplementary Table S4).
Table 3
| Knots | AIC | BIC | P for non-linear | Likelihood ratio test (vs. previous model) |
|---|---|---|---|---|
| Prehypertension | ||||
| 3 | 7,559.22 | 7,821.93 | 0.961 | Ref |
| 4 | 7,557.79 | 7,827.24 | 0.178 | χ 2 = 3.43, P = 0.064 |
| 5 | 7,559.38 | 7,835.57 | 0.276 | χ2 = 0.41, P = 0. 523 |
| Hypertension | ||||
| 3 | 4,968.22 | 5,230.78 | 0.763 | Ref |
| 4 | 4,965.53 | 5,234.82 | 0.089 | χ2 = 4.69, P = 0.030 |
| 5 | 4,967.24 | 5,243.27 | 0.161 | χ2 = 0.29, P = 0.594 |
Model performance and statistical comparisons of RCS models with varying knot specifications.
RCS, restricted cubic splines; AIC, Akaike information criterion; BIC, Bayesian information criterion.
Discussion
In this population-based cross-sectional study, our results indicated positive and linear associations between the AIP and the risk of prehypertension and hypertension among the Chinese population aged 18 years and above. Furthermore, subgroup analyses revealed that the association between the AIP and the risk of prehypertension and hypertension was particularly pronounced in individuals with a healthy glucose metabolism and normal body size and in specific behavioral subgroups, and mediation analyses suggested that this association may be partly explained by systemic inflammation, as reflected by WBCs.
The AIP reflects the core features of atherogenic dyslipidemia and is regarded as a novel biomarker for the early diagnosis of CVD events (47). Existing evidence indicates that the AIP is closely associated with coronary artery disease, type 2 diabetes, non-alcoholic fatty liver disease, and other conditions (26, 27, 48). From a clinical perspective, the AIP serves as a useful and integrative marker that captures the balance between atherogenic and antiatherogenic lipid fractions, thereby facilitating early risk stratification for cardiovascular diseases, including hypertension (49). From a pathophysiological standpoint, however, an elevated AIP reflects an unfavorable lipid milieu characterized by increased triglyceride-rich lipoproteins and reduced HDL-C, which may contribute to endothelial dysfunction, arterial stiffness, and low-grade systemic inflammation, all of which are key mechanisms involved in the development and progression of hypertension (50–52). In line with these mechanisms, our results demonstrated a significant positive association of the AIP with hypertension/prehypertension, consistent with, and further extend, the results from multiple previous population-based studies (28–39). Furthermore, we did not observe any evidence of a non-linear association between the AIP and elevated blood pressure.
Subgroup analyses revealed consistent AIP-blood pressure associations across most subgroups, indicating pervasive stability. Notably, a stronger association occurred in individuals aged 40–64, insufficient sleep, normal HbA1c, normal BMI/overweight status, and normal WC. Moreover, the association exhibited significant age dependency, being significant only in groups under 65 years (strongest at 40–64), which aligns with East Asian studies (29, 39). This phenomenon suggests that middle age may represent a critical window period where AIP-related metabolic dysregulation drives blood pressure elevation, as the active insulin resistance and vascular endothelial dysfunction characteristic of this stage synergize with the atherogenic lipid profile to cause damage (53). The absence of an association in the elderly group may be attributed not only to age-related shifts in pathological mechanisms but also to polypharmacy and survival bias (54, 55). The attenuated association in obesity is consistent with what is reported in Cheng et al (32). Such a pattern may reflect the prevalent “metabolically obese normal weight” phenotype (56), wherein many normal-BMI individuals have undetected visceral adiposity or lipid disorders, increasing susceptibility to AIP effects. The stronger association observed in individuals with normal HbA1c and normal WC suggests that within populations characterized by normal body size and healthy glucose metabolism, the AIP may more sensitively reflect the comorbid features of lipid metabolism disorders and blood pressure abnormalities. In addition, the strong association between the AIP and hypertension observed among current smokers and daily alcohol consumers suggests that the synergistic effect of the AIP and behavioral factors may accelerate the progression of hypertension. We observed significant interaction effects between the AIP and both residential location and educational level on blood pressure classification. Interestingly, the association between the AIP and elevated blood pressure was stronger among participants with higher educational levels and those living in urban areas. This may reflect lifestyle patterns such as higher-fat diets, physical inactivity, and greater occupational stress, which could amplify the impact of atherogenic dyslipidemia on blood pressure (57, 58). It is noteworthy that gender did not exert a significant modifying effect on the association between AIP and blood pressure in the present study, while the Japanese study showed that this association was stronger in females (39). The reason for this may be that the population heterogeneity in genetic background, environmental exposures (such as dietary patterns), or metabolic status may render this pathological mechanism universally applicable across genders (59, 60).
In our study, a mediation analysis demonstrated that WBCs significantly mediated the association between the AIP and both pre-hypertension and hypertension, indicating that systemic inflammation partially underlies the effect of the AIP on blood pressure regulation. This association may be mediated through mechanisms involving lipid metabolism disorders combined with vascular damage and inflammatory pathways. Specifically, a high TG/HDL-C ratio promotes oxidative stress and endothelial dysfunction, subsequently driving vascular remodeling and increased blood pressure (61). As for inflammatory pathways, they may act as a mediating mechanism linking the AIP to elevated blood pressure rather than simply a parallel factor (62,63). Studies from Turkey also suggested that the AIP was closely linked to inflammatory markers like C-reactive protein (28).
Our study was strengthened by its large sample size, rigorous multivariate adjustments, mediation analyses, and sensitivity analyses, which collectively enhanced the reliability of the results. However, several limitations should be acknowledged in this study: the cross-sectional design precluded causal inference, necessitating validation of the temporal relationship between the AIP and blood pressure progression through prospective cohorts; the lack of dietary data (e.g., salt intake) may obscure pathways linking the AIP to hypertension; and the findings were specific to adults in Fujian Province, China, with potential under-representation of extreme metabolic phenotypes or subgroups such as individuals with severe obesity. Although WBCs and NE were used to assess the mediating role of inflammation, a more comprehensive measurement of inflammatory factors could provide a deeper understanding of the role of inflammation in the mediation process. At the same time, future studies should employ longitudinal designs to clarify causality and integrate metabolomic approaches to unravel molecular mechanisms. Targeted interventions for high-risk subgroups (e.g., urban populations and those with high educational backgrounds) combining lipid management and lifestyle modifications may yield enhanced cost-effectiveness within health economics frameworks. Furthermore, multimarker models incorporating the AIP and insulin resistance indices may refine hypertension risk prediction models.
Conclusion
The AIP was positively associated with prehypertension and hypertension, and this association was stronger in the 40–64 age group, in individuals with a healthy glucose metabolism and normal body size, and in specific behavioral subgroups. White blood cells mediated this association. Although the cross-sectional design constrained causal inference, the AIP, as a biomarker of lipid metabolism dysregulation, may serve as a reference for early hypertension detection.
Statements
Data availability statement
The raw data supporting the conclusions of this article will be made available by the authors, without undue reservation.
Ethics statement
The studies involving humans were approved by The Medical, Research Ethics Committee of the Second Affiliated Hospital of Fujian Medical University and the Fuwai Cardiovascular Hospital of Beijing, China, approved the study protocol, which complied with the Declaration of Helsinki (ethics number: 2020−1360). The studies were conducted in accordance with the local legislation and institutional requirements. The participants provided their written informed consent to participate in this study.
Author contributions
YJ: Visualization, Formal analysis, Writing – original draft, Investigation. DC: Investigation, Writing – original draft, Formal analysis. JH: Investigation, Writing – original draft, Resources. HC: Investigation, Writing – review & editing, Resources. HZ: Resources, Writing – review & editing, Investigation. YC: Investigation, Writing – review & editing, Resources. HF: Investigation, Resources, Writing – review & editing. YH: Conceptualization, Methodology, Writing – review & editing, Supervision. X-EP: Conceptualization, Project administration, Methodology, Writing – review & editing, Supervision.
Funding
The author(s) declared that financial support was received for this work and/or its publication. This work was supported by the Natural Science Foundation of Fujian Province, China (Grant No. 2023J01628).
Acknowledgments
We would like to express our gratitude to all participants for their cooperation and to all staffs for recruiting subjects and for their technical assistance.
Conflict of interest
The author(s) declared that this work was conducted in the absence of any commercial or financial relationships that could be construed as a potential conflict of interest.
Generative AI statement
The author(s) declared that generative AI was used in the creation of this manuscript. Generative AI was used as a tool to assist in improving the clarity and flow of specific sentences and paragraphs. The core ideas, data analysis, and conclusions remain entirely the authors’ own. All content was critically reviewed and verified by the authors.
Any alternative text (alt text) provided alongside figures in this article has been generated by Frontiers with the support of artificial intelligence, and reasonable efforts have been made to ensure accuracy, including review by the authors, wherever possible. If you identify any issues, please contact us.
Publisher’s note
All claims expressed in this article are solely those of the authors and do not necessarily represent those of their affiliated organizations, or those of the publisher, the editors and the reviewers. Any product that may be evaluated in this article, or claim that may be made by its manufacturer, is not guaranteed or endorsed by the publisher.
Supplementary material
The Supplementary Material for this article can be found online at: https://www.frontiersin.org/articles/10.3389/fcvm.2026.1708190/full#supplementary-material
Abbreviations
AIC, Akaike information criterion; AIP, atherogenic index of plasma; AUC, area under the curve; BIC, Bayesian information criterion; BMI, body mass index; CI, confidence interval; Cr, serum creatinine; CVD, cardiovascular disease; DBP, diastolic blood pressure; GVIF, generalized variance inflation factor; HDL-C, high-density lipoprotein cholesterol; HbA1c, hemoglobin A1c; IQR, interquartile range; LDL-C, low-density lipoprotein cholesterol; LR, likelihood ratio; NE, neutrophils; OR, odds ratio; RMB, renminbi; ROC, receiver operating characteristic; RCS, restricted cubic splines; SBP, systolic blood pressure; SD, standard deviation; T2DM, type 2 diabetes; TC, total cholesterol; TG, triglycerides; WBC, white blood cell; WC, waist circumference; WHO, World Health Organization; UA, uric acid.
References
1.
Xia X Tian X Xu Q Zhang Y Zhang X Li J et al Global trends and regional differences in mortality of cardiovascular disease and its impact on longevity, 1980–2021: age-period-cohort analyses and life expectancy decomposition based on the Global Burden of Disease study 2021. Ageing Res Rev. (2025) 103:102597. 10.1016/j.arr.2024.102597
2.
Benjamin EJ Muntner P Alonso A Bittencourt MS Callaway CW Carson AP et al Heart disease and stroke statistics-2019 update: a report from the American Heart Association. Circulation. (2019) 139:e56–528. 10.1161/cir.0000000000000659
3.
Global Burden of Metabolic Risk Factors for Chronic Diseases Collaboration. Cardiovascular disease, chronic kidney disease, and diabetes mortality burden of cardiometabolic risk factors from 1980 to 2010: a comparative risk assessment. Lancet Diabetes Endocrinol. (2014) 2:634–47. 10.1016/s2213-8587(14)70102-0
4.
World Health Organization. Global Report on Hypertension: The Race Against a Silent Killer. Geneva: World Health Organization (2023). Available online at:https://iris.who.int/handle/10665/372896(Accessed July 02, 2025).
5.
Whelton PK Carey RM Aronow WS Casey DE Jr Collins KJ Dennison Himmelfarb C et al 2017 ACC/AHA/AAPA/ABC/ACPM/AGS/APhA/ASH/ASPC/NMA/PCNA guideline for the prevention, detection, evaluation, and management of high blood pressure in adults: executive summary: a report of the American College of Cardiology/American Heart Association task force on clinical practice guidelines. Hypertension. (2018) 71:1269–324. 10.1161/hyp.0000000000000066
6.
Satoh M Ohkubo T Miura K Harada A Tsutsui A Hozawa A et al Long-term risk of cardiovascular mortality according to age group and blood pressure categories of the latest guideline. Hypertens Res. (2025) 48:1428–33. 10.1038/s41440-025-02151-w
7.
Liu KS Wang B Mak IL Choi EP Lam CL Wan EY . Early onset of hypertension and increased relative risks of chronic kidney disease and mortality: two population-based cohort studies in United Kingdom and Hong Kong. Hypertens Res. (2025) 48:1963–71. 10.1038/s41440-025-02188-x
8.
Booth JN 3rd Li J Zhang L Chen L Muntner P Egan B . Trends in prehypertension and hypertension risk factors in US adults: 1999–2012. Hypertension. (2017) 70:275–84. 10.1161/hypertensionaha.116.09004
9.
Wang Z Chen Z Zhang L Wang X Hao G Zhang Z et al Status of hypertension in China: results from the China hypertension survey, 2012–2015. Circulation. (2018) 137:2344–56. 10.1161/circulationaha.117.032380
10.
Egan BM Julius S . Prehypertension: risk stratification and management considerations. Curr Hypertens Rep. (2008) 10:359–66. 10.1007/s11906-008-0068-0
11.
Singh GM Danaei G Farzadfar F Stevens GA Woodward M Wormser D et al The age-specific quantitative effects of metabolic risk factors on cardiovascular diseases and diabetes: a pooled analysis. PLoS One. (2013) 8:e65174. 10.1371/journal.pone.0065174
12.
Lewington S Clarke R Qizilbash N Peto R Collins R . Age-specific relevance of usual blood pressure to vascular mortality: a meta-analysis of individual data for one million adults in 61 prospective studies. Lancet. (2002) 360:1903–13. 10.1016/s0140-6736(02)11911-8
13.
Lawes CM Rodgers A Bennett DA Parag V Suh I Ueshima H et al Blood pressure and cardiovascular disease in the Asia Pacific region. J Hypertens. (2003) 21:707–16. 10.1097/00004872-200304000-00013
14.
Lawes CM Bennett DA Parag V Woodward M Whitlock G Lam TH et al Blood pressure indices and cardiovascular disease in the Asia Pacific region: a pooled analysis. Hypertension. (2003) 42:69–75. 10.1161/01.Hyp.0000075083.04415.4b
15.
Balistrieri A Makino A Yuan JX . Pathophysiology and pathogenic mechanisms of pulmonary hypertension: role of membrane receptors, ion channels, and Ca(2+) signaling. Physiol Rev. (2023) 103:1827–97. 10.1152/physrev.00030.2021
16.
Murthy M Kurz T Shaughnessy O M K . WNK Signalling pathways in blood pressure regulation. Cell Mol Life Sci. (2017) 74:1261–80. 10.1007/s00018-016-2402-z
17.
Li XC Zhu D Zheng X Zhang J Zhuo JL . Intratubular and intracellular renin-angiotensin system in the kidney: a unifying perspective in blood pressure control. Clin Sci (Lond). (2018) 132:1383–401. 10.1042/cs20180121
18.
Landsberg L Aronne LJ Beilin LJ Burke V Igel LI Lloyd-Jones D et al Obesity-related hypertension: pathogenesis, cardiovascular risk, and treatment–a position paper of the the Obesity Society and the American Society of Hypertension. Obesity (Silver Spring). (2013) 21:8–24. 10.1002/oby.20181
19.
Ginsberg HN Packard CJ Chapman MJ Borén J Aguilar-Salinas CA Averna M et al Triglyceride-rich lipoproteins and their remnants: metabolic insights, role in atherosclerotic cardiovascular disease, and emerging therapeutic strategies—a consensus statement from the European Atherosclerosis Society. Eur Heart J. (2021) 42:4791–806. 10.1093/eurheartj/ehab551
20.
Griendling KK Camargo LL Rios FJ Alves-Lopes R Montezano AC Touyz RM . Oxidative stress and hypertension. Circ Res. (2021) 128:993–1020. 10.1161/circresaha.121.318063
21.
Wolf D Ley K . Immunity and inflammation in atherosclerosis. Circ Res. (2019) 124:315–27. 10.1161/circresaha.118.313591
22.
Ajoolabady A Pratico D Lin L Mantzoros CS Bahijri S Tuomilehto J et al Inflammation in atherosclerosis: pathophysiology and mechanisms. Cell Death Dis. (2024) 15:817. 10.1038/s41419-024-07166-8
23.
Xiao L Harrison DG . Inflammation in hypertension. Can J Cardiol. (2020) 36:635–47. 10.1016/j.cjca.2020.01.013
24.
Dobiásová M Frohlich J . The plasma parameter log (TG/HDL-C) as an atherogenic index: correlation with lipoprotein particle size and esterification rate in apoB-lipoprotein-depleted plasma (FER(HDL)). Clin Biochem. (2001) 34:583–8. 10.1016/s0009-9120(01)00263-6
25.
Fernández-Macías JC Ochoa-Martínez AC Varela-Silva JA Pérez-Maldonado IN . Atherogenic index of plasma: novel predictive biomarker for cardiovascular illnesses. Arch Med Res. (2019) 50:285–94. 10.1016/j.arcmed.2019.08.009
26.
Yin B Wu Z Xia Y Xiao S Chen L Li Y . Non-linear association of atherogenic index of plasma with insulin resistance and type 2 diabetes: a cross-sectional study. Cardiovasc Diabetol. (2023) 22:157. 10.1186/s12933-023-01886-5
27.
Rabiee Rad M Ghasempour Dabaghi G Darouei B Amani-Beni R . The association of atherogenic index of plasma with cardiovascular outcomes in patients with coronary artery disease: a systematic review and meta-analysis. Cardiovasc Diabetol. (2024) 23:119. 10.1186/s12933-024-02198-y
28.
Onat A Can G Kaya H Hergenç G . “Atherogenic index of plasma” (log10 triglyceride/high-density lipoprotein-cholesterol) predicts high blood pressure, diabetes, and vascular events. J Clin Lipidol. (2010) 4:89–98. 10.1016/j.jacl.2010.02.005
29.
Li YW Kao TW Chang PK Chen WL Wu LW . Atherogenic index of plasma as predictors for metabolic syndrome, hypertension and diabetes mellitus in Taiwan citizens: a 9-year longitudinal study. Sci Rep. (2021) 11:9900. 10.1038/s41598-021-89307-z
30.
Rattanatham R Tangpong J Chatatikun M Sun D Kawakami F Imai M et al Assessment of eight insulin resistance surrogate indexes for predicting metabolic syndrome and hypertension in Thai law enforcement officers. PeerJ. (2023) 11:e15463. 10.7717/peerj.15463
31.
Ahari RK Sahranavard T Mansoori A Fallahi Z Babaeepoor N Ferns G et al Association of atherosclerosis indices, serum uric acid to high-density lipoprotein cholesterol ratio and triglycerides-glucose index with hypertension: a gender-disaggregated analysis. J Clin Hypertens (Greenwich). (2024) 26:645–55. 10.1111/jch.14829
32.
Cheng W Zhuang J Chen S . Dyslipidemia and the prevalence of hypertension: a cross-sectional study based on Chinese adults without type 2 diabetes Mellitus. Front Cardiovasc Med. (2022) 9:938363. 10.3389/fcvm.2022.938363
33.
Chen X Li Q Fang Z Huang L Wu P . Association between atherogenic index of plasma and hypertension combined with diabetes mellitus in United States adults: an analysis of the NHANES surveys from 2011 to 2016. J Health Popul Nutr. (2025) 44:269. 10.1186/s41043-025-01013-y
34.
Chen X Wang L Lai W Zhou B . Relationship between atherogenic Index of plasma and hypertension in Chinese middle-aged and older adults: a cross-sectional and longitudinal analysis based on CHARLS. Aging Med (Milton). (2025) 8:107–16. 10.1002/agm2.70015
35.
Liu K Ji Q Qin S Liu L Zhang H Huang H et al The link between the atherogenic index of plasma and the risk of hypertension: analysis from NHANES 2017–2020. PLoS One. (2025) 20:e0317116. 10.1371/journal.pone.0317116
36.
Mo D Zhang P Zhang M Dai H Wang G . Association between the atherogenic index of plasma and incident hypertension across different blood pressure states: a national cohort study. Cardiovasc Diabetol. (2025) 24:219. 10.1186/s12933-025-02775-9
37.
Qi Q Wu X Han Q Li L Deng J Jiang Y et al Relationship between the cumulative exposure to atherogenic index of plasma and new-onset hypertension: a prospective cohort study. Nutr Metab Cardiovasc Dis. (2025) 36:104293. 10.1016/j.numecd.2025.104293
38.
Zhang Z Wang J Kong L Li C Bao W Tu H et al Sex-specific differences in the relationship between the atherogenic index and hypertension in middle-aged and elderly Chinese. Front Endocrinol (Lausanne). (2025) 16:1574125. 10.3389/fendo.2025.1574125
39.
Tan M Zhang Y Jin L Wang Y Cui W Nasifu L et al Association between atherogenic index of plasma and prehypertension or hypertension among normoglycemia subjects in a Japan population: a cross-sectional study. Lipids Health Dis. (2023) 22:87. 10.1186/s12944-023-01853-9
40.
Wang Z Zhang L Chen Z Wang X Shao L Guo M et al Survey on prevalence of hypertension in China: background, aim, method and design. Int J Cardiol. (2014) 174:721–3. 10.1016/j.ijcard.2014.03.117
41.
Wang JG . Chinese Guidelines for the prevention and treatment of hypertension (2024 revision). J Geriatr Cardiol. (2025) 22:1–149. 10.26599/1671-5411.2025.01.008
42.
Dobiásová M . Atherogenic index of plasma [log(triglycerides/HDL-cholesterol)]: theoretical and practical implications. Clin Chem. (2004) 50:1113–5. 10.1373/clinchem.2004.033175
43.
Won KB Choi SY Chun EJ Park SH Sung J Jung HO et al Different associations of atherogenic index of plasma, triglyceride glucose index, and hemoglobin A1C levels with the risk of coronary artery calcification progression according to established diabetes. Cardiovasc Diabetol. (2024) 23:418. 10.1186/s12933-024-02508-4
44.
Chinese Nutrition Society OPaCS, Chinese Nutrition Society CNS, Chinese Preventive Medicine Association BHS, Chinese Preventive Medicine Association SaHS. [Expert Consensus on Obesity Prevention and Treatment in China]. Zhonghua Liu Xing Bing Xue Za Zhi. (2022) 43:609–26. 10.3760/cma.j.cn112338-20220402-00253
45.
American Diabetes Association Professional Practice Committee. 2. Diagnosis and classification of diabetes: standards of care in diabetes-2024. Diabetes Care. (2024) 47:S20–42. 10.2337/dc24-S002
46.
Chen Y Lu C Ju H Zhou Q Zhao X . Elevated AIP is associated with the prevalence of MAFLD in the US adults: evidence from NHANES 2017–2018. Front Endocrinol (Lausanne). (2024) 15:1405828. 10.3389/fendo.2024.1405828
47.
Li X Lu L Chen Y Liu B Liu B Tian H et al Association of atherogenic index of plasma trajectory with the incidence of cardiovascular disease over a 12-year follow-up: findings from the ELSA cohort study. Cardiovasc Diabetol. (2025) 24:124. 10.1186/s12933-025-02677-w
48.
Liu J Zhou L An Y Wang Y Wang G . The atherogenic index of plasma: a novel factor more closely related to non-alcoholic fatty liver disease than other lipid parameters in adults. Front Nutr. (2022) 9:954219. 10.3389/fnut.2022.954219
49.
Zhong W Zhu N Shen X Ge Z Liu X Zhang G et al Association between the atherogenic index of plasma and risk of large-artery atherosclerotic ischemic stroke. Front Neurol. (2025) 16:1529628. 10.3389/fneur.2025.1529628
50.
Tang X Liu J Li H Chen Z Yang L Du R . Sex differences in the association between atherogenic index of plasma and α-klotho: insights from a community-based cohort. Ann Med. (2025) 57:2534091. 10.1080/07853890.2025.2534091
51.
Yao J Xu J Sun Y Ji Y Lou H Wu X et al Association of triglyceride-glucose index and atherogenic index of plasma with sarcopenia across different glucose metabolism states: the mediating role of oxidative stress and chronic inflammation. Eur J Med Res. (2025) 31:27. 10.1186/s40001-025-03550-y
52.
Sánchez E Santos MD Nuñez-Garcia M Bueno M Sajoux I Yeramian A et al Randomized clinical trial to evaluate the morphological changes in the adventitial vasa vasorum density and biological markers of endothelial dysfunction in subjects with moderate obesity undergoing a very low-calorie ketogenic diet. Nutrients. (2021) 14:33. 10.3390/nu14010033
53.
Muniyappa R Sowers JR . Role of insulin resistance in endothelial dysfunction. Rev Endocr Metab Disord. (2013) 14:5–12. 10.1007/s11154-012-9229-1
54.
Sun Z . Aging, arterial stiffness, and hypertension. Hypertension. (2015) 65:252–6. 10.1161/hypertensionaha.114.03617
55.
Mateos-Cáceres PJ Zamorano-León JJ Rodríguez-Sierra P Macaya C López-Farré AJ . New and old mechanisms associated with hypertension in the elderly. Int J Hypertens. (2012) 2012:150107. 10.1155/2012/150107
56.
. WHO Expert Consultation. Appropriate body-mass index for Asian populations and its implications for policy and intervention strategies. Lancet. (2004) 363:157–63. 10.1016/s0140-6736(03)15268-3
57.
Teo K Chow CK Vaz M Rangarajan S Yusuf S . The Prospective Urban Rural Epidemiology (PURE) study: examining the impact of societal influences on chronic noncommunicable diseases in low-, middle-, and high-income countries. Am Heart J. (2009) 158:1–7.e1. 10.1016/j.ahj.2009.04.019
58.
Hahn RA Truman BI . Education improves public health and promotes health equity. Int J Health Serv. (2015) 45:657–78. 10.1177/0020731415585986
59.
Tang H Zhang Z Li Z Lin J Fang DZ . High-carbohydrate/low-fat diet-induced gender-specific serum lipid profile changes are associated with LEPR polymorphisms in Chinese youth. Ann Nutr Metab. (2017) 70:1–8. 10.1159/000455165
60.
Hu C Wang S Lin H Wan Q Zheng R Zhu Y et al Body size, insulin sensitivity, metabolic health and risk of cardiovascular disease in Chinese adults: insights from the China Cardiometabolic Disease and Cancer Cohort (4C) study. Diabetes Obes Metab. (2024) 26:2176–87. 10.1111/dom.15525
61.
Ramírez-Melo LM Estrada-Luna D Rubio-Ruiz ME Castañeda-Ovando A Fernández-Martínez E Jiménez-Osorio AS et al Relevance of lipoprotein composition in endothelial dysfunction and the development of hypertension. Int J Mol Sci. (2025) 26:1125. 10.3390/ijms26031125
62.
Lian PA Xie F Zhang W Cheng S Zhao YF Li L et al Association of the atherogenic index of plasma and high-sensitivity C-reactive protein with incident cardiovascular disease: evidence from a national cohort of middle-aged and older Chinese adults. Front Endocrinol (Lausanne). (2025) 16:1618157. 10.3389/fendo.2025.1618157
63.
Zhang Z Zhao L Zhou X Meng X Zhou X . Role of inflammation, immunity, and oxidative stress in hypertension: new insights and potential therapeutic targets. Front Immunol. (2022) 13:1098725. 10.3389/fimmu.2022.1098725
Summary
Keywords
atherogenic index of plasma, blood pressure, cross-sectional study, hypertension, prehypertension
Citation
Jiang Y, Chen D, Huang J, Chang H, Zhang H, Cai Y, Fang H, Han Y and Peng X-E (2026) Association between the atherogenic index of plasma and prehypertension or hypertension among adults in Fujian, China: a population-based cross-sectional study. Front. Cardiovasc. Med. 13:1708190. doi: 10.3389/fcvm.2026.1708190
Received
25 September 2025
Revised
06 January 2026
Accepted
12 January 2026
Published
05 February 2026
Volume
13 - 2026
Edited by
Alexander Akhmedov, University of Zurich, Switzerland
Reviewed by
Randa Salah Gomaa Mahmoud, Zagazig University, Egypt
Samar Imbaby, Suez Canal University, Egypt
Updates
Copyright
© 2026 Jiang, Chen, Huang, Chang, Zhang, Cai, Fang, Han and Peng.
This is an open-access article distributed under the terms of the Creative Commons Attribution License (CC BY). The use, distribution or reproduction in other forums is permitted, provided the original author(s) and the copyright owner(s) are credited and that the original publication in this journal is cited, in accordance with accepted academic practice. No use, distribution or reproduction is permitted which does not comply with these terms.
* Correspondence: Xian-E Peng fmuxe@163.com Ying Han hyhanying@aliyun.com
†These authors have contributed equally to this work and share first authorship
Disclaimer
All claims expressed in this article are solely those of the authors and do not necessarily represent those of their affiliated organizations, or those of the publisher, the editors and the reviewers. Any product that may be evaluated in this article or claim that may be made by its manufacturer is not guaranteed or endorsed by the publisher.