 Thomas Dickmeis1
 Yi Feng2
 Maria Caterina Mione3
 Nikolay Ninov4,5,6
 Massimo Santoro7
 Herman P. Spaink8
 Philipp Gut9*
- 1Institute of Toxicology and Genetics, Karlsruhe Institute of Technology, Eggenstein-Leopoldshafen, Germany
- 2Centre for Inflammation Research, Queen’s Medical Research Institute, The University of Edinburgh, Edinburgh, Scotland
- 3Centre for Integrative Biology, University of Trento, Trento, Italy
- 4DFG-Center for Regenerative Therapies Dresden, Cluster of Excellence, Technische Universität Dresden, Dresden, Germany
- 5Paul Langerhans Institute Dresden, Helmholtz Zentrum München, Faculty of Medicine, University Hospital Carl Gustav Carus, Technische Universität Dresden, Dresden, Germany
- 6German Center for Diabetes Research (DZD e.V.), Neuherberg, Germany
- 7Department of Biology, University of Padova, Padua, Italy
- 8Institute of Biology Leiden, Leiden University, Leiden, Netherlands
- 9Nestlé Research, EPFL Innovation Park, Lausanne, Switzerland
In the past years, evidence has emerged that hallmarks of human metabolic disorders can be recapitulated in zebrafish using genetic, pharmacological or dietary interventions. An advantage of modeling metabolic diseases in zebrafish compared to other “lower organisms” is the presence of a vertebrate body plan providing the possibility to study the tissue-intrinsic processes preceding the loss of metabolic homeostasis. While the small size of zebrafish is advantageous in many aspects, it also has shortcomings such as the difficulty to obtain sufficient amounts for biochemical analyses in response to metabolic challenges. A workshop at the European Zebrafish Principal Investigator meeting in Trento, Italy, was dedicated to discuss the advantages and disadvantages of zebrafish to study metabolic disorders. This perspective article by the participants highlights strategies to achieve improved tissue-resolution for read-outs using “nano-sampling” approaches for metabolomics as well as live imaging of zebrafish expressing fluorescent reporter tools that inform on cellular or subcellular metabolic processes. We provide several examples, including the use of reporter tools to study the heterogeneity of pancreatic beta-cells within their tissue environment. While limitations exist, we believe that with the advent of new technologies and more labs developing methods that can be applied to minimal amounts of tissue or single cells, zebrafish will further increase their utility to study energy metabolism.
Introduction
Zebrafish (Danio rerio) have evolved from being a model organism primarily used for studies of vertebrate development to a widely applied research tool, including its use in behavioral research, genetics, physiology, disease modeling, toxicology, and drug discovery (Lieschke and Currie, 2007; Kalueff et al., 2013; MacRae and Peterson, 2015; Gut et al., 2017). The growing use of zebrafish is based on the presence of a vertebrate body plan and observations that tissue-specific physiological processes are surprisingly similar between zebrafish and humans (Schlegel and Gut, 2015; Gut et al., 2017). The conservation of the core mechanisms has led to the development of genetic, dietary and pharmacological models to study the principles of energy metabolism under physiological and disease conditions (Santoro, 2014; Gut et al., 2017).
Metabolic diseases are systemic disorders driven by the failure of single or multiple tissues to maintain homeostasis. Loss of metabolic homeostasis occurs when specialized tissues have lost their reserve capacity to react to daily metabolic challenges. For example, the diagnosis of diabetes is preceded by years of compensation during which a reduced number of functional beta cells maintains normoglycemia after meal intake. With further decline of beta-cell function during persistent metabolic stress, a minimum threshold of functional beta-cell mass is reached, causing elevated fasting and post-prandial glucose excursions and ultimately leading to diabetes (Chen C. et al., 2017). Challenging this reserve capacity to study the biochemical processes of cells that protect or accelerate functional responses to metabolic stressors are a cornerstone of metabolic research (Tschop et al., 2012). Due to their small body size, many of the challenges that are routinely done in larger laboratory animals can be difficult to implement in zebrafish. A workshop on metabolism at the 5th European Zebrafish Principal Investigator meeting (March 20–23, 2018 in Trento1) was dedicated to discuss novel solutions to remaining obstacles that prevent a wider and more impactful use of zebrafish for metabolic studies. As a result of this discussion, we summarize recent progress in “nano-sampling” approaches for metabolomics studies that provide possibilities to quantify metabolites with tissue-resolution in zebrafish larvae. Furthermore, we outline strategies using reporter tools and live imaging to study heterogeneity of cellular function within the tissue environment, an avenue that holds great promise to investigate the early cellular events leading to metabolic disease with clear advantages of using translucent zebrafish.
Recent Advances in Nano-Sampling for Metabolomics
Metabolomics technologies have facilitated systematic studies of energy substrates and their intermediates in response to different metabolic states, as well as the contribution of pathologically elevated metabolites to disease onset and progression. Over the past years, metabolomics methods have also been increasingly applied to zebrafish. Typically, samples from pooled embryos/larvae and from adult tissues have been analyzed by nuclear magnetic resonance (NMR) spectroscopy as well as chromatographic or mass spectrometric (MS) methods (Ong et al., 2009; Papan and Chen, 2009; Soanes et al., 2011). [For recent examples by the workshop participants, see (Chatzopoulou et al., 2015; Martano et al., 2015; Weger et al., 2016) and below]. Targeted MS methods can reduce the amount of required material to as few as five embryos at 3 dpf (Kantae et al., 2016), but despite these efforts data interpretation remains challenging considering that metabolites are determined from pooled tissues. Efforts to increase tissue resolution have been made by applying manual microdissection, for example to determine the specific lipid composition of the embryo proper vs. the composition of yolk lipids at different stages, thereby separating two groups of tissues, but still using material from 15 embryos per sample (Fraher et al., 2016). To improve tissue resolution with minimal input material, microneedle sampling has been used to take yolk samples from single embryos for the quantification of drug uptake by targeted UPLC-MS (Ordas et al., 2015). Recently it also has become possible to draw blood from larvae: small drops could be obtained from the posterior cardinal vein at 5 dpf using a microneedle in conjunction with imaging to calculate the sample volume (van Wijk et al., 2018). Using this method the blood concentration, distribution volume and clearance of paracetamol was estimated in response to exposure from the water. Further optimization is required to compare blood sampling from different anatomical locations and to provide additional proof-of-concept examples beyond paracetamol. The determination of pharmacokinetic properties of a small molecule in a zebrafish larvae at nano-scale is a step forward in making zebrafish a suitable complementary model for drug discovery and development.
In another proof-of-concept study Xenopus embryos were applied for nano-sampling using a microprobe single cell CE-ESI-MS technique, which could determine about 70 metabolites from single blastomeres from the 32 cell stage (Onjiko et al., 2017). As the sample volumes used in these microneedle-based approaches are similar between zebrafish [20–200 nL; whole 3 dpf larva ∼290 nL (Kantae et al., 2016)] and Xenopus (10–15 nL), the capillary sampling method might also allow for untargeted metabolomics in the zebrafish.
Recent technical advances in single cell metabolomics with cultured cells demonstrate the feasibility of reaching cellular resolution also for cells smaller than early embryonic blastomeres with subcellular sampling on the horizon (Esaki and Masujima, 2015); reviewed in Armbrecht and Dittrich (2017), Yang et al. (2017), Qi et al. (2018). Although challenging, microdissections using microneedles or capillaries on tissues from zebrafish will be ideally suited for single cell metabolomics facilitated by the rich resource of reporter transgenic lines for the identification of embryonic and larval anatomical structures.
An alternative approach to nano-sampling is mass spectrometry imaging, which may achieve even higher spatial resolution and give snapshots of in situ metabolite distribution. For example, Dueñas et al. (2017) used MALDI imaging to map phospholipid distributions in early zebrafish embryos (up to 16 cell stage) at about 10 μm resolution. However, a downside of MALDI imaging is that it requires cryosectioning of the embryos and has an analytical bias for lipids (Baker et al., 2017; Emara et al., 2017). Secondary Ion Mass Spectrometry (SIMS) achieves higher resolutions than MALDI imaging, but is equally limited to fixed samples (Passarelli and Ewing, 2013; Armbrecht and Dittrich, 2017).
Toward a better understanding of metabolite dynamics, continuous recording of metabolome changes in vivo will be required. In vivo Nuclear Magnetic Resonance (NMR) spectroscopy is a promising approach for such metabolic monitoring, and a few pioneering studies have followed metabolite changes during development and in response to hypoxia or herbicide exposure in medaka embryos (Viant et al., 2002, 2006; Pincetich et al., 2005). As spectroscopic analysis can be combined with magnetic resonance (MR) imaging, also spatial information on metabolite distribution is accessible to these techniques. For example, Kabli et al. (2009) recorded high resolution localized MR spectra from live adult zebrafish brains with a voxel size of 1.5 mm3 and could detect several amino acids and other metabolites. Further improvements of the instruments are likely to increase both metabolite and spatial resolution as well as sensitivity of these methods.
Another strategy to examine metabolism beyond steady state levels is the application of tracer technologies to assess flux rates through different pathways. Mugoni et al. (2013a,b) used 13C isotope labeling to study prenyl lipid metabolism in zebrafish embryos, showing reduced Coenzyme Q10 and Q9 synthesis based on HPLC analysis of extracts from 25 embryos mutant for UbiA-domain containing protein 1 (ubiad1) and their wild-type siblings. Combining such tracer studies with the cellular and sub-cellular analysis methods currently being developed should provide unprecedented insight into metabolic pathways and their (patho-)physiological changes in vivo. Table 1 summarizes methods that are relevant for nano-sampling strategies in zebrafish.
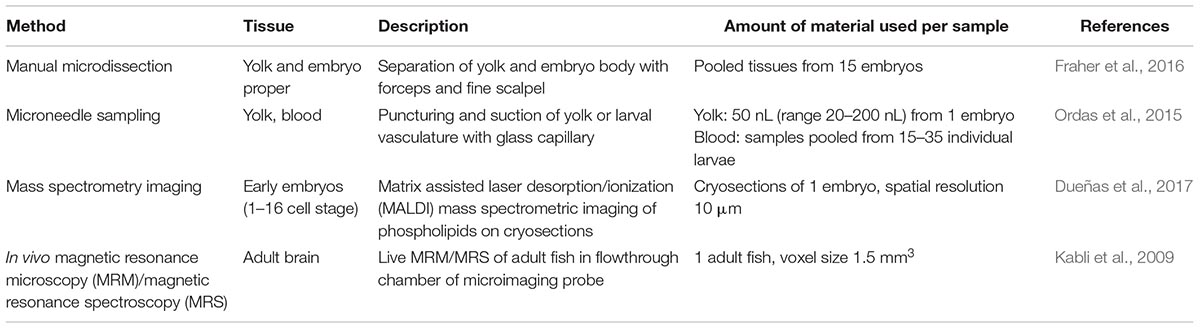
Table 1. Nano-sampling approaches for metabolomics.
Looking forward, key applications for metabolomics studies in zebrafish include the investigation of cancer metabolism; metabolic reprogramming is a hallmark described as an intrinsic property of cancer and is based on the observation that proliferating cells require a large amount of nutrients, energy, and biosynthetic activity to produce the macromolecular components of the newly generated cells. The zebrafish, with its large collection of genetic models of cancers and the popular transplantation assays, represents the ideal model system for analysis of metabolism during cancer progression (White et al., 2013). While the tools for studying changes in metabolism in vivo are being developed, a number of studies have already revealed altered metabolism in a zebrafish model of glioma progression, including changes in glycolytic rate as well as lipid and nucleotide metabolism (Bräutigam et al., 2016; Tan et al., 2016; Zhang M. et al., 2018). Known oncogenes have been reported to rewire metabolic pathways in zebrafish. For example, Yap was found to reprogram glutamine metabolism to increase nucleotide biosynthesis in a zebrafish model of liver hyperplasia (Cox et al., 2016).
To provide a framework to compare metabolic changes in response to reprogrammed metabolic pathways between mammalian and fish metabolism, a metabolic network model (MetaFishNet2) has been generated (Li et al., 2010) and refined recently (Bekaert, 2012). Metabolic network models integrate genetic, epigenetic and metabolic information and allow predictions of cancer type-specific metabolic pathways, drug targets and therapeutic strategies, and have been constructed for a number of organisms and tissues [reviewed in Masoudi-Nejad and Asgari (2015)]. The MetaFishNet model was used to draw a comparison between human and fish metabolic pathways, showing a large overlap, and to analyze gene expression data in a zebrafish liver cancer model (Lam et al., 2006). Several metabolic pathways were predicted to be misregulated in zebrafish liver cancer (Li et al., 2010), and Wnt signaling was found to remodel lipid metabolism in tumors induced by overexpression of the oncogene Ras in hepatocarcinoma cells and zebrafish liver tumors (Yao et al., 2018). Advances in nano-sampling and metabolomics requiring low-input of materials will provide powerful technologies to investigate cancer-type specific metabolic changes in zebrafish cancer models.
Tissue-Resolution of Metabolic Regulation Using Reporter Tools
An alternative to the direct quantification of metabolites in tissues is the indirect visualization of physiological processes (Gut et al., 2013), metabolite ratios (Panieri et al., 2017), or signaling effects of metabolites (Niethammer et al., 2009) in zebrafish using fluorescent probes [Reviewed in Santoro (2014)]. The transparency of zebrafish larvae and amenability to genetic modification has enabled live imaging of these reporter tools in tissues and single cells (Figure 1). Further advantages of these strategies include the possibility to monitor processes continuously and in response to challenges, such as in the background of genetically modified zebrafish, following the treatment with drugs or toxins, or after exposure to tissue damage. For example, the use of genetically encoded H2O2 sensor HyPer has revealed the critical function of H2O2 as a chemoattractant released from the wound edge (Niethammer et al., 2009). However, HyPer is also sensitive to changes in pH and therefore requires careful control with pH sensors such as SypHer (Roma et al., 2012; Weller et al., 2014). Further pioneering work has been done using sensor probes for the cellular redox state that are less sensitive to pH, such as recently developed novel transgenic zebrafish lines expressing the metabolic redox biosensors roGFP2-Orp1 and Grx1-roGFP2 (Morgan et al., 2011) in endothelial and myocardial cells (Panieri and Santoro, 2017). These reporters rely on ratio-metric imaging of the sensor for real-time imaging of hydrogen peroxide (H2O2) levels and the redox potential of glutathione (EGSH) in specific subcellular compartments (Panieri and Santoro, 2017). Specifically, imaging these sensors showed higher basal levels of H2O2 in the mitochondrial matrix than other sub-cellular compartments (Panieri et al., 2017). Similarly, the mitochondrial matrix was characterized by more oxidizing EGSH compared to the cytosol and the nucleus (Panieri et al., 2017). Pharmacologic treatments suggest that the pentose phosphate and glutathione biosynthetic pathways exert a protective antioxidant role in vivo in endothelial cells and cardiomyocytes (Panieri et al., 2017).
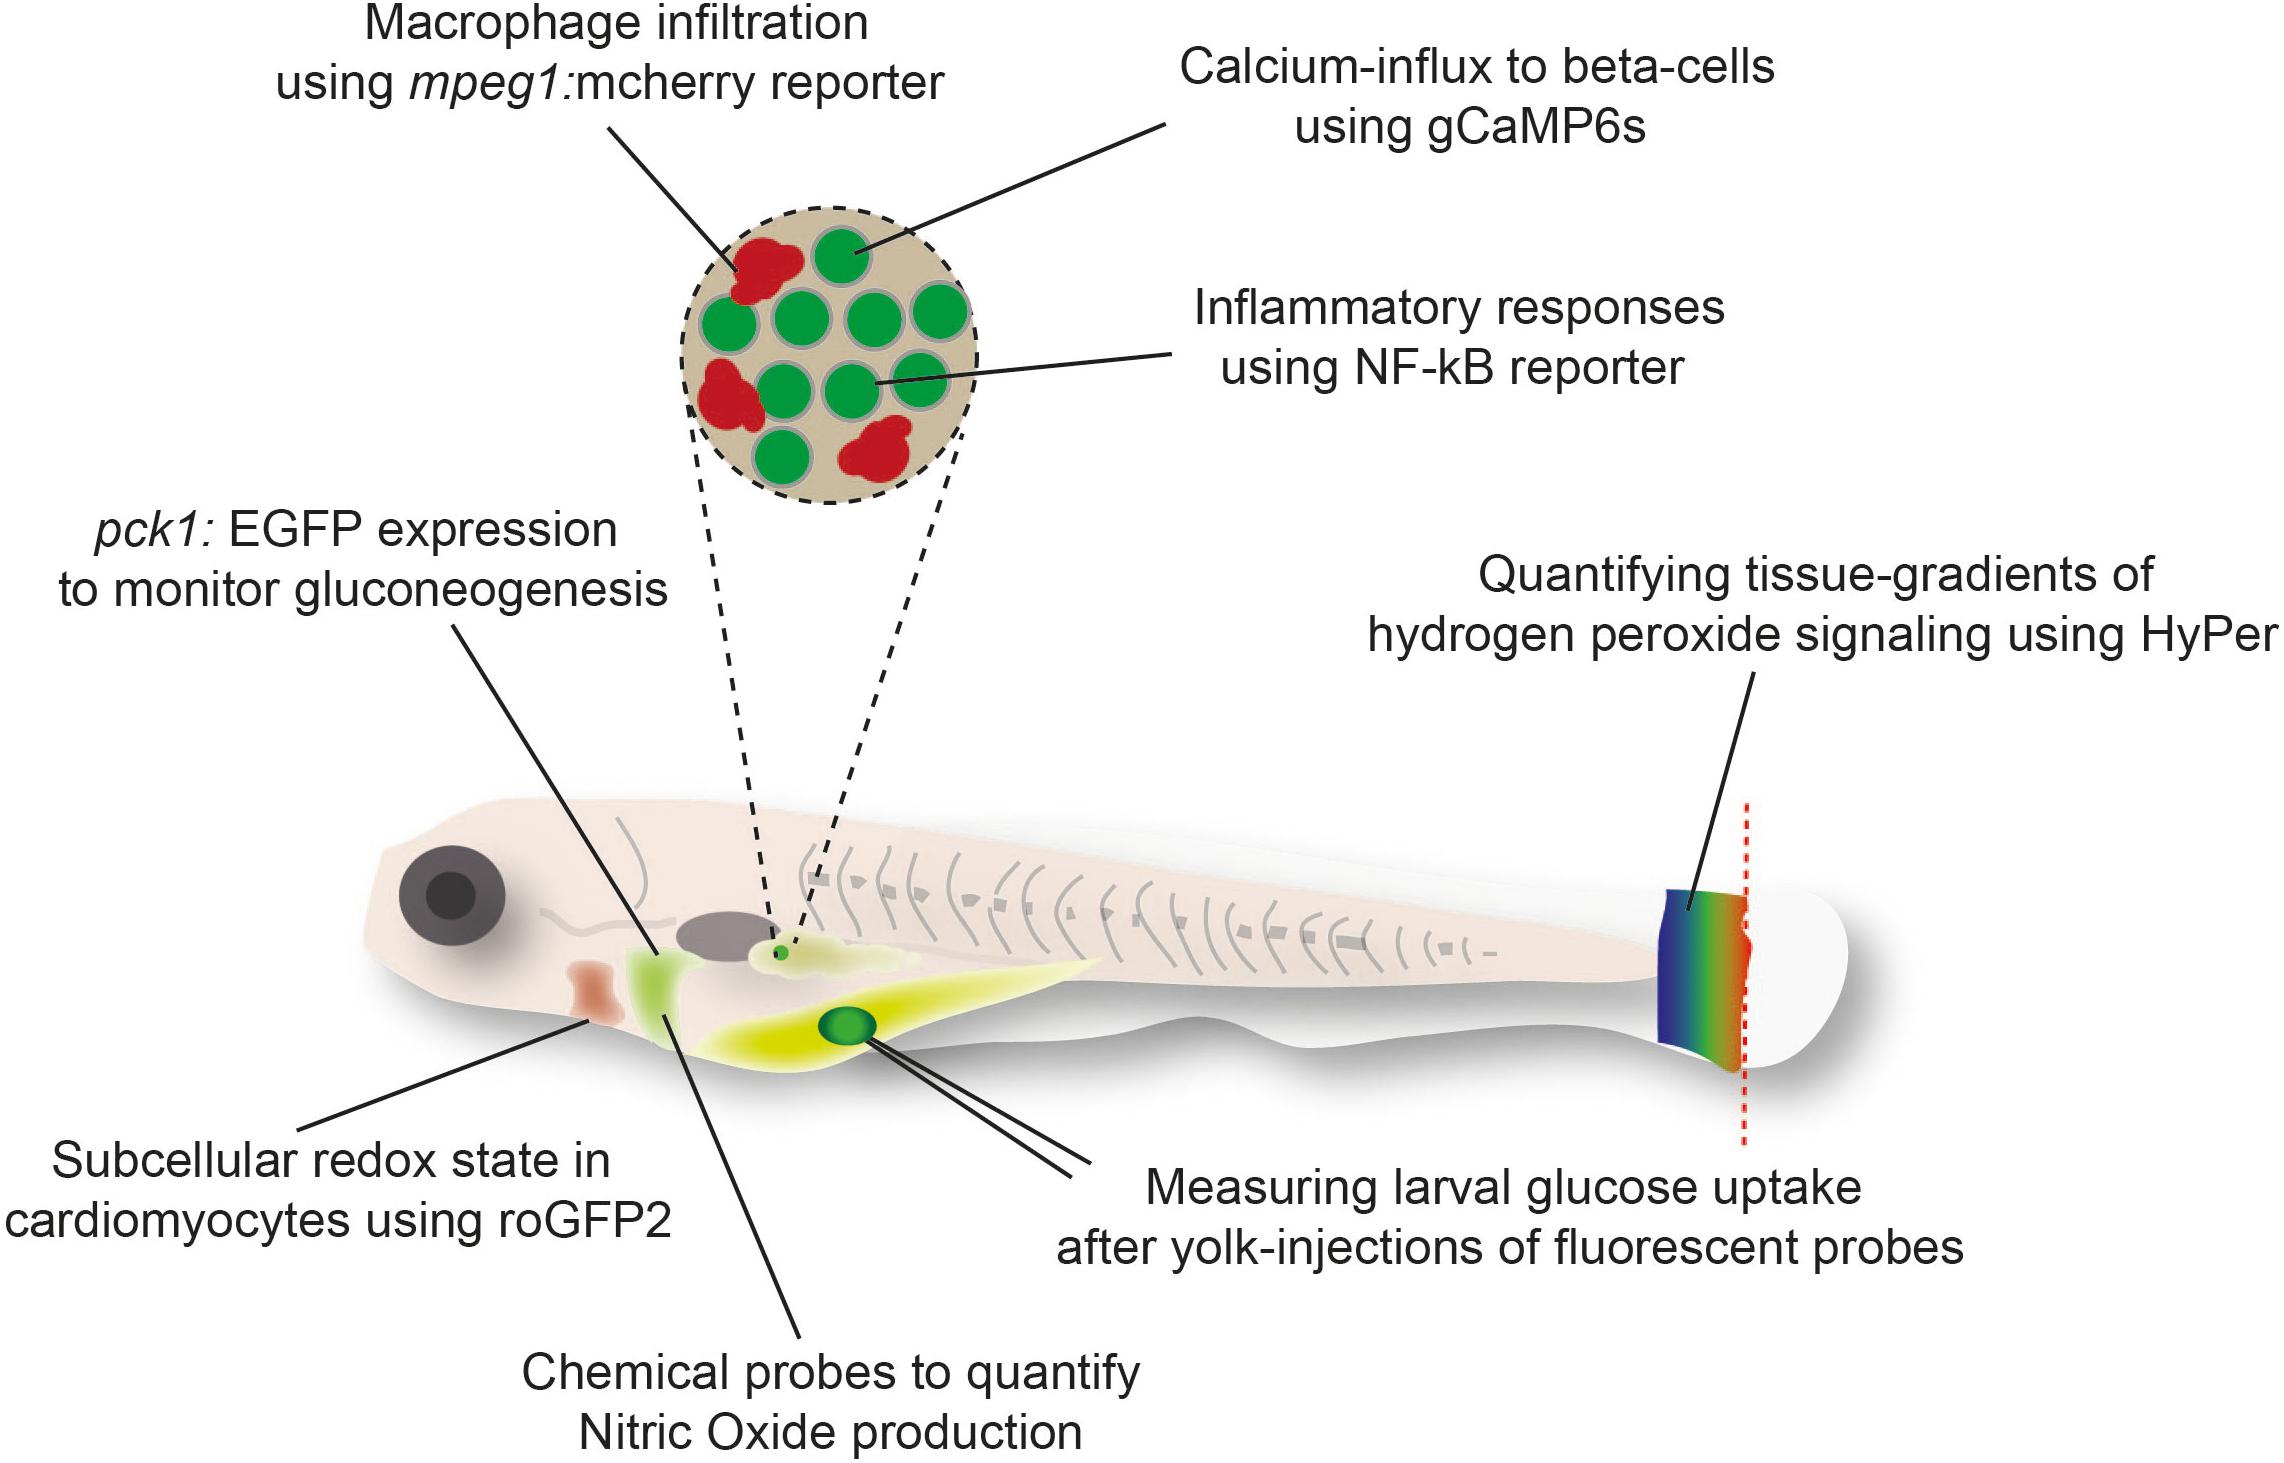
Figure 1. Examples of fluorescent reporter tools used in zebrafish larvae to monitor metabolic responses in cells or tissues.
Similarly, transgenic expression of other ratio-metric fluorescent biosensors for metabolites are on the way. Among those, Perceval HR (Berg et al., 2009) for measuring ATP/ADP ratio and Peredox for measuring NADH-NAD(+) ratio (Hung et al., 2011) are widely used biosensors in mammalian systems. Validation in zebrafish is lacking, but efforts to use them in live larvae are ongoing (unpublished data; YF). Förster Resonance Energy Transfer (FRET) based metabolite reporters are also promising in their application in zebrafish live imaging. Transgenic expression of the lactate FRET reporter. As more genetically encoded metabolite reporters are developed (Jensen et al., 2006; Gruenwald et al., 2012; Luddecke et al., 2017), we envisage that many of these reporters can also be used in zebrafish models to image and quantify metabolism at the cellular and subcellular levels.
In addition to genetically encoded metabolite probes, fluorescently labeled carbon sources such as glucose, lactate, and lipids analogs can be used to trace their uptake into cells in vivo in zebrafish embryos [(Marin-Juez et al., 2015; Anderson et al., 2016) and unpublished data; YF]. There is also increasing interest in developing novel fluorescent chemical probes for various metabolites, ions and redox species. Some of these tools have been successfully tested in zebrafish embryos such as a fluorescent sensor to detect Nitric Oxide in liver cells of zebrafish (Zhang et al., 2018a). Other probes include a polymer micelles-based ratio-metric fluorescent probe for hypochlorous acid (HClO) to monitor HClO generation during liver injury in vivo in zebrafish embryos (Zhang et al., 2018b).
However, most metabolite sensors are developed and optimized in mammalian tissue culture systems. Additional efforts are required to validate their sensitivity and accuracy in zebrafish embryos, which is particularly the case for FRET probes that often have been optimized to function at 37°C. Once a reliable imaging protocol is established, these sensors will be invaluable tools to monitor dynamic metabolic changes in specific tissues, cells and sub-cellular compartments in physiology and disease conditions. Table 2 summarizes reporter tools that can be used to quantify metabolites and includes information whether these tools have been tested in zebrafish yet. Although these tools will not be able to replace traditional biochemical approaches on sampled tissues, the live observation of metabolites and signaling events in vivo can provide invaluable insights into metabolic regulation.
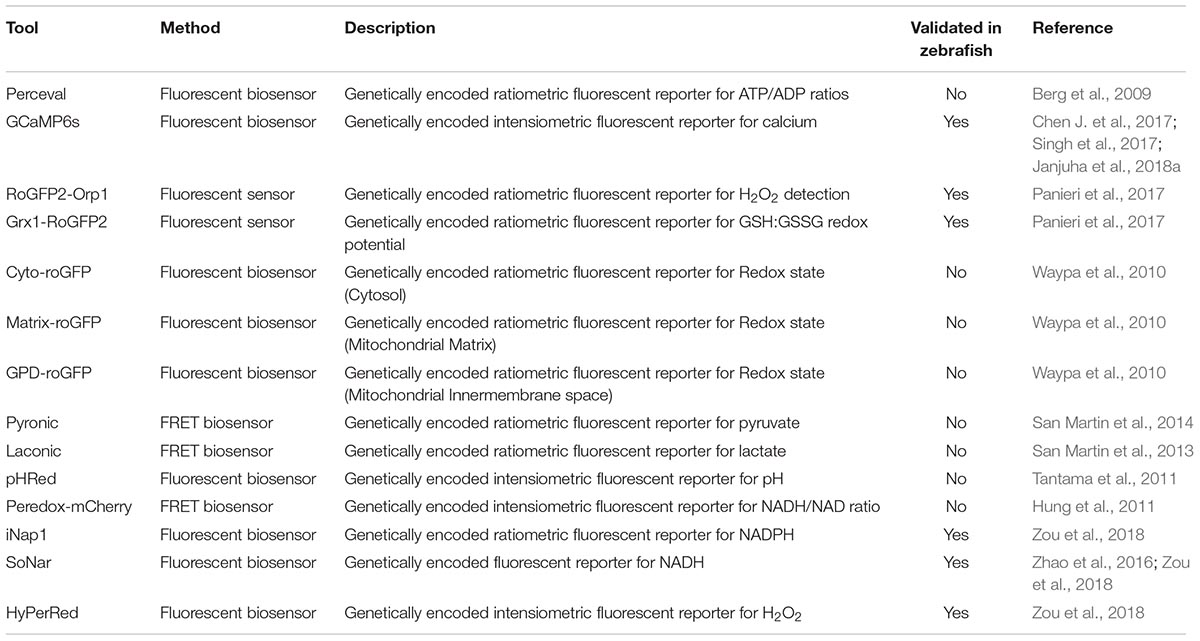
Table 2. Selection of reporter tools to quantify metabolites.
Reporter Tools to Shed Light Into Cellular Heterogeneity of Beta-Cells
A pertinent example for employing reporter tools to understand the function of individual cells within their tissue-context comes from studies of pancreatic beta-cells. Insulin-secreting beta-cells play a central role in glucose homeostasis, as their loss or malfunction can lead to the onset of diabetes. Beta-cells show a high plasticity in response to metabolic challenges or in pathological conditions, increasing interest in studying beta cell turnover and function at cellular resolution (Ninov et al., 2013; Chen C. et al., 2017). Studies on beta-cell biology in zebrafish so far have mainly used fluorescent reporter lines to study the processes of beta-cell differentiation and regeneration (Prince et al., 2017). These studies have defined the progenitor lineages for beta-cell formation during development and regeneration using genetic lineage-tracing techniques (Hesselson et al., 2009; Wang et al., 2011; Ninov et al., 2013; Delaspre et al., 2015). In addition, they have revealed novel signaling pathways that regulate beta-cell differentiation, proliferation and regeneration (Andersson et al., 2012; Tsuji et al., 2014; Wang et al., 2015) as well as the importance of inter-organ communication (Lu et al., 2016) and the gut microbiota for these processes (Hill et al., 2016).
However, several critical aspects of beta-cell biology that have taken a central stage in the mammalian pancreas field require monitoring of functional read-outs, and await to be examined in zebrafish. For example, the process of maturation of beta-cells toward glucose-stimulated insulin secretion has not been investigated extensively in the zebrafish pancreas. Addressing functionality is important as recent studies in mice have shown that beta-cell death might not be the primary reason for the loss of functional beta-cells in diabetes. Instead, beta-cells in diabetic conditions lose their identity and undergo a process of dedifferentiation, in which they stop expressing beta-cell markers (Bensellam et al., 2018). Thus, it will be necessary to establish models in zebrafish that recapitulate the dedifferentiation of beta-cells observed in mouse and human islets.
Toward this end, it was recently shown that beta-cells in zebrafish larvae show glucose-stimulated calcium influx and expression of markers of mature beta-cells, opening an avenue to use the zebrafish as a model to address the final step of beta-cell differentiation and maturation (Singh et al., 2017). Specifically, the genetically encoded calcium indicator, GCAMP6s, was expressed under the insulin promoter to quantify influx of calcium into beta-cells. Calcium binds to GCaMP6s and activates a conformational change leading to the emission of green fluorescence. Since calcium influx in beta-cells correlates with insulin secretion (Bergsten et al., 1994), this system makes it possible to visualize the function of beta-cells with single-cell precision. When combined with lineage-tracing of different beta-cell populations, this approach revealed the presence of a functional heterogeneity and a trade-off between proliferative potential and maturity among beta-cells (Singh et al., 2017). Further efforts and new tools will be necessary, however, to visualize the actual release of insulin from zebrafish beta-cells, which remains an outstanding goal in the field.
Moreover, the interactions between the immune system and beta-cells play a critical role in diabetes pathogenesis, yet these processes have not been modeled in the zebrafish pancreas. Implementing models of beta-cell inflammation and auto-immunity would allow one to study how these interactions are controlled in response to metabolic stress and aging (Janjuha et al., 2018b). A recent study applied the zebrafish genetics and transgenic reporter for activated inflammation to reveal the presence of an inflammatory clock that marks the proliferative-decline of beta-cells with age. In this clock, beta-cells that activate inflammatory NF-kB signaling also prematurely upregulate socs2, an age-related gene that inhibits their proliferation (Janjuha et al., 2018b). This work suggests that certain aspects of beta-cell biology such as their capacity to proliferate depend on interactions with the islet-resident innate-immune cells. However, it will be necessary to further validate the zebrafish as a model to investigate the complex crosstalk of metabolism, immunity and organ function. In this regard, two recent papers showed that foxp3 marks regulatory T-cells (Tregs) in zebrafish and that foxp3 mutants display systemic inflammation, suggesting an involvement of these cells in the maintenance of immune tolerance (Hui et al., 2017; Kasheta et al., 2017). These results recapitulate in part the situation in humans where mutations in FOXP3 predispose to multi-organ autoimmunity (Sugimoto et al., 2017). In the future, it will be important to investigate whether aberrant selection of immune cells during T-cell maturation or prolonged exposure to self-antigens in combination with genetic and environmental risk factors can be applied to model certain aspects of autoimmune diseases such as type 1 diabetes in zebrafish. The repertoire of zebrafish immune cells is not fully understood and one needs to carefully consider differences in immune cell and cytokine profiles between zebrafish and mammals. However, models are emerging that can be used to monitor T-cell development and migration within their niche (Tian et al., 2017; Aghaallaei and Bajoghli, 2018), and will help to further characterize the zebrafish immune repertoire.
Being able to assess beta-cell activity under metabolic and inflammatory stress is critical to identify small molecules that prevent the loss of its function in diabetes. We propose that some of the above-mentioned tools allowing to quantify the rate of ROS production or the metabolic state of cells can be applied to beta-cells as well. These tools, in conjunction with small molecule screening, can facilitate the discovery of novel therapeutic interventions that intervene at different levels in the cascade responsible for beta-cell stress and dysfunction.
Conclusion and Future Approaches
Progress has been made to exploit the advantages of zebrafish for studying the control of energy metabolism at tissue, cellular and subcellular resolutions. Achieving this level of resolution is critical considering the specialization of metabolically active tissues that often show different, and in some cases even opposite, homeostatic responses to metabolic challenges. Performing whole-larval transcriptomics metabolomics or proteomics analyses therefore provides limited information. The community should apply nano- or micro-sampling approaches wherever possible, facilitated by an active exchange of protocols and access to state-of-the art technologies. The same is the case for the use of reporter tools that often require experience and an optimized set-up, but once implemented provide powerful technologies to perform metabolic studies within the context of a live organism in physiological or pathological states.
Author Contributions
All authors listed have made a substantial, direct and intellectual contribution to the work, and approved it for publication.
Funding
Work in the laboratory of TD was funded by the BioInterfaces in Technology and Medicine (BIFTM) program of the Helmholtz-Gemeinschaft, the Deutsche Forschungsgemeinschaft (DFG, Grants DI913/6-1 and GRK2039), and the Effect Network in Water Research of the Ministerium für Wissenschaft, Forschung und Kunst Baden-Württemberg. YF was supported by a Wellcome Trust Sir Henry Dale Fellowship WT100104/Z/12/Z and a CRUK Early Detection Project Award C38363/A26931. Related work in the laboratory of MM was supported by the European Commission under the Horizon 2020 program (UM Cure/Project number: 667787), and by a 5 × 1000 LILT-2016 contribution. NN was supported by funding from the DFG-Center for Regenerative Therapies Dresden at TU-Dresden and the German Center for Diabetes Research (DZD), as well as research grants from the German Research Foundation (DFG), the European Foundation for the Study of Diabetes (EFSD), and the DZD. MS was supported by the ERC Consolidator Grant Redox (647057) and an AIRC grant (IG 20119).
Conflict of Interest Statement
PG is an employee of Nestlé Research.
The remaining authors declare that the research was conducted in the absence of any commercial or financial relationships that could be construed as a potential conflict of interest.
Acknowledgments
We thank MM and the team for organizing the 5th European Zebrafish Principal Investigator Meeting in Trento, which has led to this contribution.
Footnotes
References
Aghaallaei, N., and Bajoghli, B. (2018). Making thymus visible: understanding T-cell development from a new perspective. Front. Immunol. 9:375. doi: 10.3389/fimmu.2018.00375
Anderson, J. L., Carten, J. D., and Farber, S. A. (2016). Using fluorescent lipids in live zebrafish larvae: from imaging whole animal physiology to subcellular lipid trafficking. Methods Cell Biol. 133, 165–178. doi: 10.1016/bs.mcb.2016.04.011
Andersson, O., Adams, B. A., Yoo, D., Ellis, G. C., Gut, P., Anderson, R. M., et al. (2012). Adenosine signaling promotes regeneration of pancreatic beta cells in vivo. Cell Metab. 15, 885–894. doi: 10.1016/j.cmet.2012.04.018
Armbrecht, L., and Dittrich, P. S. (2017). Recent advances in the analysis of single cells. Anal. Chem. 89, 2–21. doi: 10.1021/acs.analchem.6b04255
Baker, T. C., Han, J., and Borchers, C. H. (2017). Recent advancements in matrix-assisted laser desorption/ionization mass spectrometry imaging. Curr. Opin. Biotechnol. 43, 62–69. doi: 10.1016/j.copbio.2016.09.003
Bekaert, M. (2012). Reconstruction of Danio rerio metabolic model accounting for subcellular compartmentalisation. PLoS One 7:e49903. doi: 10.1371/journal.pone.0049903
Bensellam, M., Jonas, J. C., and Laybutt, D. R. (2018). Mechanisms of beta-cell dedifferentiation in diabetes: recent findings and future research directions. J. Endocrinol. 236, R109–R143. doi: 10.1530/JOE-17-0516
Berg, J., Hung, Y. P., and Yellen, G. (2009). A genetically encoded fluorescent reporter of ATP:ADP ratio. Nat. Methods 6, 161–166. doi: 10.1038/nmeth.1288
Bergsten, P., Grapengiesser, E., Gylfe, E., Tengholm, A., and Hellman, B. (1994). Synchronous oscillations of cytoplasmic Ca2+ and insulin release in glucose-stimulated pancreatic islets. J. Biol. Chem. 269, 8749–8753.
Bräutigam, L., Pudelko, L., Jemth, A. S., Gad, H., Narwal, M., Gustafsson, R., et al. (2016). Hypoxic signaling and the cellular redox tumor environment determine sensitivity to MTH1 inhibition. Cancer Res. 76, 2366–2375. doi: 10.1158/0008-5472.CAN-15-2380
Chatzopoulou, A., Roy, U., Meijer, A. H., Alia, A., Spaink, H. P., and Schaaf, M. J. (2015). Transcriptional and metabolic effects of glucocorticoid receptor alpha and beta signaling in zebrafish. Endocrinology 156, 1757–1769. doi: 10.1210/en.2014-1941
Chen, C., Cohrs, C. M., Stertmann, J., Bozsak, R., and Speier, S. (2017). Human beta cell mass and function in diabetes: recent advances in knowledge and technologies to understand disease pathogenesis. Mol. Metab. 6, 943–957. doi: 10.1016/j.molmet.2017.06.019
Chen, J., Xia, L., Bruchas, M. R., and Solnica-Krezel, L. (2017). Imaging early embryonic calcium activity with GCaMP6s transgenic zebrafish. Dev. Biol. 430, 385–396. doi: 10.1016/j.ydbio.2017.03.010
Cox, A. G., Hwang, K. L., Brown, K. K., Evason, K., Beltz, S., Tsomides, A., et al. (2016). Yap reprograms glutamine metabolism to increase nucleotide biosynthesis and enable liver growth. Nat. Cell Biol. 18, 886–896. doi: 10.1038/ncb3389
Delaspre, F., Beer, R. L., Rovira, M., Huang, W., Wang, G., Gee, S., et al. (2015). Centroacinar cells are progenitors that contribute to endocrine pancreas regeneration. Diabetes 64, 3499–3509. doi: 10.2337/db15-0153
Dueñas, M. E., Essner, J. J., and Lee, Y. J. (2017). 3D MALDI mass spectrometry imaging of a single cell: spatial mapping of lipids in the embryonic development of zebrafish. Sci. Rep. 7:14946. doi: 10.1038/s41598-017-14949-x
Emara, S., Amer, S., Ali, A., Abouleila, Y., Oga, A., and Masujima, T. (2017). Single-cell metabolomics. Adv. Exp. Med. Biol. 965, 323–343. doi: 10.1007/978-3-319-47656-8_13
Esaki, T., and Masujima, T. (2015). Fluorescence probing live single-cell mass spectrometry for direct analysis of organelle metabolism. Anal. Sci. 31, 1211–1213. doi: 10.2116/analsci.31.1211
Fraher, D., Sanigorski, A., Mellett, N. A., Meikle, P. J., Sinclair, A. J., and Gibert, Y. (2016). Zebrafish embryonic lipidomic analysis reveals that the yolk cell is metabolically active in processing lipid. Cell Rep. 14, 1317–1329. doi: 10.1016/j.celrep.2016.01.016
Gruenwald, K., Holland, J. T., Stromberg, V., Ahmad, A., Watcharakichkorn, D., and Okumoto, S. (2012). Visualization of glutamine transporter activities in living cells using genetically encoded glutamine sensors. PLoS One 7:e38591. doi: 10.1371/journal.pone.0038591
Gut, P., Baeza-Raja, B., Andersson, O., Hasenkamp, L., Hsiao, J., Hesselson, D., et al. (2013). Whole-organism screening for gluconeogenesis identifies activators of fasting metabolism. Nat. Chem. Biol. 9, 97–104. doi: 10.1038/nchembio.1136
Gut, P., Reischauer, S., Stainier, D. Y. R., and Arnaout, R. (2017). Little fish, big data: zebrafish as a model for cardiovascular and metabolic disease. Physiol. Rev. 97, 889–938. doi: 10.1152/physrev.00038.2016
Hesselson, D., Anderson, R. M., Beinat, M., and Stainier, D. Y. (2009). Distinct populations of quiescent and proliferative pancreatic beta-cells identified by HOTcre mediated labeling. Proc. Natl. Acad. Sci. U.S.A. 106, 14896–14901. doi: 10.1073/pnas.0906348106
Hill, J. H., Franzosa, E. A., Huttenhower, C., and Guillemin, K. (2016). A conserved bacterial protein induces pancreatic beta cell expansion during zebrafish development. eLife 5:e20145. doi: 10.7554/eLife.20145
Hui, S. P., Sheng, D. Z., Sugimoto, K., Gonzalez-Rajal, A., Nakagawa, S., Hesselson, D., et al. (2017). Zebrafish regulatory t cells mediate organ-specific regenerative programs. Dev. Cell 43, 659.e5–672.e5. doi: 10.1016/j.devcel.2017.11.010
Hung, Y. P., Albeck, J. G., Tantama, M., and Yellen, G. (2011). Imaging cytosolic NADH-NAD(+) redox state with a genetically encoded fluorescent biosensor. Cell Metab. 14, 545–554. doi: 10.1016/j.cmet.2011.08.012
Janjuha, S., Pal Singh, S., and Ninov, N. (2018a). Analysis of beta-cell function using single-cell resolution calcium imaging in zebrafish islets. J. Vis. Exp. 137:57851. doi: 10.3791/57851
Janjuha, S., Singh, S. P., Tsakmaki, A., Mousavy Gharavy, S. N., Murawala, P., Konantz, J., et al. (2018b). Age-related islet inflammation marks the proliferative decline of pancreatic beta-cells in zebrafish. eLife 7:e32965. doi: 10.7554/eLife.32965
Jensen, P. J., Gitlin, J. D., and Carayannopoulos, M. O. (2006). GLUT1 deficiency links nutrient availability and apoptosis during embryonic development. J. Biol. Chem. 281, 13382–13387. doi: 10.1074/jbc.M601881200
Kabli, S., Spaink, H. P., De Groot, H. J., and Alia, A. (2009). In vivo metabolite profile of adult zebrafish brain obtained by high-resolution localized magnetic resonance spectroscopy. J. Magn. Reson. Imaging 29, 275–281. doi: 10.1002/jmri.21609
Kalueff, A. V., Gebhardt, M., Stewart, A. M., Cachat, J. M., Brimmer, M., Chawla, J. S., et al. (2013). Towards a comprehensive catalog of zebrafish behavior 1.0 and beyond. Zebrafish 10, 70–86. doi: 10.1089/zeb.2012.0861
Kantae, V., Krekels, E. H., Ordas, A., Gonzalez, O., Van Wijk, R. C., Harms, A. C., et al. (2016). Pharmacokinetic modeling of paracetamol uptake and clearance in zebrafish larvae: expanding the allometric scale in vertebrates with five orders of magnitude. Zebrafish 13, 504–510. doi: 10.1089/zeb.2016.1313
Kasheta, M., Painter, C. A., Moore, F. E., Lobbardi, R., Bryll, A., Freiman, E., et al. (2017). Identification and characterization of T reg-like cells in zebrafish. J. Exp. Med. 214, 3519–3530. doi: 10.1084/jem.20162084
Lam, S. H., Wu, Y. L., Vega, V. B., Miller, L. D., Spitsbergen, J., Tong, Y., et al. (2006). Conservation of gene expression signatures between zebrafish and human liver tumors and tumor progression. Nat. Biotechnol. 24, 73–75. doi: 10.1038/nbt1169
Li, S., Pozhitkov, A., Ryan, R. A., Manning, C. S., Brown-Peterson, N., and Brouwer, M. (2010). Constructing a fish metabolic network model. Genome Biol. 11:R115. doi: 10.1186/gb-2010-11-11-r115
Lieschke, G. J., and Currie, P. D. (2007). Animal models of human disease: zebrafish swim into view. Nat. Rev. Genet. 8, 353–367. doi: 10.1038/nrg2091
Lu, J., Liu, K. C., Schulz, N., Karampelias, C., Charbord, J., Hilding, A., et al. (2016). IGFBP1 increases beta-cell regeneration by promoting alpha- to beta-cell transdifferentiation. EMBO J. 35, 2026–2044. doi: 10.15252/embj.201592903
Luddecke, J., Francois, L., Spat, P., Watzer, B., Chilczuk, T., Poschet, G., et al. (2017). PII protein-derived FRET sensors for quantification and live-cell imaging of 2-oxoglutarate. Sci. Rep. 7:1437. doi: 10.1038/s41598-017-01440-w
MacRae, C. A., and Peterson, R. T. (2015). Zebrafish as tools for drug discovery. Nat. Rev. Drug Discov. 14, 721–731. doi: 10.1038/nrd4627
Marin-Juez, R., Rovira, M., Crespo, D., Van Der Vaart, M., Spaink, H. P., and Planas, J. V. (2015). GLUT2-mediated glucose uptake and availability are required for embryonic brain development in zebrafish. J. Cereb. Blood Flow Metab. 35, 74–85. doi: 10.1038/jcbfm.2014.171
Martano, C., Mugoni, V., Dal Bello, F., Santoro, M. M., and Medana, C. (2015). Rapid high performance liquid chromatography-high resolution mass spectrometry methodology for multiple prenol lipids analysis in zebrafish embryos. J. Chromatogr. A 1412, 59–66. doi: 10.1016/j.chroma.2015.07.115
Masoudi-Nejad, A., and Asgari, Y. (2015). Metabolic cancer biology: structural-based analysis of cancer as a metabolic disease, new sights and opportunities for disease treatment. Semin. Cancer Biol. 30, 21–29. doi: 10.1016/j.semcancer.2014.01.007
Morgan, B., Sobotta, M. C., and Dick, T. P. (2011). Measuring E(GSH) and H2O2 with roGFP2-based redox probes. Free Radic. Biol. Med. 51, 1943–1951. doi: 10.1016/j.freeradbiomed.2011.08.035
Mugoni, V., Medana, C., and Santoro, M. M. (2013a). 13C-isotope-based protocol for prenyl lipid metabolic analysis in zebrafish embryos. Nat. Protoc. 8, 2337–2347. doi: 10.1038/nprot.2013.139
Mugoni, V., Postel, R., Catanzaro, V., De Luca, E., Turco, E., Digilio, G., et al. (2013b). Ubiad1 is an antioxidant enzyme that regulates eNOS activity by CoQ10 synthesis. Cell 152, 504–518. doi: 10.1016/j.cell.2013.01.013
Niethammer, P., Grabher, C., Look, A. T., and Mitchison, T. J. (2009). A tissue-scale gradient of hydrogen peroxide mediates rapid wound detection in zebrafish. Nature 459, 996–999. doi: 10.1038/nature08119
Ninov, N., Hesselson, D., Gut, P., Zhou, A., Fidelin, K., and Stainier, D. Y. (2013). Metabolic regulation of cellular plasticity in the pancreas. Curr. Biol. 23, 1242–1250. doi: 10.1016/j.cub.2013.05.037
Ong, E. S., Chor, C. F., Zou, L., and Ong, C. N. (2009). A multi-analytical approach for metabolomic profiling of zebrafish (Danio rerio) livers. Mol. Biosyst. 5, 288–298. doi: 10.1039/b811850g
Onjiko, R. M., Portero, E. P., Moody, S. A., and Nemes, P. (2017). In situ microprobe single-cell capillary electrophoresis mass spectrometry: metabolic reorganization in single differentiating cells in the live vertebrate (Xenopus laevis) embryo. Anal. Chem. 89, 7069–7076. doi: 10.1021/acs.analchem.7b00880
Ordas, A., Raterink, R. J., Cunningham, F., Jansen, H. J., Wiweger, M. I., Jong-Raadsen, S., et al. (2015). Testing tuberculosis drug efficacy in a zebrafish high-throughput translational medicine screen. Antimicrob. Agents Chemother. 59, 753–762. doi: 10.1128/AAC.03588-14
Panieri, E., Millia, C., and Santoro, M. M. (2017). Real-time quantification of subcellular H2O2 and glutathione redox potential in living cardiovascular tissues. Free Radic. Biol. Med. 109, 189–200. doi: 10.1016/j.freeradbiomed.2017.02.022
Panieri, E., and Santoro, M. M. (2017). Data on metabolic-dependent antioxidant response in the cardiovascular tissues of living zebrafish under stress conditions. Data Brief 12, 427–432. doi: 10.1016/j.dib.2017.04.034
Papan, C., and Chen, L. (2009). Metabolic fingerprinting reveals developmental regulation of metabolites during early zebrafish embryogenesis. OMICS 13, 397–405. doi: 10.1089/omi.2009.0023
Passarelli, M. K., and Ewing, A. G. (2013). Single-cell imaging mass spectrometry. Curr. Opin. Chem. Biol. 17, 854–859. doi: 10.1016/j.cbpa.2013.07.017
Pincetich, C. A., Viant, M. R., Hinton, D. E., and Tjeerdema, R. S. (2005). Metabolic changes in Japanese medaka (Oryzias latipes) during embryogenesis and hypoxia as determined by in vivo 31P NMR. Comp. Biochem. Physiol. C Toxicol. Pharmacol. 140, 103–113.
Prince, V. E., Anderson, R. M., and Dalgin, G. (2017). Zebrafish pancreas development and regeneration: fishing for diabetes therapies. Curr. Top. Dev. Biol. 124, 235–276. doi: 10.1016/bs.ctdb.2016.10.005
Qi, M., Philip, M. C., Yang, N., and Sweedler, J. V. (2018). Single cell neurometabolomics. ACS Chem. Neurosci. 9, 40–50. doi: 10.1021/acschemneuro.7b00304
Roma, L. P., Duprez, J., Takahashi, H. K., Gilon, P., Wiederkehr, A., and Jonas, J. C. (2012). Dynamic measurements of mitochondrial hydrogen peroxide concentration and glutathione redox state in rat pancreatic beta-cells using ratiometric fluorescent proteins: confounding effects of pH with HyPer but not roGFP1. Biochem. J. 441, 971–978. doi: 10.1042/BJ20111770
San Martin, A., Ceballo, S., Baeza-Lehnert, F., Lerchundi, R., Valdebenito, R., Contreras-Baeza, Y., et al. (2014). Imaging mitochondrial flux in single cells with a FRET sensor for pyruvate. PLoS One 9:e85780. doi: 10.1371/journal.pone.0085780
San Martin, A., Ceballo, S., Ruminot, I., Lerchundi, R., Frommer, W. B., and Barros, L. F. (2013). A genetically encoded FRET lactate sensor and its use to detect the Warburg effect in single cancer cells. PLoS One 8:e57712. doi: 10.1371/journal.pone.0057712
Santoro, M. M. (2014). Zebrafish as a model to explore cell metabolism. Trends Endocrinol. Metab. 25, 546–554. doi: 10.1016/j.tem.2014.06.003
Schlegel, A., and Gut, P. (2015). Metabolic insights from zebrafish genetics, physiology, and chemical biology. Cell. Mol. Life Sci. 72, 2249–2260. doi: 10.1007/s00018-014-1816-8
Singh, S. P., Janjuha, S., Hartmann, T., Kayisoglu, O., Konantz, J., Birke, S., et al. (2017). Different developmental histories of beta-cells generate functional and proliferative heterogeneity during islet growth. Nat. Commun. 8:664. doi: 10.1038/s41467-017-00461-3
Soanes, K. H., Achenbach, J. C., Burton, I. W., Hui, J. P., Penny, S. L., and Karakach, T. K. (2011). Molecular characterization of zebrafish embryogenesis via DNA microarrays and multiplatform time course metabolomics studies. J. Proteome Res. 10, 5102–5117. doi: 10.1021/pr2005549
Sugimoto, K., Hui, S. P., Sheng, D. Z., Nakayama, M., and Kikuchi, K. (2017). Zebrafish FOXP3 is required for the maintenance of immune tolerance. Dev. Comp. Immunol. 73, 156–162. doi: 10.1016/j.dci.2017.03.023
Tan, J. L., Fogley, R. D., Flynn, R. A., Ablain, J., Yang, S., Saint-Andre, V., et al. (2016). Stress from nucleotide depletion activates the transcriptional regulator HEXIM1 to suppress melanoma. Mol. Cell 62, 34–46. doi: 10.1016/j.molcel.2016.03.013
Tantama, M., Hung, Y. P., and Yellen, G. (2011). Imaging intracellular pH in live cells with a genetically encoded red fluorescent protein sensor. J. Am. Chem. Soc. 133, 10034–10037. doi: 10.1021/ja202902d
Tian, Y., Xu, J., Feng, S., He, S., Zhao, S., Zhu, L., et al. (2017). The first wave of T lymphopoiesis in zebrafish arises from aorta endothelium independent of hematopoietic stem cells. J. Exp. Med. 214, 3347–3360. doi: 10.1084/jem.20170488
Tschop, M. H., Speakman, J. R., Arch, J. R., Auwerx, J., Bruning, J. C., Chan, L., et al. (2012). A guide to analysis of mouse energy metabolism. Nat. Methods 9, 57–63. doi: 10.1038/nmeth.1806
Tsuji, N., Ninov, N., Delawary, M., Osman, S., Roh, A. S., Gut, P., et al. (2014). Whole organism high content screening identifies stimulators of pancreatic beta-cell proliferation. PLoS One 9:e104112. doi: 10.1371/journal.pone.0104112
van Wijk, R., Krekels, E., Ordas, A., Kreling, T., Kantae, V., Harms, A., et al. (2018). Nanoscale blood sampling of zebrafish larvae for the estimation of distribution volume and absolute clearance. Paper Presented of the Annual Meeting of the Population Approach Group in Europe, Montreux.
Viant, M. R., Pincetich, C. A., Hinton, D. E., and Tjeerdema, R. S. (2006). Toxic actions of dinoseb in medaka (Oryzias latipes) embryos as determined by in vivo 31P NMR, HPLC-UV and 1H NMR metabolomics. Aquat. Toxicol. 76, 329–342. doi: 10.1016/j.aquatox.2005.10.007
Viant, M. R., Pincetich, C. A., Walton, J. H., Tjeerdema, R. S., and Hinton, D. E. (2002). Utilizing in vivo nuclear magnetic resonance spectroscopy to study sublethal stress in aquatic organisms. Mar. Environ. Res. 54, 553–557. doi: 10.1016/S0141-1136(02)00193-9
Wang, G., Rajpurohit, S. K., Delaspre, F., Walker, S. L., White, D. T., Ceasrine, A., et al. (2015). First quantitative high-throughput screen in zebrafish identifies novel pathways for increasing pancreatic beta-cell mass. eLife 4:e08261. doi: 10.7554/eLife.08261
Wang, Y., Rovira, M., Yusuff, S., and Parsons, M. J. (2011). Genetic inducible fate mapping in larval zebrafish reveals origins of adult insulin-producing beta-cells. Development 138, 609–617. doi: 10.1242/dev.059097
Waypa, G. B., Marks, J. D., Guzy, R., Mungai, P. T., Schriewer, J., Dokic, D., et al. (2010). Hypoxia triggers subcellular compartmental redox signaling in vascular smooth muscle cells. Circ. Res. 106, 526–535. doi: 10.1161/CIRCRESAHA.109.206334
Weger, B. D., Weger, M., Gorling, B., Schink, A., Gobet, C., Keime, C., et al. (2016). Extensive regulation of diurnal transcription and metabolism by glucocorticoids. PLoS Genet. 12:e1006512. doi: 10.1371/journal.pgen.1006512
Weller, J., Kizina, K. M., Can, K., Bao, G., and Muller, M. (2014). Response properties of the genetically encoded optical H2O2 sensor HyPer. Free Radic. Biol. Med. 76, 227–241. doi: 10.1016/j.freeradbiomed.2014.07.045
White, R., Rose, K., and Zon, L. (2013). Zebrafish cancer: the state of the art and the path forward. Nat. Rev. Cancer 13, 624–636. doi: 10.1038/nrc3589
Yang, Y., Huang, Y., Wu, J., Liu, N., Deng, J., and Luan, T. (2017). Single-cell analysis by ambient mass spectrometry. TRAC Trends Anal. Chem. 90, 14–26. doi: 10.1016/j.trac.2017.02.009
Yao, Y., Sun, S., Wang, J., Fei, F., Dong, Z., Ke, A. W., et al. (2018). Canonical Wnt signaling remodels lipid metabolism in zebrafish hepatocytes following Ras oncogenic insult. Cancer Res. 78, 5548–5560. doi: 10.1158/0008-5472.CAN-17-3964
Zhang, M., Di Martino, J. S., Bowman, R. L., Campbell, N. R., Baksh, S. C., Simon-Vermot, T., et al. (2018). Adipocyte-derived lipids mediate melanoma progression via FATP proteins. Cancer Discov. 8, 1006–1025. doi: 10.1158/2159-8290.CD-17-1371
Zhang, P., Tian, Y., Liu, H., Ren, J., Wang, H., Zeng, R., et al. (2018a). In vivo imaging of hepatocellular nitric oxide using a hepatocyte-targeting fluorescent sensor. Chem. Commun. 54, 7231–7234. doi: 10.1039/c8cc03240h
Zhang, P., Wang, H., Hong, Y., Yu, M., Zeng, R., Long, Y., et al. (2018b). Selective visualization of endogenous hypochlorous acid in zebrafish during lipopolysaccharide-induced acute liver injury using a polymer micelles-based ratiometric fluorescent probe. Biosens. Bioelectron. 99, 318–324. doi: 10.1016/j.bios.2017.08.001
Zhao, Y., Wang, A., Zou, Y., Su, N., Loscalzo, J., and Yang, Y. (2016). In vivo monitoring of cellular energy metabolism using SoNar, a highly responsive sensor for NAD(+)/NADH redox state. Nat. Protoc. 11, 1345–1359. doi: 10.1038/nprot.2016.074
Keywords: zebrafish, metabolomics, fluorescent reporter, nano sampling, nano scaling, live imaging, beta-cell, diabetes
Citation: Dickmeis T, Feng Y, Mione MC, Ninov N, Santoro M, Spaink HP and Gut P (2019) Nano-Sampling and Reporter Tools to Study Metabolic Regulation in Zebrafish. Front. Cell Dev. Biol. 7:15. doi: 10.3389/fcell.2019.00015
Received: 03 October 2018; Accepted: 31 January 2019;
Published: 19 February 2019.
Edited by:
Dominic C. Voon, Kanazawa University, JapanReviewed by:
Richard Wong, Kanazawa University, JapanTakaomi Sanda, National University of Singapore, Singapore
Copyright © 2019 Dickmeis, Feng, Mione, Ninov, Santoro, Spaink and Gut. This is an open-access article distributed under the terms of the Creative Commons Attribution License (CC BY). The use, distribution or reproduction in other forums is permitted, provided the original author(s) and the copyright owner(s) are credited and that the original publication in this journal is cited, in accordance with accepted academic practice. No use, distribution or reproduction is permitted which does not comply with these terms.
*Correspondence: Philipp Gut, cGhpbGlwcC5ndXRAcmQubmVzdGxlLmNvbQ==