 Joana Maia1,2
 Andreia Hanada Otake1,3Juliana Poças4,5,6Ana Sofia Carvalho7Hans Christian Beck8Ana Magalhães4,5Rune Matthiesen7
 Maria Carolina Strano Moraes1
 Bruno Costa-Silva1*
- 1Champalimaud Centre for the Unknown, Champalimaud Foundation, Lisbon, Portugal
- 2Graduate Program in Areas of Basic and Applied Biology, University of Porto, Porto, Portugal
- 3Center for Translational Research in Oncology, Instituto do Câncer do Estado de São Paulo, Hospital das Clínicas, Faculdade de Medicina da Universidade de São Paulo, São Paulo, Brazil
- 4i3S – Instituto de Investigação e Inovação em Saúde, Universidade do Porto, Porto, Portugal
- 5IPATIMUP – Instituto de Patologia e Imunologia Molecular da Universidade do Porto, Porto, Portugal
- 6Instituto de Ciências Biomédicas Abel Salazar, University of Porto, Porto, Portugal
- 7Computational and Experimental Biology Group, CEDOC, Chronic Diseases Research Centre, NOVA Medical School, Faculdade de Ciencias Medicas, Universidade NOVA de Lisboa, Lisbon, Portugal
- 8Centre for Clinical Proteomics, Department of Clinical Biochemistry and Pharmacology, Odense University Hospital, Odense, Denmark
Pancreatic cancers (PC) are highly metastatic with poor prognosis, mainly due to delayed detection. We previously showed that PC-derived extracellular vesicles (EVs) act on macrophages residing in the liver, eliciting extracellular matrix remodeling in this organ and marked hepatic accumulation of CD11b+ bone marrow (BM) cells, which support PC liver metastasis. We here show that PC-EVs also bind to CD11b+ BM cells and induce the expansion of this cell population. Transcriptomic characterization of these cells shows that PC-EVs upregulate IgG and IgA genes, which have been linked to the presence of monocytes/macrophages in tumor microenvironments. We also report here the transcriptional downregulation of genes linked to monocyte/macrophage activation, trafficking, and expression of inflammatory molecules. Together, these results show for the first time the existence of a PC–BM communication axis mediated by EVs with a potential role in PC tumor microenvironments.
Introduction
Pancreatic cancer is the fourth leading cause of cancer-related deaths in the world, displaying a 5-year survival rate of about 6% and a median survival rate of about 6 months. Among pancreatic cancers, pancreatic ductal adenocarcinoma (PC) is the most common type and accounts for more than 90% of cases (Saif, 2011). A combination of factors leads to the poor prognosis of PC, including difficulties in detecting early stage disease, its high metastatic potential, and its resistance to conventional therapies. Current predictions report a worldwide escalation in the incidence of this disease and an over twofold increase in the number of new PC cases, as well as related deaths, by 2030 (Ying et al., 2016; Foucher et al., 2018).
Tumors do not exist as isolated entities, but as complex systemic networks involving cell–cell communication between transformed and non-transformed cells. The milieu created by tumor-associated cells can be composed by both local cells and cells recruited from distant sites, such as the bone marrow (BM) (Bergfeld and DeClerck, 2010), creating a tumor microenvironment thought to be a key modulator of tumor progression by providing either inhibitory or stimulatory growth signals (Bissell and Hines, 2011). In sites distant from the primary tumor, non-tumor cells can also be hijacked in order to prepare the future metastatic sites that support engraftment and survival of metastatic cells (Bergfeld and DeClerck, 2010; Lee and Margolin, 2011). Besides direct cell-to-cell communication, secreted factors play a key role in the interaction among cells. Of these, extracellular vesicles (EVs) have emerged as novel cell–cell communication players in setting up and modifying tumor microenvironments (Record et al., 2014; Maia et al., 2018).
Extracellular vesicles are vesicles released by both prokaryotic and eukaryotic cells, being involved in various physiological and pathological processes (Kalluri and LeBleu, 2020). Microvesicles and exosomes are prevalent types of EVs in biofluids. Microvesicles are generated by the direct outward budding of the plasma membrane, and they range in size from ∼100 to 1,000 nm (Stahl and Raposo, 2019). In contrast, exosomes have an endosomal origin and fall within a size range of ∼30 to 150 nm in diameter (Maia et al., 2018; Stahl and Raposo, 2019). Regardless of their type, EVs can harbor biomolecules such as proteins, DNAs, messenger RNAs, microRNAs, and other RNAs (Nolte-’t Hoen et al., 2012). Due to their cargo and capacity to transfer information both locally and to distant sites, consensus has lately emerged on their role as “signal-transducing agents” (Stahl and Raposo, 2019).
The role of EVs in oncology is currently an active area of research. We have recently described a previously unknown prometastatic circuit in which pancreatic cancer-derived EVs can induce the formation of liver premetastatic niches (LPMN) that foster metastatic development (Costa-Silva et al., 2015; Hoshino et al., 2015). We demonstrated that EVs derived from malignant pancreatic lesions play a key role in LPMN initiation by being specifically taken up by Kupffer cells (KC) in the liver, where they activate fibrotic pathways and promote a pro-inflammatory milieu that ultimately supports metastasis. In particular, we showed that exosomal macrophage migration inhibitory factor (MIF) induces the release of transforming growth factor β (TGF-β) by KCs, which, in turn, promotes activation and fibronectin production by hepatic stellate cells. Fibronectin deposits subsequently promote the arrest of CD11b+ BM-derived cells in the liver, completing the formation of the LPMN (Costa-Silva et al., 2015). Although we showed that BM cells are a key component of the LPMN, it is still unknown whether PC-EVs have a potential direct effect in BM cells and in their phenotypes.
Considering that virtually any cell in the body is a potential target for these tumor-derived messages, the identification of novel cellular circuits induced by tumor-derived EVs will help to further elucidate the cellular mechanisms involved in oncologic diseases. In this work, we show that PC-EVs preferentially bind to CD11b+ BM cells and induce the expansion of this cell population. Additionally, PC-EVs induce phenotypic changes in CD11b+ BM cells with potential relevance to the dynamics of the tumor microenvironments. Together, these results demonstrate the existence of a PC–BM communication axis mediated by EVs with a potential role in PC tumor microenvironments.
Materials and Methods
Cells
The C57Bl/6 murine pancreatic adenocarcinoma PAN02 (also identified as Panc02) was purchased from the DTP, DCTD Tumor Repository, NIH. Cells were cultured in RPMI supplemented with 10% fetal bovine serum (FBS, Biowest S181BH-500, Nuaillé, France) and 1% penicillin–streptomycin (Gibco 15-140-122, United States), and maintained at 37°C with 5% CO2 levels. For conditioning, cells were cultured in RPMI supplemented with 1% penicillin–streptomycin and 10% EV-depleted FBS. FBS was depleted of bovine EVs by ultracentrifugation at 100,000 g for 140 min. For the preparation of the conditioned medium, 1 × 10⁶ PAN02 cells were seeded in 150 mm culture dishes containing 20 ml of medium, and the conditioned medium was collected after 72 h of culture.
EV Isolation
The EV isolation/purification procedure was performed as previously described (Ferreira et al., 2019). Specifically, the conditioned medium was submitted to two initial centrifugations (10 min, 500 g and 20 min, 3,000 g) to remove any suspended or dead cells in the medium. To remove large EVs, media was centrifuged (20 min, 12,000 g) and the pellet was discarded. The supernatant enriched in small EVs was again centrifuged (2 h 20 min, 100,000 g), and the EV-enriched pellet was collected. For sucrose cushion purification, this pellet was resuspended in 14 ml filtered phosphate buffered saline (PBS, Corning 15313581, NY, United States) and added to the top of 4 ml sucrose solution (D2O containing 1.2 g of protease-free sucrose and 96 mg of Tris base adjusted to pH 7.4). A new ultracentrifugation was performed (1 h 10 min, 100,000 g), after which 4 ml of the sucrose fraction was collected using a 18G needle placed at the bottom of the ultracentrifugation tube (away from the pellet). Finally, 16 ml of PBS was added to the collected sucrose/EV solution and an overnight (16 h, 100,000 g) ultracentrifugation was performed. The pellet containing the isolated EVs was resuspended in filtered PBS.
All solutions used (PBS and sucrose cushion) were sterile (0.22 μm membrane-filtered). All centrifugation steps were performed in refrigerated conditions (10°C), and ultracentrifugation was performed with rotors 50.4Ti or 70Ti (Beckman-Coulter, CA, United States).
EV Labeling
For EV-tracking experiments, purified EVs were fluorescently labeled using PKH67 membrane dye (PKH67GL-1KT, Sigma-Aldrich, Germany). The staining was performed during the isolation protocol according to the manufacturer’s instructions. Briefly, labeling was done before the sucrose cushion step. After the fraction with labeled EVs (4 ml) was collected, the isolation protocol was performed as previously stated.
EV Characterization
All EV samples were analyzed for particle concentration and size distribution by the NS300 Nanoparticle Tracking Analysis (NTA) system with red laser (638 nm) (NanoSight – Malvern Panalytical, United Kingdom). Samples were prediluted in filtered PBS to achieve a concentration within the range for optimal NTA analysis. Video acquisitions were performed using a camera level of 16 and a threshold between 5 and 7. Five to nine videos of 30 s each were captured per sample. Analysis of particle concentration per milliliter and size distribution were performed with the NTA software v3.4.
Additionally, protein quantification of the EV preparations was assessed by BCA assay (PierceTM BCA Protein Assay kit, Thermo Fisher Scientific).
EV Treatment
All mouse work was performed in accordance with national animal experimentation guidelines (DGAV), animal protocol 0421/000/000/2018. Adult C57Bl/6 female mice (5 to 8 weeks old) were used for all experimental procedures. Mice were anesthetized using isoflurane 1.5–3%. Five micrograms of EVs were injected into the retro-orbital venous sinus in a total volume of 100 μl filtered PBS. For education experiments, mice received 5 μg of EVs every other day, three times per week for 3 weeks. In the experiments involving evaluation of EV incorporation, labeled EVs were injected 24 h prior to tissue collection, and analysis of EV+ cells was performed by flow cytometry or immunofluorescence. Unlabeled EVs were used as controls for signal specificity. For education experiments, retro-orbital injection of PBS was used in the control groups.
Flow Cytometry Analysis
For tracking of labeled EVs and phenotypical analysis of murine organs, femurs were flushed and single-cell suspensions were filtered through a 40-μm strainer. Cells were washed in PBS with 1% BSA and incubated with anti-CD11b-PerCP-Cyanine5.5 (clone M1/70, 1:100, BD Biosciences – 561114) at predetermined saturating concentrations. PKH67-labeled EV-positive cells were detected using blue laser excitation and 488 nm emission. Data for 1,000,000 cells was acquired on a BD FACS CantoTM cytometer with Diva software (BD) and was analyzed using FlowJoTM software (TreeStar).
Collection of BM-Derived Cells and CD11b+ Magnetic Sorting
C57Bl/6 female mice were euthanized and femurs and tibiae were harvested and cleaned. The bones were flushed with cold working buffer (PBS supplemented with 0.5% BSA and 2 mM EDTA), using a 26G needle. The preparation was resuspended using a 18G needle and filtered through a 40-μm strainer. The single-cell preparation was then centrifuged (500 g, 10 min, 4°C) and the resulting pellet resuspended in ACK buffer. After 2 min at room temperature, the lysis was stopped by adding more working buffer and the sample was centrifuged (500 g, 10 min, 4°C). The pellet was resuspended in working buffer and the cells were counted.
Subsequently, cells underwent MACS bead isolation using CD11b microbeads (Miltenyi Biotec, 130-049-601, Germany), which enabled the isolation of CD11b+ cells from the preparation. The CD11b+ cells were counted and centrifuged (500 g, 10 min, 4°C) and the pellet proceeded for RNA isolation.
RNA Extraction and cDNA Preparation
Prior to RNA extraction, CD11b+ BM cells were run through the QIAshredder kit (79654, Qiagen, Germany). Total RNA was isolated using the RNeasy Mini kit (74104, Qiagen), following the manufacturer’s instructions, and resuspended in nuclease-free water. RNA concentration and purity were estimated by spectrophotometric absorbance (260 and 280 nm) using a Nanodrop 2000 unit (Thermo Scientific). One microgram of RNA was used to prepare cDNA using the QuantiTect Reverse Transcription Kit (205311, Qiagen), according to the manufacturer’s instructions.
Illumina Strand-Specific RNA Sequencing
To analyze the genes whose expression was altered in mouse CD11b+ BM cells as a result of education with PAN02 EVs, animals were grouped between the ones educated with PAN02 EVs and the control animals educated with PBS. Total RNA was then isolated as described above, and the RNA quality was assessed using Bioanalyzer. The cDNA library was generated using Kappa Stranded Total RNA with Ribo-Zero Library Preparation Kit. The resultant DNA fragments (DNA library) were sequenced in the Illumina HiSeq 4000 platform, using 150 bp paired-end sequencing reads.
For the analysis of differentially expressed genes, we used the Differential Expression for RNA-Seq tool, which is a multifactorial statistical analysis tool based on a negative binomial model. It uses a generalized linear model approach influenced by the multifactorial EdgeR method (Robinson et al., 2009). The differentially expressed genes were filtered using standard conditions (van Iterson et al., 2010; Raza and Mishra, 2012), and the genes that fulfilled both conditions were listed in the results (Supplementary Table 1). The conditions were as follows: fold change (≥ 2 or ≤ −2) and false discovery rate (FDR) P-value ≤ 0.05.
Primer Design
The primers used in this study were designed using Integrated DNA Technologies online software PrimerQuest Tool (Integrated DNA Technologies, Inc., United States). Primer sequences and characteristics are shown in Supplementary Table 2.
The amplification efficiencies of each selected gene performing quantitative RT-PCR (RT-qPCR) were evaluated using cDNA dilutions (1, 1:10, 1:100, 1:1,000, 1:10,000). The amplification efficiency E of all primers used was measured and all displayed high E-values ranging from 1.8 to 2.2 (Supplementary Table 2).
RT-qPCR Assay and Analysis
The qRT-PCR reactions were performed in a CFX96 Touch Real-Time PCR Detection System thermocycler (Bio-Rad, United States). The reaction mix was performed using 10 μl SsoFast EvaGreen Supermix (1725200, Bio-Rad), primers at a final concentration of 500 nM, 1 μl of cDNA, and nuclease-free water to complete a final volume of 20 μl. After PCR, a melting curve program from 65 to 95°C with 0.5°C changes was applied, and the presence of a single reaction product in each well was confirmed. All reactions were performed in duplicate and technical replicates were run on the same plate. For the analysis, the threshold value used for each plate was the one defined by the software.
The relative expression was calculated using the model proposed by M.W. Pfaffl (2001) and normalized to both Gapdh and Hmbs levels, the two reference genes used.
Mass Spectrometry
Peptide Sample Preparation
The protein solution containing SDS and dithiothreitol (DTT) was loaded onto filtering columns and washed exhaustively with 8 M urea in HEPES buffer (Wisniewski et al., 2009). Proteins were reduced with DTT and alkylated with IAA. Protein digestion was performed by overnight digestion with trypsin sequencing grade (Promega).
Nano-LC-MSMS Analysis
Peptide samples were analyzed by nano-LC-MSMS (Dionex RSLCnano 3000) coupled to a Q-Exactive Orbitrap mass spectrometer (Thermo Scientific). Briefly, the samples (5 μl) were loaded onto a custom-made fused capillary precolumn (2 cm length, 360 μm OD, 75 μm ID) with a flow of 5 μl per min for 7 min. Trapped peptides were separated on a custom-made fused capillary column (20 cm length, 360 μm outer diameter, 75 μm inner diameter) packed with ReproSil-Pur C18 3-μm resin (Dr. Maish, Ammerbuch-Entringen, Germany) with a flow of 300 nl per minute using a linear gradient from 92% A (0.1% formic acid) to 28% B (0.1% formic acid in 100 acetonitrile) over 93 min followed by a linear gradient from 28 to 35% B over 20 min at a flow rate of 300 nl per minute. Mass spectra were acquired in positive ion mode applying automatic data-dependent switch between one Orbitrap survey MS scan in the mass range of 400 to 1,200 m/z followed by higher-energy collisional dissociation (HCD) fragmentation and Orbitrap detection of the 15 most intense ions observed in the MS scan. Target value in the Orbitrap for MS scan was 1,000,000 ions at a resolution of 70,000 at m/z 200. Fragmentation in the HCD cell was performed at normalized collision energy of 31 eV. Ion selection threshold was set to 25,000 counts and maximum injection time was 100 ms for MS scans and 300 and 500 ms for MSMS scans. Selected sequenced ions were dynamically excluded for 45 s.
Database Search
The obtained data from the X LC-MS runs were searched using VEMS (Matthiesen et al., 2012; Carvalho et al., 2014) and MaxQuant (Cox and Mann, 2008). A standard proteome database from UniProt (3AUP000005640), in which common contaminants were included, was also searched. Trypsin cleavage allowing a maximum of four missed cleavages was used. Carbamidomethyl cysteine was included as fixed modification. Methionine oxidation, N-terminal protein acetylation, and S, T, and Y phosphorylation were included as variable modifications; 5 ppm mass accuracy was specified for precursor ions and 0.01 m/z for fragment ions. The FDR for protein identification was set to 1% for peptide and protein identifications. No restriction was applied for minimal peptide length for VEMS search. Identified proteins were divided into evidence groups as defined (Matthiesen et al., 2012).
Negative-Staining Transmission Electron Microscopy
Extracellular vesicles were visualized by transmission electron microscopy (TEM) using negative staining. For this, 10 μl of the sample solution was mounted on formvar/carbon film-coated mesh nickel grids (Electron Microscopy Sciences, Hatfield, PA, United States). The excess liquid was removed with filter paper, and 10 μl of 1% uranyl acetate was added onto the grids. Visualization was carried out on a JEOL JEM 1400 TEM at 120 kV (Tokyo, Japan). Images were digitally recorded using a CCD digital camera (Orious 1100W Tokyo, Japan).
Statistical and Pathway Analysis
Error bars in graphical data represent means ± SEM. Statistical significance was determined using a two-tailed Student’s t-test or by ANOVA. P < 0.05 was considered statistically significant. Statistical analyses were performed using the GraphPad Prism software (GraphPad software). No statistical method was used to predetermine sample size. The experiments were not randomized, and the investigators were not blinded to allocation during the experiments and outcome assessment.
Accession Codes
The raw sequencing data (Supplementary Table 1) have been deposited in the GEO database under accession number GSE156071.
Results
Isolated EVs were characterized for morphology and size by transmission electron microscopy (Figure 1A) and for size distribution by Nanoparticle Tracking Analysis (Figure 1B) and the expression of proteins commonly identified in EVs (Figure 1C). Currently, there are no available methods to isolate EVs expressing endosomal features and consensus on markers that could be used to differentiate endosomal (i.e., exosomes) from membrane shedding-derived vesicles (i.e., microvesicles). In fact, even molecules considered as markers of small endosomal EVs, such as HSP70, CD63, and CD9, have been reported to be present both in small and large EVs (Kowal et al., 2016). Therefore, although the majority of our vesicles display exosome features, including size (Figures 1A,B) and molecular composition (Figure 1C and Supplementary Table 3), we decided to identify them as EVs throughout the manuscript to avoid potential sample misidentification, following the latest MISEV’s recommendations (Thery et al., 2018).
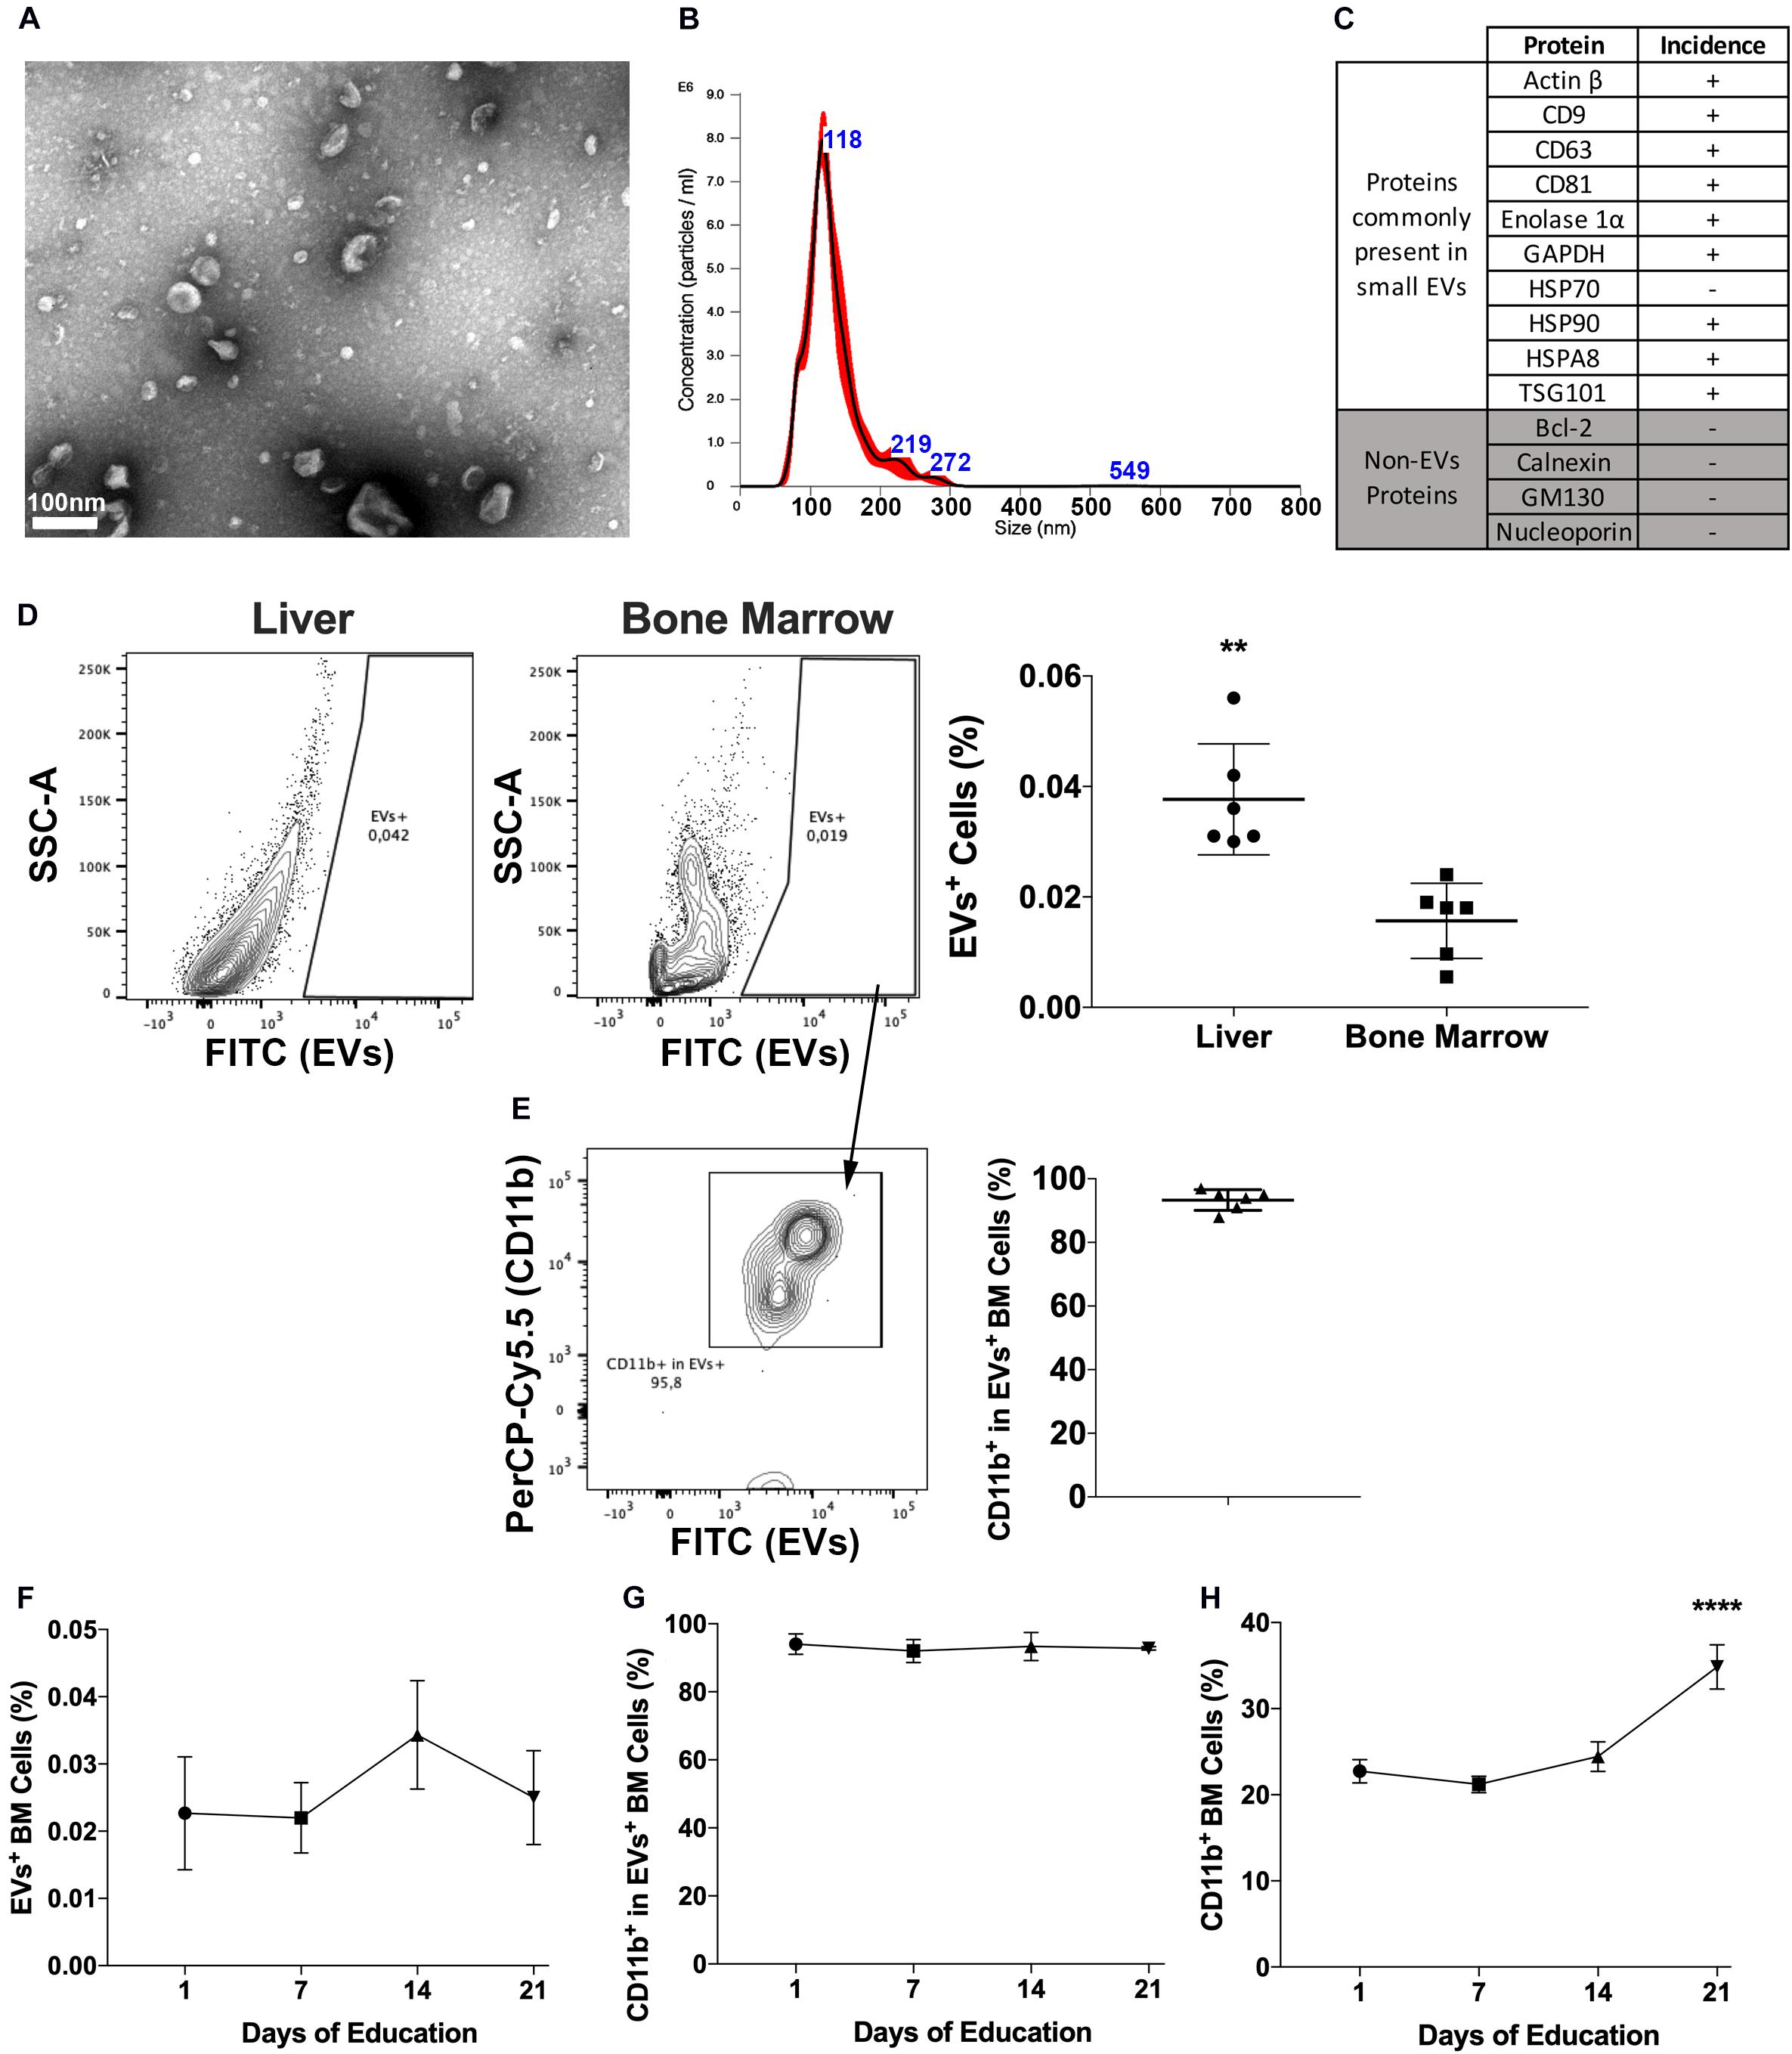
Figure 1. Pancreatic cancers-derived EVs binding to BM cells. (A) Representative transmission electron microscopy of PAN02 EVs. (B) Representative Nanoparticle Tracking Analysis of PAN02 EVs. (C) Proteins frequently present and absent in small EVs, studied in PAN02 EVs by Protein Mass Spectrometry. (D) PC-EVs are taken up by liver and BM cells, 24 h post-injection. (E) Most of the cells that take up PC-EVs are CD11b+ BM cells. (F) Three-week education with PC-EVs does not modify the incidence of EV+ BM cells or CD11b+ cells within cells that take up PC-EVs (G). (H) Three-week education with PC-EVs induces the increase of BM CD11b+ cells. **P < 0.01, ****P < 0.0001 by ANOVA.
To first determine the occurrence of PC–BM interaction, labeled PC-EVs were injected intravenously in mice. Besides the liver, 24-h post-injection EVs were also located in the BM, albeit the percentage of EVs+ cells in the BM was lower (∼0.02%) than the one found in the liver (∼0.04%) (Figure 1D). In the BM, more than 80% of the cells that took up PC-EVs were CD11b+ (Figure 1E). To our knowledge, this is the first report of a direct PC–BM communication axis mediated by EVs.
To evaluate if this proportion increased over time and upon continuous treatment, animals were also educated (3 weeks, every other day) with PC-EVs. No differences in the percentage of EVs+ BM cells were found throughout the experiment (Figure 1F). The percentage of CD11b+ cells among EVs+ BM cells also did not oscillate throughout the experiment (Figure 1G). However, education with PC-EVs increased the percentage of CD11b+ BM cells at the experiment endpoint (Figure 1H).
We next asked whether PC-EVs can modify the gene expression profile of CD11b+ BM cells. For that, we sequenced RNA samples extracted from CD11b+ BM cells of both naive and PC-EV-educated mice. The expression levels of all samples were assessed through the mapping of the high-quality reads of each sample, where 88.9 to 94.38% of the total fragments were mapped against the Mus musculus (GRCm38) genome. The differentially expressed genes were selected using standard conditions (FDR P-value ≤ 0.05 and fold change > 2 or < −2), which yielded a total of 41 genes (Figure 2A). Of these, 13 genes were significantly upregulated (Table 1) and 28 significantly downregulated (Table 2). These results were validated by qPCR analysis of two of the top differentially expressed genes (Supplementary Figure 1).
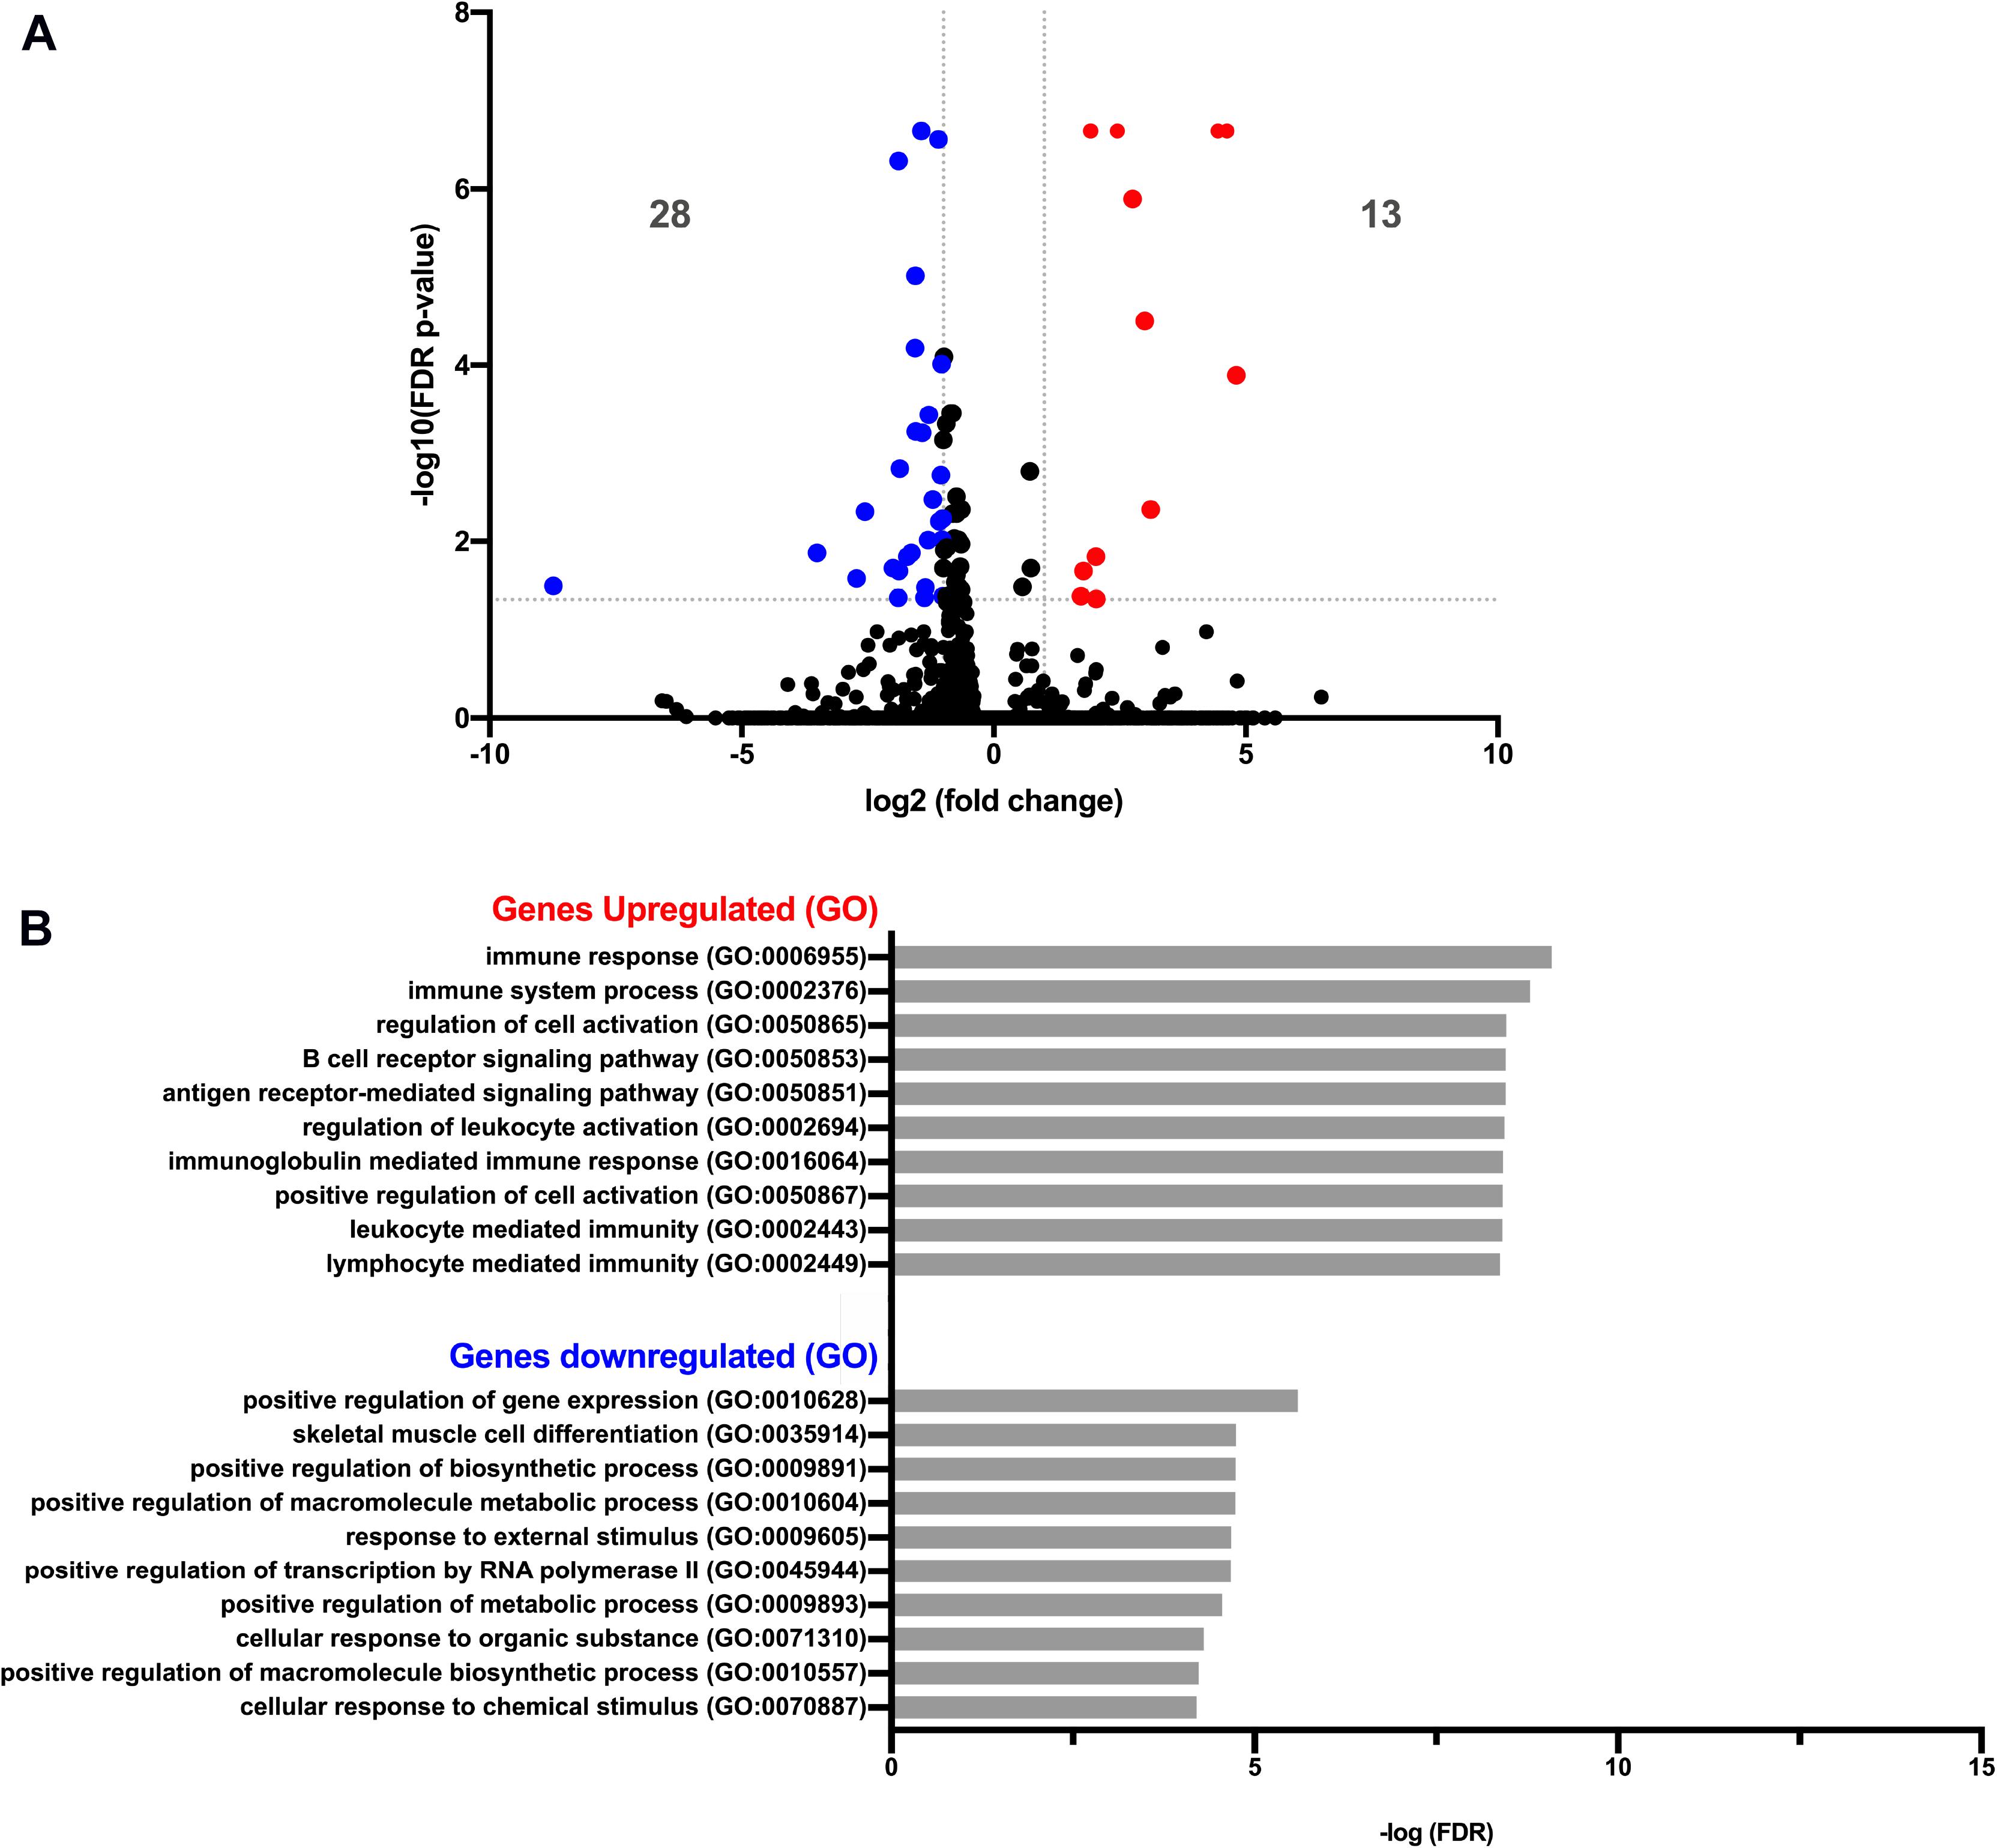
Figure 2. Gene expression analysis of pancreatic cancer EV-treated bone marrow cells. (A) Volcano plot of RNA-Seq of PBS versus EV-treated CD11b+ BM cells showing 13 and 28 genes significantly up- and downregulated (red dots and blue dots, respectively), with FDR P-value ≤ 0.05 and fold change > 2 or < −2. (B) Graph plot of the most significant processes of Gene Ontology (GO) enrichment analysis in the “Biological Process” section of up- and downregulated genes, using the Gene Ontology PANTHER Database.
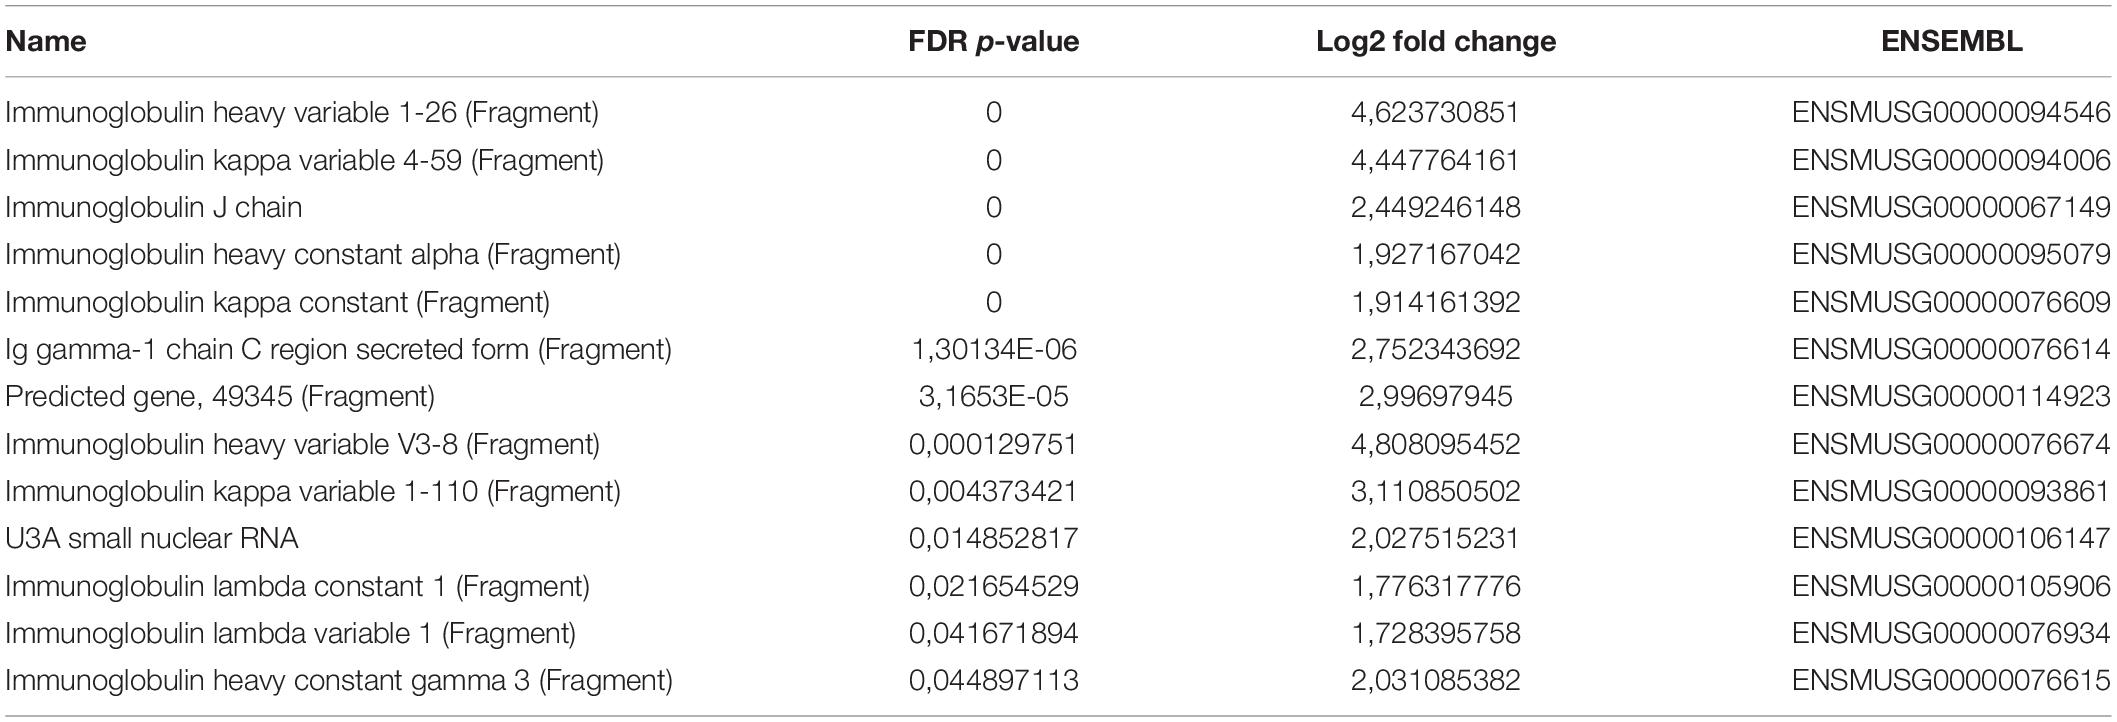
Table 1. Upregulated genes.
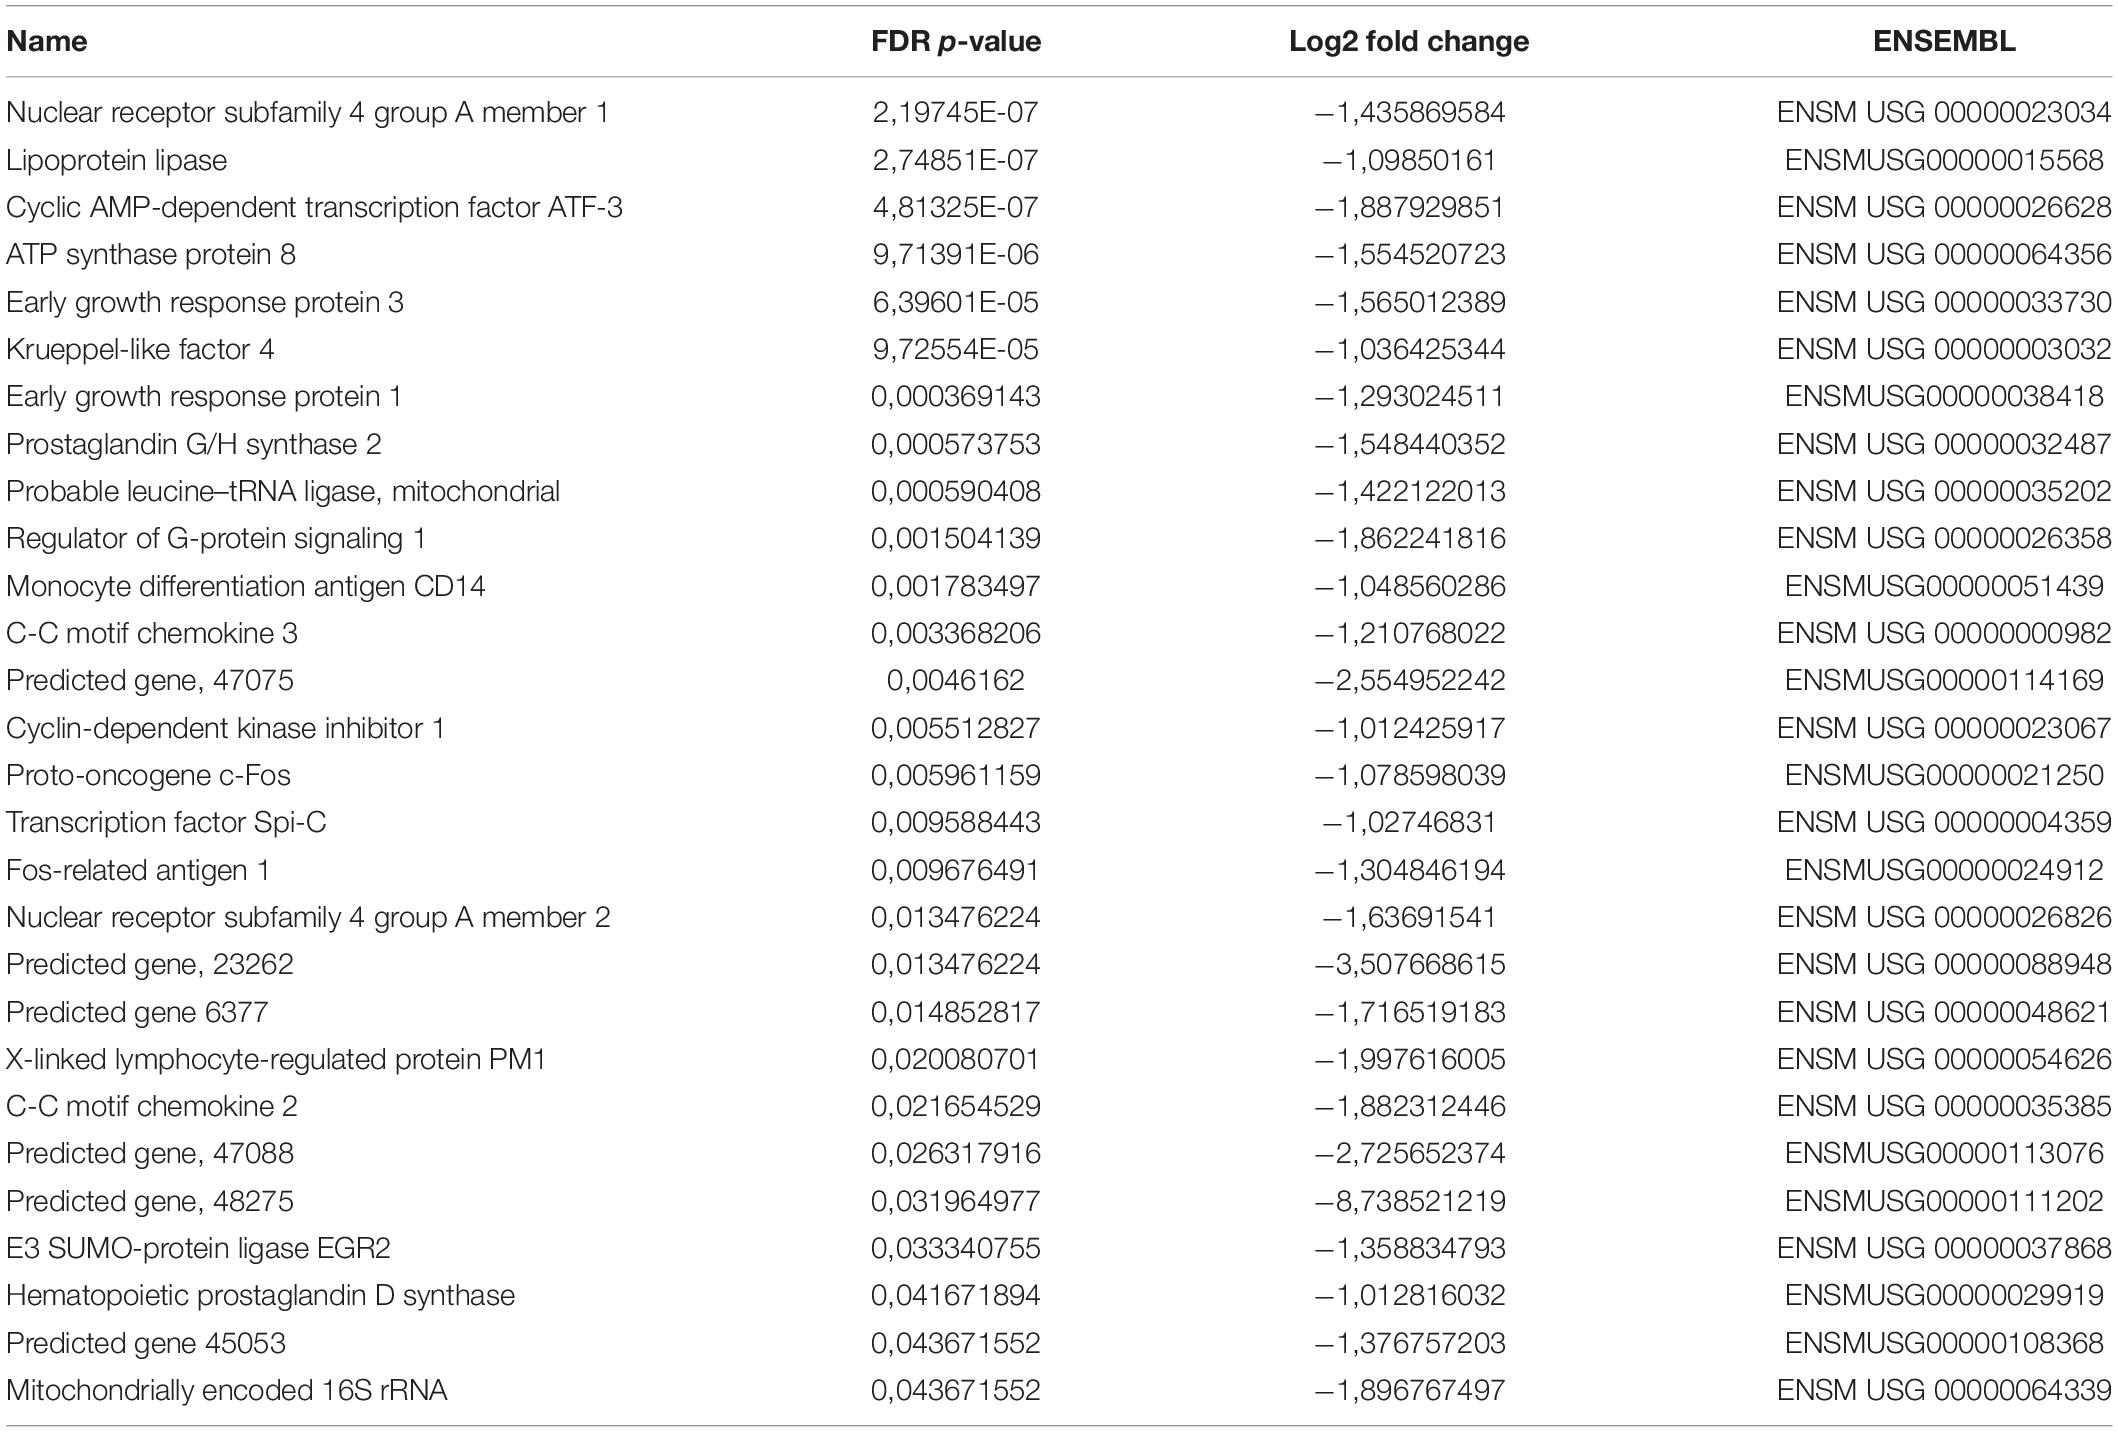
Table 2. Downregulated genes.
Gene Ontology (GO) analysis revealed that the upregulated genes (Table 1) were associated with immune response processes and immunoglobulin production (Figure 2A). Among those genes, we found the Immunoglobulin heavy constant gamma 3 (fragment) (Ighg3) gene, which is associated with the IgG3 isotype, and the genes Immunoglobulin heavy constant alpha (fragment) (Igha) and Immunoglobulin J chain (Jchain), both associated with IgA molecules. Within the downregulated genes, we found that the most significant GO processes were associated with transcriptional activation, response to stimulus, and regulation of gene expression (Figure 2B). Specifically, most downregulated genes were transcription factors associated with monocyte and macrophage differentiation, macrophage polarization, production of pro- or anti-inflammatory cytokines, and immune cell trafficking (Table 2). Interestingly, the majority of downregulated genes are relevant in the tumor microenvironment context.
Discussion
In the present study, we aimed to identify a novel systemic cell–cell communication axis with potential relevance to tumor microenvironment dynamics. Previously, we have demonstrated that PC-derived EVs can induce a liver microenvironment supportive of tumor development and metastasis, LPMN, by acting in non-tumor cells in the liver. The LPMN cascade of events involves the accumulation of CD11b+ BM cells in the liver, which is associated with the formation of hepatic PC metastatic lesions (Costa-Silva et al., 2015). For this reason, we asked if EVs could also mediate a direct communication between PC and CD11b+ BM cells in vivo. We found that PC-EVs bind preferentially to CD11b+ BM cells and induce the expansion of this cell population upon 3 weeks of treatment, every other day with PC-EVs. These results agree with previous reports of EVs mediating the communication of other cancer types and BM (Yu et al., 2007; Peinado et al., 2012).
We next showed that PC-EVs can reprogram the gene expression of recipient CD11b+ BM cells. Indeed, various studies describe tumor EVs as capable of impacting myeloid cell function (Valenti et al., 2006; Yu et al., 2007; Shen et al., 2017) whereas PC-EVs were shown to regulate the expression of TLR4 in dendritic cells in vitro (Zhou et al., 2014). EVs carry all main biomolecules, including lipids, metabolites, proteins, and/or nucleic acids, which can impact the recipient cells and mediate several biological processes such as tumor growth and invasion, inflammation, and immunologic remodeling. Various studies describe the role of EV lipids, namely PGE2, in tumor growth and resistance (Record et al., 2018). The role of metabolites transported by EVs cannot be dismissed since EVs derived from MSCs are packaged with numerous metabolites that have been directly associated with immunomodulation, including M2 macrophage polarization and regulatory T lymphocyte induction (Showalter et al., 2019). Worth mentioning is also the role of microRNA within EVs, since mir-145 can regulate the polarization of tumor-associated macrophages (Shinohara et al., 2017). In the past, we also described the relevance of the protein content in tumor EV bioactivity, when we described that once taken up by hepatic resident macrophages, in a mechanism mediated by EV Integrin αVβ5 (Hoshino et al., 2015), pancreatic cancer-derived EVs containing high levels of MIF (Costa-Silva et al., 2015) induced upregulation of secreted factors associated with liver fibrosis, such as TGF-β (Costa-Silva et al., 2015), and pro-inflammatory genes involved with metastasis, such as S100A8 and S100P (Lukanidin and Sleeman, 2012; Hoshino et al., 2015). Considering the literature on this topic, we expect that the response of CD11b BM cells to PC-EVs described in this manuscript most likely involves numerous molecules and different pathways, suggesting that it could be simultaneously mediated by multiple EV biomolecules. Our work did not evaluate in vivo the potential role of the genes differentially expressed in BM CD11b+ cells upon PC-EV education in the setup of prometastasis hepatic niches. Therefore, follow-up in vivo studies will be necessary to test the potential role of each of the identified genes in PC liver metastasis. Future investigation will enable the identification of which EV biomolecules mediate the transcription reprogramming here described. In addition, based on previous works that utilized plasma EVs as biomarkers for diagnosis, prognosis, and follow-up of cancer patients (Peinado et al., 2012; Costa-Silva et al., 2015; Hoshino et al., 2015, 2020; Melo et al., 2015), it is possible that EV biomolecules linked with PC-CD11b+ BM cell communication may enable early detection of this process through the study of circulating plasma EVs. We will here discuss on genes regulated by PC-EVs with potential relevance to tumor microenvironments and the biology of monocytes/macrophages.
Immunoglobulin Genes
The production of immunoglobulins has been classically linked to lymphoid B cells. However, recent evidence challenged the existing dogma by showing expression of immunoglobulins outside the lymphoid lineage (e.g., monocytes and macrophages) in oncologic settings (Haziot et al., 2018; Busch et al., 2019). These works describe immunoglobulin expression as a defining feature of monocytes and also macrophages in the tumor microenvironment.
Increased levels of immunoglobulin expression in tumor microenvironments are described to result in the accumulation of immune complexes that favor tumor-promoting inflammatory responses, including recruitment and activation of several myeloid cell types (Barbera-Guillem et al., 1999). Both IgG and IgA are relevant in the tumor microenvironment, having anti- and protumoral effects. IgG is described to promote cell growth and metastasis, inhibit apoptosis, and play a role in cancer immune evasion (Wan et al., 2015; Xu et al., 2016). Synergistically, IgG and tumor cell-derived debris are able to promote metastasis of pancreatic cancer by inducing inflammation via M2-polarized tumor-associated macrophages (TAMs) (Chen et al., 2019). Moreover, IgGs have been shown to promote cancer development by activating Fc-γ receptors on resident and recruited leukocytes that in turn regulate recruitment, composition, and effector functions of tumor-infiltrating lymphocytes in a mouse model of squamous carcinogenesis (Andreu et al., 2010). On the other hand, some studies show IgG1 supporting immunity against tumors, inducing antibody-dependent cell-mediated cytotoxicity (ADCC) and antibody-dependent cellular phagocytosis (ADCP) (Kellner et al., 2017).
It has also been shown that IgA can block cytotoxic T-cell reactions against melanoma (O’Neill and Romsdahl, 2009). More recently, IgA+ plasmocytes were shown to suppress antitumor immunity in a mouse prostate cancer model. However, in this study, it is unclear if the suppression can be attributed to IgA+ plasmocytes or IgA alone (Shalapour et al., 2015). By contrast, IgA shows a therapeutic potential against cancer cells, since it activates neutrophil-mediated antibody-dependent cellular cytotoxicity better than IgG (Frontera et al., 2018; Steffen et al., 2020). It should be highlighted though that confirmation that immunoglobulins produced by non-lymphoid cells are functional is still pending, since studies on whether affinity-matured antibodies from these cells are capable of binding to antigens are not yet available. Additionally, we cannot exclude the potential presence of B1 cells, a small immunoglobulin-expressing phagocytic population that is believed to originate from B cells, within our CD11b+ BM cells (Griffin and Rothstein, 2011).
In light of these findings, and taking into consideration the previously described direct association between CD11b+ BM cell accumulation in the liver and the formation of hepatic PC metastatic lesions, our results suggest that PC-EV-induced immunoglobulin expression on CD11b+ BM cells may play a role in PC liver metastasis. Nevertheless, it is still unclear which specific epitopes are recognized by these antibodies and whether they contribute to tumor microenvironments (Haziot et al., 2018; Busch et al., 2019).
Genes Linked With Monocyte/Macrophage Differentiation
Among the downregulated genes identified, lipoprotein lipase (Lpl) (Chang et al., 2018), transcription factor Spi-c (Spic) (Kohyama et al., 2008; Haldar et al., 2014; Alam et al., 2017; Kurotaki et al., 2017), and Nuclear receptor subfamily 4 group A member1 (Nr4a1) (Hanna et al., 2011) have all been previously found to induce differentiation of monocytes. Another gene potentially linked with monocyte/macrophage differentiation is CDK inhibitor 1, which when downregulated leads to higher expression of CD11b, thus modifying cellular differentiation (Radomska et al., 2012; McClure et al., 2016). Other downregulated genes, early growth response protein 1 (Egr1) and 3 (Egr3), were believed to have an essential role in regulating monocyte/macrophage differentiation, but were later suggested to have no impact in the macrophage differentiation process (Carter and Tourtellotte, 2007). Hence, our results suggest a mixed effect of PC-EVs in CD11b+ BM cell differentiation, with some of the downregulated genes found having a positive impact on the differentiation process and others having a negative impact in the same process. A more detailed functional characterization will thus be necessary to understand the final balance of the downregulation of these genes by PC-EVs in CD11b+ BM cell differentiation, as well as their role in PC.
Genes Linked With Tumor Immunity
In the establishment of tumor-supportive microenvironments, macrophage polarization is pivotal. Reduced expression of Cyclic AMP-dependent transcription factor ATF-3 (Atf3) (Labzin et al., 2015; Sha et al., 2017), Fos-related antigen 1 (Fosl1) (de Marcken et al., 2019), and Nr4a1 (Hamers et al., 2016) can impact pro-inflammatory M1 polarization and antitumor immunity (Kratochvill et al., 2015; Chiba et al., 2018), as they negatively regulate these processes. C-C chemokine ligand 3 (Ccl3) (Cassol et al., 2009) was also reported to be involved in the M1 macrophage polarization and CD14 was shown not only to contribute to a M1 phenotype but also to drive strong Th1/Th17 signaling in macrophages and circulating dendritic cells (Prakash et al., 2016). Reduced expression of the Proto-oncogene c-Fos (c-fos) and Egr1 is expected to reduce the expression of pro-inflammatory and antitumoral cytokines, which are also involved in the M1 polarization (Krämer et al., 1994; Ray et al., 2006; Maruyama et al., 2007; Cullen et al., 2010; Hop et al., 2018; Yu et al., 2018). Conversely, reduced expression of Atf3 (Sha et al., 2017), Klf4 (Ahmad et al., 2018; Wen et al., 2019), and Prostaglandin G/H synthase 2 (Pghs-2) (Wang X. et al., 2017) in macrophages can favor a pro-inflammatory M1 polarization, hence potentially favoring antitumoral responses.
On the other hand, some of the genes downregulated by PC-EVs were also found to support tumor development, as C-C chemokine ligand 2 (Ccl2) (Roca et al., 2009; Li et al., 2017), Atf3 (Sha et al., 2017), Hematopoietic prostaglandin D synthase (Abbas and Janeway, 2000), Krüppel-like factor 4 (Klf4) (Kapoor et al., 2015; Wang K. et al., 2017), Nuclear receptor subfamily 4 group A member 2 (Nr4a2) (Mahajan et al., 2015), and Pghs-2 (Li et al., 2015) were linked to M2 polarization of macrophages. The Egr2 gene has been described as a M2 macrophage marker and it has been implicated in fate determination in the myeloid lineage (Gabet et al., 2010; Jablonski et al., 2015). Specifically, an Egr2 knockdown model failed to show upregulation of either M1 or M2 markers upon stimulation, and low levels of Egr2 expression were associated with non-responsiveness of macrophages to activation signals (Veremeyko et al., 2018).
Besides the discussed effects on M1/M2 macrophage polarization, several of the downregulated genes were associated with other antitumoral effects, which may lead to a broader range of protumorigenic outcomes. That is the case of Nr4a1, Ccl2, and Ccl3, which antagonize tumor growth by attracting tumor-suppressive immune cells. Indeed, infiltration of inflammatory cells in the tumors of Nr4a1–/– mice was diminished when compared with Nr4a1+/+ mice (Ahmad et al., 2017), and the inhibition of Ccl2 promoted neocarcinogenesis and metastasis (Huang et al., 1994; Li et al., 2014; Lavender et al., 2017). Ccl2 (Granot et al., 2011; Mitchem and DeNardo, 2012) has also been reported to increase the cytotoxicity of neutrophils against tumor cells. Thus, reduction of Ccl2 expression can decrease neutrophil-mediated killing of tumor cells and promote a protumorigenic microenvironment.
We here suggest that the downregulation of these genes by PC-EVs could induce a combined anti-/protumorigenic response by BM CD11b+ cells. Additional in vivo studies will be necessary to evaluate whether these inflammatory profiles will be reversed and/or reinforced after the influx of these cells in the liver, where Kupffer cell-derived TGF-β (Costa-Silva et al., 2015) can play a potential role in inducing protumorigenic genes (Gratchev, 2017) by BM-derived CD11b+ cells.
Genes Linked With Monocyte/Macrophage Trafficking
Genes associated with monocyte and macrophage recruitment, such as Ccl2 (Qian et al., 2011; Carson et al., 2017; Gschwandtner et al., 2019), Ccl3 (Ntanasis-Stathopoulos et al., 2020), and Fosl1 (Jiang et al., 2019), were found to be downregulated. The decrease in the levels of Fosl1, Ccl2, and Ccl3 is expected to reduce the recruitment of cells that allow tumor cells to evade the immune surveillance, e.g., TAMs, regulatory T cells (Tregs), and myeloid-derived suppressor cells (MDSCs) (Jiang et al., 2019; Wculek et al., 2019; Ntanasis-Stathopoulos et al., 2020). Furthermore, downregulated Ccl3 could reduce the recruitment of cytotoxic neutrophils, dendritic cells, and NK cells; reduce CD8+ antitumor response; and lead to impaired antigen presentation, reduced levels of IFN-γ by antigen-specific T cells, and consequently, reduced cytotoxic activity (Song et al., 2007; Ntanasis-Stathopoulos et al., 2020). Overall, a decrease in the recruitment of monocytes and macrophages could shape the tumor microenvironment toward a less supportive setting for cancer progression.
Another downregulated gene, Atf3, has been linked with increased intrahepatic macrophage/neutrophil trafficking (Zhu et al., 2018). Regulator of G-protein signaling 1 (Rgs1), also downregulated by PC-EVs, has been involved in the chemoattraction of monocytes. Specifically, Rgs1 deactivates the chemotactic response (Denecke et al., 1999), and its deficiency leads to enhanced recruitment of macrophages (Patel et al., 2015). We speculate that the Rgs1 downregulation in CD11b+ BM cells can lead to less myeloid accumulation and more monocyte/macrophage trafficking.
In most of these studies, genes were downregulated in the whole animal, instead of only in BM cells. Therefore, more detailed in vivo experiments would be needed to test whether reduced expression of these genes in CD11b+ BM cells could impact their trafficking to PC microenvironments.
Genes Linked With Monocyte/Macrophage Apoptosis
The downregulation of Ccl2 (Salcedo et al., 2000; Lavender et al., 2017), Fosl1 (Lewçn et al., 2007; Luo et al., 2009), and Rgs1 (Hu et al., 2019) has been described to increase apoptosis and to decrease angiogenesis and tumor invasion by affecting molecules associated with these processes (e.g., VEGF, MMP-2, MMP-9). On the other hand, the downregulated genes Egr1 (Chen et al., 2010) and Atf3 (Wong, 2011) have been described as proapoptotic, and thus, the decrease in their expression alone might provide a higher degree of protection against apoptosis in CD11b+ BM cells.
Conclusion
We here found a novel PC–BM communication axis mediated by PC-EVs. Our gene expression analysis showed reprogramming of genes linked to both anti- and protumorigenic activities by CD11b+ cells. Their potential relevance in PC tumor microenvironments was discussed, although how the individual effects of the reprogrammed genes balance each other to a final anti- or protumorigenic effect is currently unclear. Future in vivo studies involving single-cell transcriptome and detailed analysis of the role of each gene in the phenotype of CD11b+ BM cells will be necessary to clarify whether and how PC-EVs uptake by these cells contributes to the setup of PC microenvironments. Stepping further into the future, the study of PC-educated BM-derived cells linked with PC metastasis in the peripheral blood could be used as a minimally invasive method to detect and monitor these protumorigenic niches in clinical settings, thus having a potential impact in improving early diagnosis, treatment, and follow-up of patients with PC and other oncologic diseases. Additionally, it has the potential to contribute to the development of therapeutic targeting of BM-derived cells that promote liver metastatic disease.
Data Availability Statement
The datasets presented in this study can be found in online repositories. The names of the repository/repositories and accession number(s) can be found in the article/ Supplementary Material.
Ethics Statement
All mouse work was performed in accordance with national animal experimentation guidelines (DGAV), animal protocol 0421/000/000/2018.
Author Contributions
JM designed and performed the experiments. AM and JP performed the transmission electron microscopy studies. AO, AC, RM, and HB performed the mass spectrometry studies. MS built the experimental setup. BC-S conceived the project. All authors wrote and reviewed the manuscript.
Funding
JM was supported by “Fundação para a Ciência e a Tecnologia” (PD/BD/105866/2014). This work was supported by the Champalimaud Foundation; grant 751547 from H2020-MSCA-IF-2016; EMBO Installation Grant 3921; grant 2017NovPCC1058 from Breast Cancer Now’s Catalyst Programme, which is supported by funding from Pfizer; grant 765492 from H2020-MSCA-ITN-2017; and grant LCF/PR/HR19/52160014 from “La Caixa” Foundation. This work was also funded by FEDER funds through the Operational Programme for Competitiveness Factors-COMPETE and National Funds through the Foundation for Science and Technology (FCT), under the project: PTDC/MED-ONC/28489/2017 (to AM). JP acknowledges the FCT grant SFRH/BD/137319/2018.
Conflict of Interest
The authors declare that the research was conducted in the absence of any commercial or financial relationships that could be construed as a potential conflict of interest.
Acknowledgments
The authors would like to thank Inês Coelho, Silvia Batista, Ana Gregório, Julia Elzanowska, and Cristian Bodo for their support in the final preparation of the manuscript and Rui Fernandes (HEMS, i3S Scientific platform) for TEM image acquisition.
Supplementary Material
The Supplementary Material for this article can be found online at: https://www.frontiersin.org/articles/10.3389/fcell.2020.592518/full#supplementary-material
Supplementary Figure 1 | Validation of differentially expressed genes by quantitative PCR (qPCR). Depicted in the graph is the fold change of CD11b+ BM cells from animals treated PC EVs or PBS (control). Ighv1-26 and Ighv4-59 relative gene expression was evaluated by qPCR. Error bars represent ± SEM for n = 4, each point represents a pool of at least 5 animals. qPCR samples were normalized to both reference genes (Gapdh and Hmbs).
References
Abbas, A. K., and Janeway, C. A. Jr. (2000). Immunology: improving on nature in the twenty-first century. Cell 100, 129–138. doi: 10.1016/S0092-8674(00)81689-X
Ahmad, A., Barakat, D. J., Suresh, R., Barberi, T., Pienta, K. J., Simons, B. W., et al. (2018). Absence of myeloid Klf4 reduces prostate cancer growth with pro-atherosclerotic activation of tumor myeloid cells and infiltration of CD8 T cells. PLoS One 13:e0191188. doi: 10.1371/journal.pone.0191188
Ahmad, A., Li, X.-M., Wang, J.-R., Shen, T., Gao, S.-S., He, X.-S., et al. (2017). Nur77 deficiency in mice accelerates tumor invasion and metastasis by facilitating TNFα secretion and lowering CSF-1R expression. PLoS One 12:e0171347. doi: 10.1371/journal.pone.0171347
Alam, M. Z., Devalaraja, S., and Haldar, M. (2017). The heme connection: linking erythrocytes and macrophage biology. Front. Immunol. 8:33. doi: 10.3389/fimmu.2017.00033
Andreu, P., Johansson, M., Affara, N. I., Pucci, F., Tan, T., Junankar, S., et al. (2010). FcRγ activation regulates inflammation-associated squamous carcinogenesis. Cancer Cell 17, 121–134. doi: 10.1016/j.ccr.2009.12.019
Barbera-Guillem, E., May, K. F., Nyhus, J. K., and Nelson, M. B. (1999). Promotion of tumor invasion by cooperation of granulocytes and macrophages activated by anti-tumor antibodies. Neoplasia 1, 453–460. doi: 10.1038/sj.neo.7900054
Bergfeld, S. A., and DeClerck, Y. A. (2010). Bone marrow-derived mesenchymal stem cells and the tumor microenvironment. Cancer Metastasis Rev. 29, 249–261. doi: 10.1007/s10555-010-9222-7
Bissell, M. J., and Hines, W. C. (2011). Why don’t we get more cancer? A proposed role of the microenvironment in restraining cancer progression. Nat. Med. 17, 320–329. doi: 10.1038/nm.2328
Busch, S., Talamini, M., Brenner, S., Abdulazim, A., Hänggi, D., Neumaier, M., et al. (2019). Circulating monocytes and tumor−associated macrophages express recombined immunoglobulins in glioblastoma patients. Clin. Transl. Med. 8:18. doi: 10.1186/s40169-019-0235-8
Carson, W. F., Salter-Green, S. E., Scola, M. M., Joshi, A., Gallagher, K. A., and Kunkel, S. L. (2017). Enhancement of macrophage inflammatory responses by CCL2 is correlated with increased miR-9 expression and downregulation of the ERK1/2 phosphatase Dusp6. Cell. Immunol. 314, 63–72. doi: 10.1016/j.cellimm.2017.02.005
Carter, J. H., and Tourtellotte, W. G. (2007). Early growth response transcriptional regulators are dispensable for macrophage differentiation. J. Immunol. 178, 3038–3047. doi: 10.4049/jimmunol.178.5.3038
Carvalho, A. S., Ribeiro, H., Voabil, P., Penque, D., Jensen, O. N., Molina, H., et al. (2014). Global mass spectrometry and transcriptomics array based drug profiling provides novel insight into glucosamine induced endoplasmic reticulum stress. Mol. Cell Proteomics 13, 3294–3307. doi: 10.1074/mcp.M113.034363
Cassol, E., Cassetta, L., Rizzi, C., Alfano, M., and Poli, G. (2009). M1 and M2a polarization of human monocyte-derived macrophages inhibits HIV-1 replication by distinct mechanisms. J. Immunol. 182, 6237–6246. doi: 10.4049/jimmunol.0803447
Chang, C. L., Garcia-Arcos, I., Nyren, R., Olivecrona, G., Kim, J. Y., Hu, Y., et al. (2018). Lipoprotein lipase deficiency impairs bone marrow myelopoiesis and reduces circulating monocyte levels. Arterioscler. Thromb. Vasc. Biol. 38, 509–519. doi: 10.1161/ATVBAHA.117.310607
Chen, L., Wang, S., Zhou, Y., Wu, X., Entin, I., Epstein, J., et al. (2010). Identification of early growth response protein 1 (EGR-1) as a novel target for JUN-induced apoptosis in multiple myeloma. Blood 115, 61–70. doi: 10.1182/blood-2009-03-210526
Chen, Q., Wang, J., Zhang, Q., Zhang, J., Lou, Y., Yang, J., et al. (2019). Tumour cell-derived debris and IgG synergistically promote metastasis of pancreatic cancer by inducing inflammation via tumour-associated macrophages. Br. J. Cancer 121, 786–795. doi: 10.1038/s41416-019-0595-2
Chiba, Y., Mizoguchi, I., Furusawa, J., Hasegawa, H., Ohashi, M., Xu, M., et al. (2018). Interleukin-27 exerts its antitumor effects by promoting differentiation of hematopoietic stem cells to M1 macrophages. Cancer Res. 78, 182–194. doi: 10.1158/0008-5472.CAN-17-0960
Costa-Silva, B., Aiello, N. M., Ocean, A. J., Singh, S., Zhang, H., Basant, K., et al. (2015). Pancreatic cancer exosomes initiate pre-metastatic niche formation in the liver. Nat. Cell Biol. 17, 816–826. doi: 10.1038/ncb3169
Cox, J., and Mann, M. (2008). MaxQuant enables high peptide identification rates, individualized p.p.b.-range mass accuracies and proteome-wide protein quantification. Nat. Biotechnol. 26, 1367–1372. doi: 10.1038/nbt.1511
Cullen, E. M., Brazil, J. C., and O’Connor, C. M. (2010). Mature human neutrophils constitutively express the transcription factor EGR-1. Mol. Immunol. 47, 1701–1709. doi: 10.1016/j.molimm.2010.03.003
de Marcken, M., Dhaliwal, K., Danielsen, A. C., Gautron, A. S., and Dominguez-Villar, M. (2019). TLR7 and TLR8 activate distinct pathways in monocytes during RNA virus infection. Sci. Signal. 12:eaaw1347. doi: 10.1126/scisignal.aaw1347
Denecke, B., Meyerdierks, A., and Böttger, E. C. (1999). RGS1 is expressed in monocytes and acts as a GTPase-activating protein for G-protein-coupled chemoattractant receptors. J. Biol. Chem. 274, 26860–26868. doi: 10.1074/jbc.274.38.26860
Ferreira, N., Marques, A., Aguas, H., Bandarenka, H., Martins, R., Bodo, C., et al. (2019). Label-free nanosensing platform for breast cancer exosome profiling. ACS Sens. 4, 2073–2083. doi: 10.1021/acssensors.9b00760
Foucher, E. D., Ghigo, C., Chouaib, S., Galon, J., Iovanna, J., and Olive, D. (2018). Pancreatic ductal adenocarcinoma: a strong imbalance of good and bad immunological cops in the tumor microenvironment. Front. Immunol. 9:1044. doi: 10.3389/fimmu.2018.01044
Frontera, E. D., Khansa, R. M., Schalk, D. L., Leakan, L. E., Guerin-Edbauer, T. J., Ratnam, M., et al. (2018). IgA Fc-folate conjugate activates and recruits neutrophils to directly target triple-negative breast cancer cells. Breast Cancer Res. Treat. 172, 551–560. doi: 10.1007/s10549-018-4941-5
Gabet, Y., Baniwal, S. K., Leclerc, N., Shi, Y., Kohn-Gabet, A. E., Cogan, J., et al. (2010). Krox20/EGR2 deficiency accelerates cell growth and differentiation in the monocytic lineage and decreases bone mass. Blood 116, 3964–3971. doi: 10.1182/blood-2010-01-263830
Granot, Z., Henke, E., Comen, E. A., King, T. A., Norton, L., and Benezra, R. (2011). Tumor entrained neutrophils inhibit seeding in the premetastatic lung. Cancer Cell 20, 300–314. doi: 10.1016/j.ccr.2011.08.012
Gratchev, A. (2017). TGF-beta signalling in tumour associated macrophages. Immunobiology 222, 75–81. doi: 10.1016/j.imbio.2015.11.016
Griffin, D. O., and Rothstein, T. L. (2011). A small CD11b+ human B1 cell subpopulation stimulates T cells and is expanded in lupus. J. Exp. Med. 208, 2591–2598. doi: 10.1084/jem.20110978
Gschwandtner, M., Derler, R., and Midwood, K. S. (2019). More than just attractive: how CCL2 influences myeloid cell behavior beyond chemotaxis. Front. Immunol. 10:2759. doi: 10.3389/fimmu.2019.02759
Haldar, M., Kohyama, M., So, A. Y., Kc, W., Wu, X., Briseno, C. G., et al. (2014). Heme-mediated SPI-C induction promotes monocyte differentiation into iron-recycling macrophages. Cell 156, 1223–1234. doi: 10.1016/j.cell.2014.01.069
Hamers, A. A., Argmann, C., Moerland, P. D., Koenis, D. S., Marinkovic, G., Sokolovic, M., et al. (2016). Nur77-deficiency in bone marrow-derived macrophages modulates inflammatory responses, extracellular matrix homeostasis, phagocytosis and tolerance. BMC Genomics 17:162. doi: 10.1186/s12864-016-2469-9
Hanna, R. N., Carlin, L. M., Hubbeling, H. G., Nackiewicz, D., Green, A. M., Punt, J. A., et al. (2011). The transcription factor NR4A1 (Nur77) controls bone marrow differentiation and the survival of Ly6C- monocytes. Nat. Immunol. 12, 778–785. doi: 10.1038/ni.2063
Haziot, A., Fuchs, T., Hahn, M., Ries, L., Giesler, S., Busch, S., et al. (2018). Expression of combinatorial immunoglobulins in macrophages in the tumor microenvironment. PLoS One 13:e0204108. doi: 10.1371/journal.pone.0204108
Hop, H. T., Arayan, L. T., Huy, T. X. N., Reyes, A. W. B., Vu, S. H., Min, W., et al. (2018). The key role of c-Fos for immune regulation and bacterial dissemination in brucella infected macrophage. Front. Cell Infect. Microbiol. 8:287. doi: 10.3389/fcimb.2018.00287
Hoshino, A., Costa-Silva, B., Shen, T.-L., Rodrigues, G., Hashimoto, A., Tesic Mark, M., et al. (2015). Tumour exosome integrins determine organotropic metastasis. Nature 527, 329–335. doi: 10.1038/nature15756
Hoshino, A., Kim, H. S., Bojmar, L., Gyan, K. E., Cioffi, M., Hernandez, J., et al. (2020). Extracellular vesicle and particle biomarkers define multiple human cancers. Cell 182, 1044–1061.e18. doi: 10.1016/j.cell.2020.07.009
Hu, X., Tang, J., Zeng, G., Hu, X., Bao, P., Wu, J., et al. (2019). RGS1 silencing inhibits the inflammatory response and angiogenesis in rheumatoid arthritis rats through the inactivation of Toll−like receptor signaling pathway. J. Cell. Physiol. 234, 20432–20442. doi: 10.1002/jcp.28645
Huang, S., Singh, R. K., Xie, K., Gutman, M., Berry, K. K., Bucana, C. D., et al. (1994). Expression of theJE/MCP-1 gene suppresses metastatic potential in murine colon carcinoma cells. Cancer Immunol. Immunother. 39, 231–238. doi: 10.1007/BF01525986
Jablonski, K. A., Amici, S. A., Webb, L. M., Ruiz-Rosado Jde, D., Popovich, P. G., Partida-Sanchez, S., et al. (2015). Novel markers to delineate murine M1 and M2 macrophages. PLoS One 10:e0145342. doi: 10.1371/journal.pone.0145342
Jiang, P., Gao, W., Ma, T., Wang, R., Piao, Y., Dong, X., et al. (2019). CD137 promotes bone metastasis of breast cancer by enhancing the migration and osteoclast differentiation of monocytes/macrophages. Theranostics 9, 2950–2966. doi: 10.7150/thno.29617
Kalluri, R., and LeBleu, V. S. (2020). The biology, function, and biomedical applications of exosomes. Science 367:eaau6977. doi: 10.1126/science.aau6977
Kapoor, N., Niu, J., Saad, Y., Kumar, S., Sirakova, T., Becerra, E., et al. (2015). Transcription factors STAT6 and KLF4 implement macrophage polarization via the dual catalytic powers of MCPIP. J. Immunol. 194, 6011–6023. doi: 10.4049/jimmunol.1402797
Kellner, C., Otte, A., Cappuzzello, E., Klausz, K., and Peipp, M. (2017). Modulating cytotoxic effector functions by Fc engineering to improve cancer therapy. Transfusion Med. Hemother. 44, 327–336. doi: 10.1159/000479980
Kohyama, M., Ise, W., Edelson, B. T., Wilker, P. R., Hildner, K., Mejia, C., et al. (2008). Role for Spi-C in the development of red pulp macrophages and splenic iron homeostasis. Nature 457, 318–321. doi: 10.1038/nature07472
Kowal, J., Arras, G., Colombo, M., Jouve, M., Morath, J. P., Primdal-Bengtson, B., et al. (2016). Proteomic comparison defines novel markers to characterize heterogeneous populations of extracellular vesicle subtypes. Proc. Natl. Acad. Sci. U.S.A. 113, E968–E977. doi: 10.1073/pnas.1521230113
Krämer, B., Meichle, A., Hensel, G., Charnay, P., and Krönke, M. (1994). Characterization of an Krox-24/Egr-1-responsive element in the human tumor necrosis factor promoter. Biochim. Biophys. Acta 1219, 413–421. doi: 10.1016/0167-4781(94)90066-3
Kratochvill, F., Neale, G., Haverkamp, J. M., Van de Velde, L. A., Smith, A. M., Kawauchi, D., et al. (2015). TNF counterbalances the emergence of M2 tumor macrophages. Cell Rep. 12, 1902–1914. doi: 10.1016/j.celrep.2015.08.033
Kurotaki, D., Sasaki, H., and Tamura, T. (2017). Transcriptional control of monocyte and macrophage development. Int. Immunol. 29, 97–107. doi: 10.1093/intimm/dxx016
Labzin, L. I., Schmidt, S. V., Masters, S. L., Beyer, M., Krebs, W., Klee, K., et al. (2015). ATF3 is a key regulator of macrophage IFN responses. J. Immunol. 195, 4446–4455. doi: 10.4049/jimmunol.1500204
Lavender, N., Yang, J., Chen, S.-C., Sai, J., Johnson, C. A., Owens, P., et al. (2017). The Yin/Yan of CCL2: a minor role in neutrophil anti-tumor activity in vitro but a major role on the outgrowth of metastatic breast cancer lesions in the lung in vivo. BMC Cancer 17:88. doi: 10.1186/s12885-017-3074-2
Lee, S., and Margolin, K. (2011). Cytokines in cancer immunotherapy. Cancers 3, 3856–3893. doi: 10.3390/cancers3043856
Lewçn, S., Zhou, H., Hu, H.-D., Cheng, T., Markowitz, D., Reisfeld, R. A., et al. (2007). A Legumain-based minigene vaccine targets the tumor stroma and suppresses breast cancer growth and angiogenesis. Cancer Immunol. Immunother. 57, 507–515. doi: 10.1007/s00262-007-0389-x
Li, H., Yang, B., Huang, J., Lin, Y., Xiang, T., Wan, J., et al. (2015). Cyclooxygenase-2 in tumor-associated macrophages promotes breast cancer cell survival by triggering a positive-feedback loop between macrophages and cancer cells. Oncotarget 6, 29637–29650. doi: 10.18632/oncotarget.4936
Li, M., Knight, D. A., Snyder, L. A., Smyth, M. J., and Stewart, T. J. (2014). A role for CCL2 in both tumor progression and immunosurveillance. Oncoimmunology 2:e25474. doi: 10.4161/onci.25474
Li, X., Yao, W., Yuan, Y., Chen, P., Li, B., Li, J., et al. (2017). Targeting of tumour-infiltrating macrophages via CCL2/CCR2 signalling as a therapeutic strategy against hepatocellular carcinoma. Gut 66, 157–167. doi: 10.1136/gutjnl-2015-310514
Lukanidin, E., and Sleeman, J. P. (2012). Building the niche: the role of the S100 proteins in metastatic growth. Semin. Cancer Biol. 22, 216–225. doi: 10.1016/j.semcancer.2012.02.006
Luo, Y. P., Zhou, H., Krueger, J., Kaplan, C., Liao, D., Markowitz, D., et al. (2009). The role of proto-oncogene Fra-1 in remodeling the tumor microenvironment in support of breast tumor cell invasion and progression. Oncogene 29, 662–673. doi: 10.1038/onc.2009.308
Mahajan, S., Saini, A., Chandra, V., Nanduri, R., Kalra, R., Bhagyaraj, E., et al. (2015). Nuclear receptor Nr4a2 promotes alternative polarization of macrophages and confers protection in sepsis. J. Biol. Chem. 290, 18304–18314. doi: 10.1074/jbc.M115.638064
Maia, J., Caja, S., Strano Moraes, M. C., Couto, N., and Costa-Silva, B. (2018). Exosome-based cell-cell communication in the tumor microenvironment. Front. Cell Dev. Biol. 6:18. doi: 10.3389/fcell.2018.00018
Maruyama, K., Sano, G., Ray, N., Takada, Y., and Matsuo, K. (2007). c-Fos-deficient mice are susceptible to Salmonella enterica serovar Typhimurium infection. Infect. Immun. 75, 1520–1523. doi: 10.1128/IAI.01316-06
Matthiesen, R., Prieto, G., Amorim, A., Aloria, K., Fullaondo, A., Carvalho, A. S., et al. (2012). SIR: deterministic protein inference from peptides assigned to MS data. J. Proteomics 75, 4176–4183. doi: 10.1016/j.jprot.2012.05.010
McClure, C., Ali, E., Youssef, D., Yao, Z. Q., McCall, C. E., El Gazzar, M., et al. (2016). NFI-A disrupts myeloid cell differentiation and maturation in septic mice. J. Leukoc. Biol. 99, 201–211. doi: 10.1189/jlb.4A0415-171RR
Melo, S. A., Luecke, L. B., Kahlert, C., Fernandez, A. F., Gammon, S. T., Kaye, J., et al. (2015). Glypican-1 identifies cancer exosomes and detects early pancreatic cancer. Nature 523, 177–182. doi: 10.1038/nature14581
Mitchem, J. B., and DeNardo, D. G. (2012). Battle over CCL2 for control of the metastatic niche: neutrophils versus monocytes. Breast Cancer Res. 14:315. doi: 10.1186/bcr3149
Nolte-’t Hoen, E. N. M., Buermans, H. P. J., Waasdorp, M., Stoorvogel, W., Wauben, M. H. M., and ’t Hoen, P. A. C. (2012). Deep sequencing of RNA from immune cell-derived vesicles uncovers the selective incorporation of small non-coding RNA biotypes with potential regulatory functions. Nucleic Acids Res. 40, 9272–9285. doi: 10.1093/nar/gks658
Ntanasis-Stathopoulos, I., Fotiou, D., and Terpos, E. (2020). CCL3 signaling in the tumor microenvironment. Adv. Exp. Med. Biol. 1231, 13–21. doi: 10.1007/978-3-030-36667-4_2
O’Neill, P. A., and Romsdahl, M. M. (2009). IgA as a blocking factor in human malignant melanoma. Immunol. Commun. 3, 427–438. doi: 10.3109/08820137409061123
Patel, J., McNeill, E., Douglas, G., Hale, A. B., de Bono, J., Lee, R., et al. (2015). RGS1 regulates myeloid cell accumulation in atherosclerosis and aortic aneurysm rupture through altered chemokine signalling. Nat. Commun. 6:6614. doi: 10.1038/ncomms7614
Peinado, H., Aleèkoviæ, M., Lavotshkin, S., Matei, I., Costa-Silva, B., Moreno-Bueno, G., et al. (2012). Melanoma exosomes educate bone marrow progenitor cells toward a pro-metastatic phenotype through MET. Nat. Med. 18, 883–891. doi: 10.1038/nm.2753
Pfaffl, M. W. (2001). A new mathematical model for relative quantification in real-time RT-PCR. Nucleic Acids Res. 29:e45. doi: 10.1093/nar/29.9.e45
Prakash, H., Nadella, V., Singh, S., and Schmitz-Winnenthal, H. (2016). CD14/TLR4 priming potentially recalibrates and exerts anti-tumor efficacy in tumor associated macrophages in a mouse model of pancreatic carcinoma. Sci. Rep. 6:31490. doi: 10.1038/srep31490
Qian, B.-Z., Li, J., Zhang, H., Kitamura, T., Zhang, J., Campion, L. R., et al. (2011). CCL2 recruits inflammatory monocytes to facilitate breast-tumour metastasis. Nature 475, 222–225. doi: 10.1038/nature10138
Radomska, H. S., Alberich-Jorda, M., Will, B., Gonzalez, D., Delwel, R., and Tenen, D. G. (2012). Targeting CDK1 promotes FLT3-activated acute myeloid leukemia differentiation through C/EBPalpha. J. Clin. Invest. 122, 2955–2966. doi: 10.1172/JCI43354
Ray, N., Kuwahara, M., Takada, Y., Maruyama, K., Kawaguchi, T., Tsubone, H., et al. (2006). c-Fos suppresses systemic inflammatory response to endotoxin. Int. Immunol. 18, 671–677. doi: 10.1093/intimm/dxl004
Raza, K., and Mishra, A. (2012). A novel anticlustering filtering algorithm for the prediction of genes as a drug target. Am. J. Biomed. Eng. 2, 206–211. doi: 10.5923/j.ajbe.20120205.03
Record, M., Carayon, K., Poirot, M., and Silvente-Poirot, S. (2014). Exosomes as new vesicular lipid transporters involved in cell–cell communication and various pathophysiologies. Biochim. Biophys. Acta 1841, 108–120. doi: 10.1016/j.bbalip.2013.10.004
Record, M., Silvente-Poirot, S., Poirot, M., and Wakelam, M. J. O. (2018). Extracellular vesicles: lipids as key components of their biogenesis and functions. J. Lipid Res. 59, 1316–1324. doi: 10.1194/jlr.E086173
Robinson, M. D., McCarthy, D. J., and Smyth, G. K. (2009). edgeR: a Bioconductor package for differential expression analysis of digital gene expression data. Bioinformatics 26, 139–140. doi: 10.1093/bioinformatics/btp616
Roca, H., Varsos, Z. S., Sud, S., Craig, M. J., Ying, C., and Pienta, K. J. (2009). CCL2 and interleukin-6 promote survival of human CD11b+ peripheral blood mononuclear cells and induce M2-type macrophage polarization. J. Biol. Chem. 284, 34342–34354. doi: 10.1074/jbc.M109.042671
Salcedo, R., Ponce, M. L., Young, H. A., Wasserman, K., Ward, J. M., Kleinman, H. K., et al. (2000). Human endothelial cells express CCR2 and respond to MCP-1: direct role of MCP-1 in angiogenesis and tumor progression. Blood 96, 34–40. doi: 10.1182/blood.V96.1.34
Sha, H., Zhang, D., Zhang, Y., Wen, Y., and Wang, Y. (2017). ATF3 promotes migration and M1/M2 polarization of macrophages by activating tenascin-C via Wnt/β-catenin pathway. Mol. Med. Rep. 16, 3641–3647. doi: 10.3892/mmr.2017.6992
Shalapour, S., Font-Burgada, J., Di Caro, G., Zhong, Z., Sanchez-Lopez, E., Dhar, D., et al. (2015). Immunosuppressive plasma cells impede T-cell-dependent immunogenic chemotherapy. Nature 521, 94–98. doi: 10.1038/nature14395
Shen, Y., Guo, D., Weng, L., Wang, S., Ma, Z., Yang, Y., et al. (2017). Tumor-derived exosomes educate dendritic cells to promote tumor metastasis via HSP72/HSP105-TLR2/TLR4 pathway. Oncoimmunology 6:e1362527. doi: 10.1080/2162402X.2017.1362527
Shinohara, H., Kuranaga, Y., Kumazaki, M., Sugito, N., Yoshikawa, Y., Takai, T., et al. (2017). Regulated polarization of tumor-associated macrophages by miR-145 via colorectal cancer-derived extracellular vesicles. J. Immunol. 199, 1505–1515. doi: 10.4049/jimmunol.1700167
Showalter, M. R., Wancewicz, B., Fiehn, O., Archard, J. A., Clayton, S., Wagner, J., et al. (2019). Primed mesenchymal stem cells package exosomes with metabolites associated with immunomodulation. Biochem. Biophys. Res. Commun. 512, 729–735. doi: 10.1016/j.bbrc.2019.03.119
Song, R., Liu, S., and Leong, K. W. (2007). Effects of MIP-1α, MIP-3α, and MIP-3β on the induction of HIV Gag-specific immune response with DNA vaccines. Mol. Ther. 15, 1007–1015. doi: 10.1038/mt.sj.6300129
Stahl, P. D., and Raposo, G. (2019). Extracellular vesicles: exosomes and microvesicles, integrators of homeostasis. Physiology 34, 169–177. doi: 10.1152/physiol.00045.2018
Steffen, U., Koeleman, C. A., Sokolova, M. V., Bang, H., Kleyer, A., Rech, J., et al. (2020). IgA subclasses have different effector functions associated with distinct glycosylation profiles. Nat. Commun. 11:120. doi: 10.1038/s41467-019-13992-8
Thery, C., Witwer, K. W., Aikawa, E., Alcaraz, M. J., Anderson, J. D., Andriantsitohaina, R., et al. (2018). Minimal information for studies of extracellular vesicles 2018 (MISEV2018): a position statement of the international society for extracellular vesicles and update of the MISEV2014 guidelines. J. Extracell. Vesicles 7:1535750. doi: 10.1080/20013078.2018.1535750
Valenti, R., Huber, V., Filipazzi, P., Pilla, L., Sovena, G., Villa, A., et al. (2006). Human tumor-released microvesicles promote the differentiation of myeloid cells with transforming growth factor-β–mediated suppressive activity on T lymphocytes. Cancer Res. 66, 9290–9298. doi: 10.1158/0008-5472.CAN-06-1819
van Iterson, M., Boer, J. M., and Menezes, R. X. (2010). Filtering, FDR and power. BMC Bioinformatics 11:450. doi: 10.1186/1471-2105-11-450
Veremeyko, T., Yung, A. W. Y., Anthony, D. C., Strekalova, T., and Ponomarev, E. D. (2018). Early growth response gene-2 is essential for M1 and M2 macrophage activation and plasticity by modulation of the transcription factor CEBPbeta. Front. Immunol. 9:2515. doi: 10.3389/fimmu.2018.02923
Wan, X., Lei, Y., Li, Z., Wang, J., Chen, Z., McNutt, M., et al. (2015). Pancreatic expression of immunoglobulin g in human pancreatic cancer and associated diabetes. Pancreas 44, 1304–1313. doi: 10.1097/MPA.0000000000000544
Wang, K., Zhou, W., Cai, Q., Cheng, J., Cai, R., and Xing, R. (2017). SUMOylation of KLF4 promotes IL-4 induced macrophage M2 polarization. Cell Cycle 16, 374–381. doi: 10.1080/15384101.2016.1269045
Wang, X., Yao, B., Wang, Y., Fan, X., Wang, S., Niu, A., et al. (2017). Macrophage cyclooxygenase-2 protects against development of diabetic nephropathy. Diabetes 66, 494–504. doi: 10.2337/db16-0773
Wculek, S. K., Cueto, F. J., Mujal, A. M., Melero, I., Krummel, M. F., and Sancho, D. (2019). Dendritic cells in cancer immunology and immunotherapy. Nature Rev. Immunol. 20, 7–24. doi: 10.1038/s41577-019-0210-z
Wen, Y., Lu, X., Ren, J., Privratsky, J. R., Yang, B., Rudemiller, N. P., et al. (2019). KLF4 in macrophages attenuates TNFalpha-mediated kidney injury and fibrosis. J. Am. Soc. Nephrol. 30, 1925–1938. doi: 10.1681/ASN.2019020111
Wisniewski, J. R., Zougman, A., Nagaraj, N., and Mann, M. (2009). Universal sample preparation method for proteome analysis. Nat. Methods 6, 359–362. doi: 10.1038/nmeth.1322
Wong, R. S. Y. (2011). Apoptosis in cancer: from pathogenesis to treatment. J. Exp. Clin. Cancer Res. 30:87. doi: 10.1186/1756-9966-30-87
Xu, Y., Chen, B., Zheng, S., Wen, Y., Xu, A., Xu, K., et al. (2016). IgG silencing induces apoptosis and suppresses proliferation, migration and invasion in LNCaP prostate cancer cells. Cell. Mol. Biol. Lett. 21:27. doi: 10.1186/s11658-016-0029-6
Ying, H., Dey, P., Yao, W., Kimmelman, A. C., Draetta, G. F., Maitra, A., et al. (2016). Genetics and biology of pancreatic ductal adenocarcinoma. Genes Dev. 30, 355–385. doi: 10.1101/gad.275776.115
Yu, Q., Huang, Q., Du, X., Xu, S., Li, M., and Ma, S. (2018). Early activation of Egr-1 promotes neuroinflammation and dopaminergic neurodegeneration in an experimental model of Parkinson’s disease. Exp. Neurol. 302, 145–154. doi: 10.1016/j.expneurol.2018.01.009
Yu, S., Liu, C., Su, K., Wang, J., Liu, Y., Zhang, L., et al. (2007). Tumor exosomes inhibit differentiation of bone marrow dendritic cells. J. Immunol. 178, 6867–6875. doi: 10.4049/jimmunol.178.11.6867
Zhou, M., Chen, J., Zhou, L., Chen, W., Ding, G., and Cao, L. (2014). Pancreatic cancer derived exosomes regulate the expression of TLR4 in dendritic cells via miR-203. Cell. Immunol. 292, 65–69. doi: 10.1016/j.cellimm.2014.09.004
Keywords: tumor microenvironment, extracellular vesicles, macrophages, monocytes, metastasis, pancreatic cancer, exosomes, cancer
Citation: Maia J, Otake AH, Poças J, Carvalho AS, Beck HC, Magalhães A, Matthiesen R, Strano Moraes MC and Costa-Silva B (2020) Transcriptome Reprogramming of CD11b+ Bone Marrow Cells by Pancreatic Cancer Extracellular Vesicles. Front. Cell Dev. Biol. 8:592518. doi: 10.3389/fcell.2020.592518
Received: 07 August 2020; Accepted: 27 October 2020;
Published: 27 November 2020.
Edited by:
Rodrigo Nalio Ramos, Institut Curie, FranceReviewed by:
Michele Bernasconi, University Children’s Hospital Bern, SwitzerlandTarcio Teodoro Braga, Federal University of Paraná, Brazil
Copyright © 2020 Maia, Otake, Poças, Carvalho, Beck, Magalhães, Matthiesen, Strano Moraes and Costa-Silva. This is an open-access article distributed under the terms of the Creative Commons Attribution License (CC BY). The use, distribution or reproduction in other forums is permitted, provided the original author(s) and the copyright owner(s) are credited and that the original publication in this journal is cited, in accordance with accepted academic practice. No use, distribution or reproduction is permitted which does not comply with these terms.
*Correspondence: Bruno Costa-Silva, YnJ1bm8uY29zdGEtc2lsdmFAcmVzZWFyY2guZmNoYW1wYWxpbWF1ZC5vcmc=