 Shizheng Qiu
 Peigang Cao2†
 Yang Hu
- 1School of Life Sciences and Technology, Harbin Institute of Technology, Harbin, China
- 2Department of Cardiovascular, General Hospital of Heilongjiang Province Land Reclamation Bureau, Harbin, China
The etiology of non-alcoholic fatty liver disease (NAFLD) involves complex interaction of genetic and environmental factors. A large number of observational studies have shown that hypothyroidism contributes to a high risk of NAFLD. However, the exact causality is still unknown. Due to the progress of genome-wide association study (GWAS) and the discovery of Mendelian randomization (MR), it is possible to explore the causality between the two diseases. In this study, in order to research into the influence of intermediate phenotypes on outcome, nine independent genetic variants of hypothyroidism obtained from the GWAS were used as instrumental variables (IVs) to perform MR analysis on NAFLD. Since there was no heterogeneity between IVs (P = 0.70), a fixed-effects model was used. The correlation between hypothyroidism and NAFLD was evaluated by using inverse-variance weighted (IVW) method and weighted median method. Then the sensitivity test was analyzed. The results showed that there was a high OR (1.7578; 95%CI 1.1897–2.5970; P = 0.0046) and a low intercept (−0.095; P = 0.431). None of the genetic variants drove the overall result (P < 0.01). Simply, we proved for the first time that the risk of NAFLD increases significantly on patients with hypothyroidism. Furthermore, we explained possible causes of NAFLD caused by hypothyroidism.
Introduction
Non-alcoholic fatty liver disease (NAFLD) is the leading cause of chronic liver disease and affects almost a quarter of the world’s population (Fan et al., 2011; Rinella, 2015; Chalasani et al., 2018). NAFLD covers a range of progressive liver diseases, which usually develops into cirrhosis and hepatocellular carcinoma (Byrne et al., 2018; Younossi et al., 2018). Moreover, NAFLD may increase the risk of heart metabolic diseases (e.g., type 2 diabetes, cardiovascular disease, and chronic kidney disease) (Mantovani et al., 2018). For decades, the mainstream view is that the serious disorder of glucose and lipid metabolism and imbalance of energy homeostasis are possible causes of NAFLD (Byrne and Targher, 2015; Non-alcoholic Fatty Liver Disease Study et al., 2015; Mantovani et al., 2018). Thyroid hormone (TH) happens to be one of the key regulator of energy homeostasis, which has a significant impact on glucose and lipid metabolism (Sinha et al., 2018). Hence, the subject whether hypothyroidism is a risk factor of NAFLD has attracted more attention. Chung et al. (2012) conducted a cross-sectional study with a total of 2,324 pairs of subjects with thyroid dysfunction and their controls. The results demonstrated that hypothyroidism was closely associated with NAFLD (OR: 1.38, 95%CI 1.17–1.62). Ludwig et al. (2015) assessed a cross-sectional study of 1,276 subjects and found that the prevalence of hepatic steatosis rises significantly with reductions in the serum thyroxin concentrations. Both of the studies above indicated that hypothyroidism is a risk factor of NAFLD. However, some other evidences have shown no causality between them (Guo et al., 2018) or even a reverse causality (Pagadala et al., 2012; Mantovani et al., 2018).
Randomized controlled trials (RCTs) are considered to be effective tools to judge the causality in clinical research. Nevertheless, in fact, RCT may be easy to be interfered by confounding factors. In addition, it is difficult to judge the sequence of some exposure and outcome, and the reverse causality is likely to be produced. Consequently, in this study, we designed a Mendelian randomization (MR) experiment to determine the causality between the two diseases. Unlike observational studies, which have many unavoidable limitations, MR estimation uses random allocation of alleles to simulate RCTs. The model based on MR is shown in Figure 1 and needs to satisfy three assumptions (Figure 1; Hemani et al., 2018b).
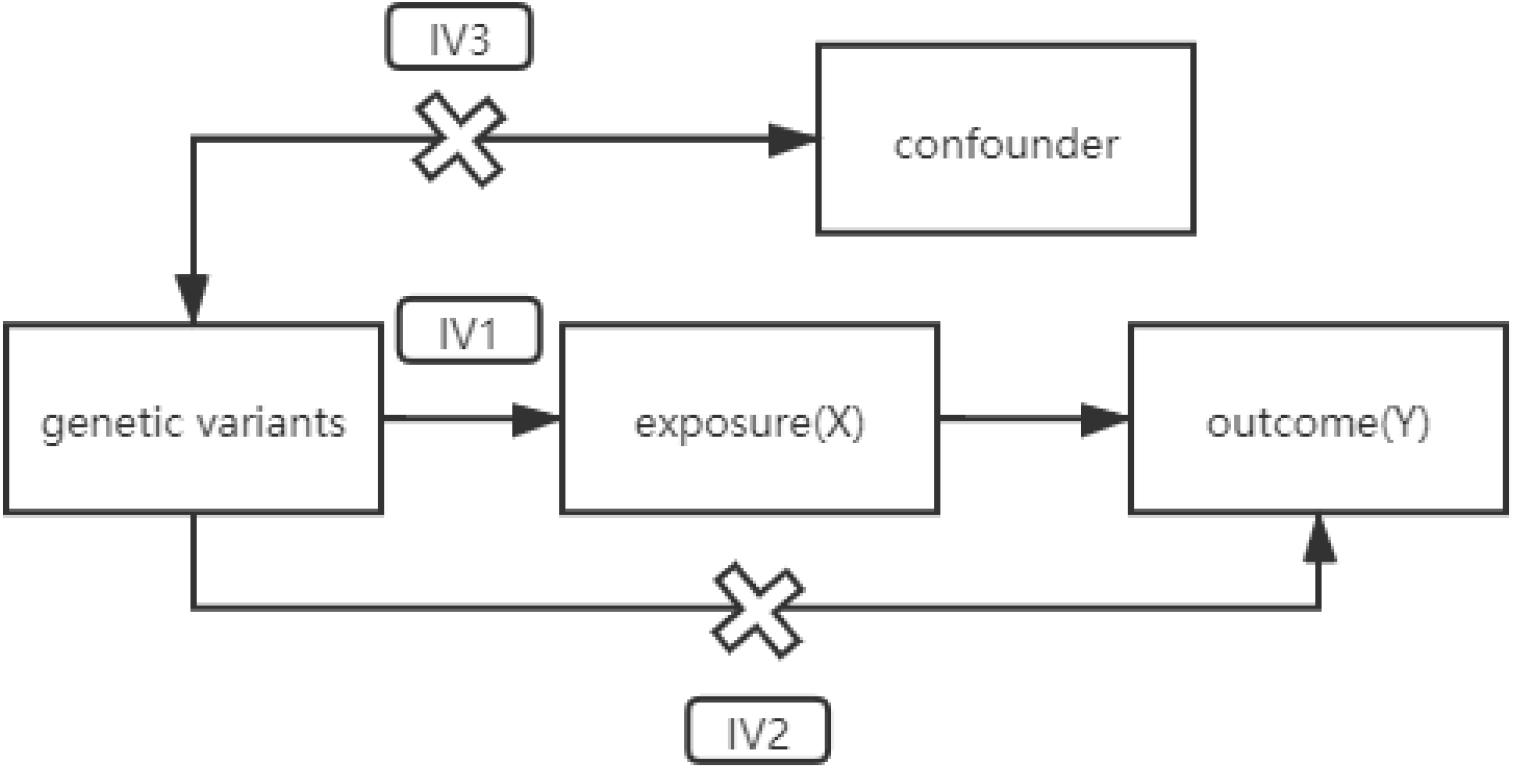
Figure 1. A directed acyclic graph of MR model. IV assumption 1: IVs are strongly correlated with exposure. IV assumption 2: IVs are independent of outcomes (i.e., IVs can only affect outcomes through exposure). IV assumption 3: IVs are not related to confounding factors. MR, Mendelian randomization; IVs, instrumental variables.
In our study, genetic variants related to hypothyroidism were introduced as instrumental variables (IVs). The causality between intermediate phenotypes and disease outcomes could be inferred by calculating the Wald ratio of the single-nucleotide polymorphism (SNP) effect on the outcome over the SNP effect on the exposure. According to Mendel’s genetic law, alleles are randomly assigned during separation. The time that each person obtains an allele at this SNP locus must occur before any confounding factors occur. Therefore, analysis based on IVs could exclude the influence of reverse causality.
Materials and Methods
Data Source
Two genome-wide association study (GWAS) datasets were used for MR analysis. In order to avoid the potential bias caused by population stratification, we only selected genetic variants and their corresponding aggregate statistics in the study of European origin (Cui et al., 2020). We obtained GWAS data of hypothyroidism from the IEU GWAS database which aggregated and analyzed 10,211 samples and 10,211 controls of European descent, and we obtained the information of 16,152,119 SNPs (Hemani et al., 2018b). The database was developed by the MRC Integrative Epidemiology Unit (IEU) at the University of Bristol. It is a collection of complete GWAS summary datasets, which can be downloaded as open-source files. The NAFLD dataset was obtained from GWAS study published by Anstee et al. (2020), which involved 1,483 European NAFLD cases and 17,781 genetically matched controls. It is the largest histology-based NAFLD GWAS to date, exhibiting the full spectrum of biopsy-proven NAFLD. The study had the necessary ethical approvals from the relevant national/institutional review boards, and all participants provided informed consent.
The corresponding genetic variants, chromosome numbers, positions, effect allele (EA), other alleles, EA frequencies (EAFs), P-value, beta coefficients, and standard errors (SEs) were extracted. Among them, the significant hypothyroidism genetic variants (P < 5E–08) were extracted to satisfy IV assumption 1, and the insignificant NAFLD genetic variants were extracted to satisfy IV assumption 2. Then their intersection was analyzed by using MR.
Data Processing and Analysis
Genetic variants should be processed into data that meet IV assumptions. First of all, we removed genetic variants that might have existing linkage disequilibrium (LD). LD refers to the association between alleles on the linked locus (Collins, 2009). They usually tend to be inherited together, which destroy the randomness of genetic variants, and the IV assumptions 2 or 3 may be violated. Thus, the genetic variants with potential LD were removed, and only the parts with longer physical distance (more than 10,000 kb) and less possibility of LD (R2 < 0.001) were retained. Besides, genetic variants of palindromic and incompatible alleles should be removed when harmonizing exposure and outcome.
Mendelian Randomization Analysis
The Wald ratio method (Hemani et al., 2018b), inverse-variance weighted (IVW) method (Burgess and Thompson, 2017), and Median-based method (Bowden et al., 2016a) were selected to analyze the relevance between hypothyroidism and NAFLD (Supplementary Methods). Assuming X and Y are the exposure (hypothyroidism) and the outcome (NAFLD), respectively, the Wald ratio (βMR) of hypothyroidism to NAFLD through specified genetic variants is calculated as follows:
and the standard error (σMR) of the estimate is
When there are multiple genetic variants, the IVW estimate (θIVW) is the weighted average of these casual estimates, using the inverse of their approximate variances as weights:
When the intercept is forced to zero, weighted linear regression could be used to estimate the outcome (βy) genetically related to the exposure (βx) (Burgess and Thompson, 2017). Fixed-effects IVW assumes that each genetic variant provides the same estimate of the effect; that is, none of the genetic variants shows horizontal pleiotropy. It is mainly applied in cases with no significant heterogeneity. In other cases, the random-effects model should be used (Cheng et al., 2019). Random-effects IVW allows each genetic variant to have a different average effect value (Bowden et al., 2017). It should be noted that the estimates of the random-effects model and the fixed effects model are the same, but the variance of the random-effects model is enlarged in order to take into account the heterogeneity of genetic variants (Hemani et al., 2018b). Furthermore, the weighted median estimate allows more powerful genetic variants to contribute more. It could be obtained by weighting the contribution of each genetic variant according to the inverse-variance associated with the result. Even if up to 50% of the IVs are invalid, the estimator is consistent (Bowden et al., 2016a).
Heterogeneity Tests
Heterogeneity between IVs is an indicator of potential violations of the IV assumptions (Bowden et al., 2017). Cochran’s Q test needs to be used to calculate the heterogeneity of IVW. Cochran’s Q test follows χ2 distribution, and P < 0.01 is defined as significant heterogeneity (Cheng et al., 2019).
Sensitivity Analysis
To evaluate the sensitivity of IVs in MR analysis, we designed a leave-one-out cross-validation (Hemani et al., 2018b). Suppose there are k samples in the genetic variant sets, and we select one genetic variant as the test set and k − 1 genetic variants as the training set. It can be evaluated whether the overall results are driven by one genetic variant with a high level of pluripotency. The fluctuation of the results before and after the genetic variant removal reflects the sensitivity of genetic variants. If the estimated value changes greatly when one of the genetic variants is discarded, it can be determined that this genetic variant is an outlier or sensitive.
Pluripotency Analysis
MR-Egger evaluates whether the pleiotropic effect of genetic variants on the result is different from zero on average (Bowden et al., 2015, 2016b). MR-Egger is similar to IVW, but the former adjusts IVW analysis by allowing non-zero intercepts, namely, allowing horizontal pleiotropic effects. Even if all of the genetic variants violate IV assumption 2, MR-Egger also returns an unbiased estimate of causal effects. In MR-Egger regression, the estimate of intercept can be interpreted as an estimate of the average pleiotropy of all genetic variants, and the slope coefficient provides an estimate of the bias of the causal effect.
The statistical tests for MR analysis were undertaken using the R package of Mendelian Randomization (Yavorska and Burgess, 2017) and TwoSampleMR (Hemani et al., 2018b).
Results
We calculated the intersection of SNPs, and we kept 13 eligible SNPs after removing LD. Then, we removed the incompatible alleles (rs9272245), and repeated (rs9272245) and palindrome SNPs (rs4766578). The information of nine SNPs that met the requirements, including chromosome numbers, position, beta coefficients, SEs, and P-value was shown (Table 1).
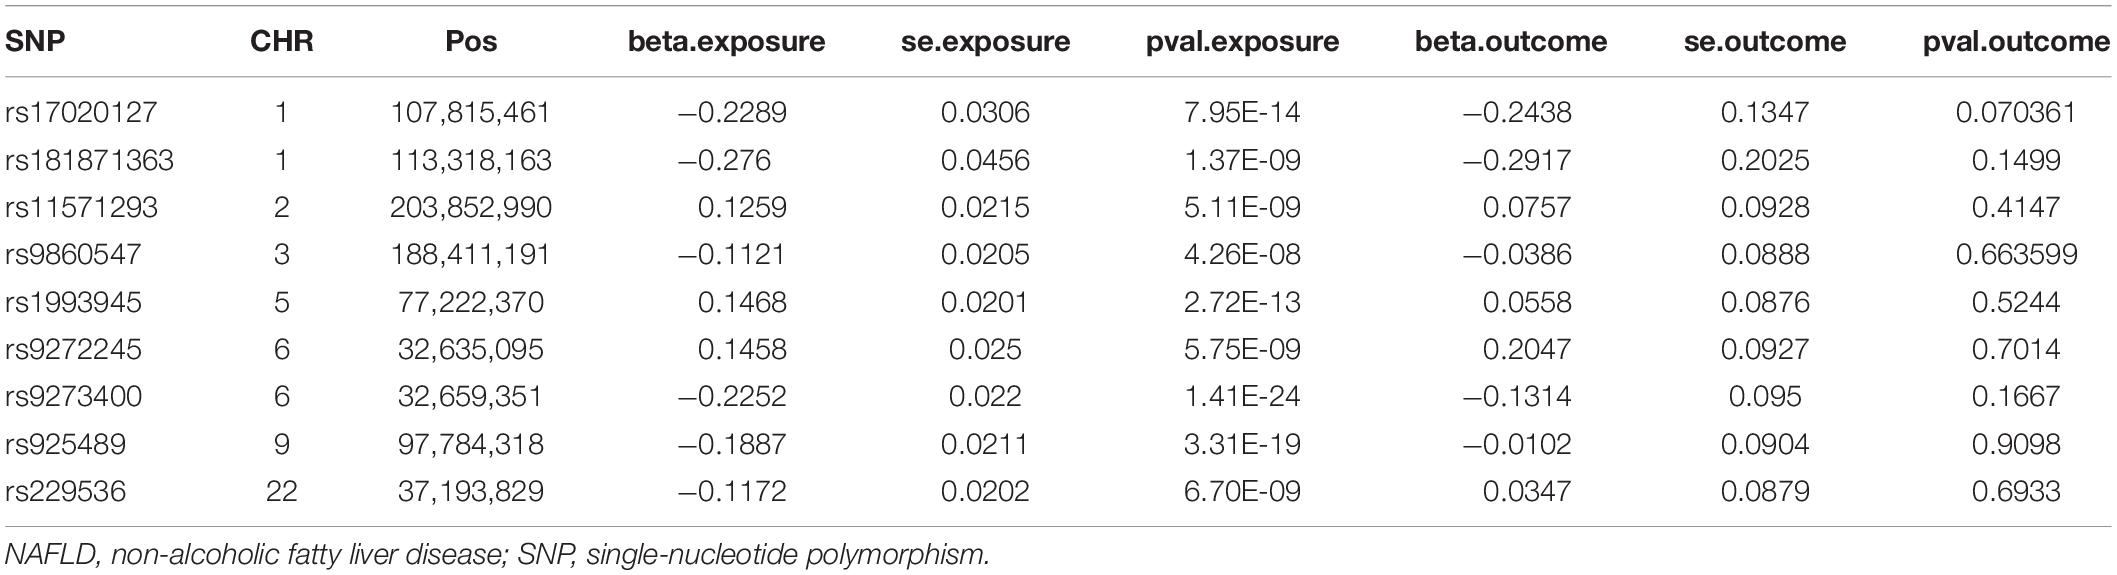
Table 1. Associations of genetic variants between hypothyroidism and NAFLD.
The Influence of Hypothyroidism on the Risk of Non-alcoholic Fatty Liver Disease
The IVW analysis found a significant OR (1.7578; 95%CI 1.1897–2.5970; P = 0.0046), proving that hypothyroidism was considerably related to the high risk of NAFLD. Since there was no heterogeneity between genetic variants (P = 0.70), a fixed model was preferred for MR analysis. The difference between the results of median-based estimator and the IVW method was very small (OR: 1.7049; 95%CI 1.0021–2.9006; P = 0.049). In addition, five other methods were analyzed, including simple median, penalized weighted median, penalized IVW, robust IVW, and penalized robust IVW methods (Table 2; Yavorska and Burgess, 2017). Similar results proved the accuracy of MR analysis.
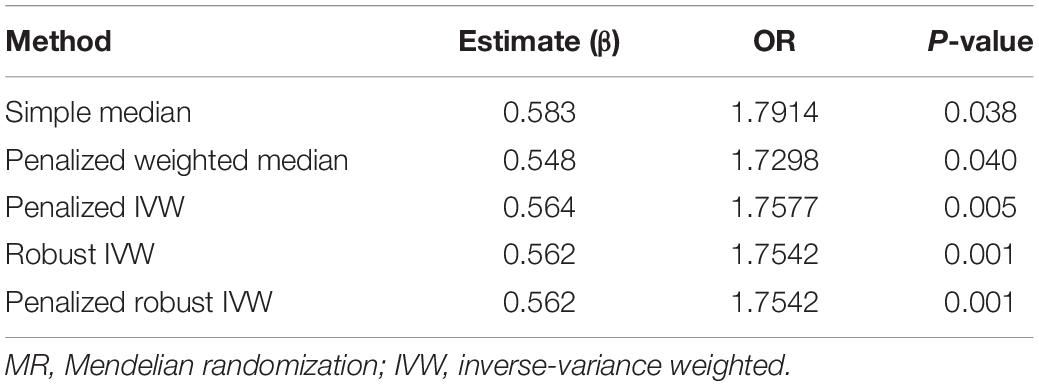
Table 2. Five other MR methods to analyze the causality.
Sensitivity Analysis
Leave-one-out cross-validation was used to calculate the MR result of the remaining IVs after removing them one by one. No matter which genetic variants were removed, the β value was greater than zero; that is, each point had a positive effect on the result (Figure 2 and Supplementary Table 1). There was also no significant difference from the overall result (P < 0.01). All the results indicated that none of genetic variants was sensitive.
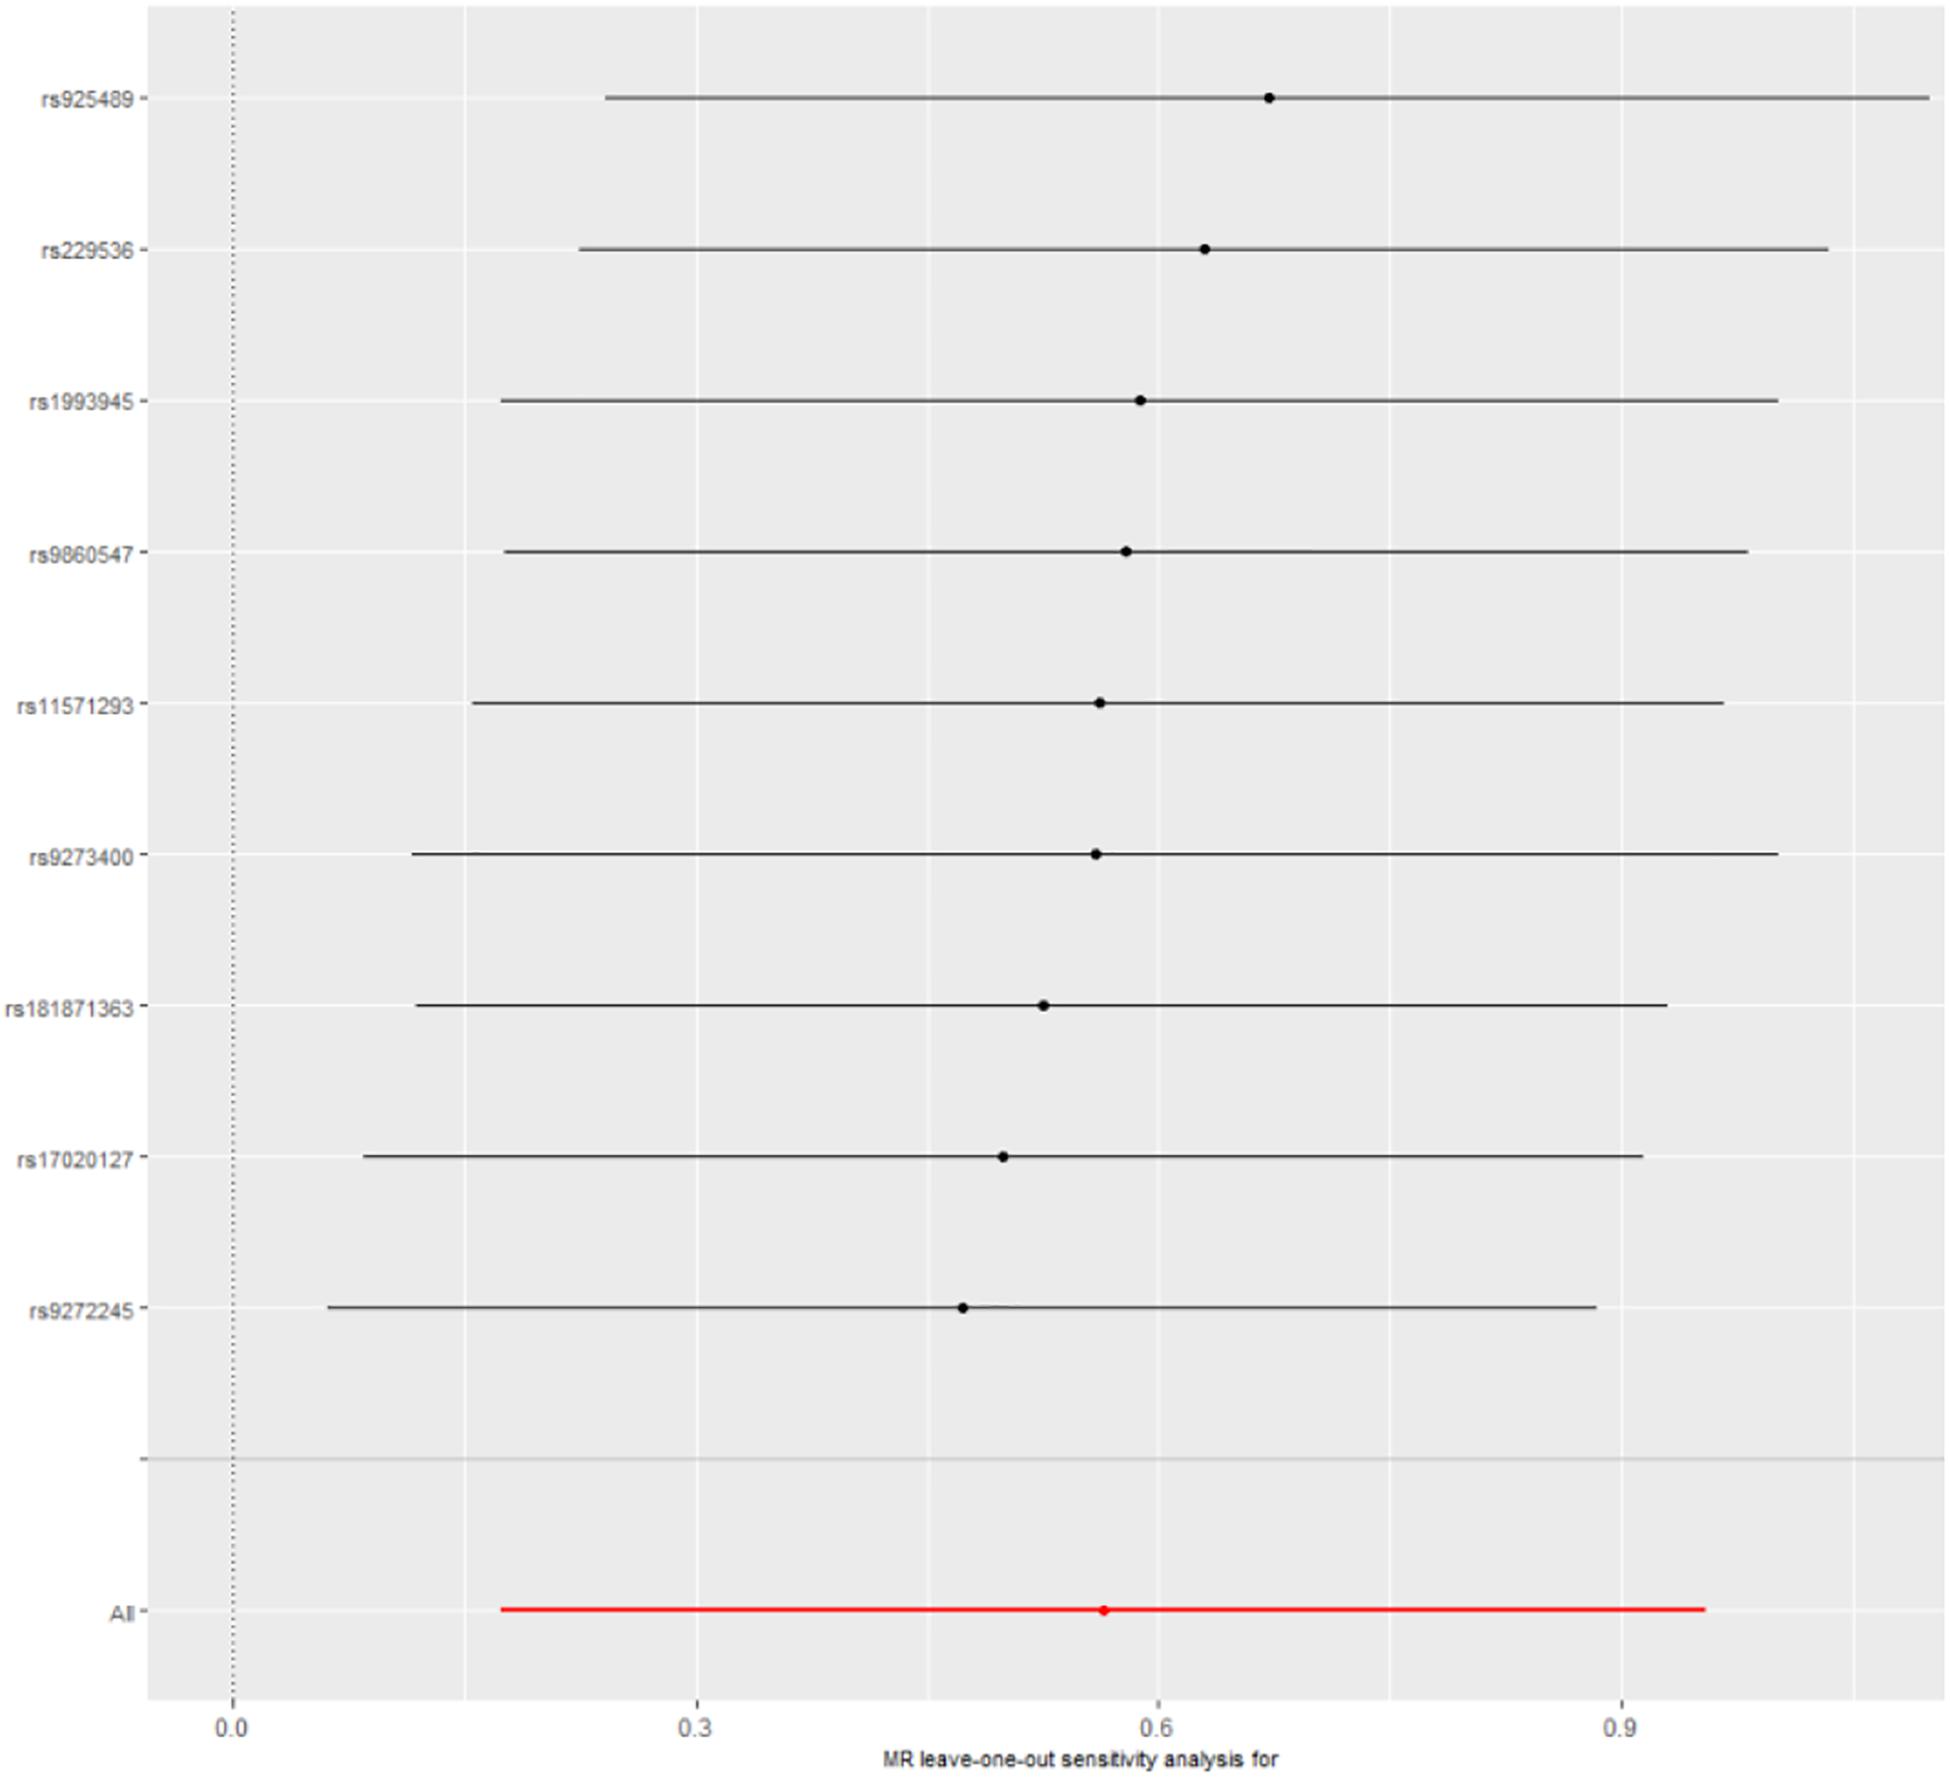
Figure 2. Leave-one-out cross-validation. The red line is the average of all β values after leave-one-out.
Pluripotency Analysis
Five methods were used to evaluate the results of MR analysis, and the scatter plot was generated (Figure 3). Among them, MR-Egger was used to measure the pleiotropy of IVs. There was no statistical difference between the intercept of MR-Egger and the zero intercept of IVW (P > 0.05). Moreover, the symmetry of the funnel plot might be another evidence for the absence of horizontal pleiotropy (Supplementary Figure 1; Sterne et al., 2011).
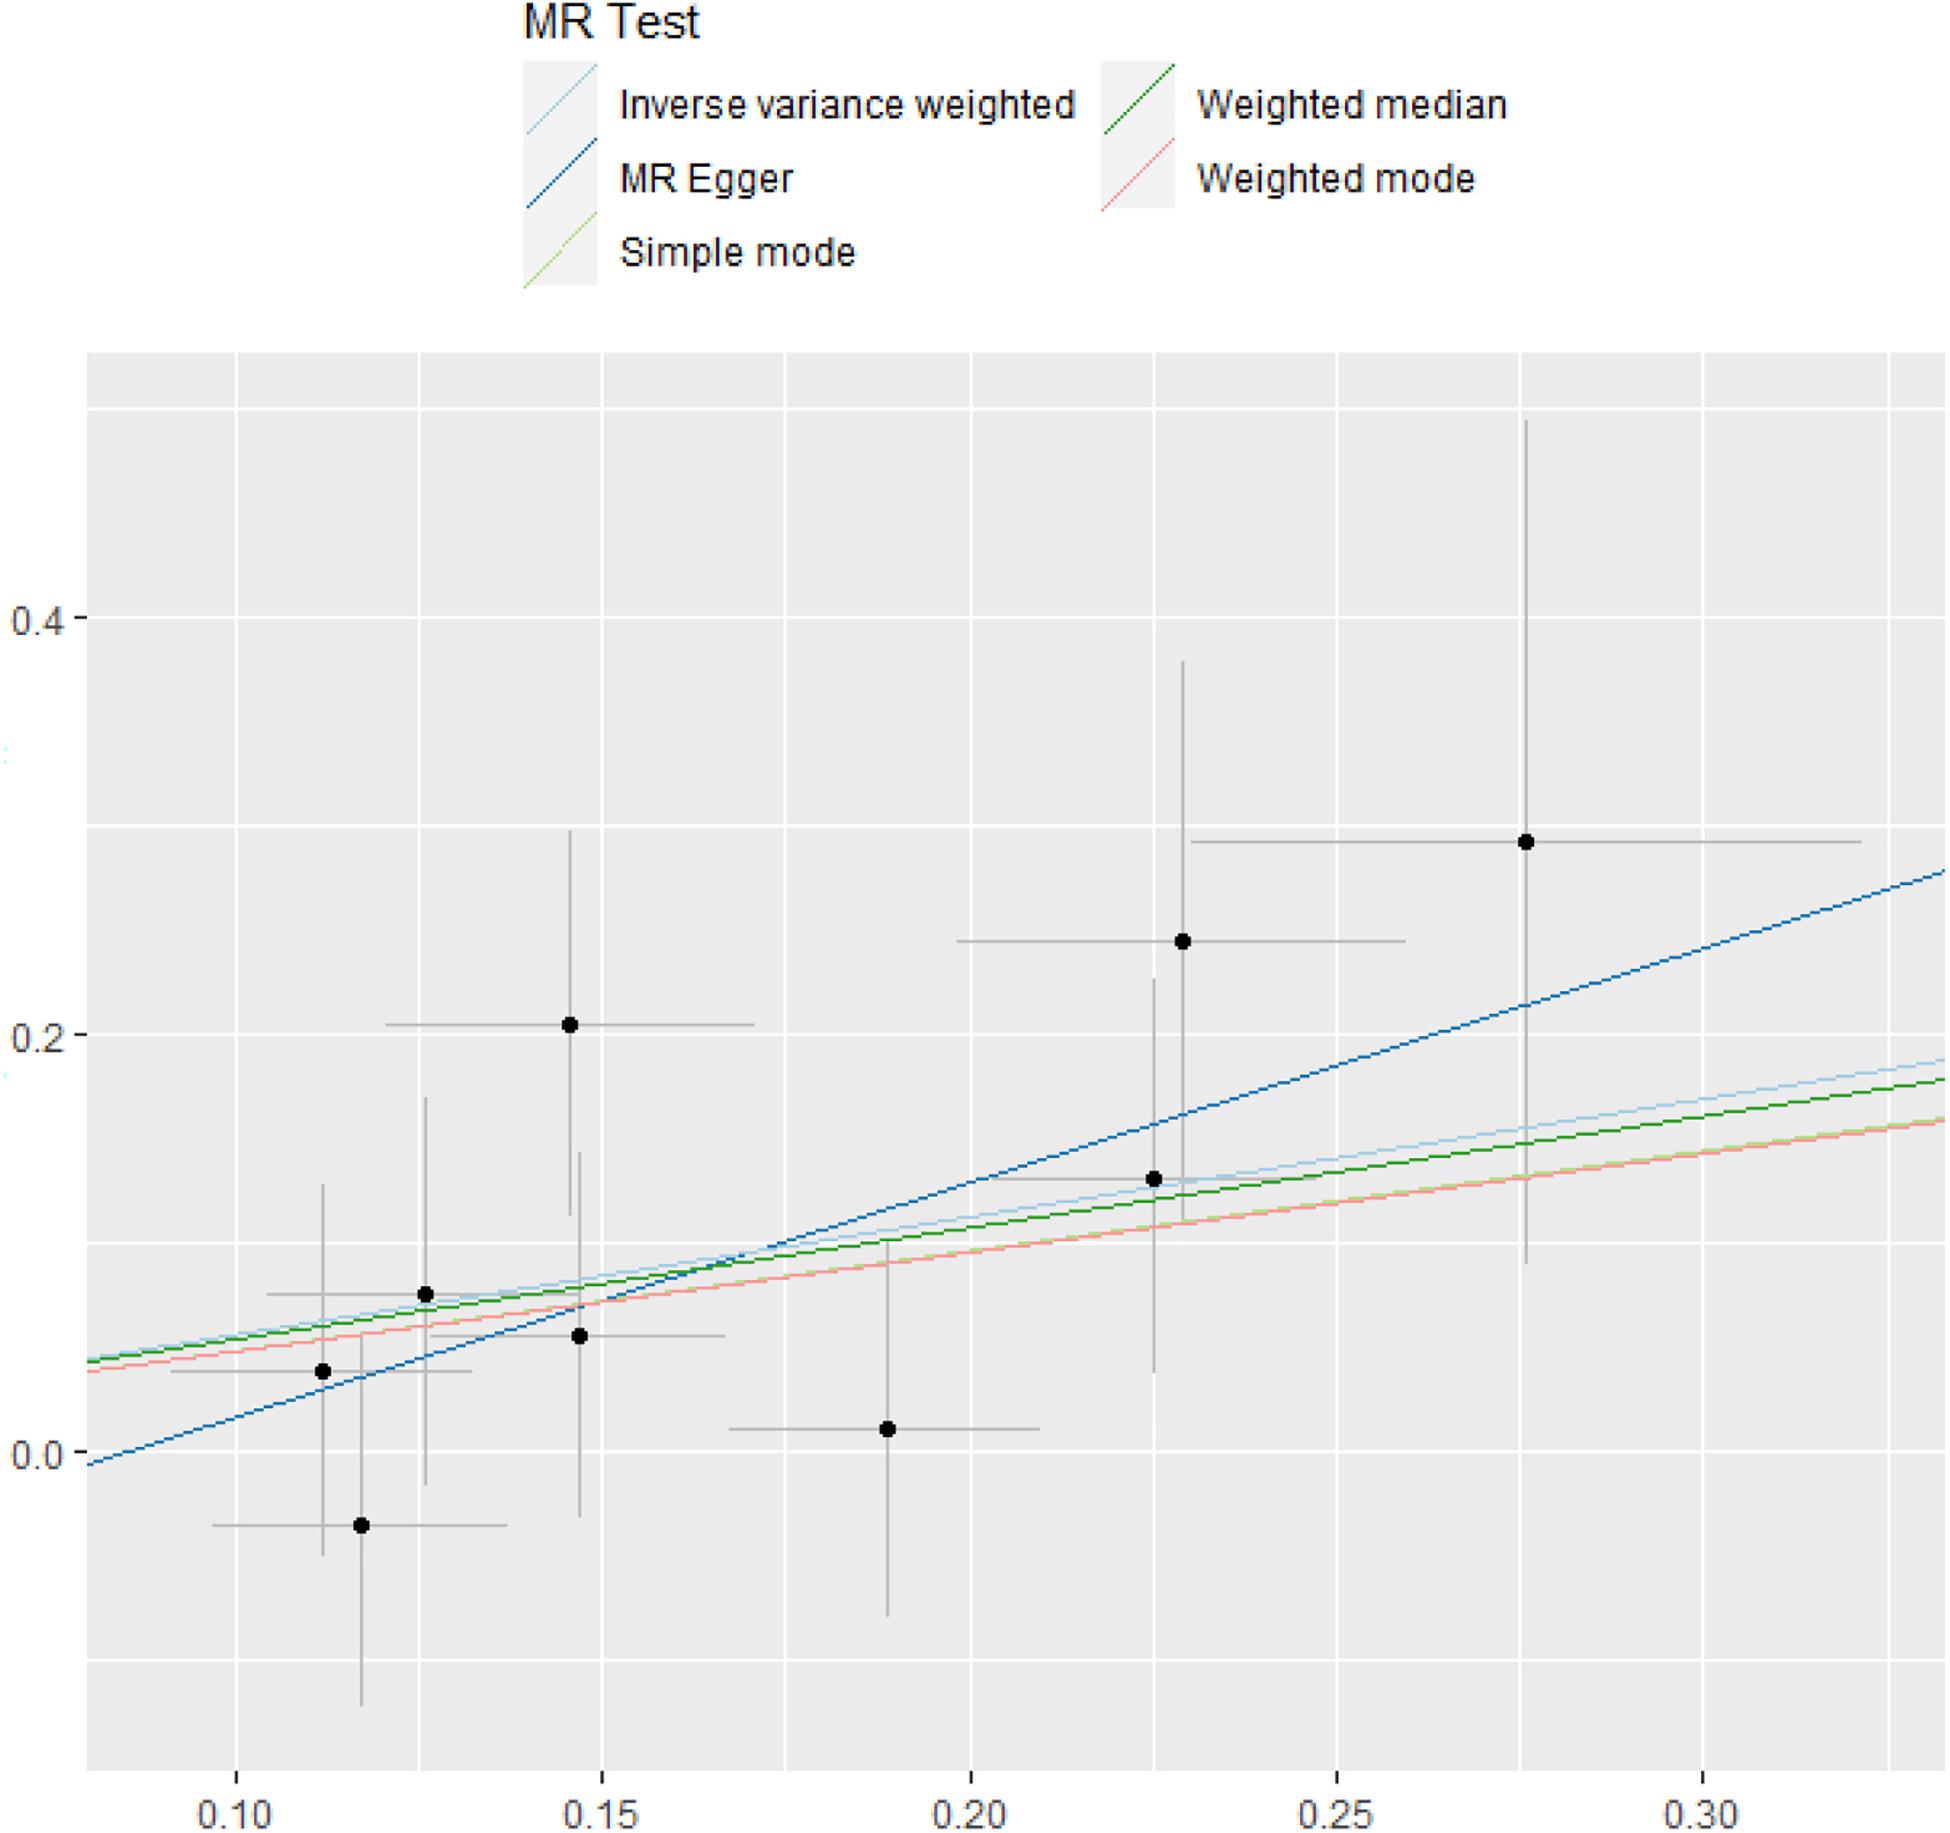
Figure 3. MR test. The estimate of intercept can be interpreted as an estimate of the average pleiotropy of all SNPs, and the slope coefficient provides an estimate of the bias of the causal effect. MR, Mendelian randomization; SNP, single-nucleotide polymorphism.
Discussion
In this study, we used two-sample MR to evaluate the association between hypothyroidism and NAFLD. The high OR (1.7578; 95%CI 1.1897–2.5970; P = 0.0046) obtained by IVW method provided a strong evidence that hypothyroidism was associated with an increased risk of NAFLD. Therefore, we speculate that hypothyroidism may induce NAFLD through some metabolic pathway, although the related pathogenesis is still unclear.
In previous studies, the association between hypothyroidism and NAFLD has been researched from various perspectives, both clinically (Chung et al., 2012; Pagadala et al., 2012; Lee et al., 2015; Ludwig et al., 2015; Mantovani et al., 2018; Hu et al., 2019, 2020, 2021) and biologically (Ferrandino et al., 2017; Gionfra et al., 2019; Lonardo et al., 2019). The causality, however, is still unexplored (Efstathiadou et al., 2018). Unlike alcoholic fatty liver disease, NAFLD is often caused by disorder of glucose and lipid metabolism. Hypothyroidism patients have inadequate TH secretion, which is precisely related to the secretion of insulin in adipose tissue and the stimulation of lipolysis by adrenal gland (Pagadala et al., 2012; Ferrandino et al., 2017). If the TH levels in serum are slightly reduced, insulin secretion will be impaired, resulting in reduced lipolysis inhibition (Mullur et al., 2014). Fatty acid traveling to the liver is increased, which induces NAFLD. Interestingly, extremely low TH level may inhibit the development of NAFLD (Ferrandino et al., 2017). Although the pathogenesis of NAFLD is complex, we can still prevent it by avoiding high-sugar and high-fat diet and toning up with more exercise.
Our study benefits from both the GWAS data and MR method. It is noteworthy that the existence of horizontal pleiotropy is a key factor in rejecting the IV assumptions of the MR model (Hemani et al., 2018a). Horizontal pleiotropy means that genetic variants have multiple independent ways to affect outcome (Davies et al., 2018; Hemani et al., 2018a; Wootton et al., 2018). In our study, the low intercept and high P-value (-0.095; P = 0.431) of MR-Egger seemed to demonstrate that there was no horizontal pleiotropy affecting the results of MR analysis. But we found that the funnel plot generated by MR-Egger was not symmetrical enough. Horizontal pleiotropy might exist because of factors beyond our control, such as population stratification (Persyn et al., 2018) and canalization (Geiler-Samerotte et al., 2019; Hallgrimsson et al., 2019). Meanwhile, due to the lack of relevant data, confounders associated with NAFLD were not explored. Other genetic variants that might be significantly associated with NAFLD should have removed, such as endocrine and metabolic factors (diabetes, hyperlipidemia, etc.).
To the best of our knowledge, our study is the first to reveal the causality between hypothyroidism and NAFLD, which improves the pathogenic factors and patterns of NAFLD. Besides, it helps researchers to understand the relationship between various diseases better from the perspective of system biology (Vidal et al., 2011; Cheng and Hu, 2018; Starchenko and Lauffenburger, 2018).
Data Availability Statement
The original contributions presented in the study are included in the article/Supplementary Material, further inquiries can be directed to the corresponding author/s.
Author Contributions
SQ wrote the manuscript and did the experiments. PC provided ideas of this work. YG and HL revised this manuscript and guided how to do experiments. YH supervised this work. All authors contributed to the article and approved the submitted version.
Funding
This work was supported by the National Key R&D Program of China (2017YFC1201201, 2018YFC0910504, and 2017YFC0907503), Heilongjiang Postdoctoral Science Foundation (LBH-Z6064) and the Natural Science Foundation of China (61801147 and 82003553), all to YH.
Conflict of Interest
The authors declare that the research was conducted in the absence of any commercial or financial relationships that could be construed as a potential conflict of interest.
Supplementary Material
The Supplementary Material for this article can be found online at: https://www.frontiersin.org/articles/10.3389/fcell.2021.643582/full#supplementary-material
References
Anstee, Q. M., Darlay, R., Cockell, S., Meroni, M., Govaere, O., Tiniakos, D., et al. (2020). Genome-wide association study of non-alcoholic fatty liver and steatohepatitis in a histologically characterised cohort(). J. Hepatol. 73, 505–515. doi: 10.1016/j.jhep.2020.04.003
Bowden, J., Davey Smith, G., and Burgess, S. (2015). Mendelian randomization with invalid instruments: effect estimation and bias detection through Egger regression. Int. J. Epidemiol. 44, 512–525. doi: 10.1093/ije/dyv080
Bowden, J., Davey Smith, G., Haycock, P. C., and Burgess, S. (2016a). Consistent estimation in Mendelian randomization with some invalid instruments using a weighted median estimator. Genet. Epidemiol. 40, 304–314. doi: 10.1002/gepi.21965
Bowden, J., Del Greco, M. F., Minelli, C., Davey Smith, G., Sheehan, N., and Thompson, J. (2017). A framework for the investigation of pleiotropy in two-sample summary data Mendelian randomization. Stat. Med. 36, 1783–1802. doi: 10.1002/sim.7221
Bowden, J., Del Greco, M. F., Minelli, C., Smith, G. D., Sheehan, N. A., and Thompson, J. R. (2016b). Assessing the suitability of summary data for two-sample Mendelian randomization analyses using MR-Egger regression: the role of the I-2 statistic. Int. J. Epidemiol. 45, 1961–1974.
Burgess, S., and Thompson, S. G. (2017). Interpreting findings from Mendelian randomization using the MR-Egger method. Eur. J. Epidemiol. 32, 377–389. doi: 10.1007/s10654-017-0255-x
Byrne, C. D., Patel, J., Scorletti, E., and Targher, G. (2018). Tests for diagnosing and monitoring non-alcoholic fatty liver disease in adults. BMJ 362:k2734. doi: 10.1136/bmj.k2734
Byrne, C. D., and Targher, G. (2015). NAFLD: a multisystem disease. J. Hepatol. 62(1Suppl.) S47–S64.
Chalasani, N., Younossi, Z., Lavine, J. E., Charlton, M., Cusi, K., Rinella, M., et al. (2018). The diagnosis and management of nonalcoholic fatty liver disease: practice guidance from the American Association for the Study of liver diseases. Hepatology 67, 328–357. doi: 10.1002/hep.29367
Cheng, L., and Hu, Y. (2018). Human disease system biology. Curr. Gene Ther. 18, 255–256. doi: 10.2174/1566523218666181010101114
Cheng, L., Zhuang, H., Ju, H., Yang, S., Han, J., Tan, R., et al. (2019). Exposing the causal effect of body mass index on the risk of type 2 diabetes mellitus: a Mendelian randomization study. Front. Genet. 10:94. doi: 10.3389/fgene.2019.00094
Chung, G. E., Kim, D., Kim, W., Yim, J. Y., Park, M. J., Kim, Y. J., et al. (2012). Non-alcoholic fatty liver disease across the spectrum of hypothyroidism. J. Hepatol. 57, 150–156.
Collins, A. (2009). Allelic association: linkage disequilibrium structure and gene mapping. Mol. Biotechnol. 41, 83–89. doi: 10.1007/s12033-008-9110-3
Cui, Z. Y., Hou, G. J., Meng, X. Y., Feng, H., He, B. C., and Tian, Y. (2020). Bidirectional causal associations between inflammatory bowel disease and ankylosing spondylitis: a two-sample Mendelian randomization analysis. Front. Genet. 11:587876. doi: 10.3389/fgene.2020.587876
Davies, N. M., Holmes, M. V., and Davey Smith, G. (2018). Reading Mendelian randomisation studies: a guide, glossary, and checklist for clinicians. BMJ 362:k601. doi: 10.1136/bmj.k601
Efstathiadou, Z. A., Kita, M. D., and Polyzos, S. A. (2018). Thyroid dysfunction and non-alcoholic fatty liver disease. Minerva Endocrinol. 43, 367–376.
Fan, J. G., Jia, J. D., Li, Y. M., Wang, B. Y., Lu, L. G., Shi, J. P., et al. (2011). Guidelines for the diagnosis and management of nonalcoholic fatty liver disease: update 2010: (published in Chinese on Chinese Journal of Hepatology 2010; 18:163-166). J. Dig. Dis. 12, 38–44. doi: 10.1111/j.1751-2980.2010.00476.x
Ferrandino, G., Kaspari, R. R., Spadaro, O., Reyna-Neyra, A., Perry, R. J., Cardone, R., et al. (2017). Pathogenesis of hypothyroidism-induced NAFLD is driven by intra- and extrahepatic mechanisms. Proc. Natl. Acad. Sci. U.S.A. 114, E9172–E9180.
Geiler-Samerotte, K., Sartori, F. M. O., and Siegal, M. L. (2019). Decanalizing thinking on genetic canalization. Semin. Cell Dev. Biol. 88, 54–66. doi: 10.1016/j.semcdb.2018.05.008
Gionfra, F., De Vito, P., Pallottini, V., Lin, H. Y., Davis, P. J., Pedersen, J. Z., et al. (2019). The role of thyroid hormones in hepatocyte proliferation and liver cancer. Front. Endocrinol. 10:532. doi: 10.3389/fendo.2019.00532
Guo, Z. Q., Li, M. M., Han, B., and Qi, X. S. (2018). Association of non-alcoholic fatty liver disease with thyroid function: a systematic review and meta-analysis. Dig. Liver Dis. 50, 1153–1162. doi: 10.1016/j.dld.2018.08.012
Hallgrimsson, B., Green, R. M., Katz, D. C., Fish, J. L., Bernier, F. P., Roseman, C. C., et al. (2019). The developmental-genetics of canalization. Semin. Cell Dev. Biol. 88, 67–79.
Hemani, G., Bowden, J., and Davey Smith, G. (2018a). Evaluating the potential role of pleiotropy in Mendelian randomization studies. Hum. Mol. Genet. 27, R195–R208.
Hemani, G., Zheng, J., Elsworth, B., Wade, K. H., Haberland, V., Baird, D., et al. (2018b). The MR-base platform supports systematic causal inference across the human phenome. Elife 7:e3440.
Hu, Y., Sun, J. Y., Zhang, Y., Zhang, H., Gao, S., Wang, T., et al. (2021). rs1990622 variant associates with Alzheimer’s disease and regulates TMEM106B expression in human brain tissues. BMC Med. 19:11. doi: 10.1186/s12916-020-01883-5
Hu, Y., Zhang, H., Liu, B., Gao, S., Wang, T., Han, Z., et al. (2020). rs34331204 regulates TSPAN13 expression and contributes to Alzheimer’s disease with sex differences. Brain 143:e95. doi: 10.1093/brain/awaa302
Hu, Y., Zhao, T., Zhang, N., Zhang, Y., and Cheng, L. (2019). A review of recent advances and research on drug target identification methods. Curr. Drug. Metab. 20, 209–216. doi: 10.2174/1389200219666180925091851
Lee, K. W., Bang, K. B., Rhee, E. J., Kwon, H. J., Lee, M. Y., and Cho, Y. K. (2015). Impact of hypothyroidism on the development of non-alcoholic fatty liver disease: a 4-year retrospective cohort study. Clin. Mol. Hepatol. 21, 372–378. doi: 10.3350/cmh.2015.21.4.372
Lonardo, A., Ballestri, S., Mantovani, A., Nascimbeni, F., Lugari, S., and Targher, G. (2019). Pathogenesis of hypothyroidism-induced NAFLD: evidence for a distinct disease entity? Dig. Liver Dis. 51, 462–470. doi: 10.1016/j.dld.2018.12.014
Ludwig, U., Holzner, D., Denzer, C., Greinert, A., Haenle, M. M., Oeztuerk, S., et al. (2015). Subclinical and clinical hypothyroidism and non-alcoholic fatty liver disease: a cross-sectional study of a random population sample aged 18 to 65 years. BMC Endocr. Disord. 15:41. doi: 10.1186/s12902-015-0030-5
Mantovani, A., Nascimbeni, F., Lonardo, A., Zoppini, G., Bonora, E., Mantzoros, C. S., et al. (2018). Association between primary hypothyroidism and nonalcoholic fatty liver disease: a systematic review and meta-analysis. Thyroid 28, 1270–1284. doi: 10.1089/thy.2018.0257
Mullur, R., Liu, Y. Y., and Brent, G. A. (2014). Thyroid hormone regulation of metabolism. Physiol. Rev. 94, 355–382.
Non-alcoholic Fatty Liver Disease Study, G., Lonardo, A., Bellentani, S., Argo, C. K., Ballestri, S., Byrne, C. D., et al. (2015). Epidemiological modifiers of non-alcoholic fatty liver disease: focus on high-risk groups. Dig. Liver Dis. 47, 997–1006. doi: 10.1016/j.dld.2015.08.004
Pagadala, M. R., Zein, C. O., Dasarathy, S., Yerian, L. M., Lopez, R., and McCullough, A. J. (2012). Prevalence of hypothyroidism in nonalcoholic fatty liver disease. Dig. Dis. Sci. 57, 528–534.
Persyn, E., Redon, R., Bellanger, L., and Dina, C. (2018). The impact of a fine-scale population stratification on rare variant association test results. PLoS One 13:e0207677. doi: 10.1371/journal.pone.0207677
Rinella, M. E. (2015). Nonalcoholic fatty liver disease: a systematic review. JAMA 313, 2263–2273. doi: 10.1001/jama.2015.5370
Sinha, R. A., Singh, B. K., and Yen, P. M. (2018). Direct effects of thyroid hormones on hepatic lipid metabolism. Nat. Rev. Endocrinol. 14, 259–269. doi: 10.1038/nrendo.2018.10
Starchenko, A., and Lauffenburger, D. A. (2018). In vivo systems biology approaches to chronic immune/inflammatory pathophysiology. Curr. Opin. Biotechnol. 52, 9–16. doi: 10.1016/j.copbio.2018.02.006
Sterne, J. A., Sutton, A. J., Ioannidis, J. P., Terrin, N., Jones, D. R., Lau, J., et al. (2011). Recommendations for examining and interpreting funnel plot asymmetry in meta-analyses of randomised controlled trials. BMJ 343:d4002. doi: 10.1136/bmj.d4002
Vidal, M., Cusick, M. E., and Barabasi, A. L. (2011). Interactome networks and human disease. Cell 144, 986–998. doi: 10.1016/j.cell.2011.02.016
Wootton, R. E., Lawn, R. B., Millard, L. A. C., Davies, N. M., Taylor, A. E., Munafo, M. R., et al. (2018). Evaluation of the causal effects between subjective wellbeing and cardiometabolic health: mendelian randomisation study. BMJ Br. Med. J. 362:k3788. doi: 10.1136/bmj.k3788
Yavorska, O. O., and Burgess, S. (2017). Mendelian randomization: an R package for performing Mendelian randomization analyses using summarized data. Int. J. Epidemiol. 46, 1734–1739. doi: 10.1093/ije/dyx034
Keywords: Mendelian randomization, hypothyroidism, NAFLD, causality, GWAS, SNPs
Citation: Qiu S, Cao P, Guo Y, Lu H and Hu Y (2021) Exploring the Causality Between Hypothyroidism and Non-alcoholic Fatty Liver: A Mendelian Randomization Study. Front. Cell Dev. Biol. 9:643582. doi: 10.3389/fcell.2021.643582
Received: 18 December 2020; Accepted: 09 February 2021;
Published: 15 March 2021.
Edited by:
Lei Deng, Central South University, ChinaReviewed by:
Balachandran Manavalan, Ajou University, South KoreaFei Guo, Tianjin University, China
Copyright © 2021 Qiu, Cao, Guo, Lu and Hu. This is an open-access article distributed under the terms of the Creative Commons Attribution License (CC BY). The use, distribution or reproduction in other forums is permitted, provided the original author(s) and the copyright owner(s) are credited and that the original publication in this journal is cited, in accordance with accepted academic practice. No use, distribution or reproduction is permitted which does not comply with these terms.
*Correspondence: Yang Hu, aHV5YW5nQGhpdC5lZHUuY24=
†These authors have contributed equally to this work