 Feng Wang1
 Shenglei Li
- 1Department of Oncology, The First Affiliated Hospital of Zhengzhou University, Zhengzhou, China
- 2Department of Pathology, The First Affiliated Hospital, Zhengzhou University, Zhengzhou, China
Background: Esophageal cancer (EC) is one of the deadliest cancers in the world. However, the mechanism that drives the evolution of EC is still unclear. On this basis, we identified the key genes and molecular pathways that may be related to the progression of esophageal adenocarcinoma and squamous cell carcinoma to find potential markers or therapeutic targets.
Methods: GSE26886 were obtained from Gene Expression Omnibus (GEO) database. The differentially expressed genes (DEGs) among normal samples, EA, and squamous cell carcinoma were determined using R software. Then, potential functions of DEGs were determined using the Database for Annotation, Visualization and Integrated Discovery (DAVID). The STRING software was used to identify the most important modules in the protein–protein interaction (PPI) network. The expression levels of hub genes were confirmed using UALCAN database. Kaplan–Meier plotters were used to confirm the correlation between hub genes and outcomes in EC.
Results: In this study, we identified 1,098 genes induced in esophageal adenocarcinoma (EA) and esophageal squamous cell carcinoma (ESCC), and 669 genes were reduced in EA and ESCC, suggesting that these genes may play an important role in the occurrence and development of EC tumors. Bioinformatics analysis showed that these genes were involved in cell cycle regulation and p53 and phosphoinositide 3-kinase (PI3K)/Akt signaling pathway. In addition, we identified 147 induced genes and 130 reduced genes differentially expressed in EA and ESCC. The expression of ESCC in the EA group was different from that in the control group. By PPI network analysis, we identified 10 hub genes, including GNAQ, RGS5, MAPK1, ATP1B1, HADHA, HSDL2, SLC25A20, ACOX1, SCP2, and NLN. TCGA validation showed that these genes were present in the dysfunctional samples between EC and normal samples and between EA and ESCC. Kaplan–Meier analysis showed that MAPK1, ACOX1, SCP2, and NLN were associated with overall survival in patients with ESCC and EA.
Conclusions: In this study, we identified a series of DEGs between EC and normal samples and between EA and ESCC samples. We also identified 10 key genes involved in the EC process. We believe that this study may provide a new biomarker for the prognosis of EA and ESCC.
Introduction
According to the cancer statistics in 2018, the mortality rate of esophageal cancer ranks sixth among all tumors all over the world (Bray et al., 2018; Gu et al., 2020b). Esophageal carcinoma (EC) is divided into esophageal adenocarcinoma (EA) and esophageal squamous cell carcinoma (ESCC) (Then et al., 2020). ESCC mostly occurs in the upper and middle portions of the esophagus and related to alcohol and nicotine abuse (Then et al., 2020). ESCC is particularly prominent in China, accounting for about 88% of EC (Wang et al., 2014). Esophageal adenocarcinoma is a highly invasive histological subtype, which is dominant in western countries (Abbas and Krasna, 2017). EA occurs in the lower portion of the esophagus and arises as a consequence of persistent gastroesophageal reflux from areas with specialized intestinal metaplasia in Barrett’s esophagus (Gindea et al., 2014), The 5-year survival rate is as low as 20% (Abbas and Krasna, 2017). At present, the treatment methods of the two EC are similar, including chemotherapy, radiotherapy, and surgery, in which surgery is the most common treatment (Kelsen et al., 1998). Identifying biomarkers for EC development, progression, and prognosis is essential for understanding EC and improving clinical decision-making.
In the past few decades, a large number of studies have revealed the potential mechanism of regulating EC progression. For example, N-myc-downregulated gene 4 (NDRG4) plays a role in cancer suppression of EA (Cao et al., 2020). Inhibition of DCLK1 can reduce the incidence of EC and improve its chemosensitivity by inhibiting β-catenin/c-myc signal (Whorton et al., 2015; Zhang et al., 2020). Notch signal pathway mediates Barrett’s esophageal differentiation and promotes its development to adenocarcinoma (Kunze et al., 2020). Abnormal WNT5A/ROR2 signaling pathway is a characteristic of Barrett-related EA (Lyros et al., 2016). At the same time, multiple bioinformatics analysis of EC was carried out based on RNA sequences and microarray datasets (Zhang H. et al., 2019). For example, a total of 345 DEGs were identified by Zhang H. et al. (2019) in normal esophageal and ESCC samples, including Kyoto Encyclopedia of Genes and Genomes (KEGG) pathway of endocytosis, pancreatic secretion, and fatty acids. However, the regulatory mechanism in EC is still not clear.
In this study, we downloaded GSE26886 (Wang et al., 2013) from the Gene Expression Omnibus (GEO) database. DEGs among esophageal squamous epithelium, Barrett’s esophagus, EA, and ESCC were analyzed. Then, the KEGG pathway and protein–protein interaction (PPI) network of DEG are analyzed. Finally, the survival rate of the identified core gene was verified and analyzed. The core gene may be a novel biomarker and therapeutic target for esophageal cancer.
Materials and Methods
GEO Gene Expression Data
In this study, we aimed to identify differently expressed specific biomarkers to distinguished EA from ESCC. By screening GEO datasets, only GSE26886 include four types of EC-related samples, including healthy controls, Barrett’s esophagus, EA, and ESCC, thus selected for further analysis. GSE26886 (Wang et al., 2013) were obtained from the GEO database. A total of 69 frozen specimens were collected, including 19 healthy controls, 20 Barrett’s esophagus, 21 EA, and 9 ESCC.
Data Processing and DEGs Filtering
The Database for Annotation, Visualization, and Integrated Discovery (DAVID) 6.8 (Huang da et al., 2009) was used to analyze the GO function of integrating DEG and KEGG paths (Shi et al., 2018b; Gu et al., 2020d, 2021). GO term and KEGG pathways with P < 0.05 were selected as enrichment functions (Gu et al., 2020c).
PPI Network Analysis
Protein–protein interaction network is an online tool for building data from STRINGS1. The platform reveals protein interaction and functional analysis (Shi et al., 2018a; Shi X. et al., 2020). The most important modules in the PPI network were identified by insertion molecular complex detection (MCODE) with criteria (Shannon et al., 2003): degree value = 2, node score value = 0.2, and K score = 2. Then, the GO function and KEGG pathway of genes in these modules were using DAVID, with statistical significance (P < 0.05).
Validation of Hub Genes in EC
UALCAN2 data were analyzed to compare the expression of hub gene in esophageal squamous epithelium, Barrett’s esophagus, EA, and ESCC (Chandrashekar et al., 2017). Gene expression profile interaction analysis (GEPIA) (Tang et al., 2017; Gu et al., 2020a) was used to analyze the overall survival curve of each key gene, where P < 0.05 was considered to be statistically significant.
Results
Identification of DEGs
GSE26886 datasets were used to compare the gene expression among different types of EC. First, 2,667 genes were identified to be induced, and 2,106 genes were identified to be reduced in ESCC compared to esophageal squamous epithelium samples (Figures 1A,C). Meanwhile, 2,532 genes were identified to be induced, and 1,468 genes were identified to be reduced in EA compared to Barrett’s esophagus samples (Figures 1B,D). Finally, we revealed 1,098 common induced genes in both EA and ESCC (Figure 1E) and 669 common reduced genes in both EA and ESCC compared to normal samples (Figure 1F), suggesting that these genes may have a crucial role in the tumorigenesis and progression of both EA and ESCC. Of note, we also found that 1,669 ESCC-specific upregulated, 1,434 EA-specific upregulated, 1,437 ESCC-specific downregulated, and 799 EA-specific downregulated genes, further confirming that that there are significant differences in the pathogenesis between EA and ESCC (Figures 1E,F).
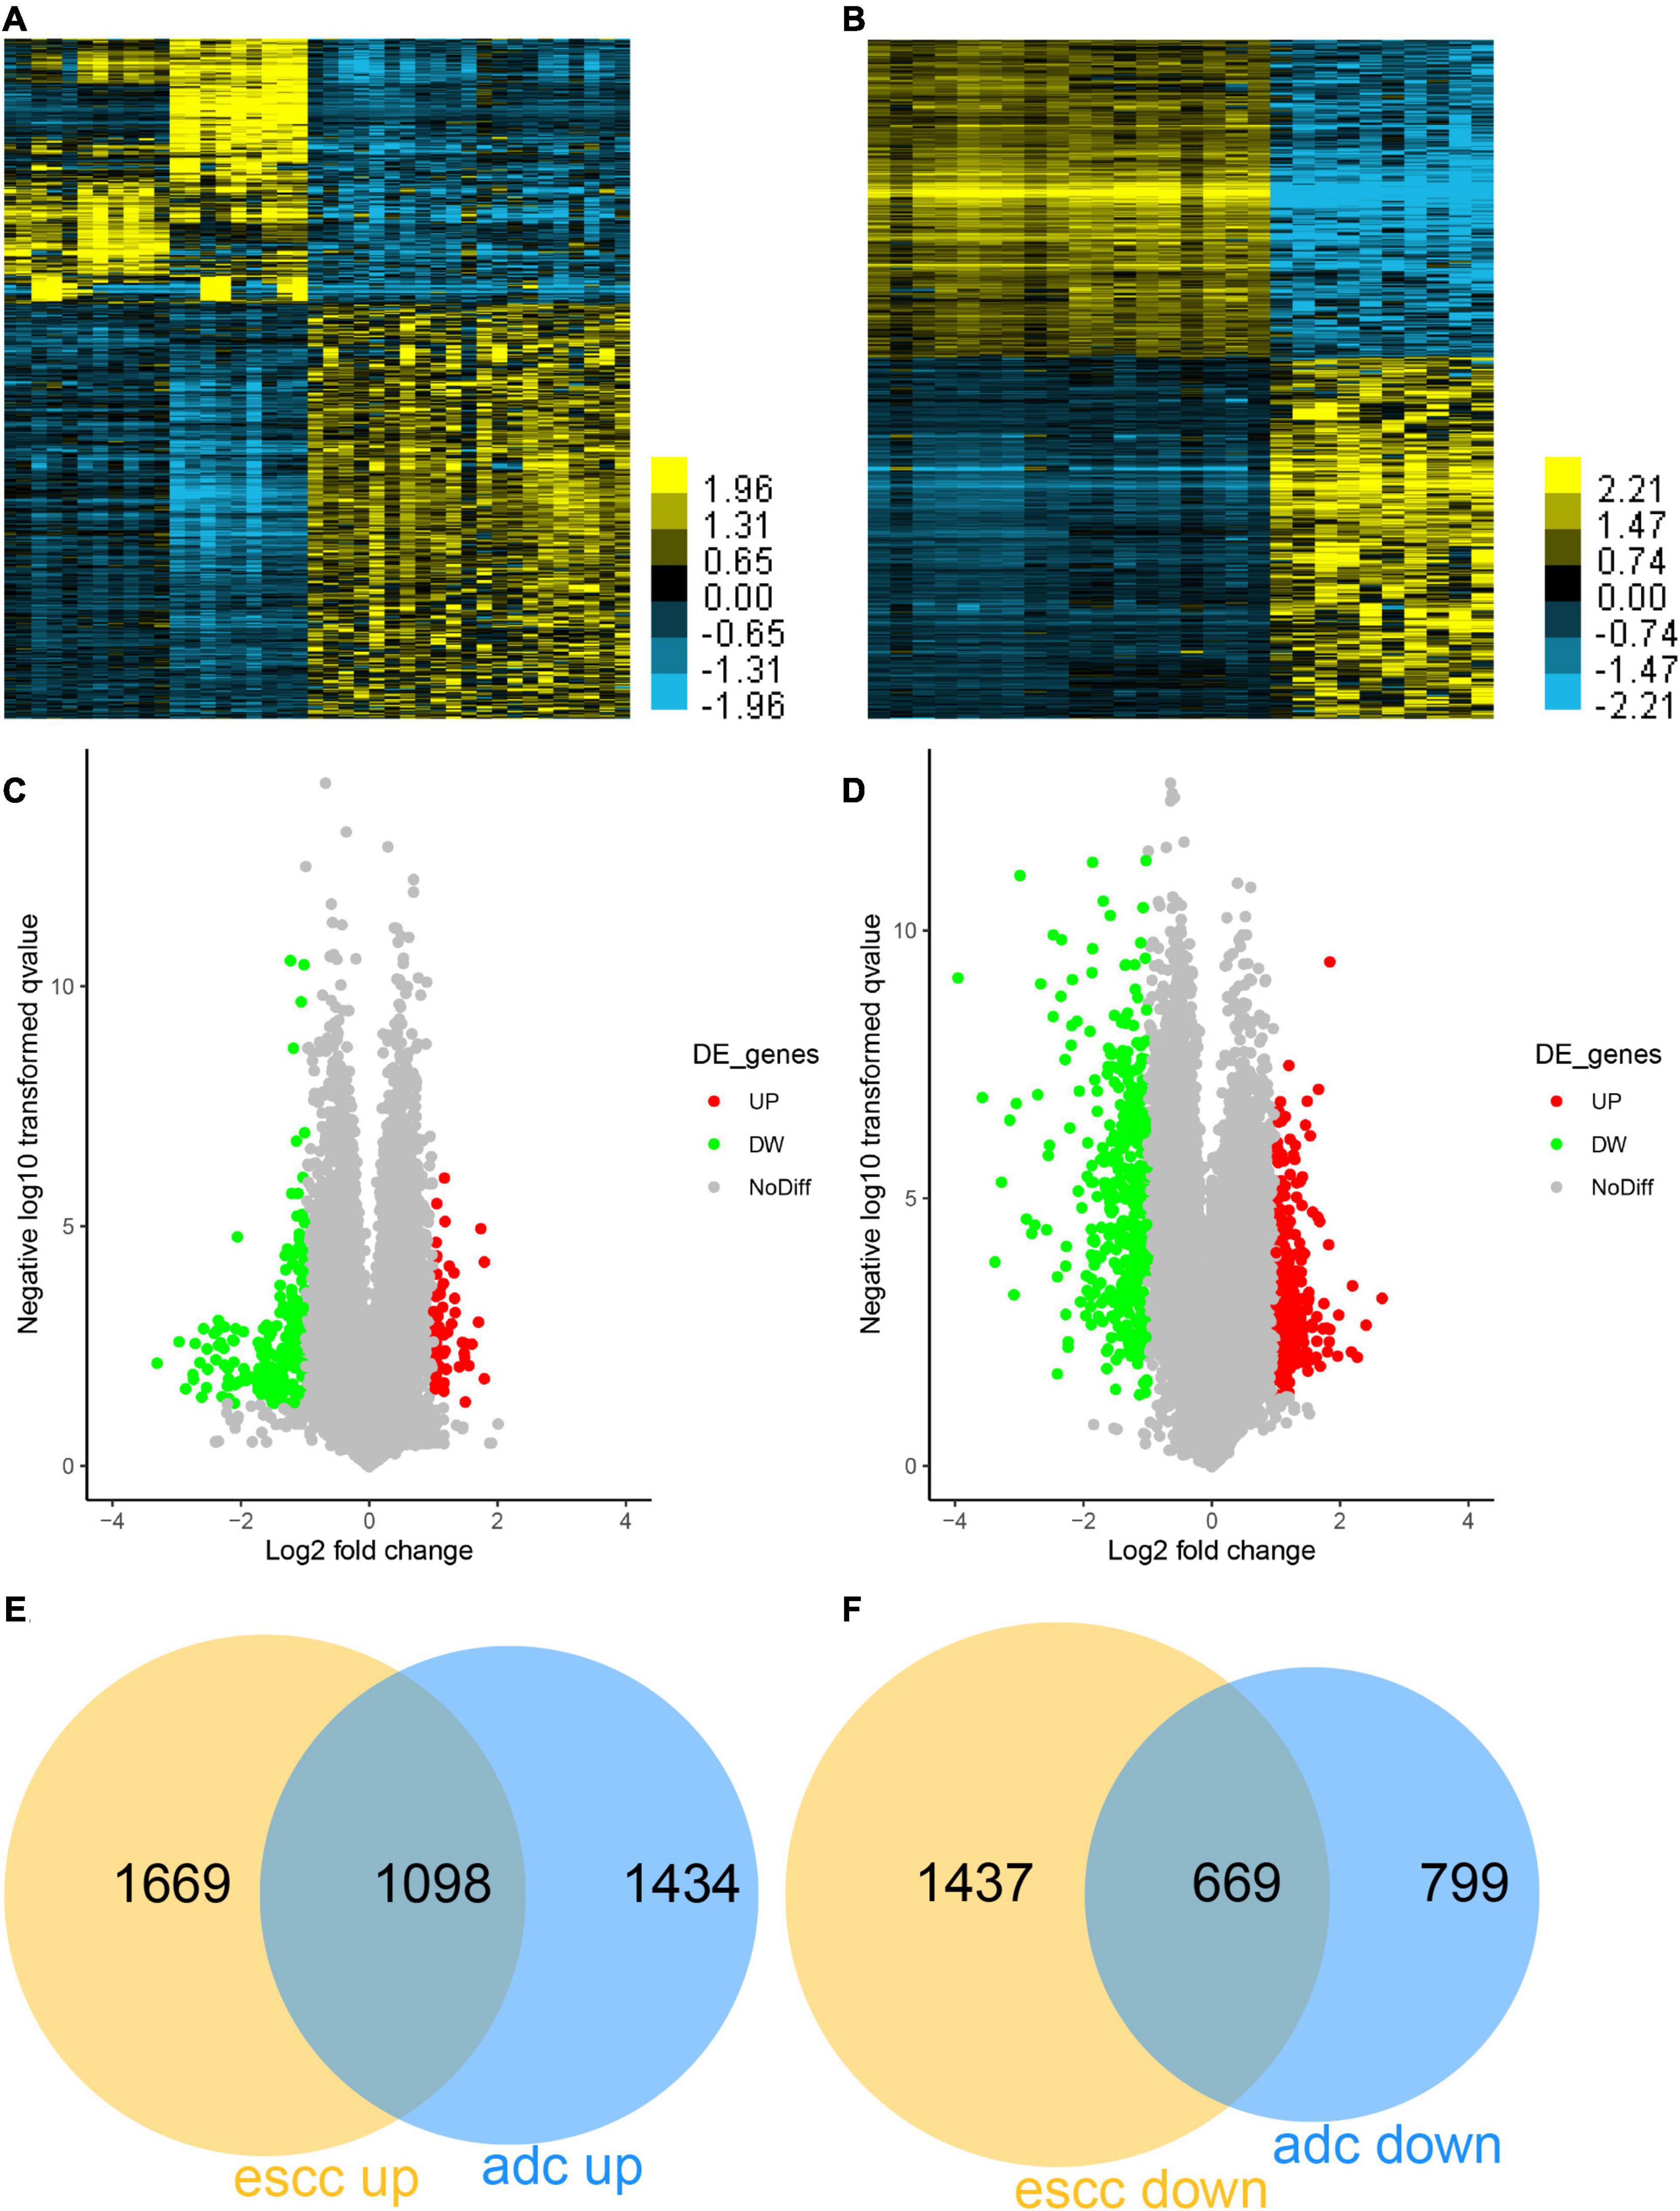
Figure 1. Identification of differentially expressed genes (DEGs) in esophageal adenocarcinoma (EA) and esophageal squamous cell carcinoma (ESCC). (A) The differently expressed genes between EA and Barrett’s esophagus samples were shown using Heatmap. (B) The differently expressed genes between ESCC and esophageal squamous epithelium samples were shown using Heatmap. (C) The differently expressed genes between EA and Barrett’s esophagus samples were shown using Volcano Plot. (D) The differently expressed genes between ESCC and esophageal squamous epithelium samples were shown using Volcano Plot. (E) The common upregulated genes in both EA and ESCC were determined using Venn diagram. (F) The common downregulated genes in both EA and ESCC were determined using Venn diagram.
Bioinformatics Analyses of Common DEGs in EA and ESCC
Database for Annotation, Visualization and Integrated Discovery was used for bioinformatics analysis. GO functions analysis results showed that the common induced gene was related to mitotic chromosome condensation, spindle organization, chromosome segregation, negative regulation of cell migration, RNA processing, sister chromatid cohesion, protein SUMOylation, transcription, DNA replication, extracellular matrix organization, cellular response to DNA damage stimulus, and cell division (Figure 2A). The common reduced gene was related to flavone metabolic process, flavonoid biosynthetic process, negative regulation of cellular glucuronidation and fatty acid metabolic process, flavonoid glucuronidation, serine/threonine kinase activity, substantia nigra development, protein stabilization, vesicle-mediated transport, and cell–cell adhesion (Figure 2C).
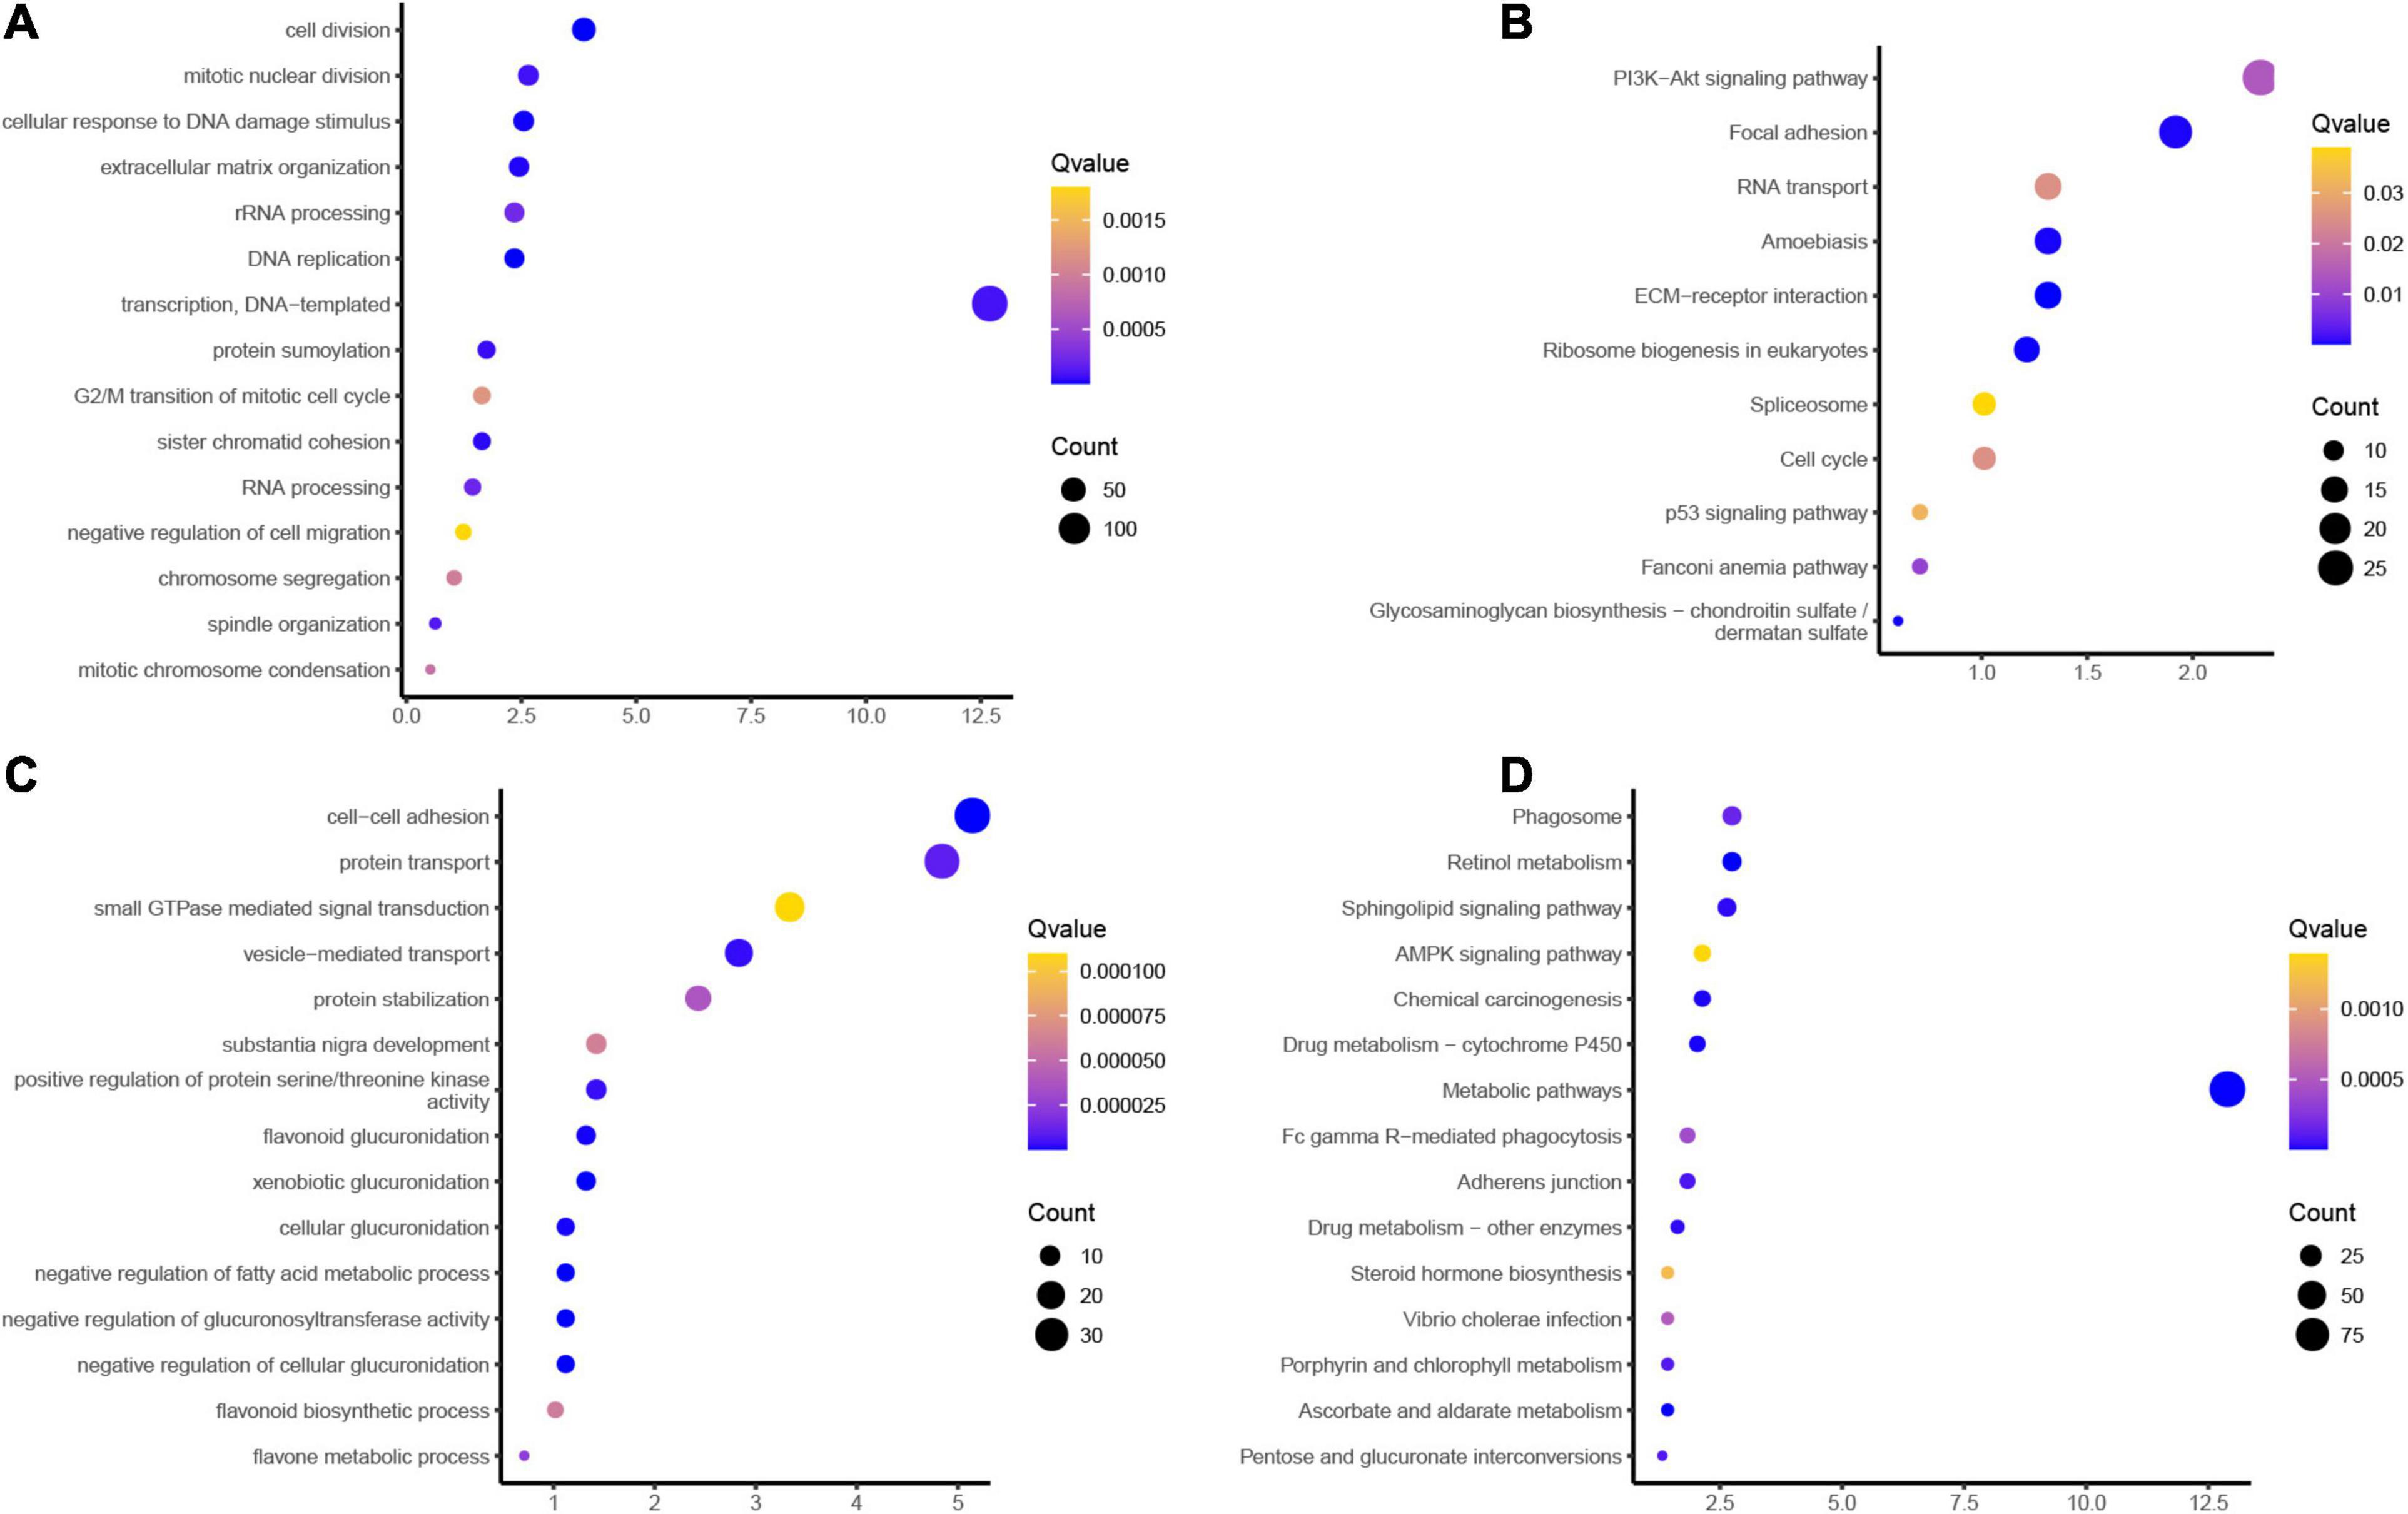
Figure 2. Bioinformatics analyses of common differentially expressed genes (DEGs) in esophageal adenocarcinoma (EA) and esophageal squamous cell carcinoma (ESCC). (A,B) Gene Ontology (GO) functions and Kyoto Encyclopedia of Genes and Genomes (KEGG) analysis of the common upregulated genes in esophageal cancer (EC). (C,D) GO functions and KEGG analysis of the common downregulated genes in esophageal cancer (EC).
Kyoto Encyclopedia of Genes and Genomes pathway showed that induced genes were involved in regulating Fanconi anemia pathway, p53 signaling pathway, cell cycle, spliceosome, ribosome biogenesis in eukaryotes, ECM-receptor interaction, amebiasis, RNA transport, focal adhesion, and phosphoinositide 3-kinase (PI3K)–Akt signaling pathway (Figure 2B). Reduced genes were involved in regulating porphyrin and chlorophyll metabolism, Vibrio cholerae infection, steroid hormone biosynthesis, adherens junction, Fc gamma R-mediated phagocytosis, metabolic pathways, drug metabolism–cytochrome P450, chemical carcinogenesis, AMP-activated protein kinase (AMPK) signaling pathway, sphingolipid signaling pathway, retinol metabolism, and phagosome (Figure 2D).
Identification of DEGs Between EA and ESCC
In order to reveal the expression signature that was used to distinguish EA from ESCC, we analyzed the different expression of genes. Finally, we revealed 857 induced genes and 880 reduced genes in EA compared to ESCC samples (Figures 3A,B).
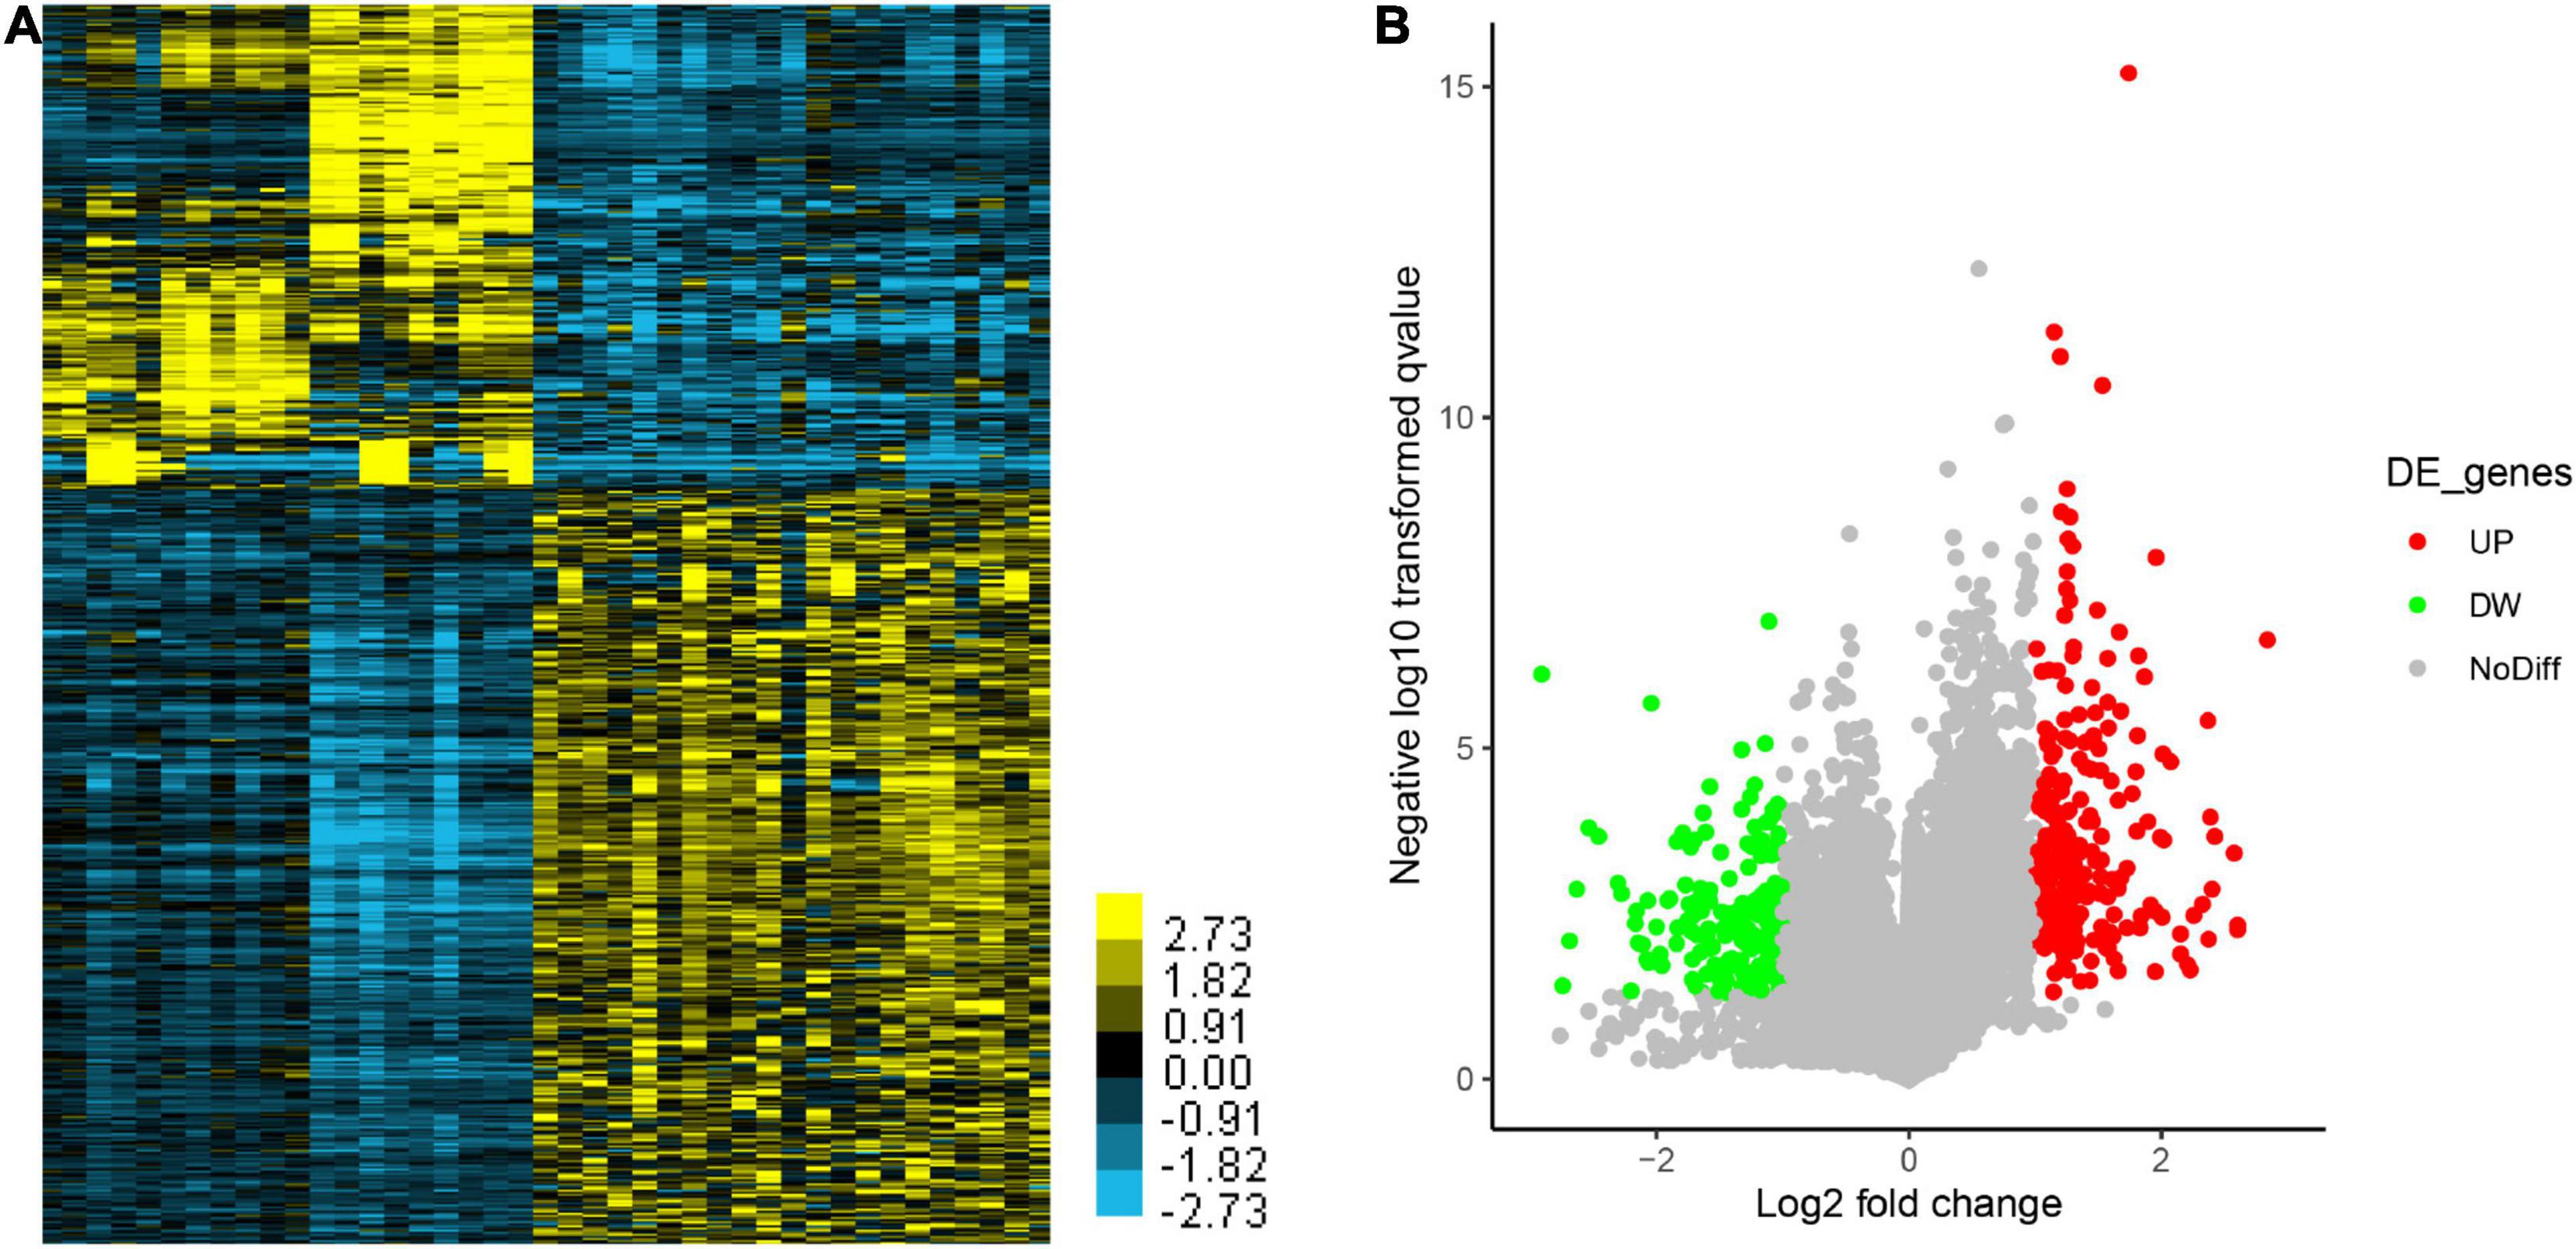
Figure 3. Identification of differentially expressed genes (DEGs) between esophageal adenocarcinoma (EA) and esophageal squamous cell carcinoma (ESCC). (A,B) The differently expressed genes between EA and ESCC were shown using (A) Heatmap and (B) Volcano Plot.
Bioinformatics Analyses of DEGs Between EA and ESCC Samples
GO functions analysis results showed that the induced genes in ESCC were related to telomere capping, nucleosome assembly, telomere organization, DNA-templated transcription, initiation, and chromatin silencing at ribosomal DNA (rDNA) (Figure 4A). KEGG pathway analysis showed induced genes in ESCC were related to the regulation of pluripotency of stem cells, FoxO signaling pathway, Rap1, Hippo, and PI3K–Akt signaling (Figure 4B).
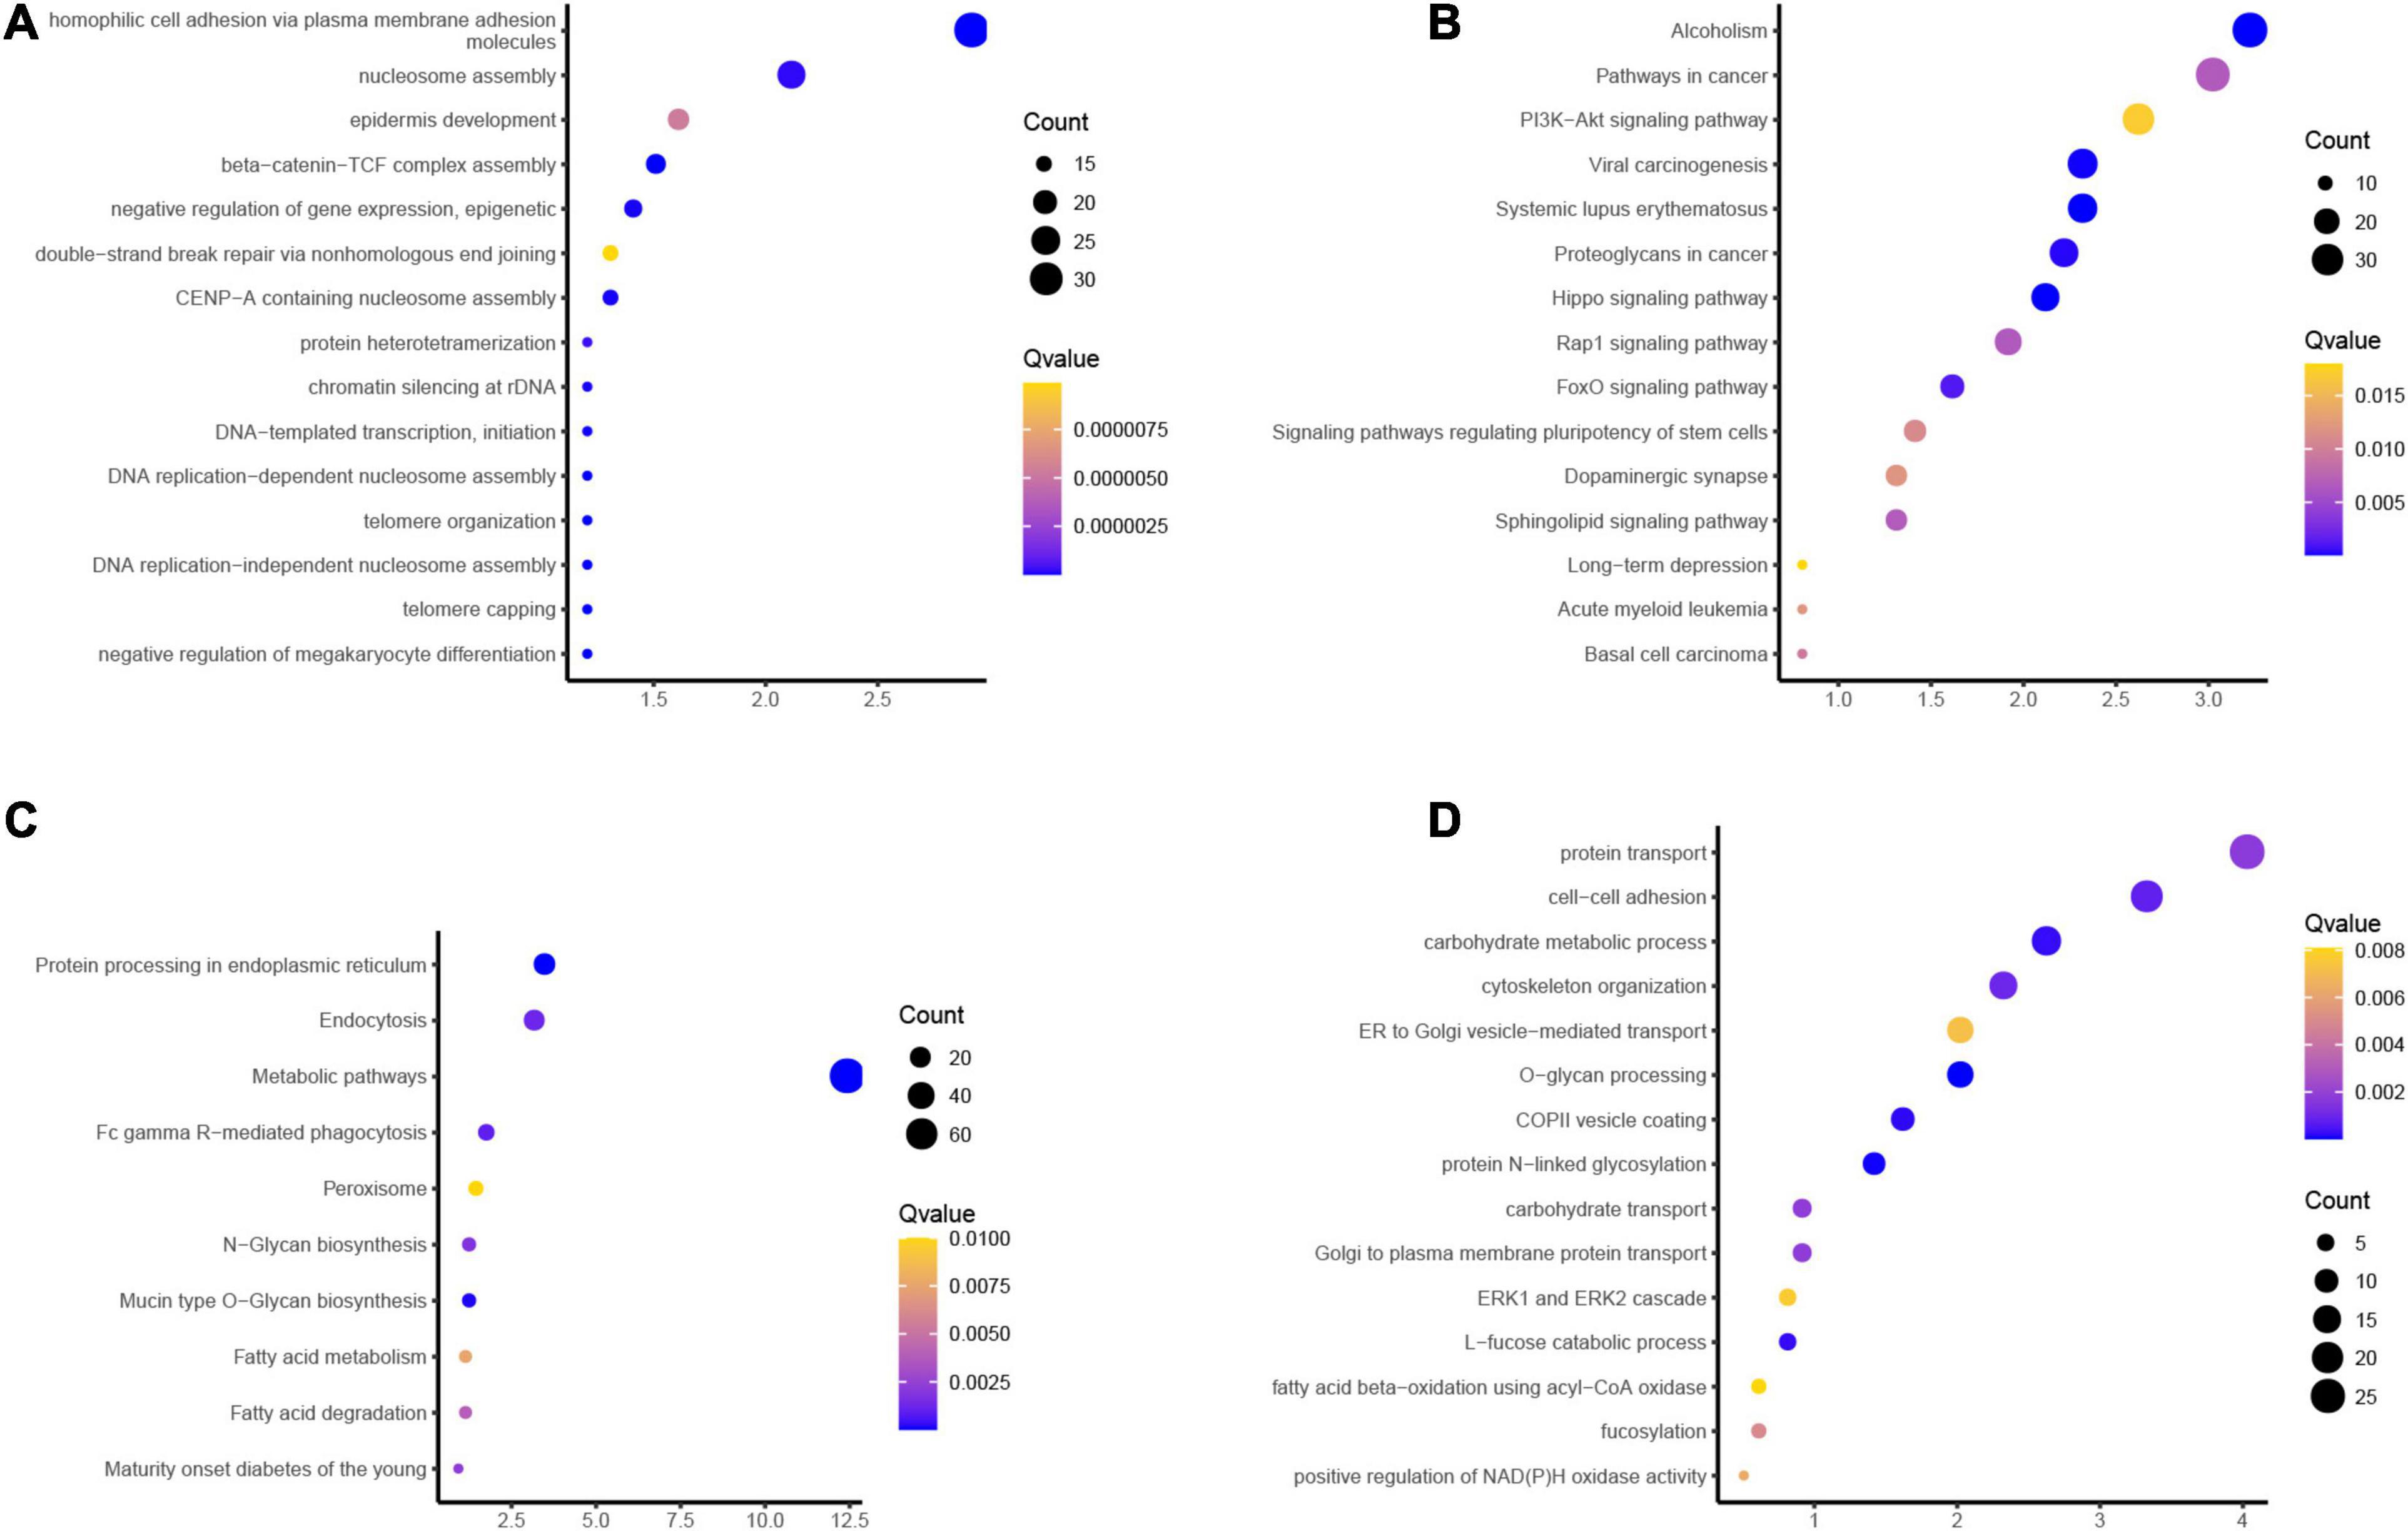
Figure 4. Bioinformatics analyses of differentially expressed genes (DEGs) between esophageal adenocarcinoma (EA) and esophageal squamous cell carcinoma (ESCC) samples. (A,B) Gene Ontology (GO) functions and Kyoto Encyclopedia of Genes and Genomes (KEGG) analysis of the upregulated genes in EA compared to ESCC. (C,D) GO functions and KEGG analysis of the common downregulated genes in EA compared to ESCC.
GO functions analysis results showed that the reduced genes in ESCC were related to fatty acid degradation, fatty acid metabolism, Mucin-type O-glycan biosynthesis, N-glycan biosynthesis, peroxisome, Fc gamma R-mediated phagocytosis, metabolic pathways, and endocytosis (Figure 4C). KEGG pathway analysis showed reduced genes in ESCC were related to carbohydrate transport, protein N-linked glycosylation, COPII vesicle coating, O-glycan processing, endoplasmic reticulum (ER) to Golgi vesicle-mediated transport, cytoskeleton organization, carbohydrate metabolic process, and cell–cell adhesion (Figure 4D).
Identification of Hub Tumor Progression Genes Between EA and ESCC
Finally, we identified 148 common induced genes that were also differently expressed between EA and ESCC (Figure 5A) and 131 common reduced genes that were also differently expressed between EA and ESCC (Figure 5B). In order to confirm the expression of these hub genes, we analyzed The Cancer Genome Atlas (TCGA) dataset. As expect, we found that 47 common reduced and 49 common induced genes were also differently expressed in EC samples compared to normal samples using TCGA database (Figures 5C,D).
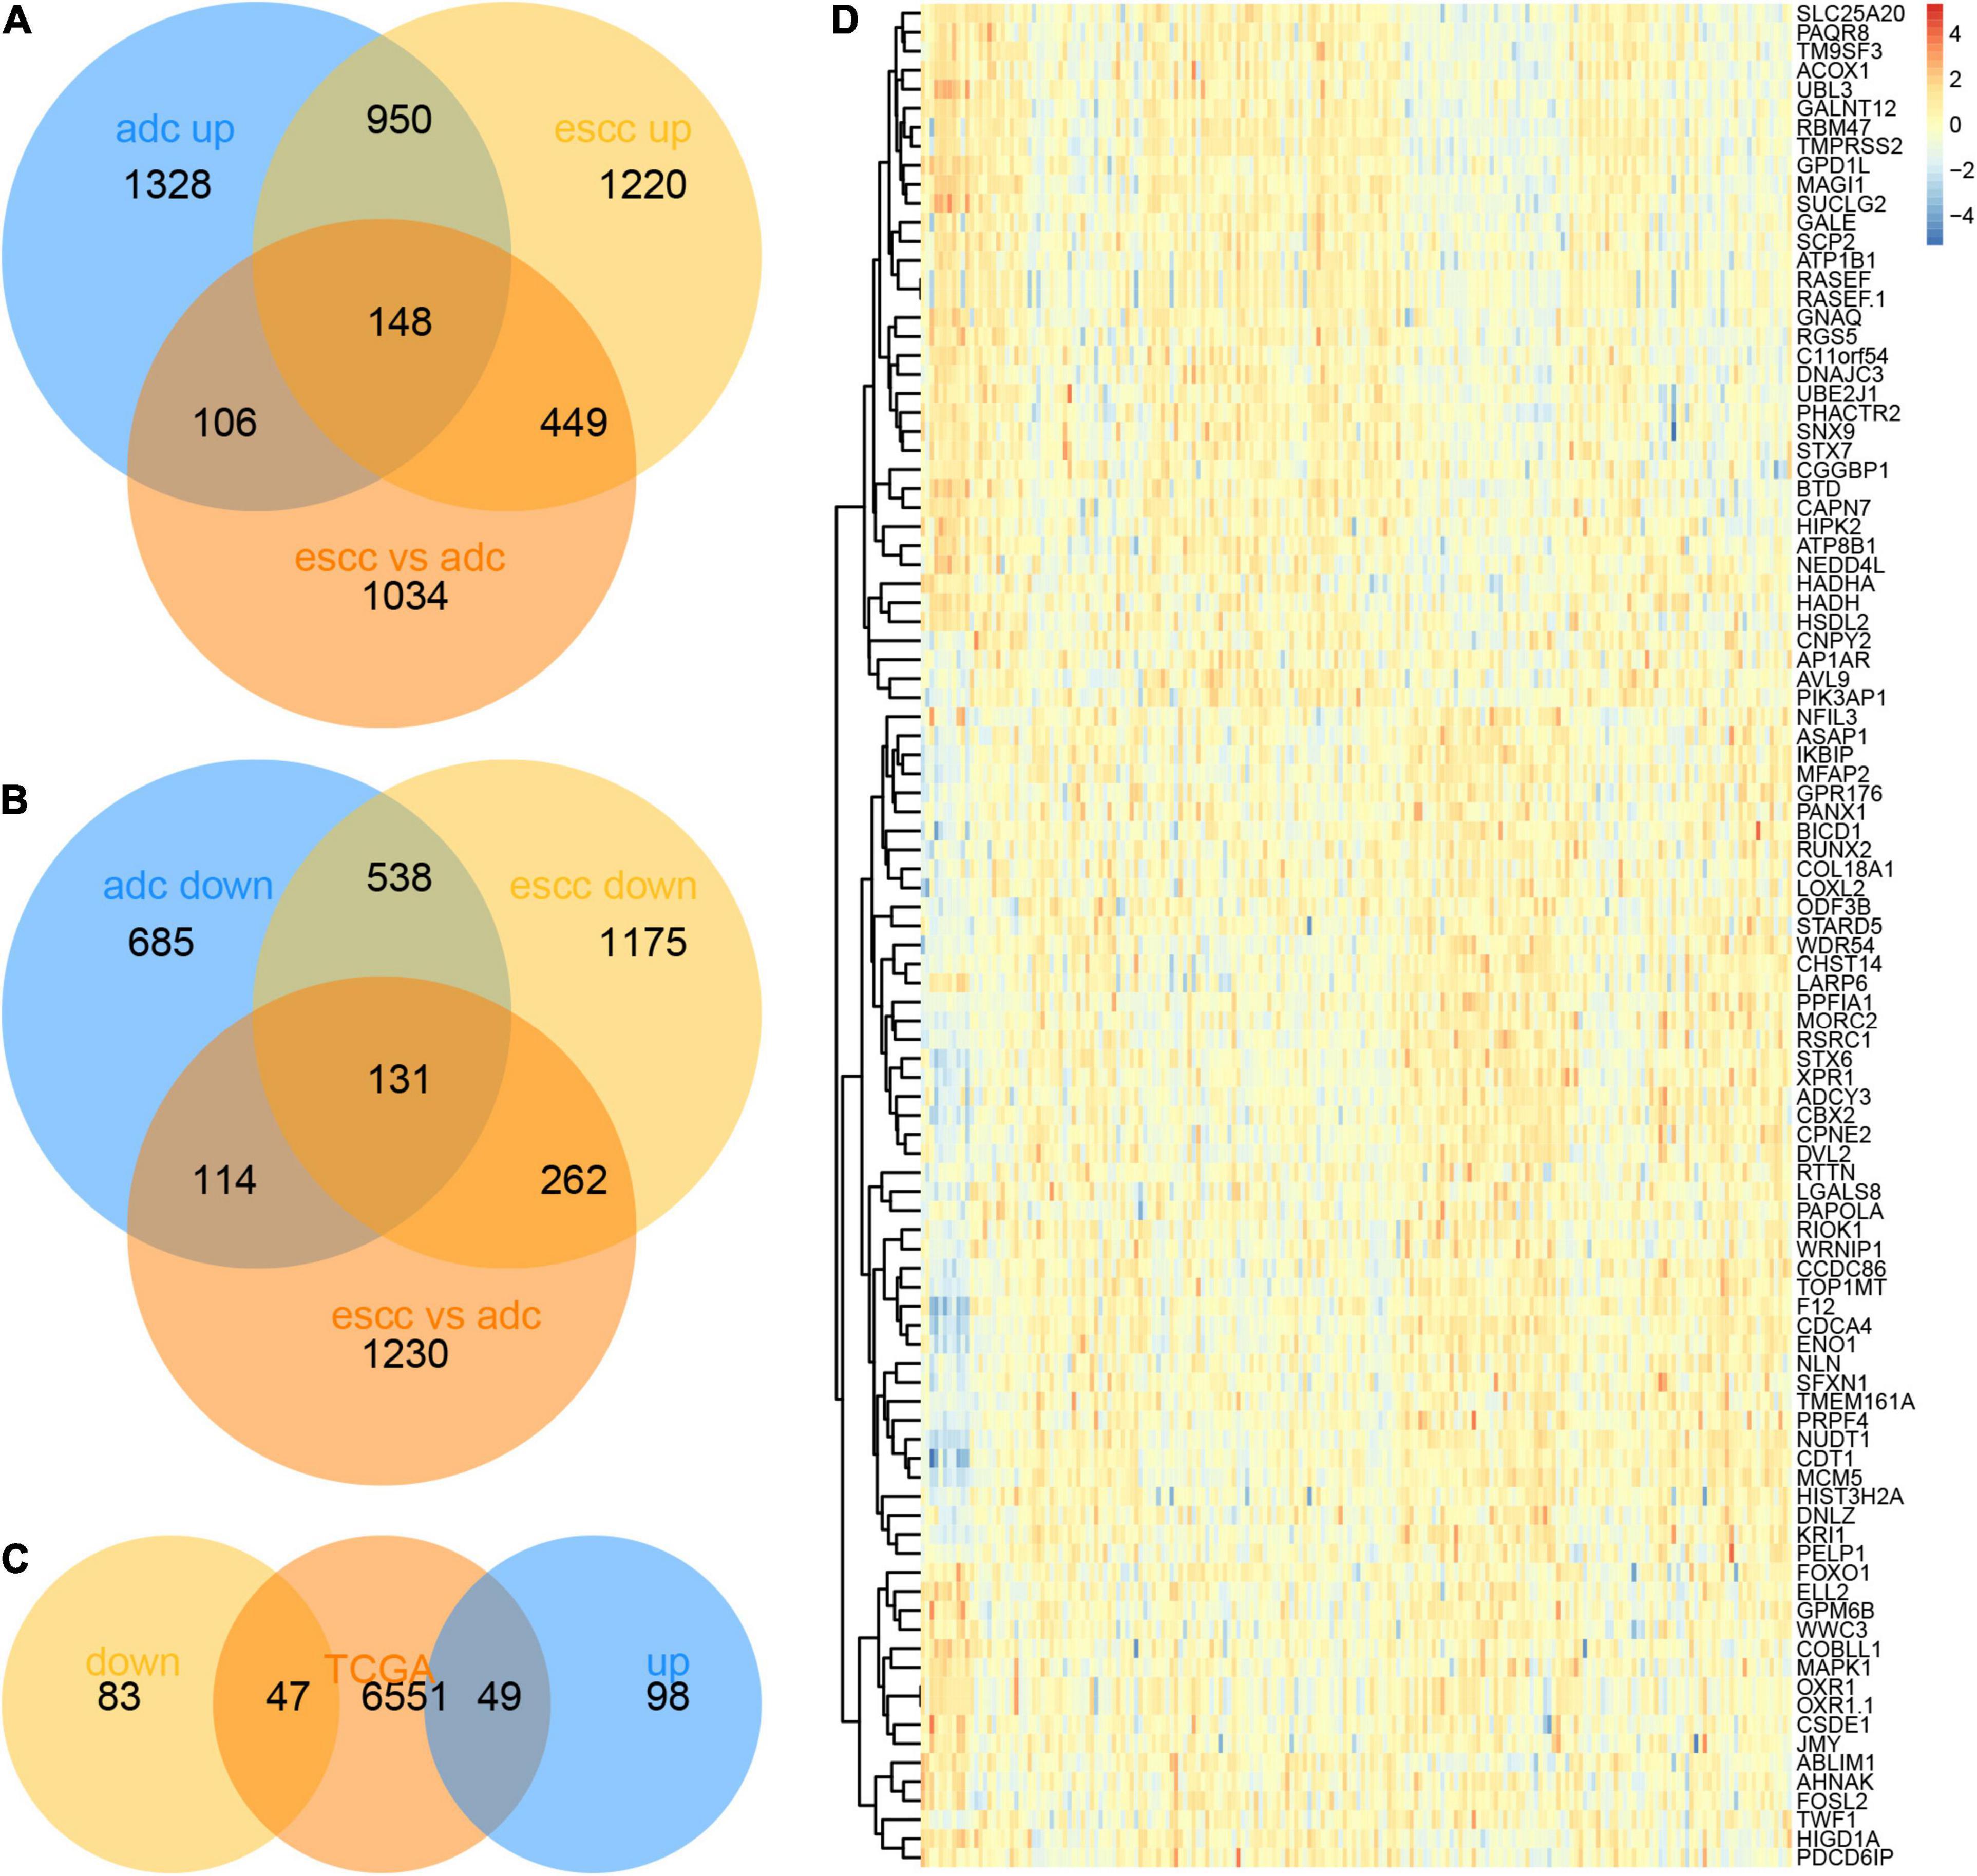
Figure 5. Identification of hub tumor progression genes between esophageal adenocarcinoma (EA) and esophageal squamous cell carcinoma (ESCC). (A) One hundred forty-seven common induced genes that was also differently expressed between EA and ESCC were identified using Venn diagram. (B) One hundred thirty common reduced genes that was also differently expressed between EA and ESCC were identified using Venn diagram. (C) The differently expressed genes between esophageal cancer (EC) and normal samples were shown using heatmap. (D) Forty-seven common reduced and 49 common induced genes were also differently expressed in EC samples compared to normal samples using The Cancer Genome Atlas (TCGA) database.
The PPI network of DEGs was further built. Based on PPI network analysis, we identified 10 hub genes with connection > 2, including GNAQ, RGS5, MAPK1, ATP1B1, HADHA, HSDL2, SLC25A20, ACOX1, SCP2, and NLN (Figure 6).
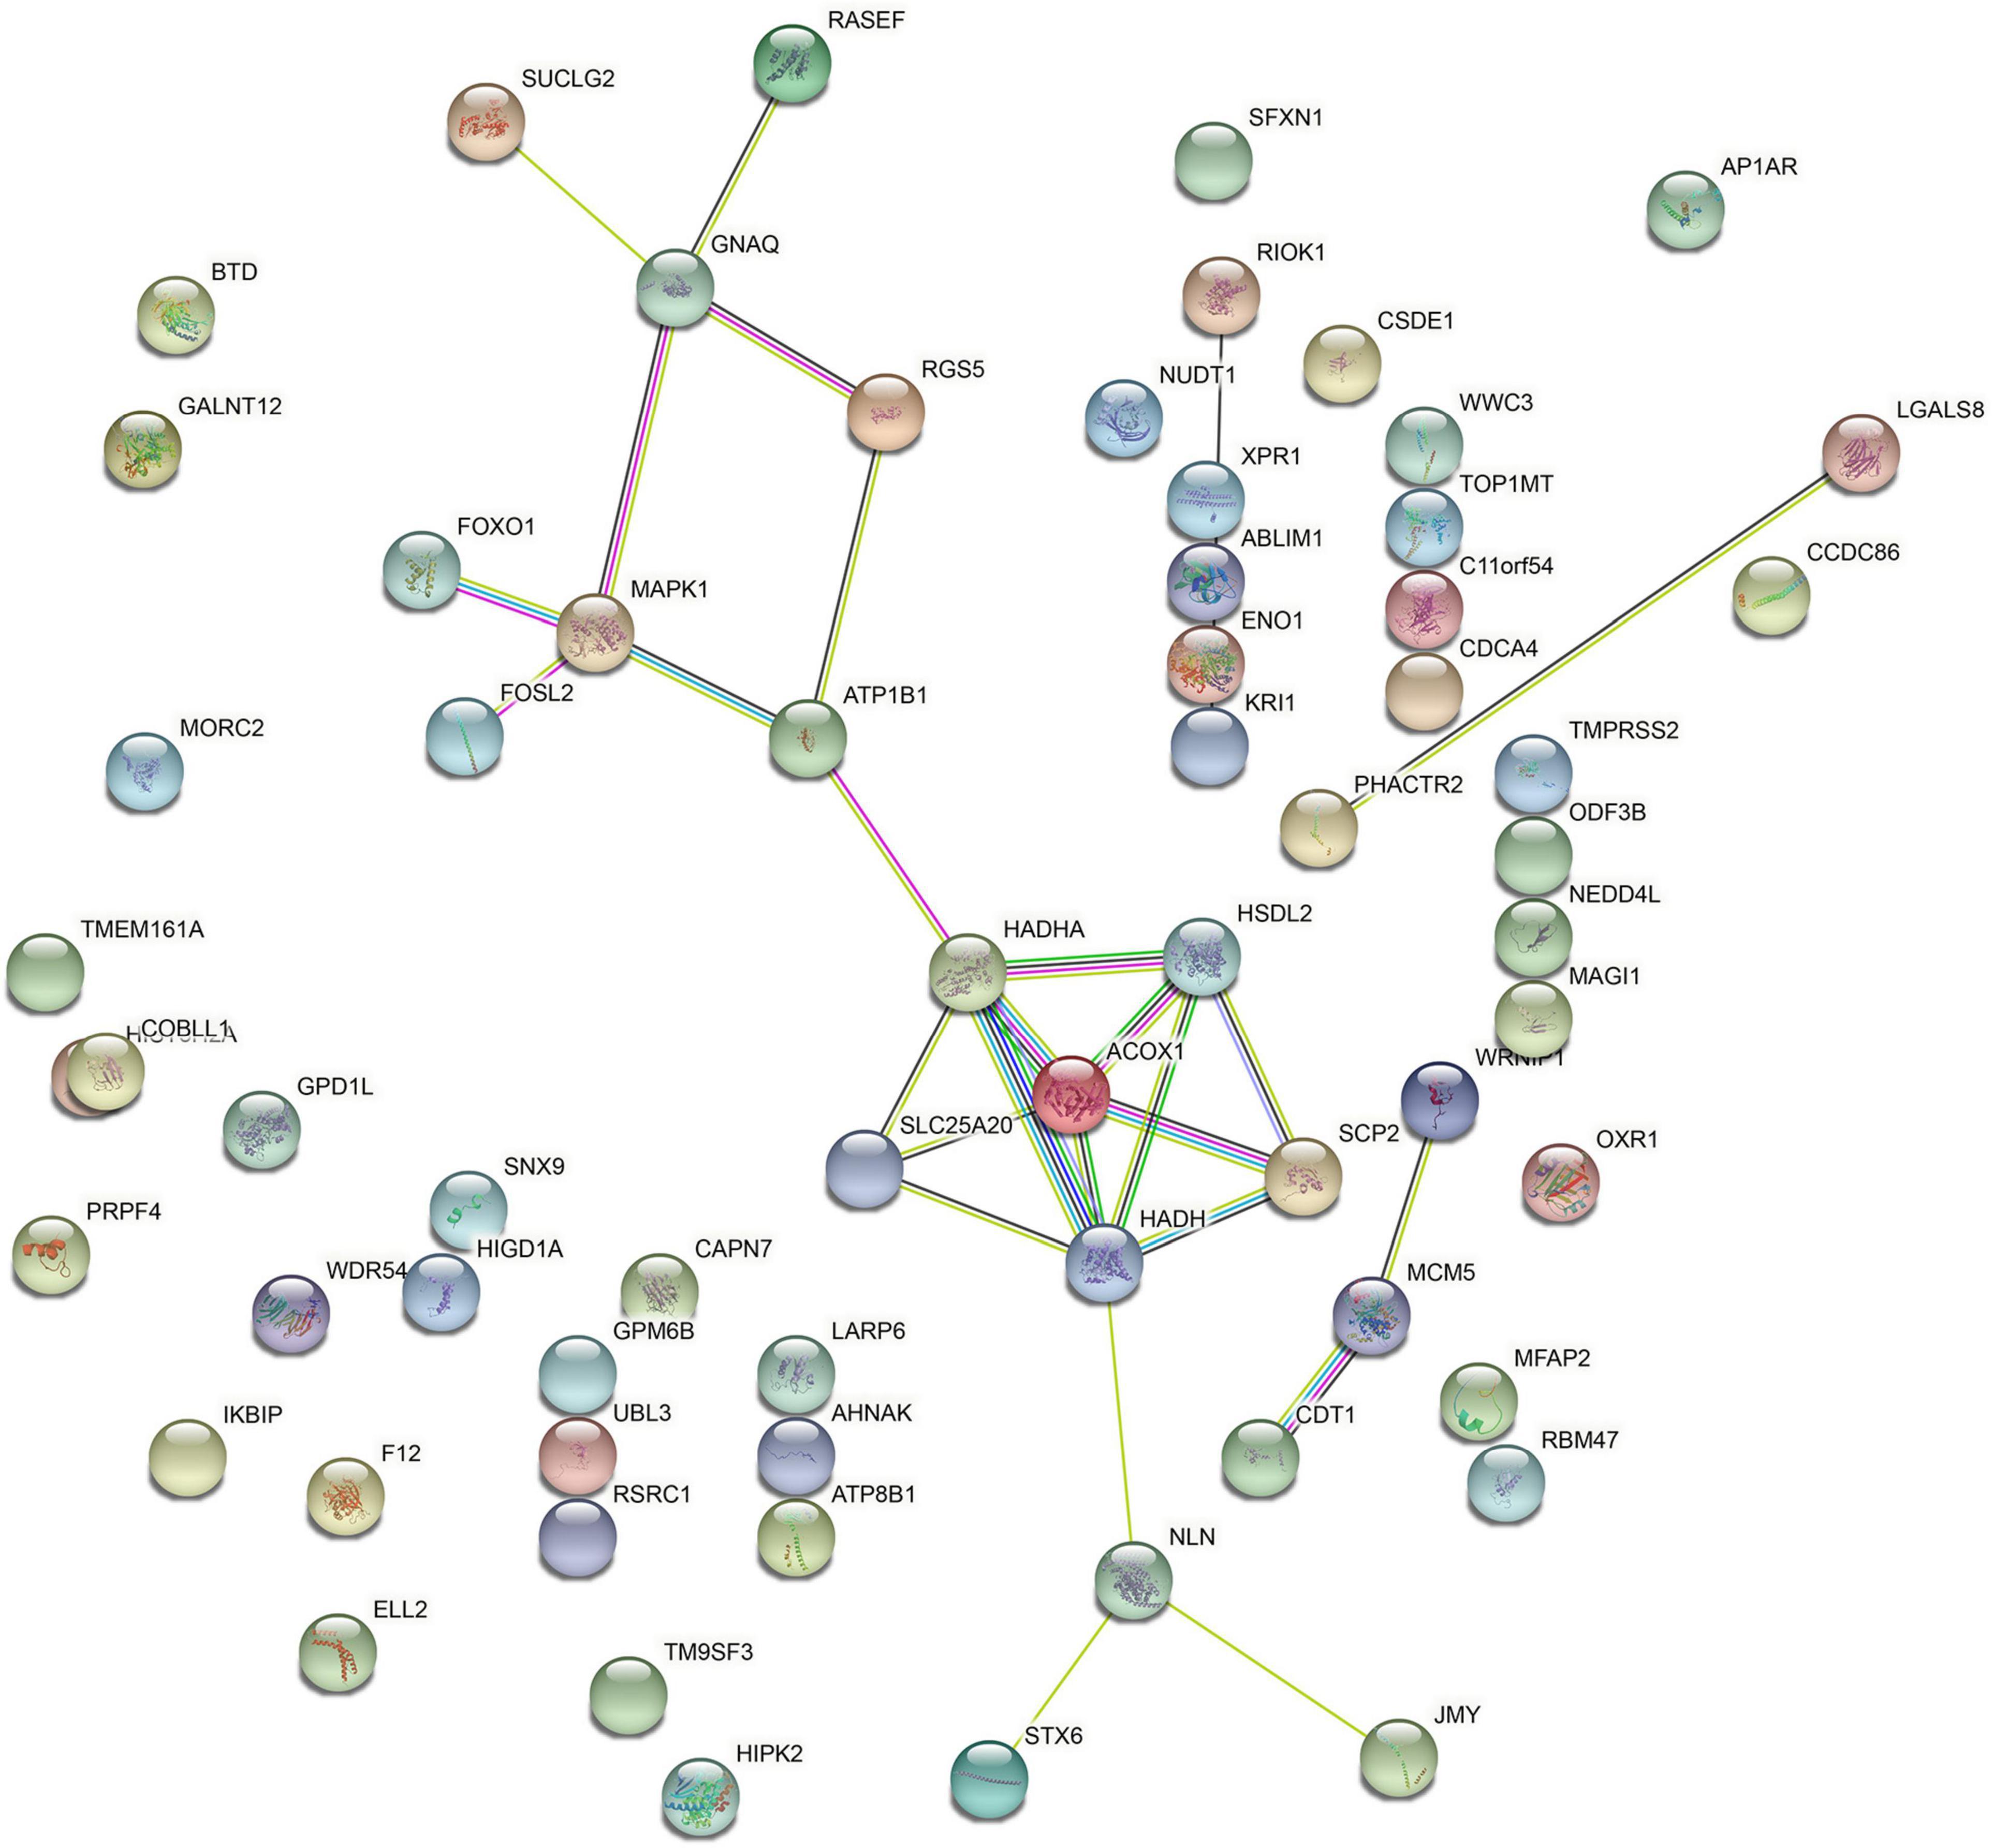
Figure 6. The protein–protein interaction (PPI) network of differentially expressed genes (DEGs) was constructed.
Validation of Hub Genes and Survival Curve Analysis
Furthermore, we confirmed the expression levels of 10 hub genes using the TCGA dataset. The results showed that GNAQ, SCP2, RGS5, MAPK1, ATP1B1, SLC25A20, HADHA, HSDL2, ACOX1, reduced in EC samples, and NLN were significantly induced in EC samples compared to normal tissues (Figure 7A).

Figure 7. The area under the curve (AUC) analysis of hub genes for distinguishing esophageal cancer (EC) samples from normal tissues. (A) The expression levels of hub genes in EC and normal samples were analyzed using The Cancer Genome Atlas (TCGA) database. (B–K) The area under the curve (AUC) analysis of GNAQ (B), RGS5 (C), MAPK1 (D), ATP1B1 (E), HADHA (F), HSDL2 (G), SLC25A20 (H), ACOX1 (I), SCP2 (J), and NLN (K) for distinguishing EC samples from normal tissues.
Furthermore, the area under the curve (AUC) of GNAQ for distinguishing EC samples from normal tissues was 0.8835 (Figure 7B). The AUC of RGS5 for distinguishing EC samples from normal tissues was 0.7951 (Figure 7C). The AUC of MAPK1 for distinguishing EC samples from normal tissues was 0.8432 (Figure 7D). The AUC of ATP1B1 for distinguishing EC samples from normal tissues was 0.6958 (Figure 7E). The AUC of HADHA for distinguishing EC samples from normal tissues was 0.8108 (Figure 7F). The AUC of HSDL2 for distinguishing EC samples from normal tissues was 0.8373 (Figure 7G). The AUC of SLC25A20 for distinguishing EC samples from normal tissues was 0.7872 (Figure 7H). The AUC of ACOX1 for distinguishing EC samples from normal tissues was 0.8457 (Figure 7I). The AUC of SCP2 for distinguishing EC samples from normal tissues was 0.7597 (Figure 7J). The AUC of NLN for distinguishing EC samples from normal tissues was 0.8477 (Figure 7K).
Next, the transcription expression data of hub genes in normal tissues, EA, and ESCC were obtained using UALCAN, which were differently expressed between EA and normal samples and between ESCC and normal samples (Figure 8A). As presented in Figure 8, we found that GNAQ (Figure 8B), SCP2 (Figure 8C), RGS5 (Figure 8D), ATP1B1 (Figure 8F), SLC25A20 (Figure 8G), HADHA (Figure 8H), HSDL2 (Figure 8I), and ACOX1 (Figure 8J) were suppressed in ESCC samples compared to EA samples; however, MAPK1 (Figure 8E) and NLN (Figure 8K) were suppressed in ESCC samples compared to EA samples.
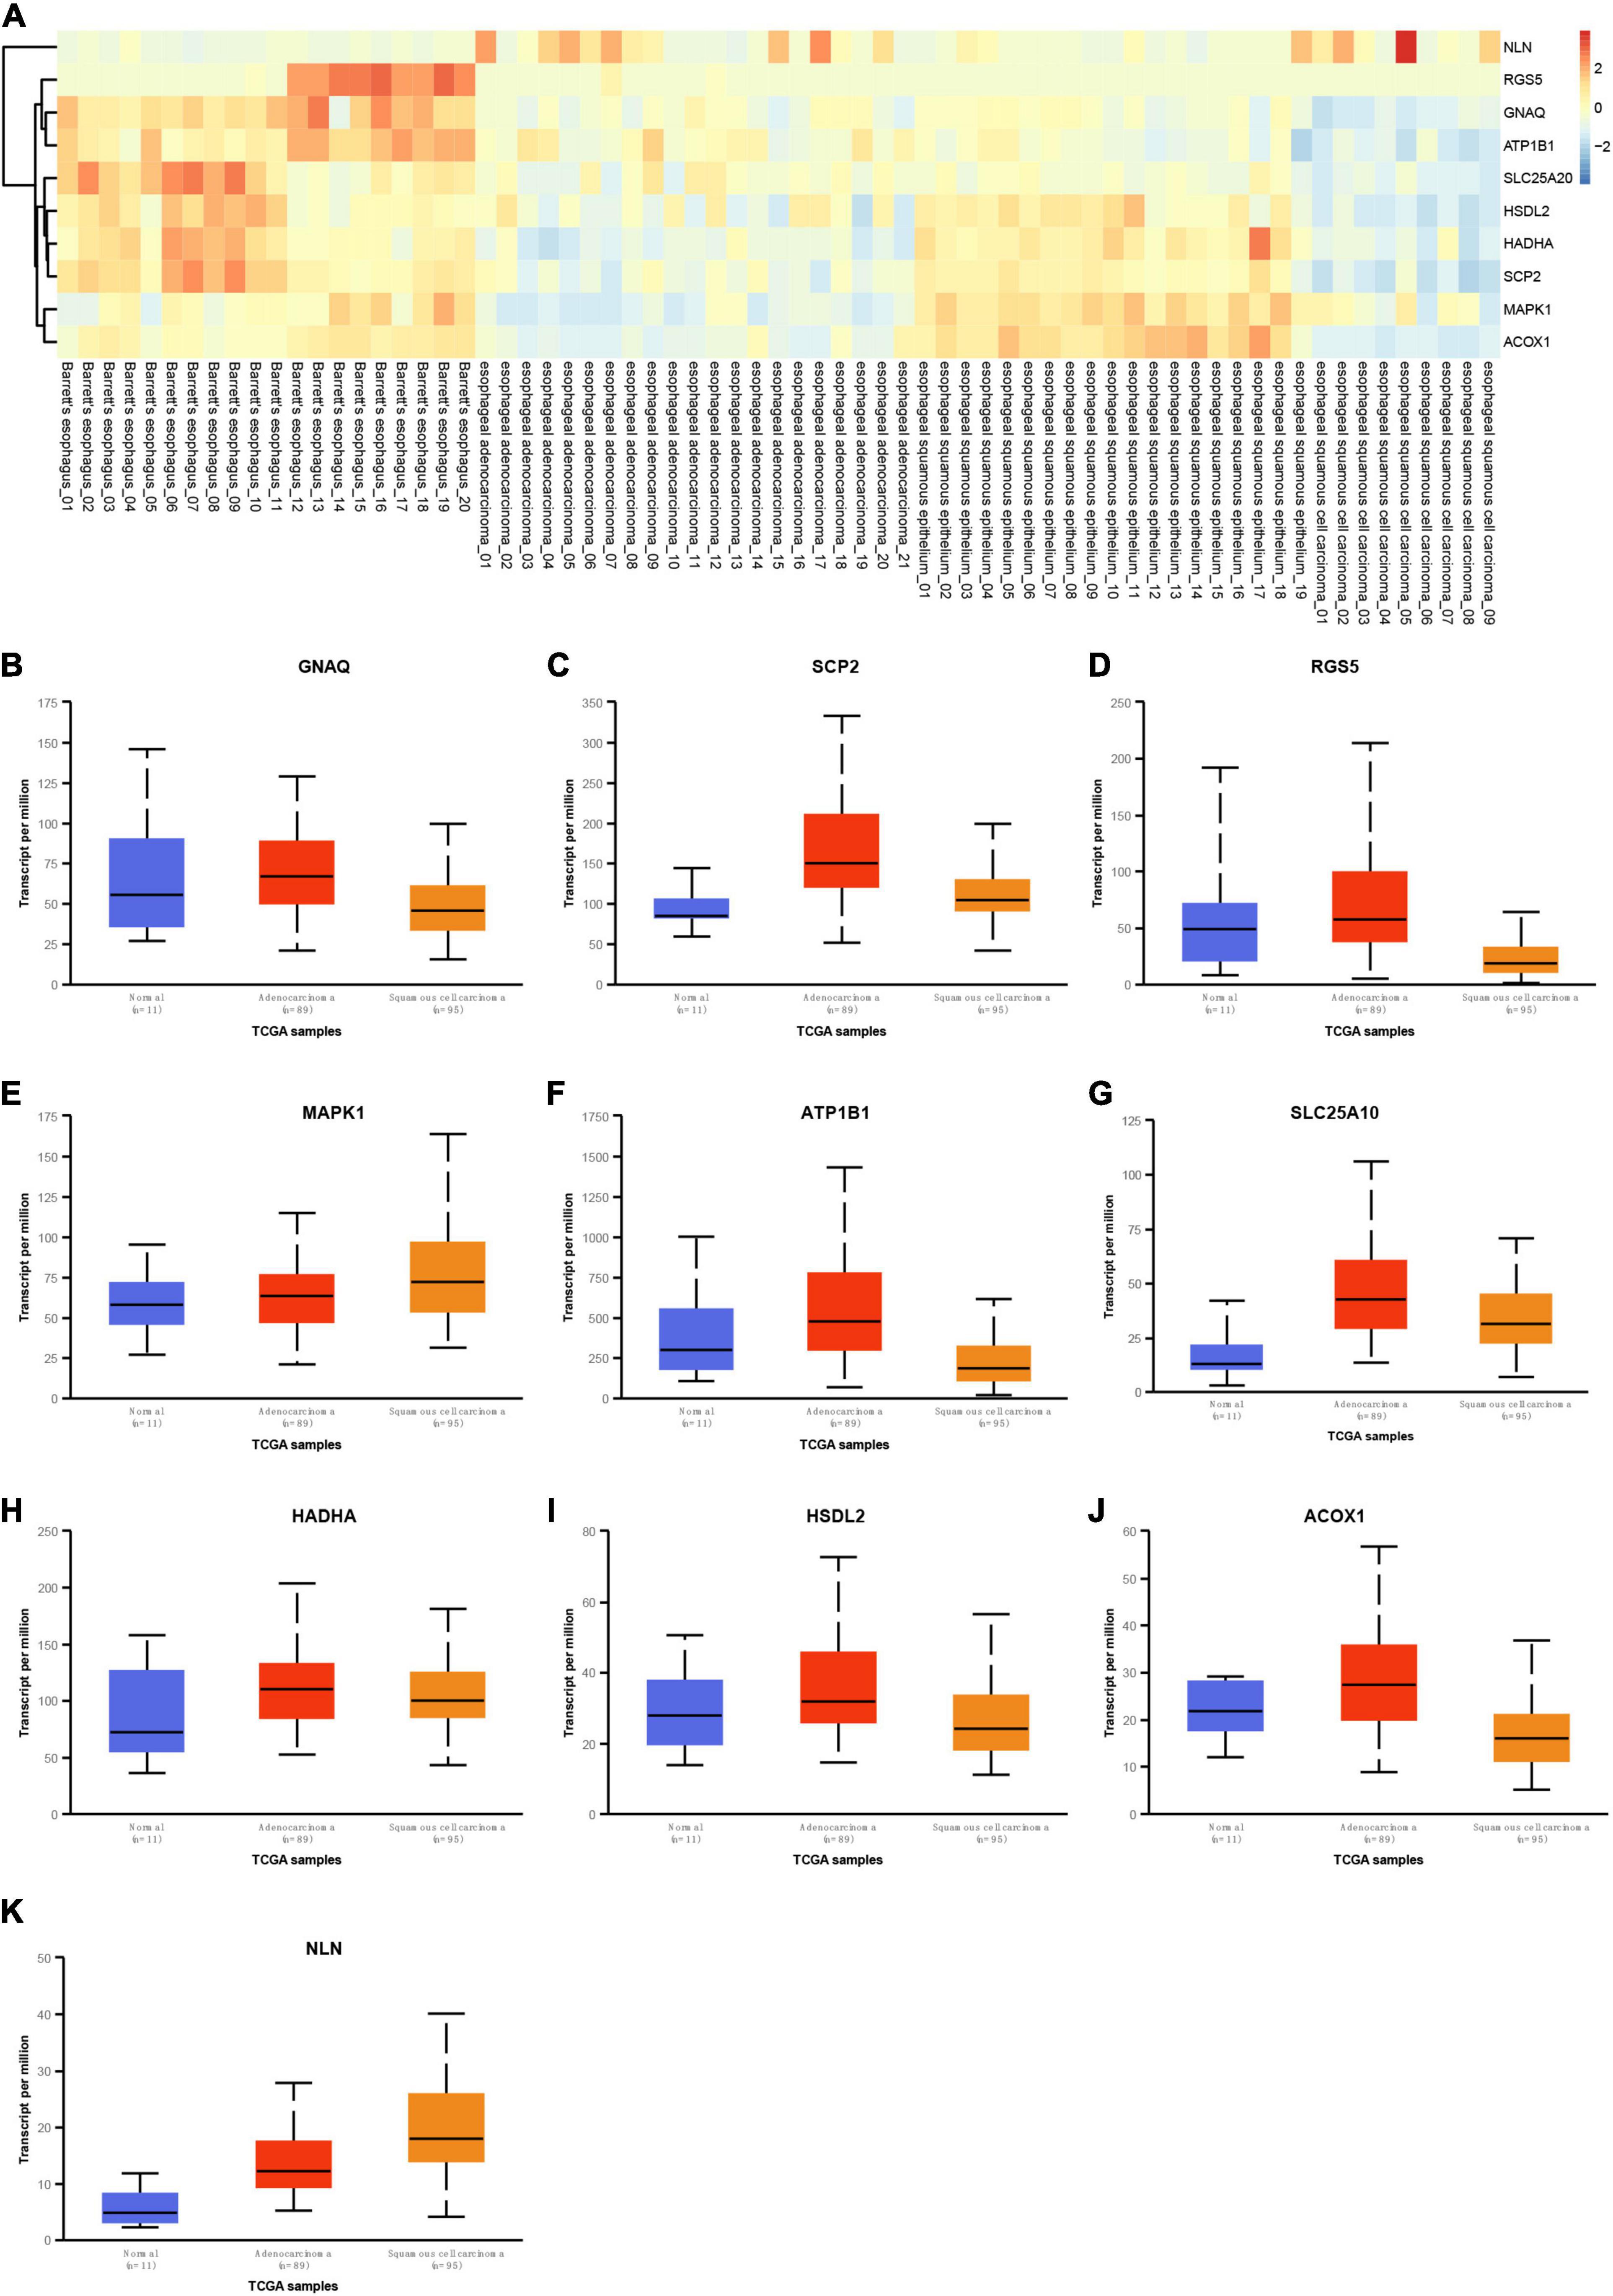
Figure 8. Validation of hub genes expression in esophageal adenocarcinoma (EA) and esophageal squamous cell carcinoma (ESCC). (A) GNAQ, RGS5, MAPK1, ATP1B1, HADHA, HSDL2, SLC25A20, ACOX1, and SCP2 were reduced in esophageal cancer (EC) samples, and NLN was significantly induced in EC samples compared to normal tissues by analyzing GSE26886. (B–K) GNAQ (B), SCP2 (C), RGS5 (D), MAPK1 (E), ATP1B1 (F), HADHA (G), HSDL2 (H), ACOX1 (I), SLC25A20 (J), and NLN (K) were differently expressed in EA and ESCC samples compared to normal tissues by analyzing UALCAN database.
We utilized the Kaplan–Meier Plotter online tool to analyze the correlation between OS time and hub genes expression in EA and ESCC. We found higher expression levels of MAPK1 were related to longer OS time in patients with ESCC, not EA (Figures 9A,B). Higher expression levels of ACOX1 were related to shorter OS time in patients with ESCC and longer OS time in patients with EA (Figures 9C,D). Higher expression levels of SCP2 were related to shorter OS time in patients with ESCC, but not EA (Figures 9E,F). Higher expression levels of NLN were related to shorter OS time in patients with EA, but not ESCC (Figures 9G,H). However, we did not observe a significant correlation between OS time and GNAQ, RGS5, ATP1B1, HADHA, HSDL2, and SLC25A20 (data not shown).
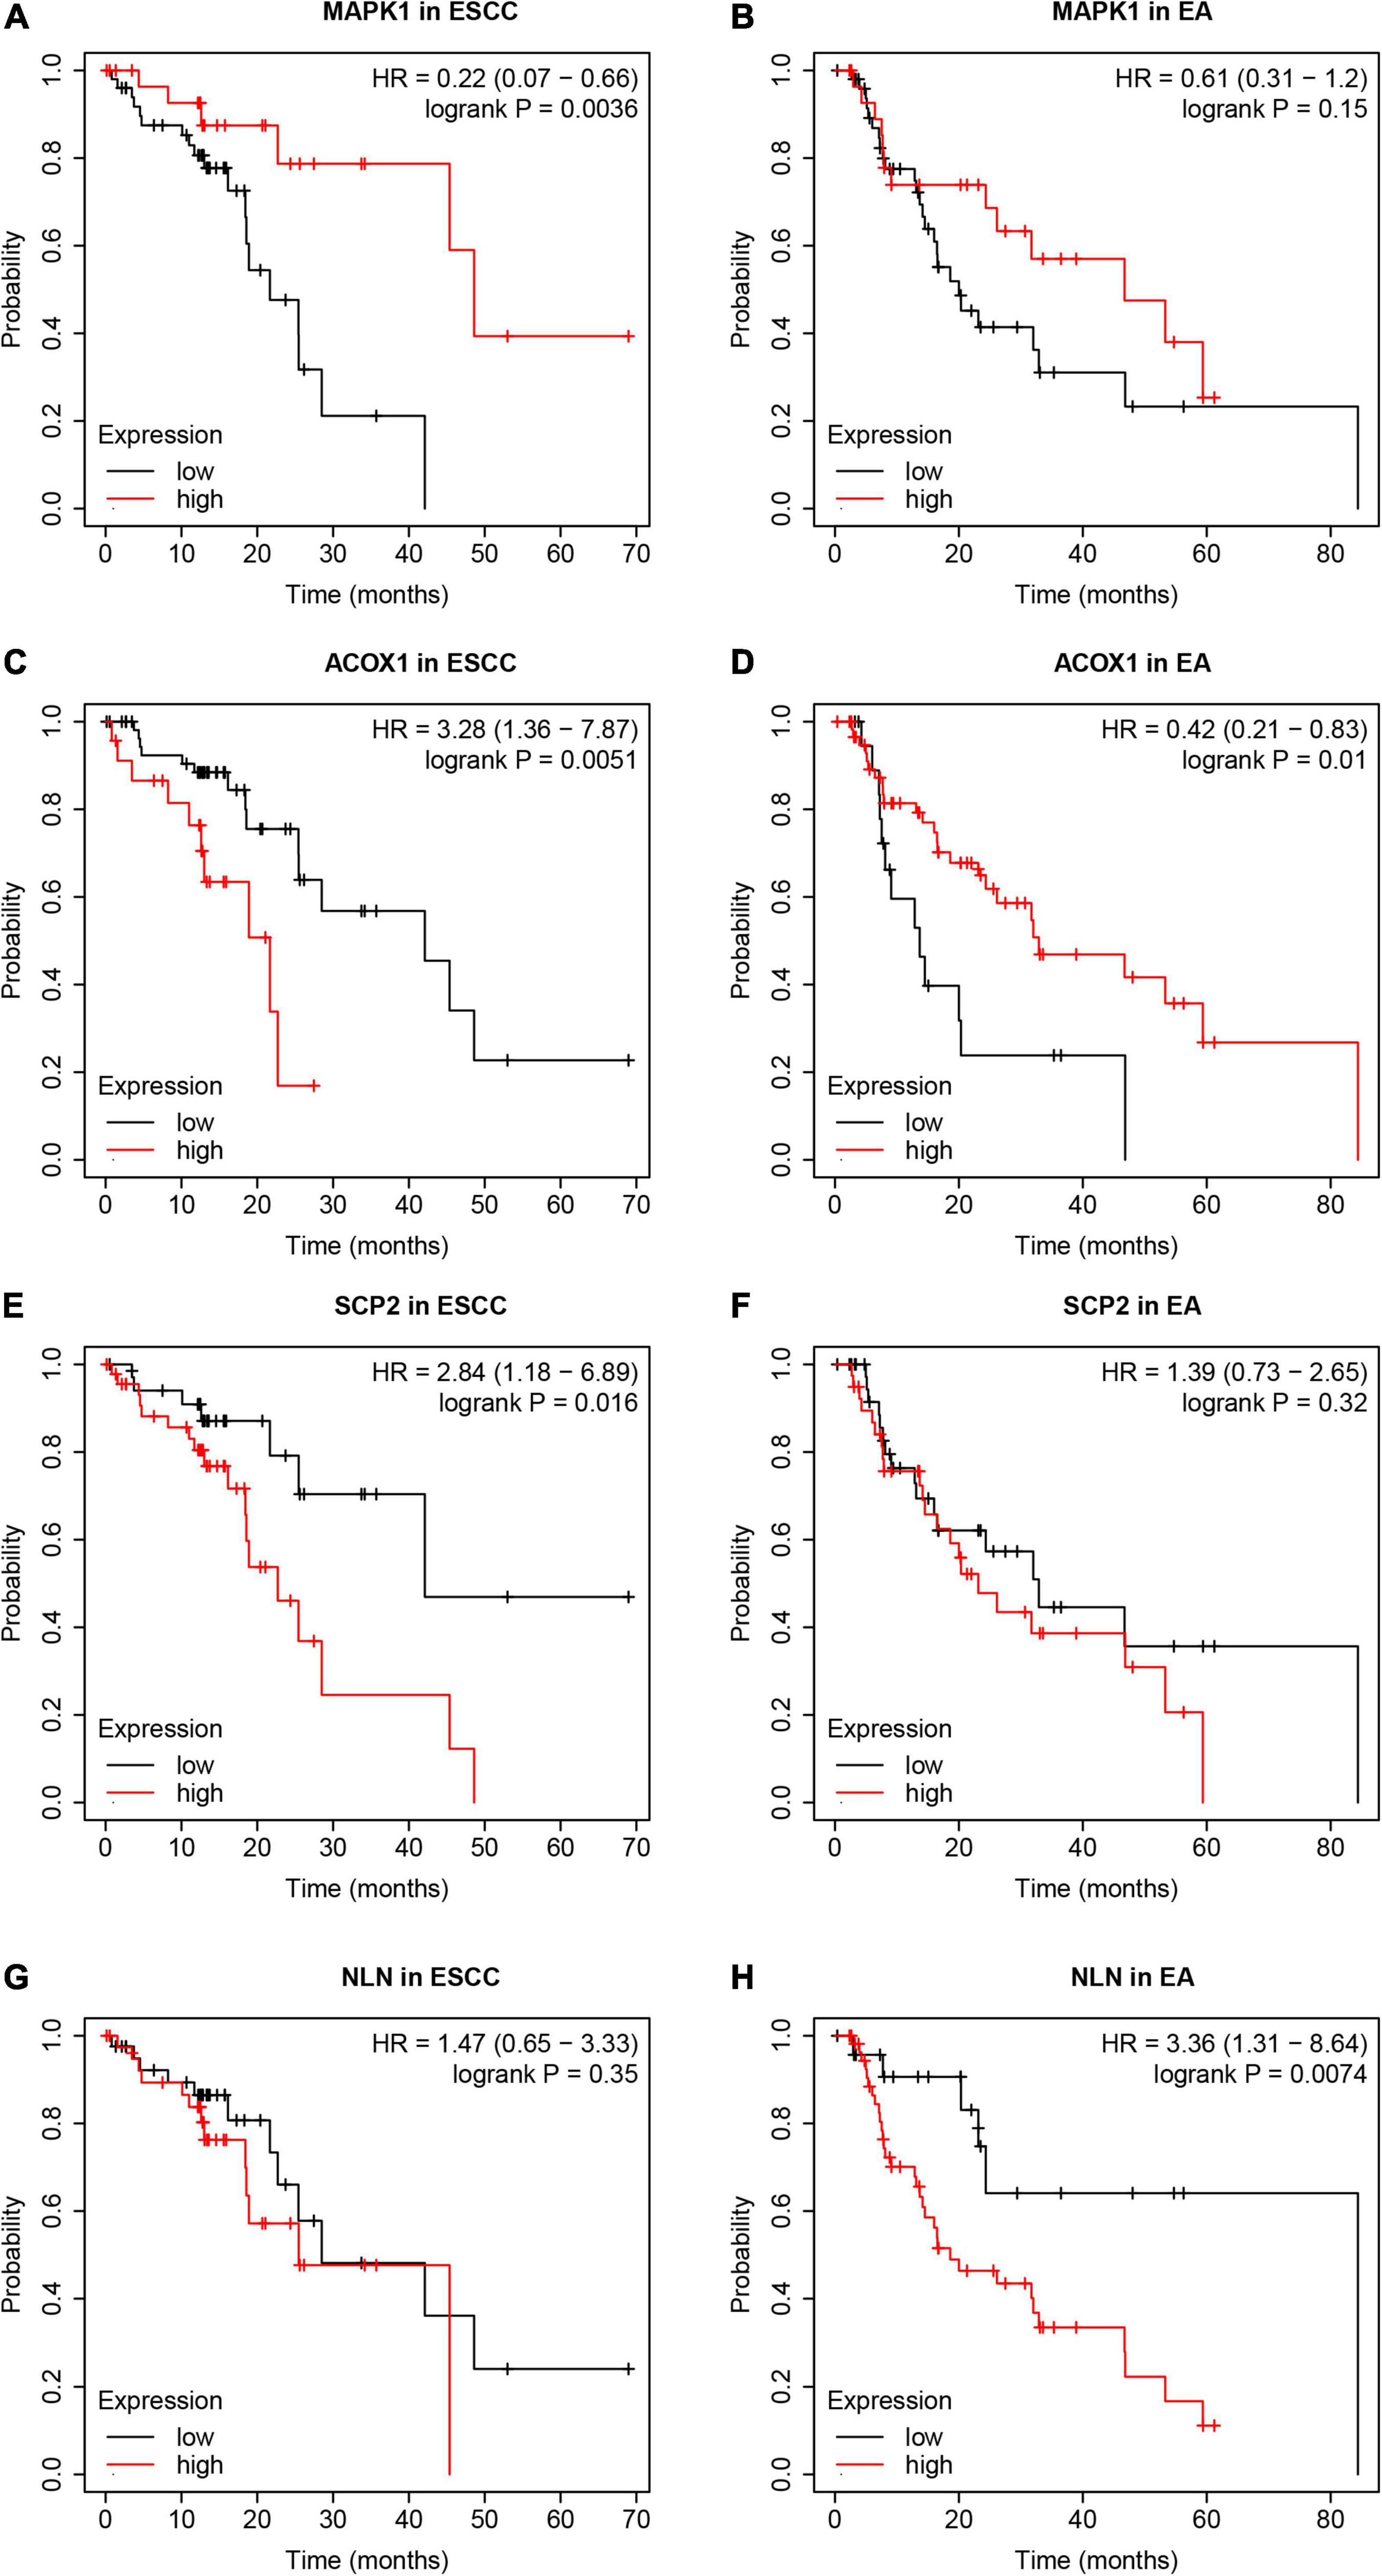
Figure 9. The dysregulation of hub genes was correlated to the survival time in patients with esophageal adenocarcinoma (EA) and esophageal squamous cell carcinoma (ESCC). (A,B) Higher expression levels of MAPK1 were associated with longer overall survival (OS) time in patients with ESCC, not EA. (C,D) Higher expression levels of ACOX1 were associated with shorter OS time in patients with ESCC and longer OS time in patients with EA. (E,F) Higher expression levels of SCP2 were associated with shorter OS time in patients with ESCC, but not EA. (G,H) Higher expression levels of NLN were associated with shorter OS time in patients with EA, but not ESCC.
Discussion
Although there are marked differences in the pathogenesis, the treatment for ESCC and EA are similar, including chemotherapy, radiotherapy, and surgery, in which surgery is the most common treatment (Campbell and Villaflor, 2010). Identifying biomarkers for EC development, progression, and prognosis is essential for understanding EC and improving clinical decision-making. The aim of this study was to identify the similarities and differences between ESCC and EA. In this study, we analyzed GSE26886 datasets and identified 1,098 common induced genes in both EA and ESCC and 669 common reduced genes in both EA and ESCC, indicating that these genes may have a crucial role in EC tumorigenesis and progression. We also revealed 857 induced genes and 880 reduced genes in EA compared to ESCC samples. Furthermore, we conducted bioinformatics analysis to reveal the potential roles of these genes. Finally, we utilized the public databases to verify the levels of hub genes in EC samples. We thought we could provide novel biomarkers for EA and ESCC prognosis.
Over the past decades, multiple efforts were paid to identify the mechanisms involved in regulating EA and squamous cell carcinoma. For example, targeting the thromboxane A2 pathway driven by cox1/2 can inhibit Barrett’s esophagus and EA (Zhang T. et al., 2019). TRIM27 promotes the occurrence and development of esophageal cancer by regulating the PTEN/Akt signaling pathway (Zhang T. et al., 2019). FOXD2-AS1 silencing inhibits the growth and metastasis of esophageal cells by regulating the mir-145-5p/Cdk6 axis (Shi W. et al., 2020). ATP6V0D2 is a subunit related to proton transport, which plays a carcinogenic effect in esophageal cancer and is related to epithelial–mesenchymal transition (Qi et al., 2020). However, there was still a lack of comprehensive analysis of hub signaling in esophagus tumors. In this study, we identified DEGs in esophagus cancer and revealed 1,098 common induced and 669 common reduced genes in both adenocarcinoma and squamous cell carcinoma, which may present the hub mechanisms in esophagus cancers. Bioinformatics analysis found that upregulated genes mainly participated in cell cycle regulation via modulating a series bps, including chromosome segregation, sister chromatid cohesion, and DNA replication. The reduced DEGS were involved in regulating metabolism, via modulating a series bps, including flavone metabolic process and cellular glucuronidation. Of note, we found several hub signaling, such as p53 and PI3K–Akt signaling pathway. As a multifunctional transcription factor, p53 regulates the expression of more than 2,500 target genes (Stegh, 2012). p53 affects numerous and highly diverse cellular processes, including maintaining genomic stability and fidelity, metabolism, and longevity (Stegh, 2012). It is one of the most important and widely studied tumor suppressors. p53 is activated by various stresses, the most important of which are genotoxic damage, hypoxia, and heat shock (Hsu et al., 1995; Hu et al., 2012). It can block cancer progression by triggering transient or permanent growth arrest, DNA repair, or promoting cell death. This effective and versatile anticancer activity spectrum, together with genomic and mutation analysis, shows that p53 is inactivated in more than 50% of human cancers (Nigro et al., 1989). PI3K signaling pathway is one of the most common signaling pathways in human tumors and plays a key role in the occurrence and development of tumors (Liu et al., 2009).
Esophageal carcinoma includes EA and ESCC. It is one of the most common gastrointestinal cancers, causing about 375,000 deaths worldwide each year. More and more literatures support different treatment strategies according to the histological characteristics of esophageal cancer (Domper Arnal et al., 2015). The different treatment strategies and outcomes of AC and SCC reflect the impact of histology on the natural history and treatment outcomes of some cancers. Therefore, it is an urgent need to identify DEGS between EA and SCC. In this study, we identified 598 induced and 924 reduced genes in squamous cell carcinoma compared to adenocarcinoma samples. Bioinformatics analysis showed that the induced genes in SCC was related to telomere capping, telomere organization, and DNA replication. Telomeres had crucial roles in tumorigenesis by modulating the proliferation and cell cycle of cancer cells (Cacchione et al., 2019). Downregulated genes in SCC was related to fatty acid metabolism and extracellular signal-regulated kinase 1 (ERK1) and ERK2 cascade. ERK signaling is activated in tumors, which was related to regulate multiple processes such as proliferation and survival (Kohno and Pouyssegur, 2006). Previous studies demonstrated that this signaling had a crucial role in both EA and ESCC. For example, Chen et al. (2019) reported that targeting ERK significantly inhibits growth and metastasis of esophageal squamous cell carcinoma cells. Miral R Sadaria et al. (2013) found that suppressing ERK 1/2 activation reduced cell viability and proliferation of human esophageal adenocarcinoma cells. Finally, we identified 147 common induced genes that were also differently expressed between EA and ESCC and 130 common reduced genes that were also differently expressed between EA and ESCC.
Based on PPI network analysis, we identified 10 hub genes with connection > 2, including GNAQ, RGS5, MAPK1, ATP1B1, HADHA, HSDL2, SLC25A20, ACOX1, SCP2, and NLN. Very interestingly, the further confirmation showed that most of these hub genes, including GNAQ, RGS5, MAPK1, ATP1B1, HADHA, HSDL2, SLC25A20, ACOX1, and SCP2, were reduced in EC samples, suggesting that they may play a tumor-suppressive role in EC. Only NLN was report to significantly be overexpressed in EC samples compared to normal tissues. Moreover, we found that GNAQ, RGS5, ATP1B1, HADHA, HSDL2, SLC25A20, ACOX1, and SCP2 were reduced in ESCC samples compared to EA samples; however, MAPK1 and NLN were reduced in ESCC samples compared to EA samples. Among these genes, GNAQ was reported to be related to uveal melanoma progression. GNAQ mutations have led to the activation of several downstream pathways in uveal melanoma, including ERK, p38, c-JUN N-terminal kinase (JNK), and Yap signaling (Shoushtari and Carvajal, 2014). In this study, we found that the expression of GNAQ in esophageal carcinoma and EA was lower than normal. The expression of GNAQ in ESCC was also lower than that in EA. G protein signal transduction regulator 5 (RGS5) is a family of GTPase activators and signal transduction molecules that negatively regulate the function of G protein (Liang et al., 2005). More specifically, RGS5 stops the signal transduction in heterotrimer G protein and is located in plasma membrane and cytoplasm (1). Recently, RGS5 has been identified as a major gene induced in pericytes and is associated with some morphological changes in tumor vasculature. It was found that RGS5 level decreased with the increase in antivascular endothelial growth factor (anti-VEGF) antibody expression as a result of angiogenesis inhibition (Wang et al., 2019).
Of note, this study for the first time revealed that the dysregulation of MAPK1, ACOX1, SCP2, and NLN is significantly correlated to the survival time in EC patients, whose functional importance had been implied in multiple cancer types. MAPK1 belongs to the MAP kinase family (Guo et al., 2020). MAPK1 is a well-known oncogene, which is overexpressed in various types of human cancers, such as lung tumor, ovarian, cervical, and gastric cancer. ACOX1 is an enzyme that catalyzes the first and rate-limiting desaturation of long-chain acyl coenzyme A to 2-trans-enol coenzyme A and transfers electrons to the reaction to react with molecular oxygen to form hydrogen peroxide (Zhang et al., 2021). Recent studies have shown that ACOX1 may be involved in tumorigenesis. For example, ACOX1 knockout contributed to liver cancer progression (Chen et al., 2018). In addition, ACOX1 destabilizes p73, thereby inhibiting the intrinsic apoptotic pathway of lymphoma cells and regulating the sensitivity to doxorubicin. SCP2 has no enzyme activity but binds branched chain lipids such as phytic acid and cholesterol derived from phytol (Milligan et al., 2017). SCP2 enhances the uptake and metabolism of branched chain fatty acids (Milligan et al., 2017), which is a recognized intracellular cholesterol transporter, which can direct cholesterol to cholesterol-rich cell membrane microstructure. It has been reported that the expression of SCP2 is related to the progression of glioma, and the suppression of SCP2 protein expression can inhibit the proliferation of tumor cells by inducing autophagy. In addition, SCP2-mediated cholesterol membrane transport promotes pituitary adenoma growth by activating hedgehog signaling (Ding et al., 2019). This study is the first to reveal the important role of SCP2 in esophageal cancer. It may be a potential biomarker for the prognosis of esophageal cancer. NLN is a 78-kDa monomer protein with 704 amino acid residues and only hydrolyzes peptides with 5–17 amino acids (Cavalcanti et al., 2014). In vivo studies have shown that NLN is associated with multiple human diseases (Garrido et al., 1999; Massarelli et al., 1999; Rioli et al., 2003). This study is the first to show that NLN is induced in esophageal cancer and has the ability to distinguish between EA and ESCC.
In addition, we should point out several limitations of this study. First, the expression levels of hub genes, such as MAPK1, ACOX1, SCP2, and NLN, were not confirmed using clinical samples. Second, the molecular functions of these hub genes in EC remained largely unclear. Using loss of functions with specific small-interfering RNAs (siRNAs) targeting these hub genes will further strength the findings of this study.
Conclusion
In this study, we analyzed the GSE26886 dataset and identified 1,098 genes induced in EA and ESCC, and 669 genes were reduced in EC and ESCC, suggesting that these genes may play an important role in the occurrence and development of EC tumors. Bioinformatics analysis showed that these genes were involved in cell cycle regulation, p53 signaling pathway, and PI3K/Akt signaling pathway. In addition, we identified 147 induced genes and 130 reduced genes differentially expressed in EA and ESCC. The expression of ESCC in the EA group was different from that in the control group. By PPI network analysis, we identified 10 hub genes, including GNAQ, RGS5, MAPK1, ATP1B1, HADHA, HSDL2, SLC25A20, ACOX1, SCP2, and NLN. TCGA validation showed that these genes were present in the dysfunctional samples between EC and normal samples and between EA and ESCC. Kaplan–Meier analysis showed that MAPK1, ACOX1, SCP2, and NLN were associated with overall survival in patients with EC. We believe that this study may provide a new biomarker for the prognosis of EA and ESCC.
Data Availability Statement
The datasets presented in this study can be found in online repositories. The names of the repository/repositories and accession number(s) can be found in the article/supplementary material.
Author Contributions
SL conceived and designed the study. FW, LZ, and YXu performed the analyses. All authors wrote the manuscript and read and approved the manuscript.
Funding
This work was funded by the National Natural Science Foundation of China (81372677 and 82073084) and Foundation and Frontier Project of Henan Province (132300410073).
Conflict of Interest
The authors declare that the research was conducted in the absence of any commercial or financial relationships that could be construed as a potential conflict of interest.
Footnotes
References
Abbas, G., and Krasna, M. (2017). Overview of esophageal cancer. Ann. Cardiothorac. Surg. 6, 131–136. doi: 10.21037/acs.2017.03.03
Bray, F., Ferlay, J., Soerjomataram, I., Siegel, R. L., Torre, L. A., and Jemal, A. (2018). Global cancer statistics 2018: globocan estimates of incidence and mortality worldwide for 36 cancers in 185 countries. CA Cancer J. Clin. 68, 394–424. doi: 10.3322/caac.21492
Cacchione, S., Biroccio, A., and Rizzo, A. (2019). Emerging roles of telomeric chromatin alterations in cancer. J. Exp. Clin. Cancer Res. 38:21. doi: 10.1186/s13046-019-1030-5
Campbell, N. P., and Villaflor, V. M. (2010). Neoadjuvant treatment of esophageal cancer. World J. Gastroenterol. 16, 3793–3803. doi: 10.3748/wjg.v16.i30.3793
Cao, L., Hu, T., Lu, H., and Peng, D. (2020). N-MYC downstream regulated gene 4 (NDRG4), a frequent downregulated gene through DNA hypermethylation, plays a tumor suppressive role in esophageal adenocarcinoma. Cancers (Basel) 12:2573. doi: 10.3390/cancers12092573
Cavalcanti, D. M., Castro, L. M., Rosa Neto, J. C., Seelaender, M., Neves, R. X., Oliveira, V., et al. (2014). Neurolysin knockout mice generation and initial phenotype characterization. J. Biol. Chem. 289, 15426–15440. doi: 10.1074/jbc.M113.539148
Chandrashekar, D. S., Bashel, B., Balasubramanya, S. A. H., Creighton, C. J., Ponce-Rodriguez, I., Chakravarthi, B., et al. (2017). UALCAN: a portal for facilitating tumor subgroup gene expression and survival analyses. Neoplasia 19, 649–658. doi: 10.1016/j.neo.2017.05.002
Chen, L., Bi, S., Hou, J., Zhao, Z., Wang, C., and Xie, S. (2019). Targeting p21-activated kinase 1 inhibits growth and metastasis via Raf1/MEK1/ERK signaling in esophageal squamous cell carcinoma cells. Cell Commun. Signal 17:31. doi: 10.1186/s12964-019-0343-5
Chen, X. F., Tian, M. X., Sun, R. Q., Zhang, M. L., Zhou, L. S., Jin, L., et al. (2018). SIRT5 inhibits peroxisomal ACOX1 to prevent oxidative damage and is downregulated in liver cancer. EMBO Rep. 19:e45124. doi: 10.15252/embr.201745124
Ding, X., Fan, K., Hu, J., Zang, Z., Zhang, S., Zhang, Y., et al. (2019). SCP2-mediated cholesterol membrane trafficking promotes the growth of pituitary adenomas via Hedgehog signaling activation. J. Exp. Clin. Cancer Res. 38:404. doi: 10.1186/s13046-019-1411-9
Domper Arnal, M. J., Ferrandez Arenas, A., and Lanas Arbeloa, A. (2015). Esophageal cancer: risk factors, screening and endoscopic treatment in Western and Eastern countries. World J. Gastroenterol. 21, 7933–7943. doi: 10.3748/wjg.v21.i26.7933
Garrido, P. A., Vandenbulcke, F., Ramjaun, A. R., Vincent, B., Checler, F., Ferro, E., et al. (1999). Confocal microscopy reveals thimet oligopeptidase (EC 3.4.24.15) and neurolysin (EC 3.4.24.16) in the classical secretory pathway. DNA Cell Biol. 18, 323–331. doi: 10.1089/104454999315385
Gindea, C., Birla, R., Hoara, P., Caragui, A., and Constantinoiu, S. (2014). Barrett esophagus: history, definition and etiopathogeny. J. Med. Life 7, 23–30.
Gu, C., Huang, Z., Chen, X., Liu, C., Rocco, G., Zhao, S., et al. (2020a). TEAD4 promotes tumor development in patients with lung adenocarcinoma via ERK signaling pathway. Biochim. Biophys. Acta Mol. Basis Dis. 1866:165921. doi: 10.1016/j.bbadis.2020.165921
Gu, C., Shi, X., Dai, C., Shen, F., Rocco, G., Chen, J., et al. (2020b). RNA m6A modification in cancers: molecular mechanisms and potential clinical applications. Innovation 1:100066. doi: 10.1016/j.xinn.2020.100066
Gu, C., Shi, X., Dang, X., Chen, J., Chen, C., Chen, Y., et al. (2020c). Identification of common genes and pathways in eight fibrosis diseases. Front. Genet. 11:627396. doi: 10.3389/fgene.2020.627396
Gu, C., Shi, X., Huang, Z., Chen, J., Yang, J., Shi, J., et al. (2020d). A comprehensive study of construction and analysis of competitive endogenous RNA networks in lung adenocarcinoma. Biochim. Biophys. Acta Proteins Proteom 1868:140444. doi: 10.1016/j.bbapap.2020.140444
Gu, C., Shi, X., Qiu, W., Huang, Z., Yu, Y., Shen, F., et al. (2021). Comprehensive analysis of the prognostic role and mutational characteristics of m6A-Related genes in lung squamous cell carcinoma. Front. Cell Dev. Biol. 9:661792. doi: 10.3389/fcell.2021.661792
Guo, Y. J., Pan, W. W., Liu, S. B., Shen, Z. F., Xu, Y., and Hu, L. L. (2020). ERK/MAPK signalling pathway and tumorigenesis. Exp. Ther. Med. 19, 1997–2007. doi: 10.3892/etm.2020.8454
Hsu, Y. S., Tang, F. M., Liu, W. L., Chuang, J. Y., Lai, M. Y., and Lin, Y. S. (1995). Transcriptional regulation by p53. Functional interactions among multiple regulatory domains. J. Biol. Chem. 270, 6966–6974. doi: 10.1074/jbc.270.12.6966
Hu, W., Feng, Z., and Levine, A. J. (2012). The regulation of multiple p53 stress responses is mediated through MDM2. Genes Cancer 3, 199–208. doi: 10.1177/1947601912454734
Huang da, W., Sherman, B. T., and Lempicki, R. A. (2009). Systematic and integrative analysis of large gene lists using DAVID bioinformatics resources. Nat. Protoc. 4, 44–57. doi: 10.1038/nprot.2008.211
Kelsen, D. P., Ginsberg, R., Pajak, T. F., Sheahan, D. G., Gunderson, L., Mortimer, J., et al. (1998). Chemotherapy followed by surgery compared with surgery alone for localized esophageal cancer. N. Engl. J. Med. 339, 1979–1984. doi: 10.1056/NEJM199812313392704
Kohno, M., and Pouyssegur, J. (2006). Targeting the ERK signaling pathway in cancer therapy. Ann. Med. 38, 200–211. doi: 10.1080/07853890600551037
Kunze, B., Wein, F., Fang, H. Y., Anand, A., Baumeister, T., Strangmann, J., et al. (2020). Notch signaling mediates differentiation in barrett’s esophagus and promotes progression to adenocarcinoma. Gastroenterology 159, 575–590. doi: 10.1053/j.gastro.2020.04.033
Liang, Y., Li, C., Guzman, V. M., Chang, W. W., Evinger, A. J. 3rd, Sao, D., et al. (2005). Identification of a novel alternative splicing variant of RGS5 mRNA in human ocular tissues. FEBS J. 272, 791–799. doi: 10.1111/j.1742-4658.2004.04516.x
Liu, P., Cheng, H., Roberts, T. M., and Zhao, J. J. (2009). Targeting the phosphoinositide 3-kinase pathway in cancer. Nat. Rev. Drug Discov. 8, 627–644. doi: 10.1038/nrd2926
Lyros, O., Nie, L., Moore, T., Medda, R., Otterson, M., Behmaram, B., et al. (2016). Dysregulation of WNT5A/ROR2 signaling characterizes the progression of barrett-associated esophageal adenocarcinoma. Mol. Cancer Res. 14, 647–659. doi: 10.1158/1541-7786.MCR-15-0484
Massarelli, E. E., Casatti, C. A., Kato, A., Camargo, A. C., Bauer, J. A., Glucksman, M. J., et al. (1999). Differential subcellular distribution of neurolysin (EC 3.4.24.16) and thimet oligopeptidase (EC 3.4.24.15) in the rat brain. Brain Res. 851, 261–265. doi: 10.1016/s0006-8993(99)02135-6
Milligan, S., Martin, G. G., Landrock, D., McIntosh, A. L., Mackie, J. T., Schroeder, F., et al. (2017). Impact of dietary phytol on lipid metabolism in SCP2/SCPX/L-FABP null mice. Biochim. Biophys. Acta Mol. Cell Biol. Lipids 1862, 291–304. doi: 10.1016/j.bbalip.2016.12.002
Nigro, J. M., Baker, S. J., Preisinger, A. C., Jessup, J. M., Hostetter, R., Cleary, K., et al. (1989). Mutations in the p53 gene occur in diverse human tumour types. Nature 342, 705–708. doi: 10.1038/342705a0
Qi, M., Liu, D. M., Ji, W., and Wang, H. L. (2020). ATP6V0D2, a subunit associated with proton transport, serves an oncogenic role in esophagus cancer and is correlated with epithelial-mesenchymal transition. Esophagus 17, 456–467. doi: 10.1007/s10388-020-00735-8
Rioli, V., Gozzo, F. C., Heimann, A. S., Linardi, A., Krieger, J. E., Shida, C. S., et al. (2003). Novel natural peptide substrates for endopeptidase 24.15, neurolysin, and angiotensin-converting enzyme. J. Biol. Chem. 278, 8547–8555. doi: 10.1074/jbc.M212030200
Sadaria, M. R., Yu, J. A., Meng, X., Fullerton, D. A., Reece, T. B., and Weyant, M. J. (2013). Secretory phospholipase A2 mediates human esophageal adenocarcinoma cell growth and proliferation via ERK 1/2 pathway. Anticancer Res. 33, 1337–1342.
Shannon, P., Markiel, A., Ozier, O., Baliga, N. S., Wang, J. T., Ramage, D., et al. (2003). Cytoscape: a software environment for integrated models of biomolecular interaction networks. Genome Res. 13, 2498–2504. doi: 10.1101/gr.1239303
Shi, W., Gao, Z., Song, J., and Wang, W. (2020). Silence of FOXD2-AS1 inhibited the proliferation and invasion of esophagus cells by regulating miR-145-5p/CDK6 axis. Histol. Histopathol. 35, 1013–1021. doi: 10.14670/HH-18-232
Shi, X., Zhang, L., Bai, K., Xie, H., Shi, T., Zhang, R., et al. (2020). Identification of rare variants in novel candidate genes in pulmonary atresia patients by next generation sequencing. Comput. Struct. Biotechnol. J. 18, 381–392. doi: 10.1016/j.csbj.2020.01.011
Shi, X., Cheng, L., Jiao, X., Chen, B., Li, Z., Liang, Y., et al. (2018a). Rare copy number variants identify novel genes in sporadic total anomalous pulmonary vein connection. Front. Genet. 9:559. doi: 10.3389/fgene.2018.00559
Shi, X., Huang, T., Wang, J., Liang, Y., Gu, C., Xu, Y., et al. (2018b). Next-generation sequencing identifies novel genes with rare variants in total anomalous pulmonary venous connection. EBioMedicine 38, 217–227. doi: 10.1016/j.ebiom.2018.11.008
Shoushtari, A. N., and Carvajal, R. D. (2014). GNAQ and GNA11 mutations in uveal melanoma. Melanoma Res. 24, 525–534. doi: 10.1097/CMR.0000000000000121
Stegh, A. H. (2012). Targeting the p53 signaling pathway in cancer therapy - the promises, challenges and perils. Expert Opin. Ther. Targets 16, 67–83. doi: 10.1517/14728222.2011.643299
Tang, Z., Li, C., Kang, B., Gao, G., Li, C., and Zhang, Z. (2017). GEPIA: a web server for cancer and normal gene expression profiling and interactive analyses. Nucleic Acids Res. 45, W98–W102. doi: 10.1093/nar/gkx247
Then, E. O., Lopez, M., Saleem, S., Gayam, V., Sunkara, T., Culliford, A., et al. (2020). Esophageal cancer: an updated surveillance epidemiology and end results database analysis. World J. Oncol. 11, 55–64. doi: 10.14740/wjon1254
Wang, A. H., Liu, Y., Wang, B., He, Y. X., Fang, Y. X., and Yan, Y. P. (2014). Epidemiological studies of esophageal cancer in the era of genome-wide association studies. World J. Gastrointest Pathophysiol. 5, 335–343. doi: 10.4291/wjgp.v5.i3.335
Wang, D., Xu, Y., Feng, L., Yin, P., Song, S. S., Wu, F., et al. (2019). RGS5 decreases the proliferation of human ovarian carcinomaderived primary endothelial cells through the MAPK/ERK signaling pathway in hypoxia. Oncol. Rep. 41, 165–177. doi: 10.3892/or.2018.6811
Wang, Q., Ma, C., and Kemmner, W. (2013). Wdr66 is a novel marker for risk stratification and involved in epithelial-mesenchymal transition of esophageal squamous cell carcinoma. BMC Cancer 13:137. doi: 10.1186/1471-2407-13-137
Whorton, J., Sureban, S. M., May, R., Qu, D., Lightfoot, S. A., Madhoun, M., et al. (2015). DCLK1 is detectable in plasma of patients with Barrett’s esophagus and esophageal adenocarcinoma. Dig. Dis. Sci. 60, 509–513. doi: 10.1007/s10620-014-3347-4
Zhang, F., Xiong, Q., Tao, H., Liu, Y., Zhang, N., Li, X. F., et al. (2021). ACOX1, regulated by C/EBPalpha and miR-25-3p, promotes bovine preadipocyte adipogenesis. J. Mol. Endocrinol. 66, 195–205. doi: 10.1530/JME-20-0250
Zhang, H., Zhong, J., Tu, Y., Liu, B., Chen, Z., Luo, Y., et al. (2019). Integrated bioinformatics analysis identifies hub genes associated with the pathogenesis and prognosis of esophageal squamous cell carcinoma. Biomed. Res. Int. 2019:2615921. doi: 10.1155/2019/2615921
Zhang, T., Wang, Q., Ma, W. Y., Wang, K., Chang, X., Johnson, M. L., et al. (2019). Targeting the COX1/2-Driven thromboxane A2 pathway suppresses Barrett’s esophagus and esophageal adenocarcinoma development. EBioMedicine 49, 145–156. doi: 10.1016/j.ebiom.2019.10.038
Keywords: esophageal adenocarcinoma, esophageal squamous cell carcinoma, hub genes, prognosis, biomarkers
Citation: Wang F, Zhang L, Xu Y, Xie Y and Li S (2021) Comprehensive Analysis and Identification of Key Driver Genes for Distinguishing Between Esophageal Adenocarcinoma and Squamous Cell Carcinoma. Front. Cell Dev. Biol. 9:676156. doi: 10.3389/fcell.2021.676156
Received: 04 March 2021; Accepted: 09 April 2021;
Published: 28 May 2021.
Edited by:
Tao Huang, Shanghai Institute of Nutrition and Health, Chinese Academy of Sciences, ChinaReviewed by:
Shuqun Zhang, The Second Affiliated Hospital of Xi’an Jiaotong University, ChinaMin Zheng, Shanghai Jiao Tong University School of Medicine, China
Copyright © 2021 Wang, Zhang, Xu, Xie and Li. This is an open-access article distributed under the terms of the Creative Commons Attribution License (CC BY). The use, distribution or reproduction in other forums is permitted, provided the original author(s) and the copyright owner(s) are credited and that the original publication in this journal is cited, in accordance with accepted academic practice. No use, distribution or reproduction is permitted which does not comply with these terms.
*Correspondence: Shenglei Li, bGFpeW91NjYwNjJAMTYzLmNvbQ==