 Zijun Wu
 Dan Wang1†
 Fanxin Zeng
 Guannan Zhu
 Yiqi Ma
 Bin Song
 Su Lui
 Min Wu
- 1Huaxi MR Research Center, Department of Radiology, Functional and Molecular Imaging Key Laboratory of Sichuan Province, West China Hospital, Sichuan University, Chengdu, China
- 2Department of Clinic Medical Center, Dazhou Central Hospital, Dazhou, China
- 3Department of Radiology, School of Medicine, Stanford University, Stanford, CA, United States
Objective: Immediate early response 5 (IER5) plays a core role in cell cycle and response to irradiation. However, its role in glioma remains unclear. We aimed to evaluate its prognostic significance in glioma based on The Cancer Genome Atlas data resource.
Methods: The Kruskal–Wallis test, Wilcoxon signed-rank test, and logistic regression were employed to explore the relationship between IER5 expression and clinicopathological features. Kaplan–Meier and Cox regression analyses were implemented to investigate the relationship of IER5 with prognosis. A nomogram to estimate the impact of IER5 on prognosis was created based on the Cox multivariate data. We performed gene set enrichment analysis (GSEA) to determine the key signaling cascades associated with IER5. Immunohistochemistry was performed to examine IER5 expression in a tissue microarray (TMA) of glioma samples.
Results: Immediate early response 5 gene expression was elevated in glioma patients. The level of IER5 was significantly correlated with WHO grade [OR = 6.71 (4.34–10.68) for G4 vs. G2 and G3], IDH (isocitrate dehydrogenase enzyme) status [OR = 13.35 (8.92–20.46) for wild-type (WT) vs. mutated (Mut)], epidermal growth factor receptor status [OR = 8.42 (4.32–18.43) for Mut vs. WT], age [OR = 0.27 (0.18–0.41) for ≤ 60 years vs. >60 years], and histological type [OR = 7.13 (4.63–11.31] for glioblastoma vs. astrocytoma, oligoastrocytoma, and oligodendroglioma). Univariate analyses revealed that high IER5 expression was linked to short overall survival (OS) [hazard ratio (HR): 3.747; 95% confidence interval (CI): 2.847–4.933; and P < 0.001]. High IER5 expression was linked to poor OS in multivariate analyses (HR: 2.474; 95% CI: 1.552–3.943; and P < 0.001). TMA results showed that high IER5 protein levels were related to short OS (HR: 1.84; 95% CI: 1.10–3.07; and P = 0.021) and poor disease-specific survival (HR: 1.82; 95% CI: 1.09–3.04; and P = 0.023). GSEA showed that many tumor related pathways were enriched differentially in the IER5-high expression group. The C-index and calibration plots of the nomogram showed an effective estimation performance in glioma patients.
Conclusion: Herein, we established that IER5 plays a critical role in glioma progression and prognosis, which might be an important biomarker for the prognosis of glioma patients.
Introduction
Glioma is one of the most destructive brain tumors and has high morbidity and mortality rates (Kleihues et al., 2002; Louis et al., 2007). High-grade glioma responds poorly to conventional treatment approaches, e.g., surgical resection, postoperative radiotherapy, as well as chemotherapy (Stupp et al., 2005; Vredenburgh et al., 2007). The prognosis of individuals with high-grade glioma has not been considerably improved in recent years. Although surgery, radiotherapy and chemotherapy have increased the median survival time to 12–15 months (Gusyatiner and Hegi, 2018), the 5-year survival rate of individuals with high-grade glioma is less than 5% (Ostrom et al., 2014b). Glioma is an intricate disease with genome instability resulting from accumulating genetic changes. Many oncogene interactions and molecular networks are related to the genesis and progression of glioma. Identifying the oncogenes involved is crucial for determining treatment strategies and evaluating prognosis. Therefore, it is particularly urgent to find biomarkers that are related to the clinical stage of tumors and can be employed to estimate the prognosis of patients. Although many molecular biomarkers are linked to glioma, such as isocitrate dehydrogenase enzyme 1/2 (IDH1/2) mutation and epidermal growth factor receptor (EGFR) overexpression, their reliability and clinical significance are still controversial and need more research (Thakkar et al., 2014; Alexander and Cloughesy, 2017).
The immediate early response 5 (IER5) gene codes for a protein that belongs to the immediate early response (IER) protein family. This protein may have a pivotal role in the modulation of the cell response to mitogenic signals. Specifically, it participates in the modulation of the cell cycle, proliferation, resistance to thermal stress, and cell survival under ionizing irradiation (Nakamura et al., 2011; Ishikawa and Sakurai, 2015; Ishikawa et al., 2015; Kawabata et al., 2015). A study found that the overexpression of IER5 may help HeLa cervical carcinoma cells recover viability after thermal stress through the refolding of heat-denatured proteins (Ishikawa and Sakurai, 2015). Another study found that the overexpression of IER5 promotes tumor cell anchorage-independent-growth under stress conditions through HSF1 activation (Asano et al., 2016). However, there are no reports available about the relationship between IER5 and glioma.
In this research, we used tumor RNA sequencing data obtained from The Cancer Genome Atlas (TCGA) data resource. We explored the gene expression level of IER5 in glioma and non-malignant brain tissues. Then, we investigated the relationship of IER5 expression with clinicopathological features. We also analyzed the effect of the IER5 gene on glioma prognosis through multivariate Cox regression analysis. The regression model was based on IER5 gene expression and clinicopathological characteristics. To predict glioma patient prognosis, we developed a nomogram consisting of the expression level of IER5 and clinicopathological characteristics. We further grouped samples according to the IER5 gene expression level, and we compared the transcriptome and expression difference between the high- and low- IER5 expression groups. We explored IER5 protein levels by quantitative immunohistochemistry (IHC) in a tissue microarray (TMA) of glioma samples from patients with known clinical outcomes. We also validated the prognosis value of IER5 in three independent datasets in Chinese Glioma Genome Atlas (CGGA). To reveal which genes and functional pathways are highly correlated with the expression of IER5, gene ontology (GO) along with Kyoto Encyclopedia of Genes and Genomes (KEGG) analyses, and gene set enrichment analysis (GSEA) were performed. Finally, we explored and discussed the possible mechanism between the expression of IER5 and the development of tumors by analyzing the relationship of IER5 expression with tumor immune infiltrates.
Our results may reveal new targets and strategies for glioma diagnosis and treatment. Our data suggest that IER5 expression can be utilized as a prognostic biomarker for the assessment of disease progression or as a prospective therapeutic target for glioma patients.
Experimental Procedures
RNA Sequencing Data and Bioinformatics Analysis
From the TCGA data resource, a total of 670 glioma patients with gene expression data (level 3 HTSeq-FPKM and HTSeq-counts) and clinical data including glioblastoma multiforme and low-grade glioma projects were collected. The normal brain tissue RNA-seq data were collected from GTEx datasets. Afterward, all the RNA-seq data were processed uniformly by the Toil process (Vivian et al., 2017) and converted to transcripts per million reads (TPM) values, and all subsequent analyses were performed using the TPM values. Clinical features of the patients, including age, histological type, gender, 1p/19q codeletion, race, WHO grade, IDH status, primary therapy outcome, EGFR status, and PI3CA status, were collected. Our study satisfies the publication guidelines provided by TCGA. To further validate the prognosis value of IER5, three independent datasets in the CGGA were used. The CGGA database includes brain tumors datasets over 2,000 samples from Chinese cohorts1. The IER5 expression patterns in cancer cell lines were obtained from Broad Institute Cancer Cell Line Encyclopedia (Barretina et al., 2012). The protein expression of IER5 in U251 cell were obtained from the cell atlas in The Human Protein Atlas (Pontén et al., 2008).
Differentially Expressed Gene Analysis
The patients were grouped into high- and low- expression groups on the basis of the median value of IER5 expression. We compared the expression profiles (HTseq-Counts) between the high- and low-IER5 expression groups to identify differentially expressed gene (DEGs) using the DESeq2 R package (Love et al., 2014). The thresholds values for the DEGs were | log2 fold change (FC) | > 2.0 along with adjusted P < 0.01.
Metascape Analysis
The Metascape resource2 is a reliable tool utilized to perform gene annotation, as well as gene list enrichment analysis (Zhou et al., 2019). Herein, we used Metascape to explore the enrichment of IER5-linked DEGs categorized by process, as well as pathway. Only the terms with P < 0.01, an enrichment factor > 1.5, and a minimum count of 3 were considered to be remarkably different between the groups. The PPI (protein-protein interaction) enrichment analysis in Metascape used the following data resources: BioGrid, OminiPath, and InWeb_IM. Besides, the MCODE (Molecular Complex Detection) algorithm was employed to uncover the densely connected network constituents.
Gene Set Enrichment Analysis
To identify the remarkable functional and cascade differences between the high- and low- IER5 groups, we used the R package clusterProfiler (3.14.3) to perform GSEA (Yu et al., 2012). For every analysis, we performed 1000 gene set permutations. Only terms with |NES| > 1, adjusted P < 0.05, as well as FDR q value < 0.25 were considered to be remarkably differentially enriched between the groups.
Immune Infiltration Analysis
We employed the ssGSEA (single-sample gene set enrichment analysis) method from the GSVA package3 in R (v3.6.2) to perform analysis of the association of immune infiltration with IER5 expression. We analyzed the invading levels of 24 immune cell types on the basis of the signature genes published in a previous study (Bindea et al., 2013). We employed Spearman correlation analysis to determine the association of IER5 with immune cells, and the Wilcoxon rank sum test to explore the differences in the invasion of immune cells between the high- and low-IER5 expression groups.
Human Glioma Tissue Microarray and Immunohistochemistry
Immunohistochemistry studies of IER5 were performed on glioma samples in a TMA. The human glioma TMA (Product number: HBraG180Su01) was purchased from Shanghai Outdo Biotech Co., Ltd. (Shanghai, China). Ethical approval was granted by ethics committee of Shanghai Outdo Biotech Company. The 180 cases of glioma in this microarray were from Chinese National Human Genetic Resources Sharing Service Platform4. And the platform number is 2005DKA21300. In brief, all the samples were incubated with an anti-IER5 antibody (Invitrogen, PA5-56287, United States; 1:300 dilution) overnight at 4°C. Afterward, the samples were incubated with HRP-labeled secondary antibodies for 1 h at 37°C. Finally, the samples were stained and imaged. EnVision Plus System-HRP (K8002, DAKO, Denmark) was employed, and IER5 was visualized with diaminobenzidine (DAB) as the substrate. The nucleus was stained with Mayer’s hematoxylin counterstain (GT100540, Gene). The assessment of IHC data was carried out by two readers and verified by two independent pathologists blinded to the clinicopathologic information. The staining intensity was defined as: 3 (strong), 2 (moderate), 1 (weak), and 0 (negative). Negative and weak staining intensity was classified as low IER5 expression, whereas strong and moderate staining intensity was classified as high IER5 expression.
Statistical Analyses
All statistical analyses were conducted using R. Wilcoxon signed rank test and Wilcoxon rank sum test were implemented to investigate the expression of IER5 in tumor and control samples. The Kruskal–Wallis test, Spearman’s correlation test, Wilcoxon signed rank test, along with Wilcoxon rank sum test were employed to analyze the correlations between clinicopathological features and the expression of IER5. Pearson’s χ2 test, Fisher’s exact test and univariate logistic regression were implemented to assess the association of clinicopathological variables with the expression of IER5. Univariate along with multivariate Cox regression analyses were performed to establish independent variables. In univariate analyses, the significant variables (P < 0.1) were then put into the multivariate analysis. The Kaplan–Meier approach with 95% confidence intervals (95% CIs) and the log-rank test were used to construct the survival curves and compare them. In this study, receiver operating characteristic (ROC) assessment was performed with the pROC package (v1.8) to evaluate the effectiveness of the expression level of IER5 for discriminating glioma from healthy samples (Robin et al., 2011). On the basis of Multivariate Cox regression analysis results, a nomogram was constructed with the R packages rms to establish the individual survival probability of patients with glioma. In all tests, P values were two sided, and P < 0.05 signified statistical significance.
Results
Clinical Characteristics
The clinical characteristics of glioma patients from TCGA consisting of primary therapy outcome, WHO grade, histological type, IDH status, gender, 1p/19q codeletion, age, race, EGFR status, and PIK3CA status were collected. As shown in Table 1, a total of 284 females and 386 males were analyzed in this study. The association analysis illustrated that IER5 expression was remarkably linked to WHO grade (P < 0.001), primary therapy outcome (P = 0.018), histological type (P < 0.001), 1p/19q codeletion (P = 0.002), EGFR status (P < 0.001), IDH status (P < 0.001), and age (P < 0.001). No remarkable association of gene expression with other clinicopathologic features was observed (Table 1).
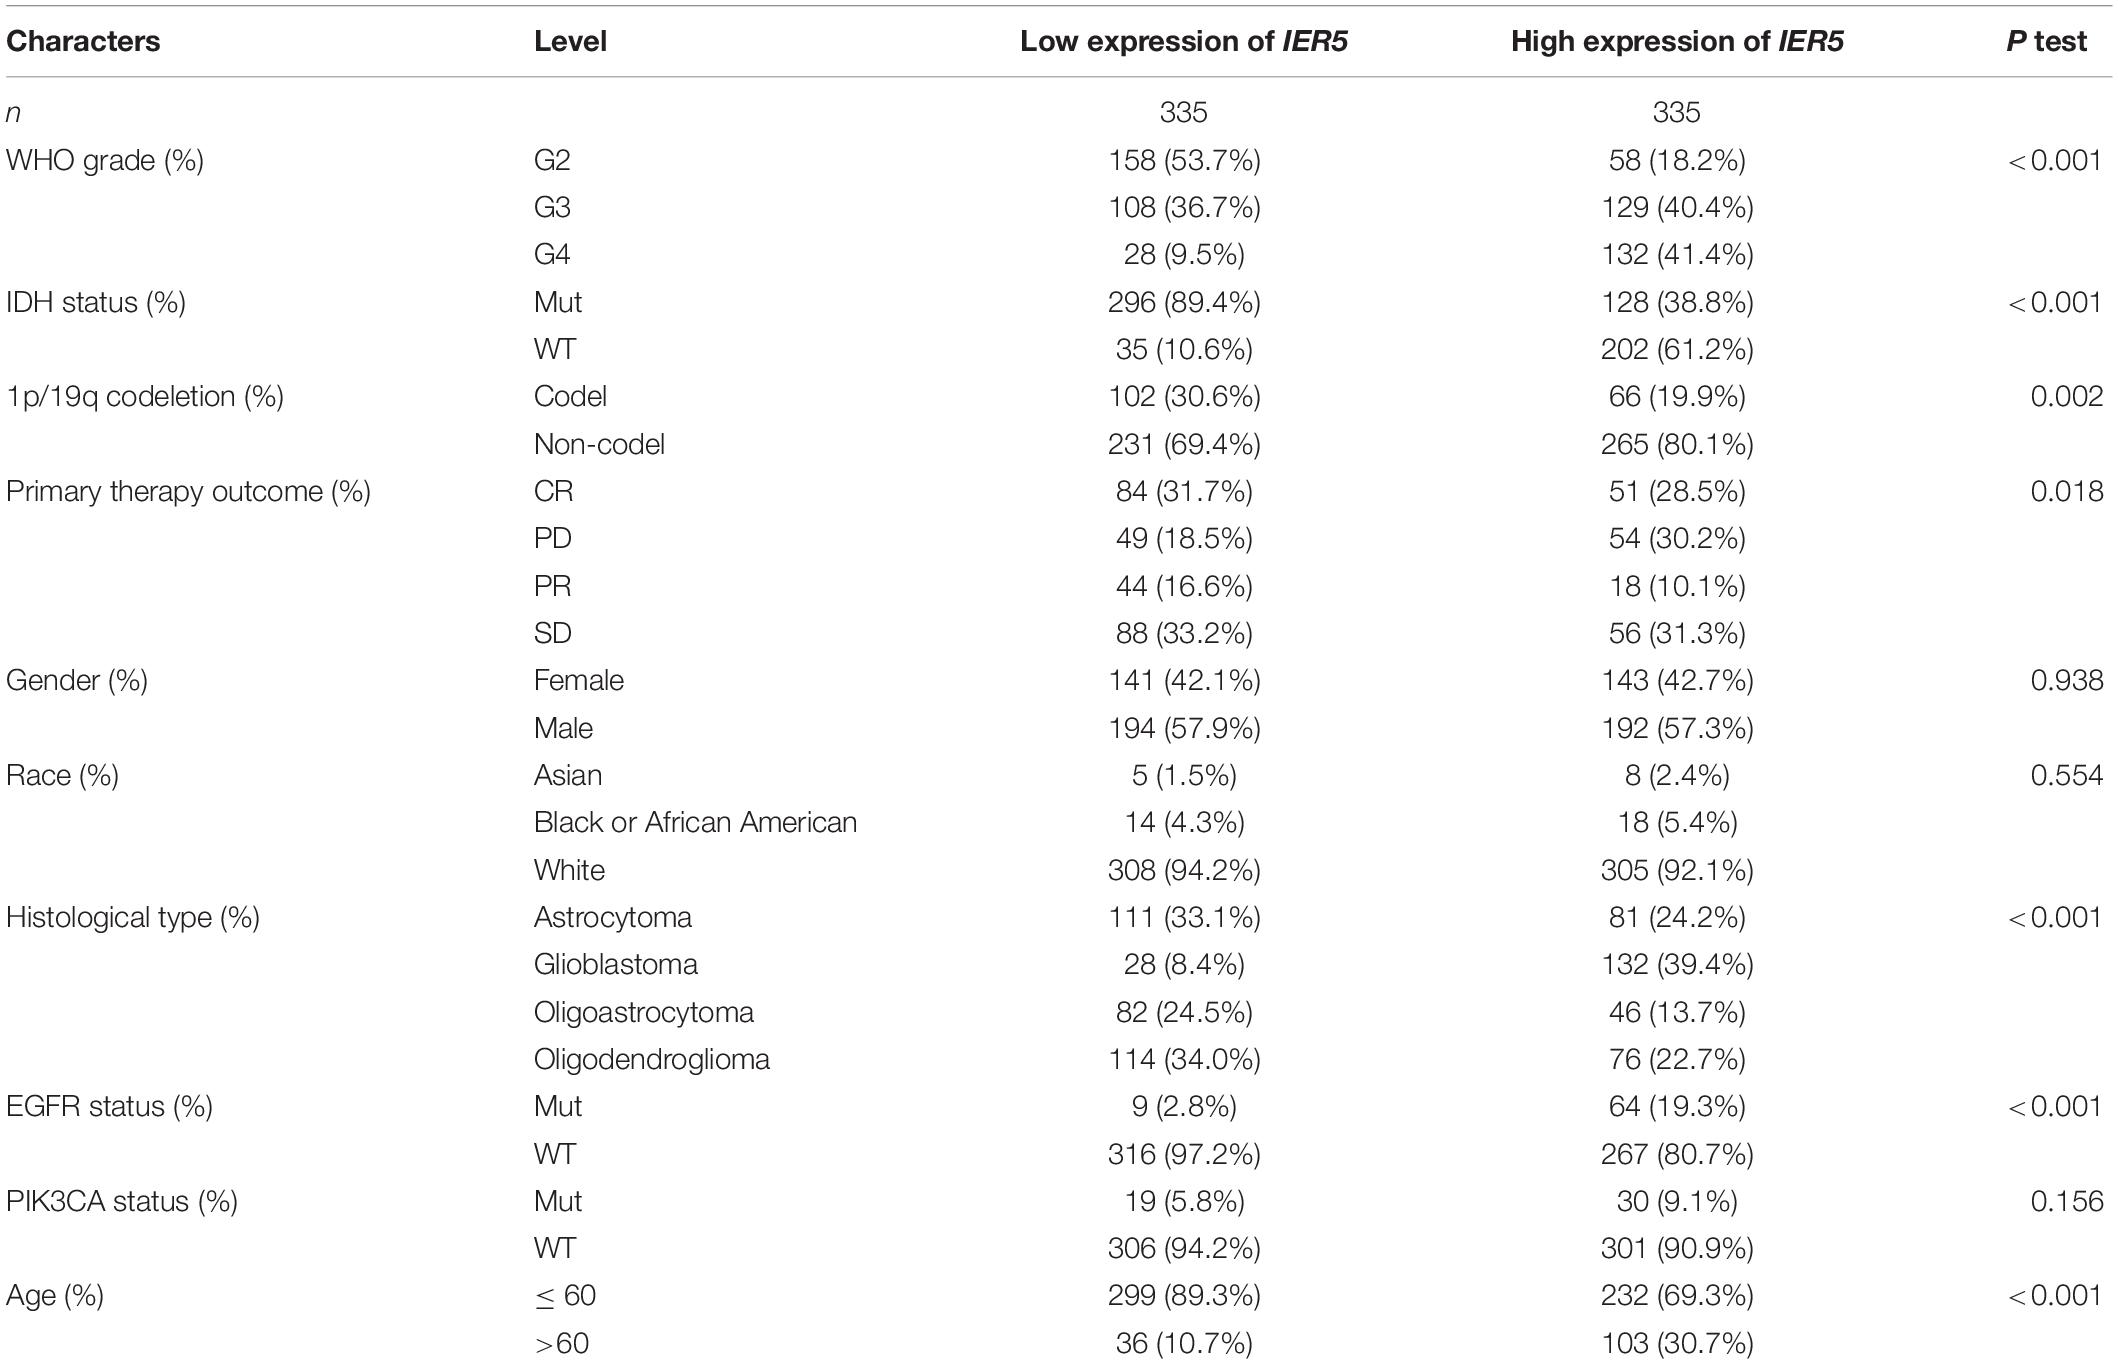
Table 1. Characteristics of patients with glioma based on TCGA.
Relationship of IER5 Expression With Clinicopathologic Features
As shown in Figure 1, we used Wilcoxon signed rank tests to analyze the expression level of IER5 in tumor and non-malignant tissues. IER5 expression showed promising discrimination value, and the AUC (area under the ROC curve) value of IER5 expression for discriminating tumors from healthy tissues was 0.830 (Figure 1B). The results showed that there was remarkably higher expression of IER5 in tumor tissues in contrast with healthy tissues. In the pan-cancer analysis (Figure 1C), the results illustrated that the expression of IER5 were elevated in many kinds of tumors. In addition, we also analyzed the expression of IER5 in cancer cell lines. Immunocytochemical analysis reveled that IER5 fluorescence was mainly distributed in the nucleus in U251 cell lines (Figure 2A). Moreover, the expression of IER5 mRNA in different cancer cell lines and glioma cell lines are showed in Figures 2B,C. All these results indicate that the expression of IER5 is significantly up-regulated in glioma. As shown in Figure 3, the Wilcoxon rank sum test along with the Kruskal–Wallis rank sum test illustrated that the level of IER5 was dramatically associated with WHO grade (P < 0.001), EGFR status (P < 0.001), IDH status (P < 0.001), primary therapy outcome (P = 0.018), histological type (P < 0.001), 1p/19q codeletion (P = 0.002), and age (P < 0.001).
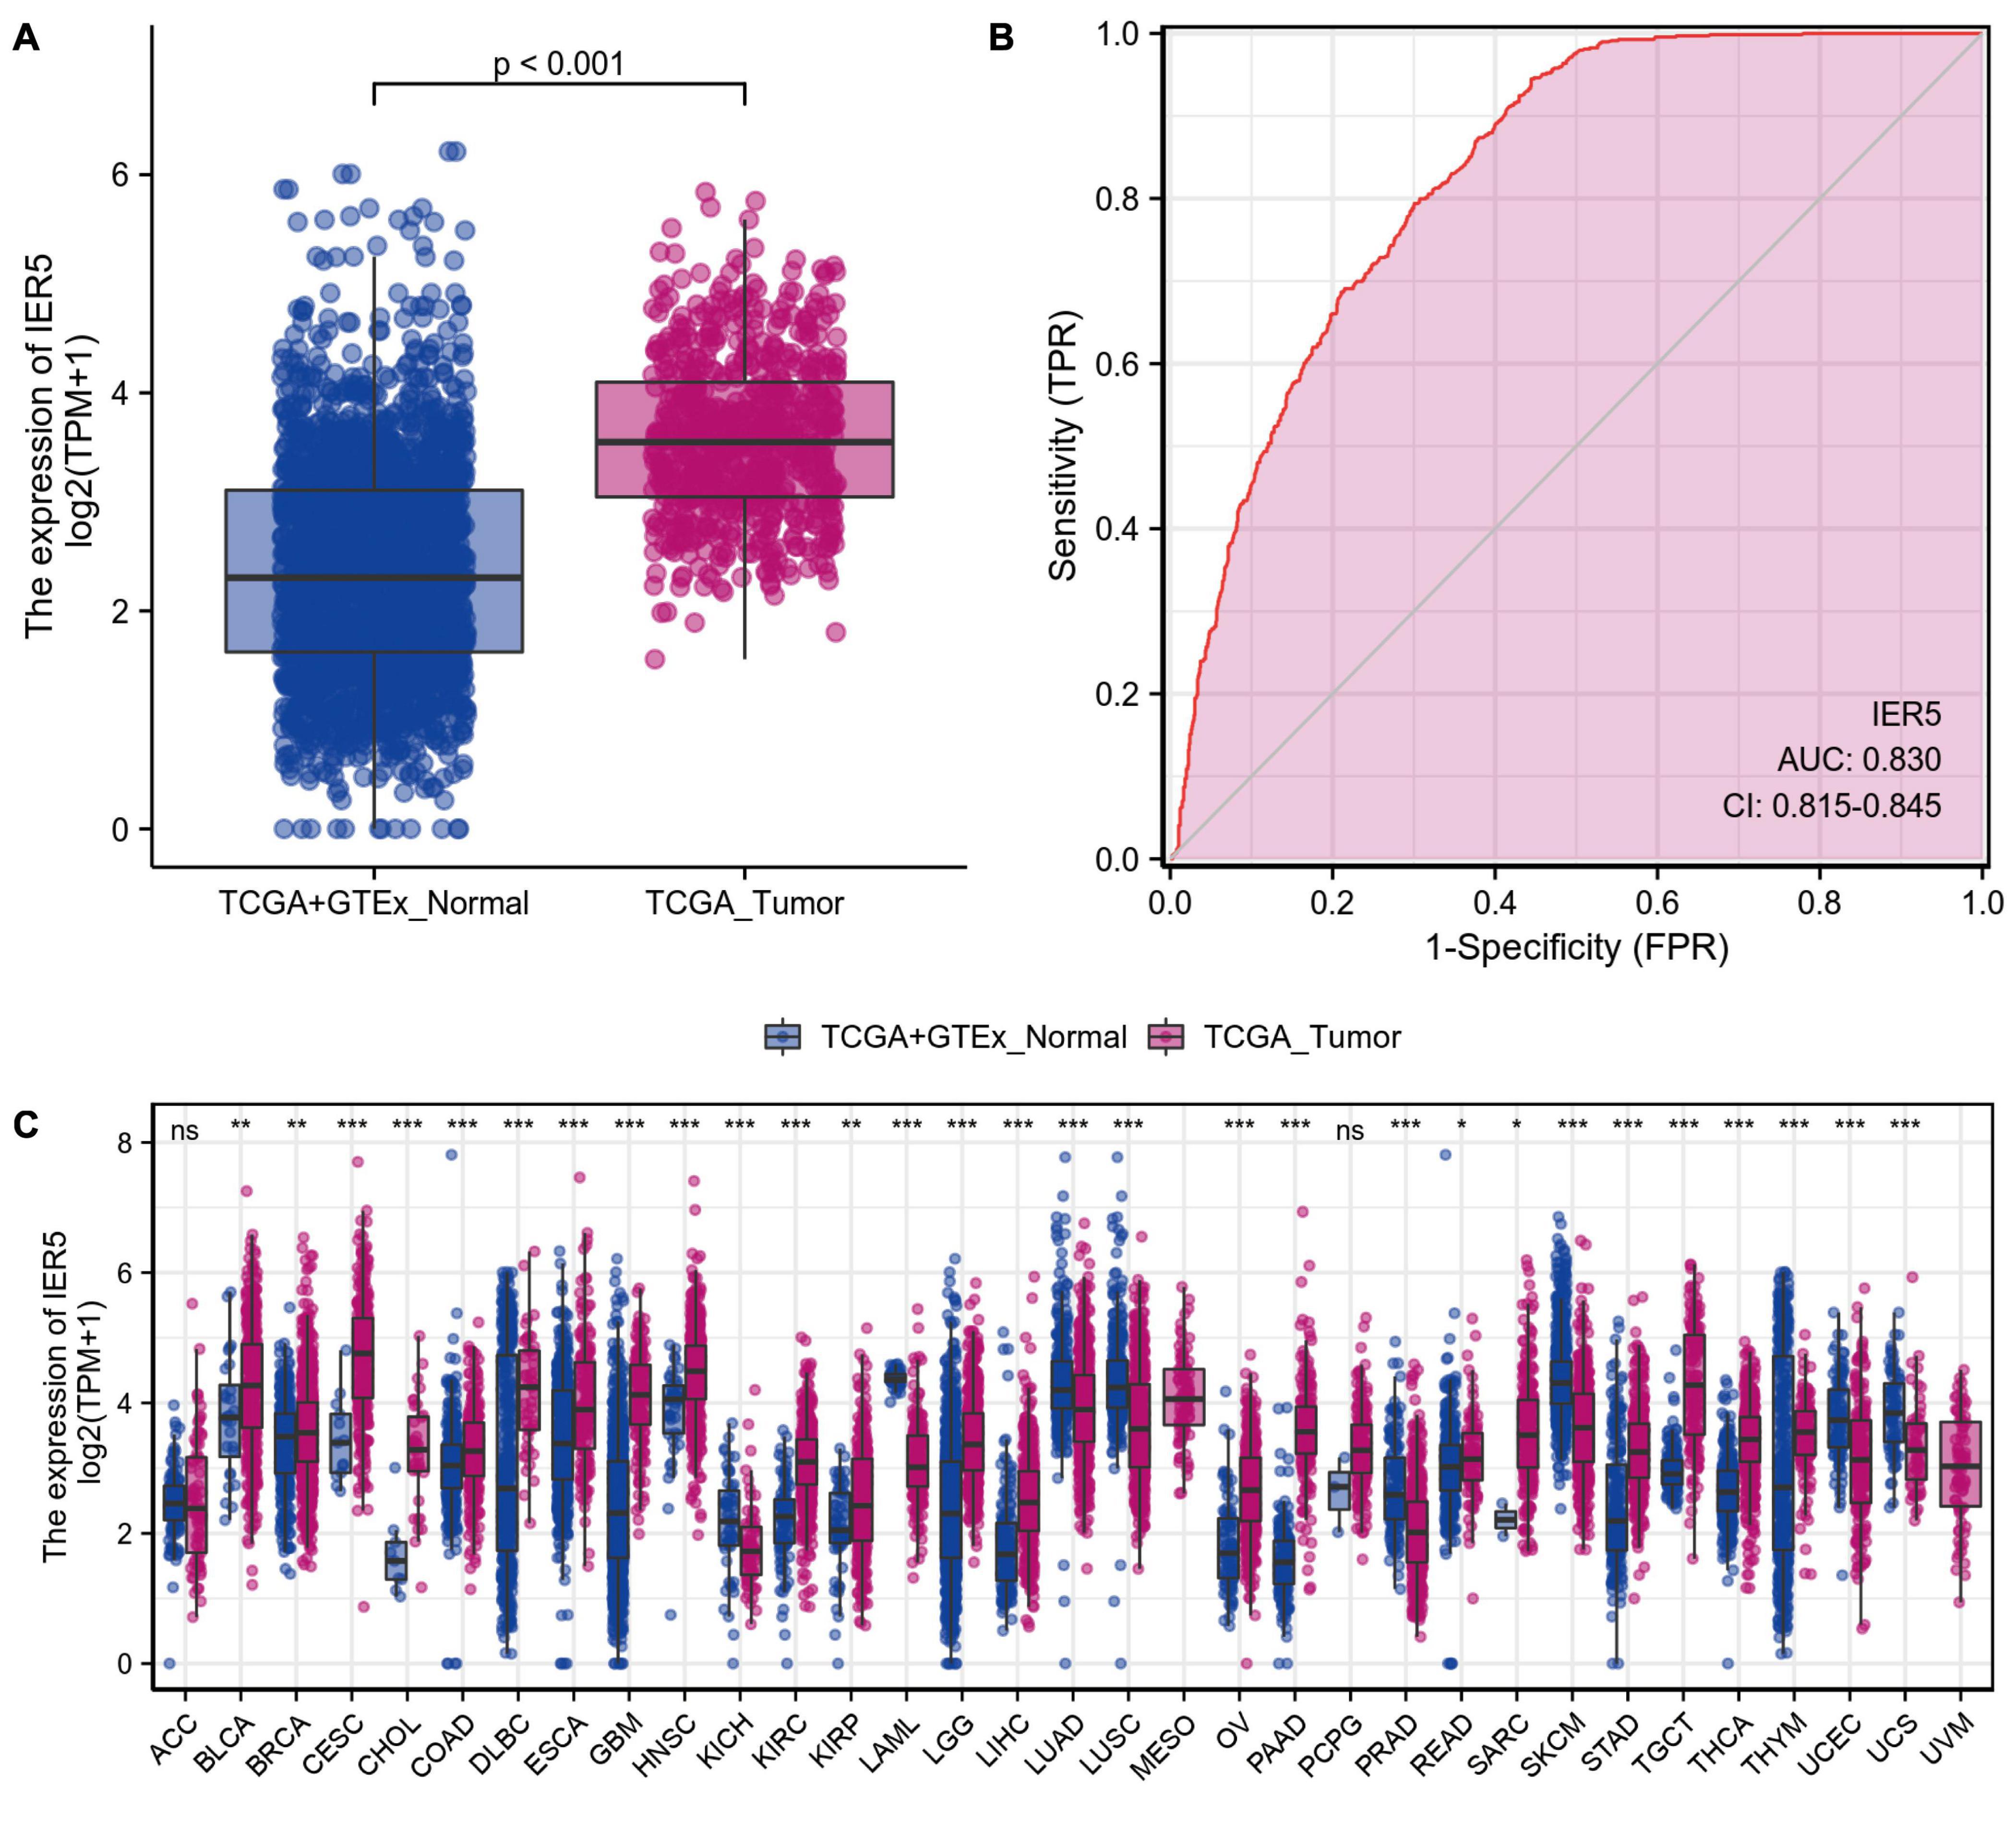
Figure 1. The difference in IER5 expression levels between tumor and normal tissues. (A) Expression levels of IER5 in glioma and normal samples. (B) ROC analysis of IER5 expression showing promising discrimination power between glioma and non-tumor tissues. (C) Pancancer analysis of IER5 expression across cancers from TCGA. ns, no significance, P < 0.05; *, P < 0.05; **, P < 0.01; ***, P < 0.001.
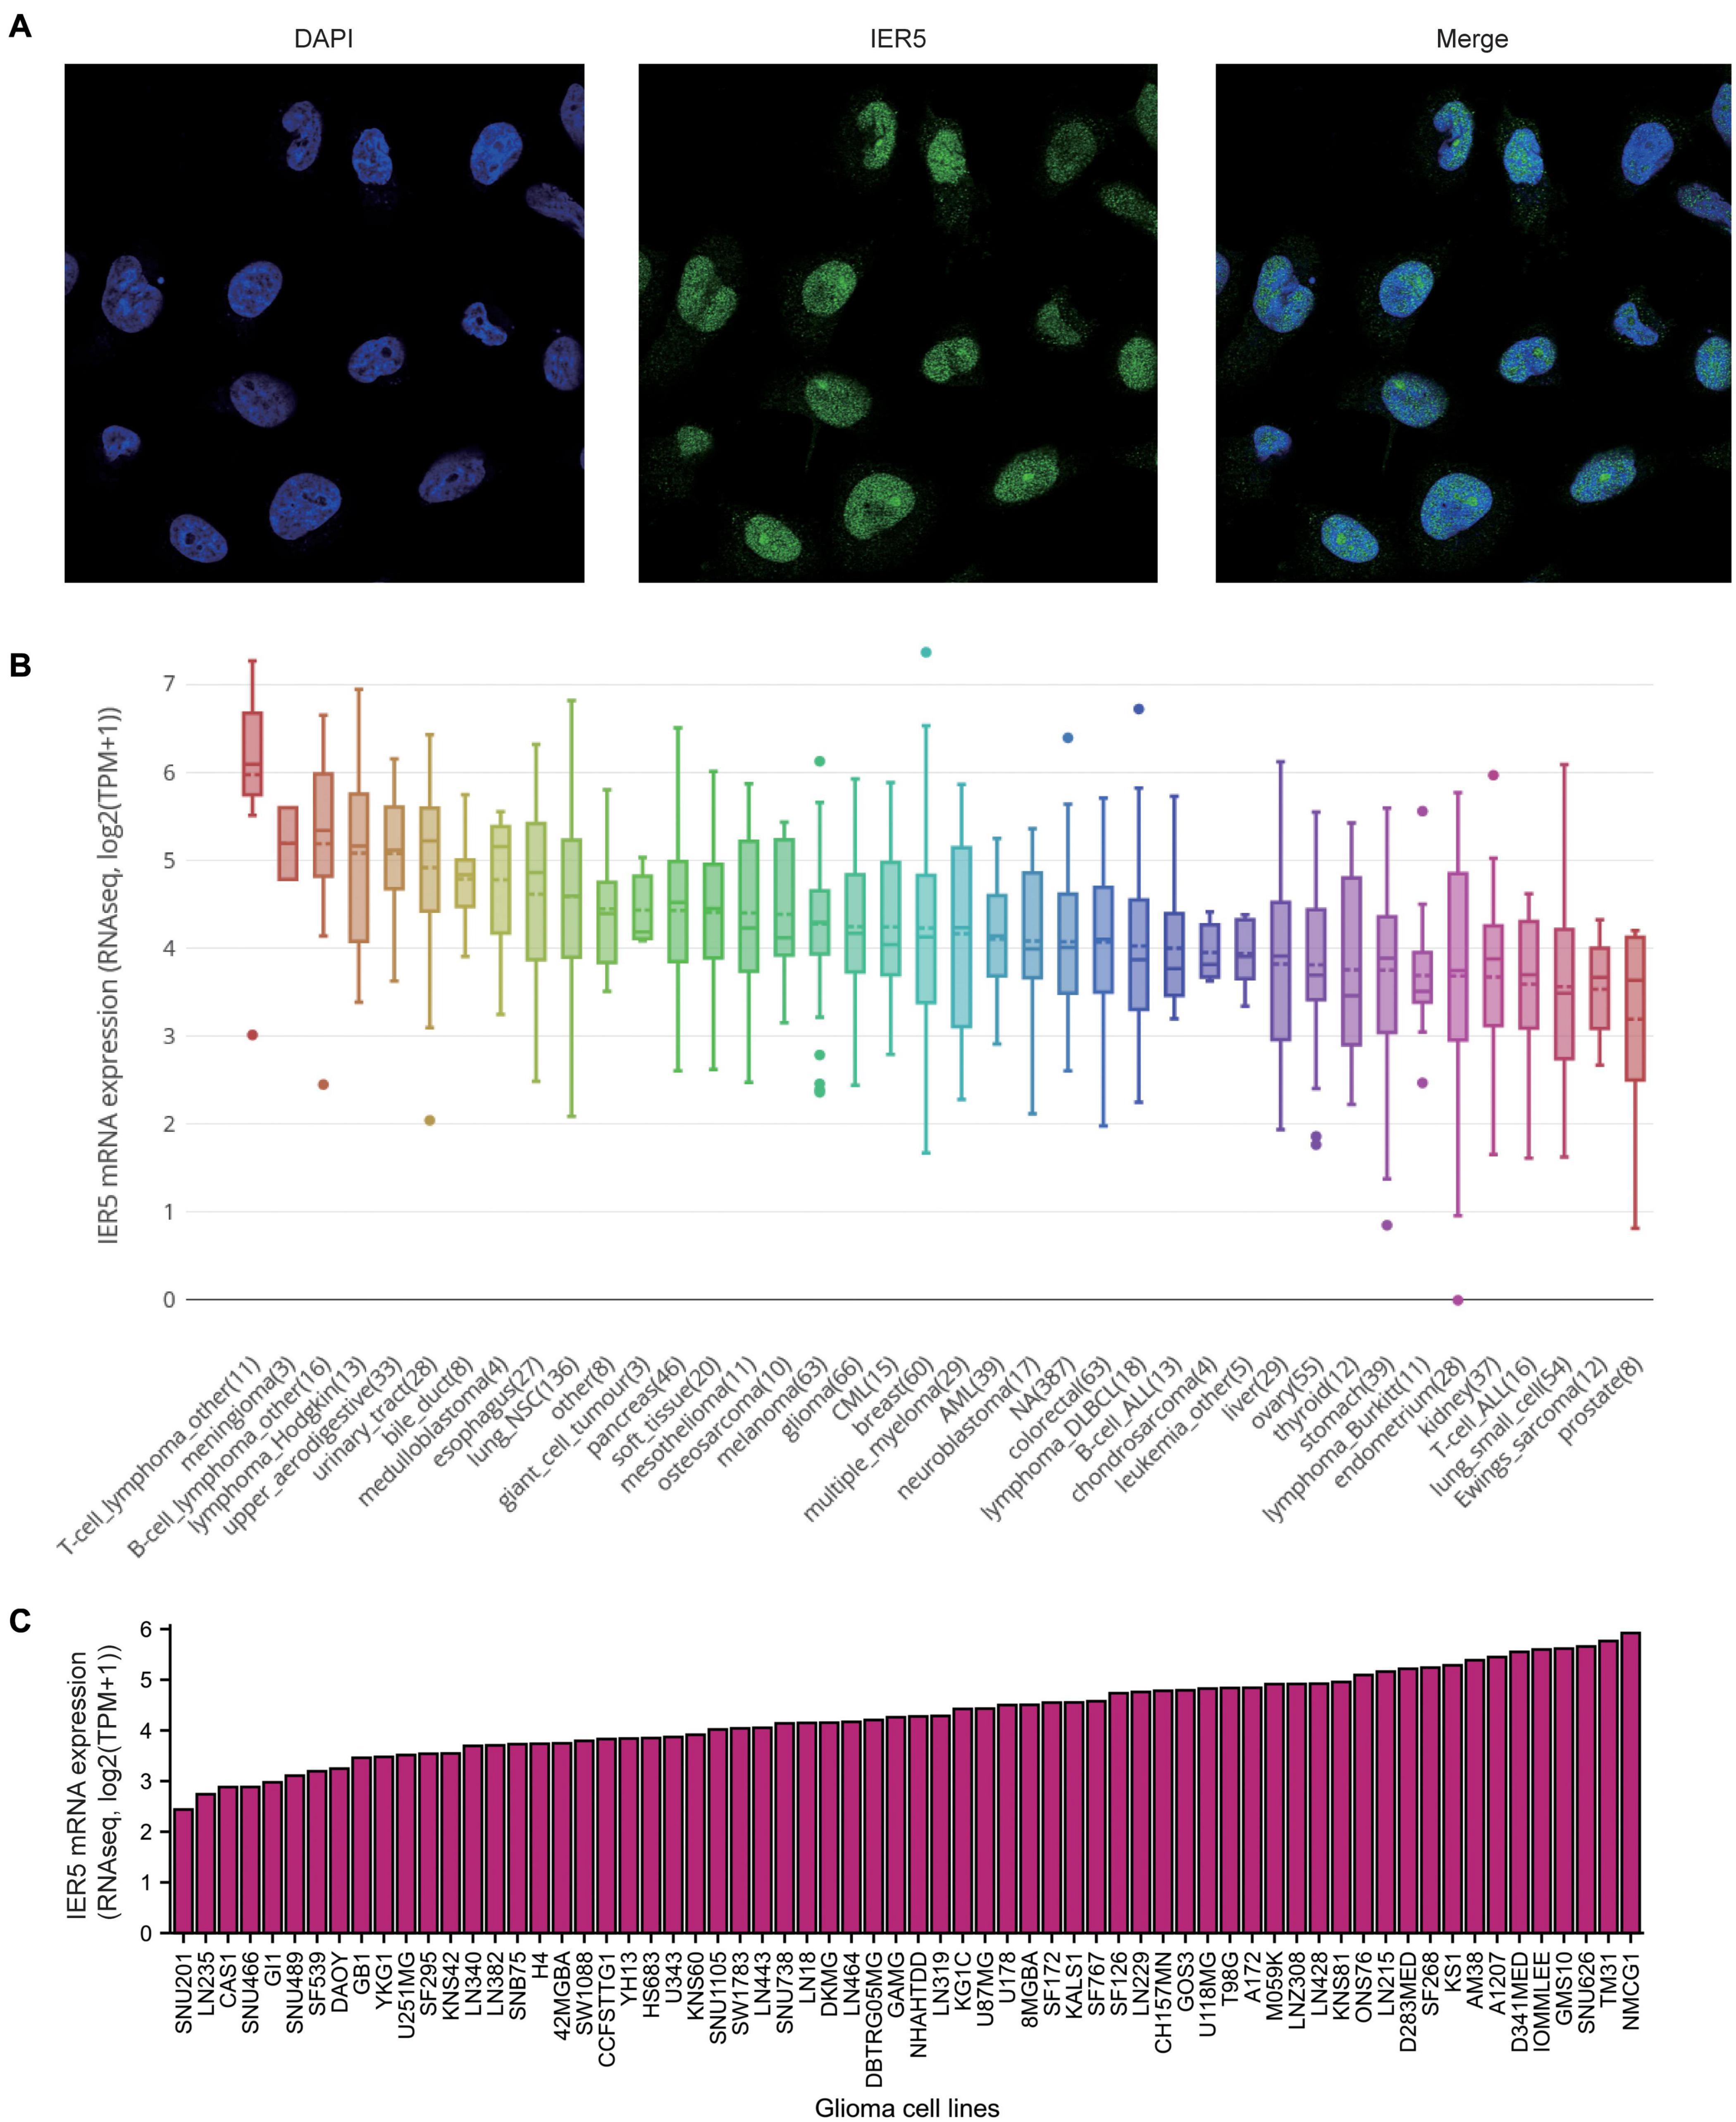
Figure 2. Expression of IER5 at protein levels in U251 cell lines and at mRNA levels in different glioma cell lines. (A) Gene expression of IER5 was identified using immunofluorescence in U251 cell lines, these data are from The Human Protein Atlas databases. (B) IER5 expression patterns in 1457 cell lines representing 40 distinct tumor types, these data are from The Cancer Cell Line Encyclopedia (CCLE) databases. (C) IER5 expression patterns in 66 glioma cell lines, these data are from CCLE databases.
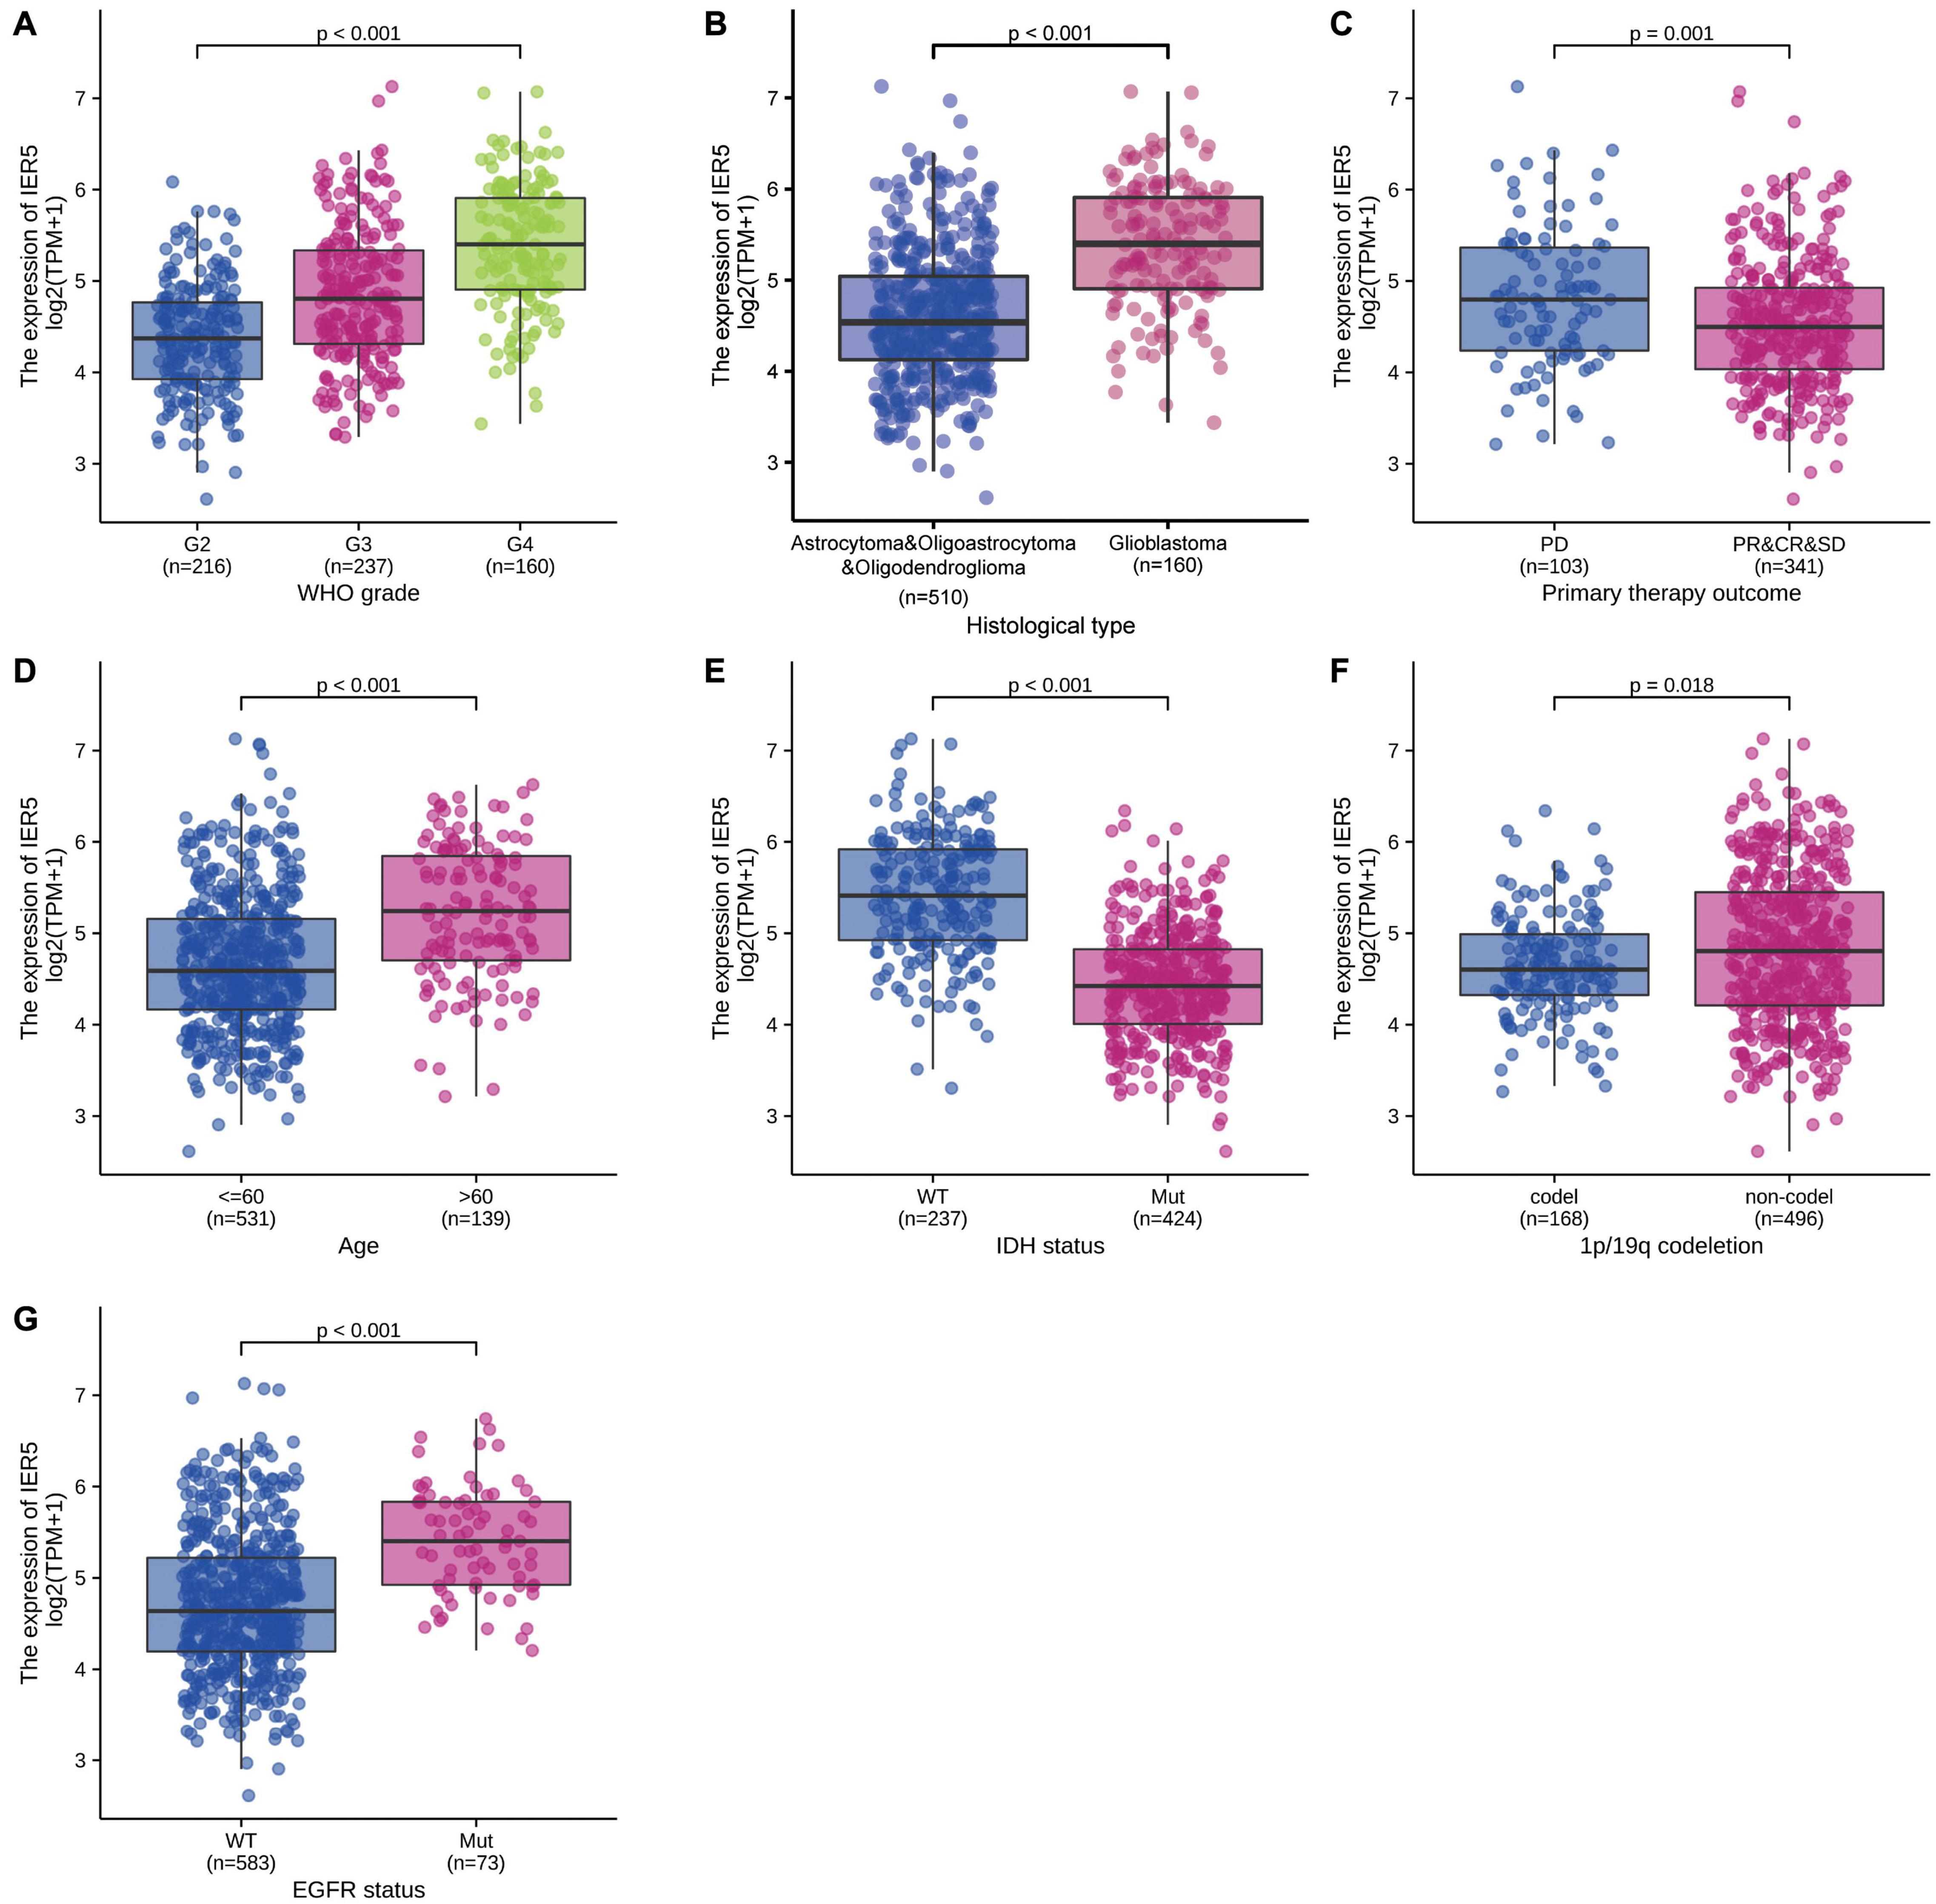
Figure 3. Association of IER5 expression and clinicopathologic characteristics. (A) WHO grade, (B) Histological type, (C) Primary therapy outcome, (D) Age, (E) IDH status, (F) 1p/19q codeletion, and (G) EGFR status.
Univariate logistic regression analysis of IER5 expression illustrated that higher expression levels were significantly linked to more advanced WHO grade [OR = 1.05 (1.04–1.06) for G4 vs. G2 and G3, P < 0.001], IDH wild-type (WT) status [OR = 1.11 (1.09–1.13) for WT vs. Mut, P < 0.001], 1p/19q codeletion [OR = 0.98 (0.97–0.99) for codeletion vs. non-codeletion, P < 0.001], a primary therapy outcome of complete response (CR) [OR = 0.98 (0.97–1.00) for CR vs. progressive disease (PD), stable disease (SD), and partial response (PR), P = 0.014], EGFR mutation [OR = 1.03 (1.02–1.04) for Mut vs. WT, P < 0.001], and age ≤ 60 years [OR = 0.97 (0.96–0.98) for ≤ 60 vs. >60, P < 0.001]. Additionally, the associations between IER5 expression and clinicopathologic features were confirmed by Chi-square analysis (Table 2). These findings indicate that cancers with a high IER5 expression level are correlated with poor clinicopathological factors.
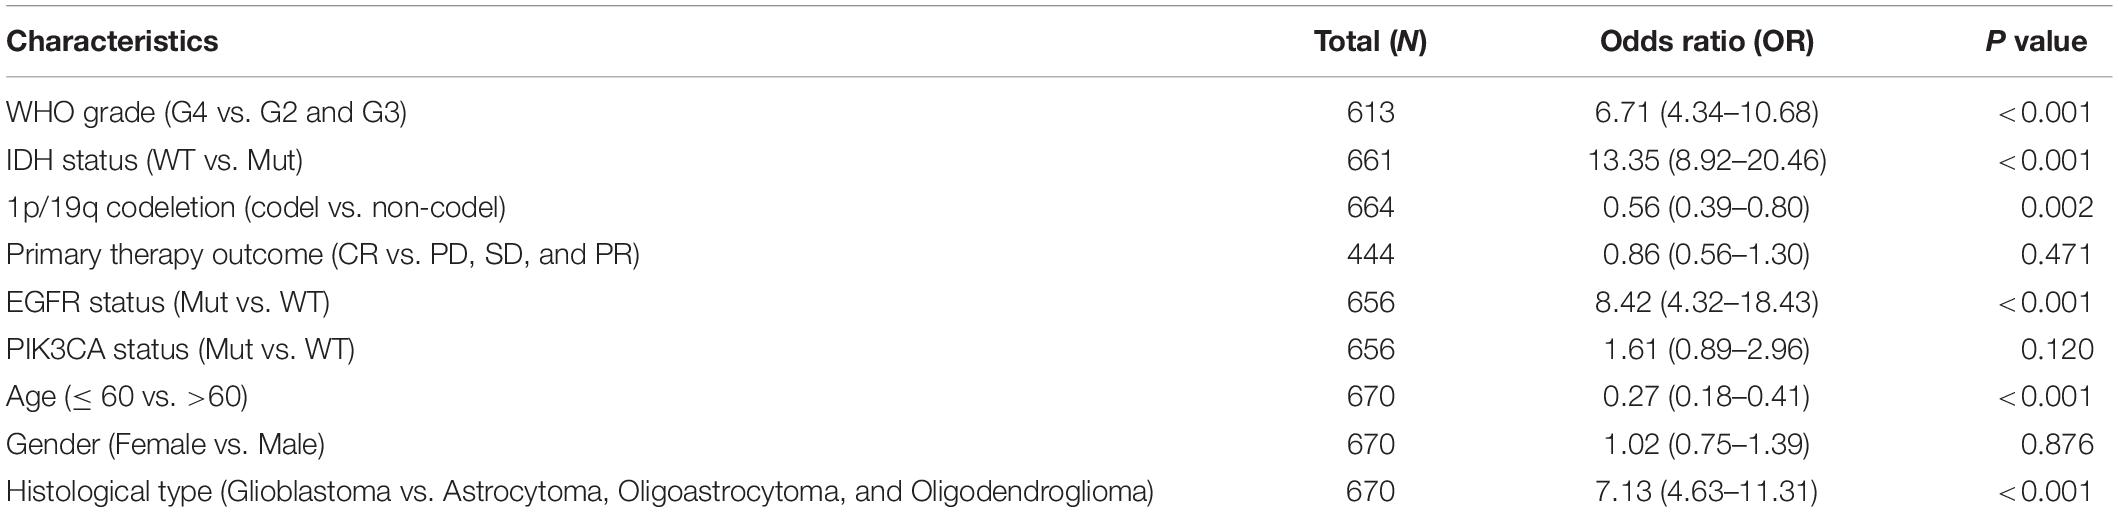
Table 2. IER5 expression associated with clinical pathological characteristics (logistic regression).
Survival Outcomes and Multivariate Analysis
As indicated in Figure 4, Kaplan–Meier survival assessment showed that glioma individuals with high IER5 expression had a poorer prognosis in contrast with those with low IER5 expression (P < 0.001). The univariate analysis illustrated that high IER5 expression was linked to a short OS [hazard ratio (HR): 3.75; 95% CI: 2.85–4.93; and P < 0.001], poor progression-free interval (HR: 2.40; 95% CI: 1.91–3.01; and P < 0.001), and poor disease-specific survival (DSS; HR: 3.74; 95% CI: 2.80–5.01; and P < 0.001). The multivariate analysis revealed that IER5 expression remained independently correlated with OS, with an HR of 2.474 (95% CI: 1.552–3.943, P < 0.001), as did WHO grade, IDH status, 1p/19q codeletion, primary therapy outcome, and age (Table 3).
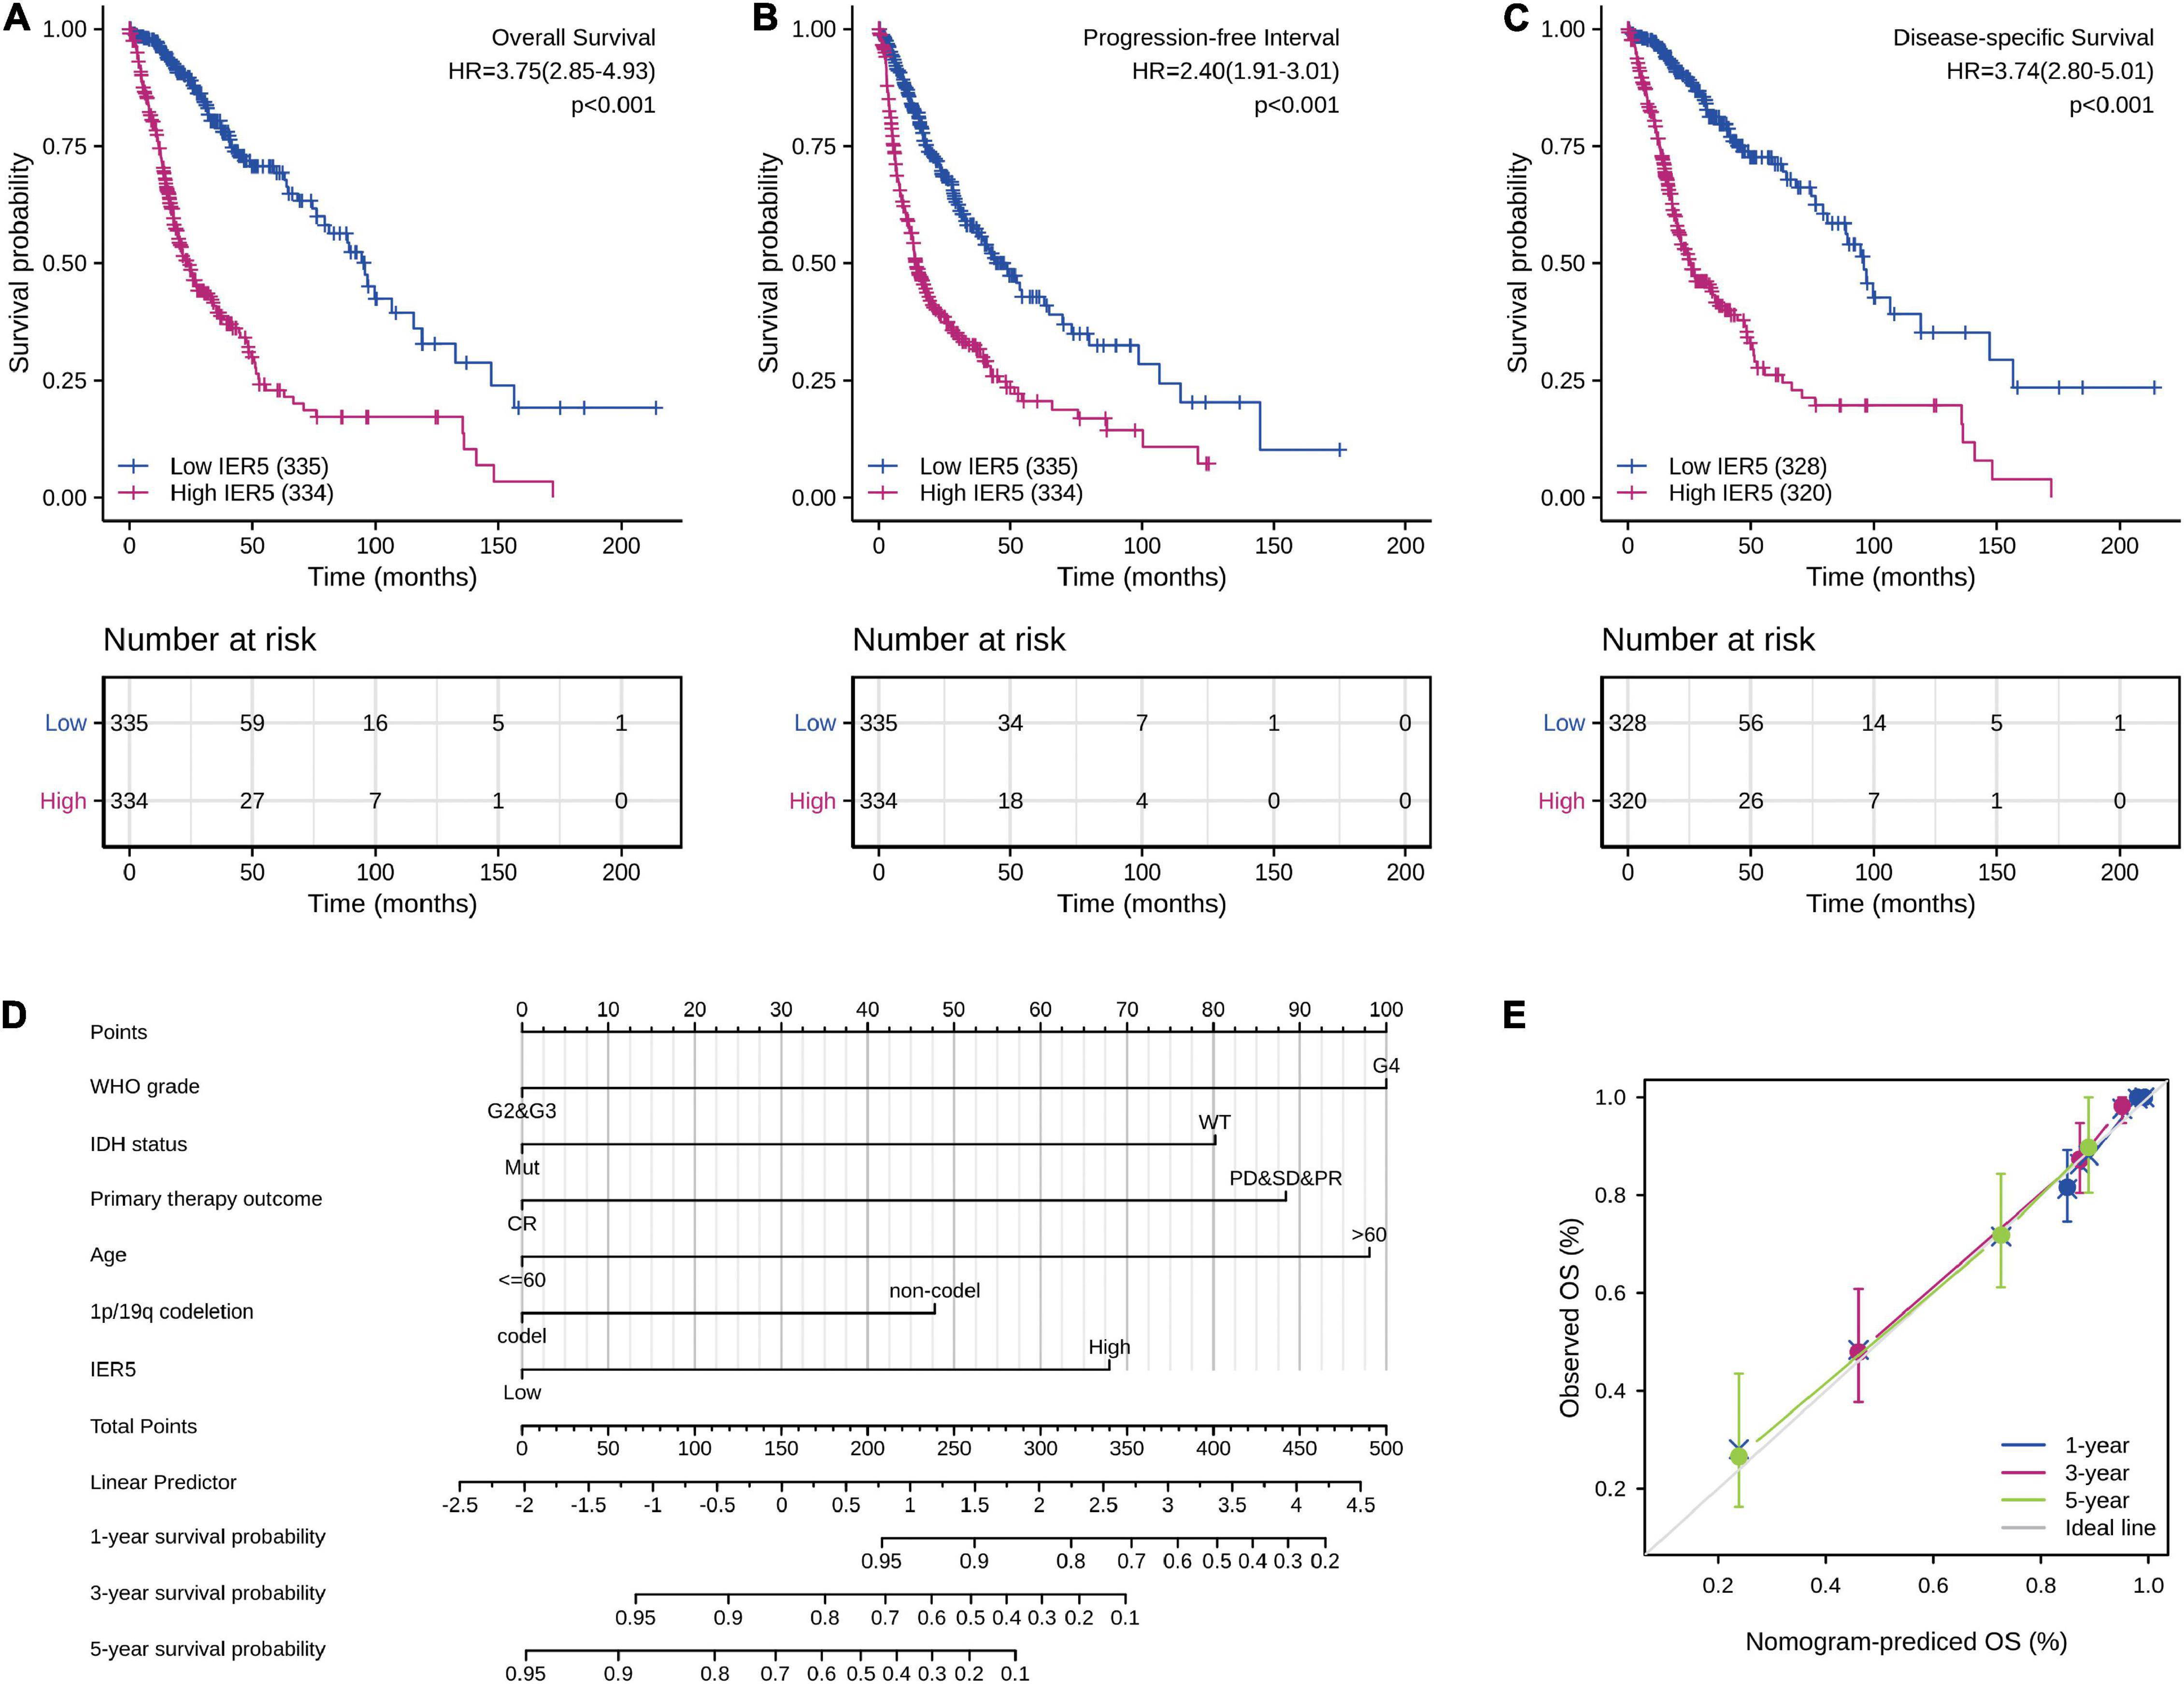
Figure 4. Impact of IER5 expression on overall survival, progression-free interval, and disease-specific survival in glioma patients in the TCGA cohort (A–C). Construction and performance validation of the IER5-based nomogram for glioma patients (D,E).
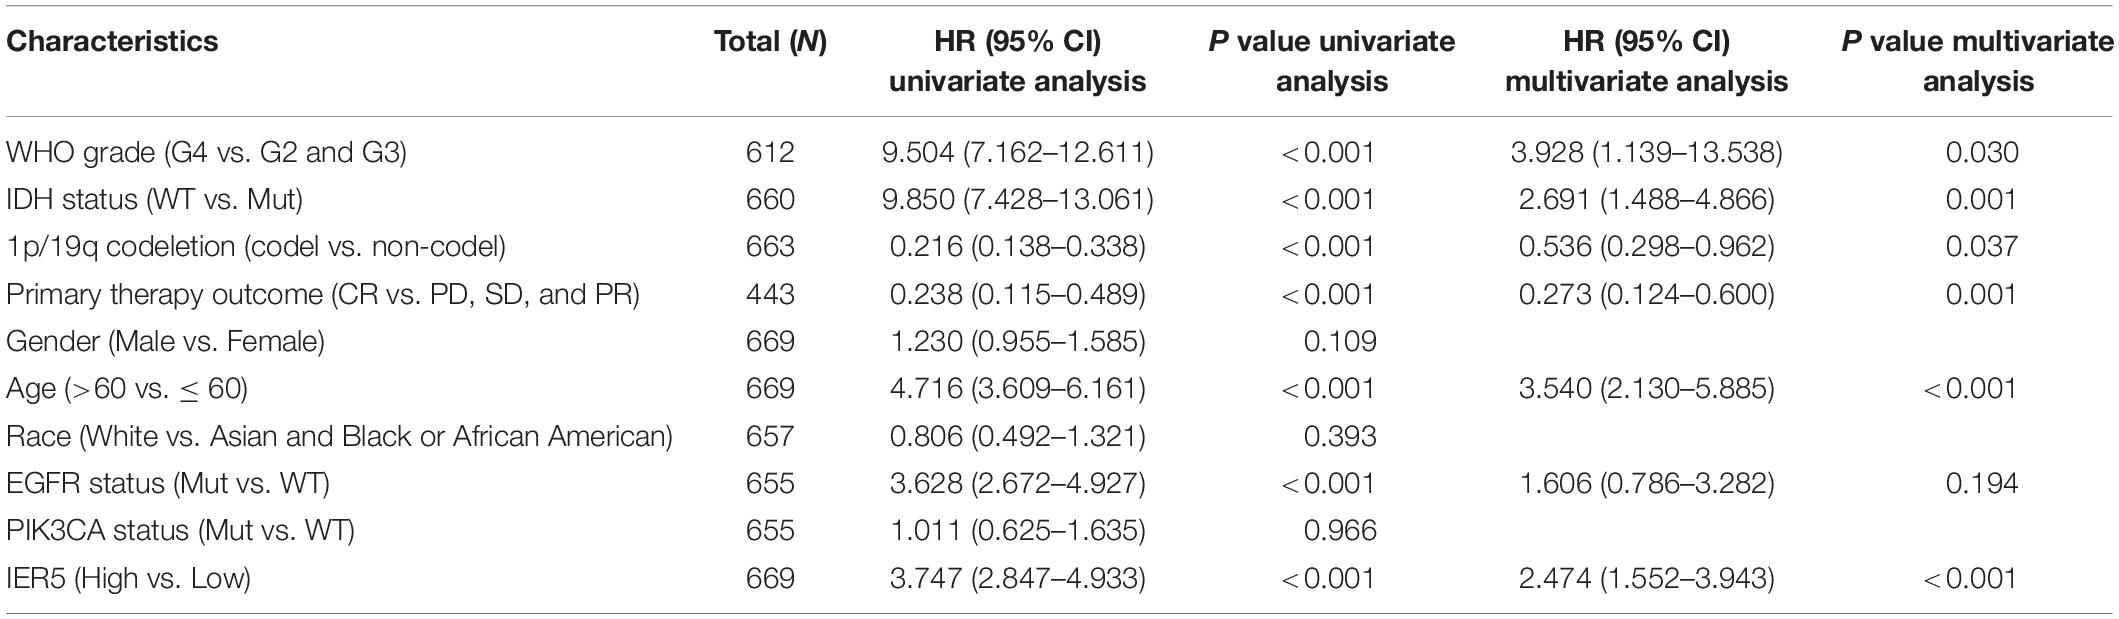
Table 3. (A) Association with overall survival and clinicopathologic characteristics in glioma patients using Cox regression. (B) Multivariate survival model after variable selection.
High IER5 Expression Levels Impact the Prognosis of Glioma in Patients With Different Clinicopathological Features
We used univariate Cox analysis to assess the relationship of IER5 expression with the clinicopathological characteristics of glioma patients (Figure 5). Elevated expression of IER5 was correlated with worse OS in female and male patients and patients with different WHO grades, ages, and EGFR statuses. Overexpression of IER5 was linked to worse OS in WT IDH status patients [HR = 2.405 (1.481–3.905), P < 0.001], patients without 1p/19q codeletion [HR = 4.320 (3.208–5.816), P < 0.001], patients who had a primary therapy outcome of PD [HR = 3.290 (1.979–5.471), P < 0.001], patients with astrocytoma [HR = 5.173 (2.905–9.211), P < 0.001], patients with glioblastoma [HR = 1.919 (1.174–3.138), P = 0.009], and WT PIK3CA status patients [HR = 3.738 (2.799–4.993), P < 0.001]. These correlations were not observed in other patient subgroups. These data indicate that the IER5 expression level can affect the prognosis of glioma patients with different clinicopathological characteristics.
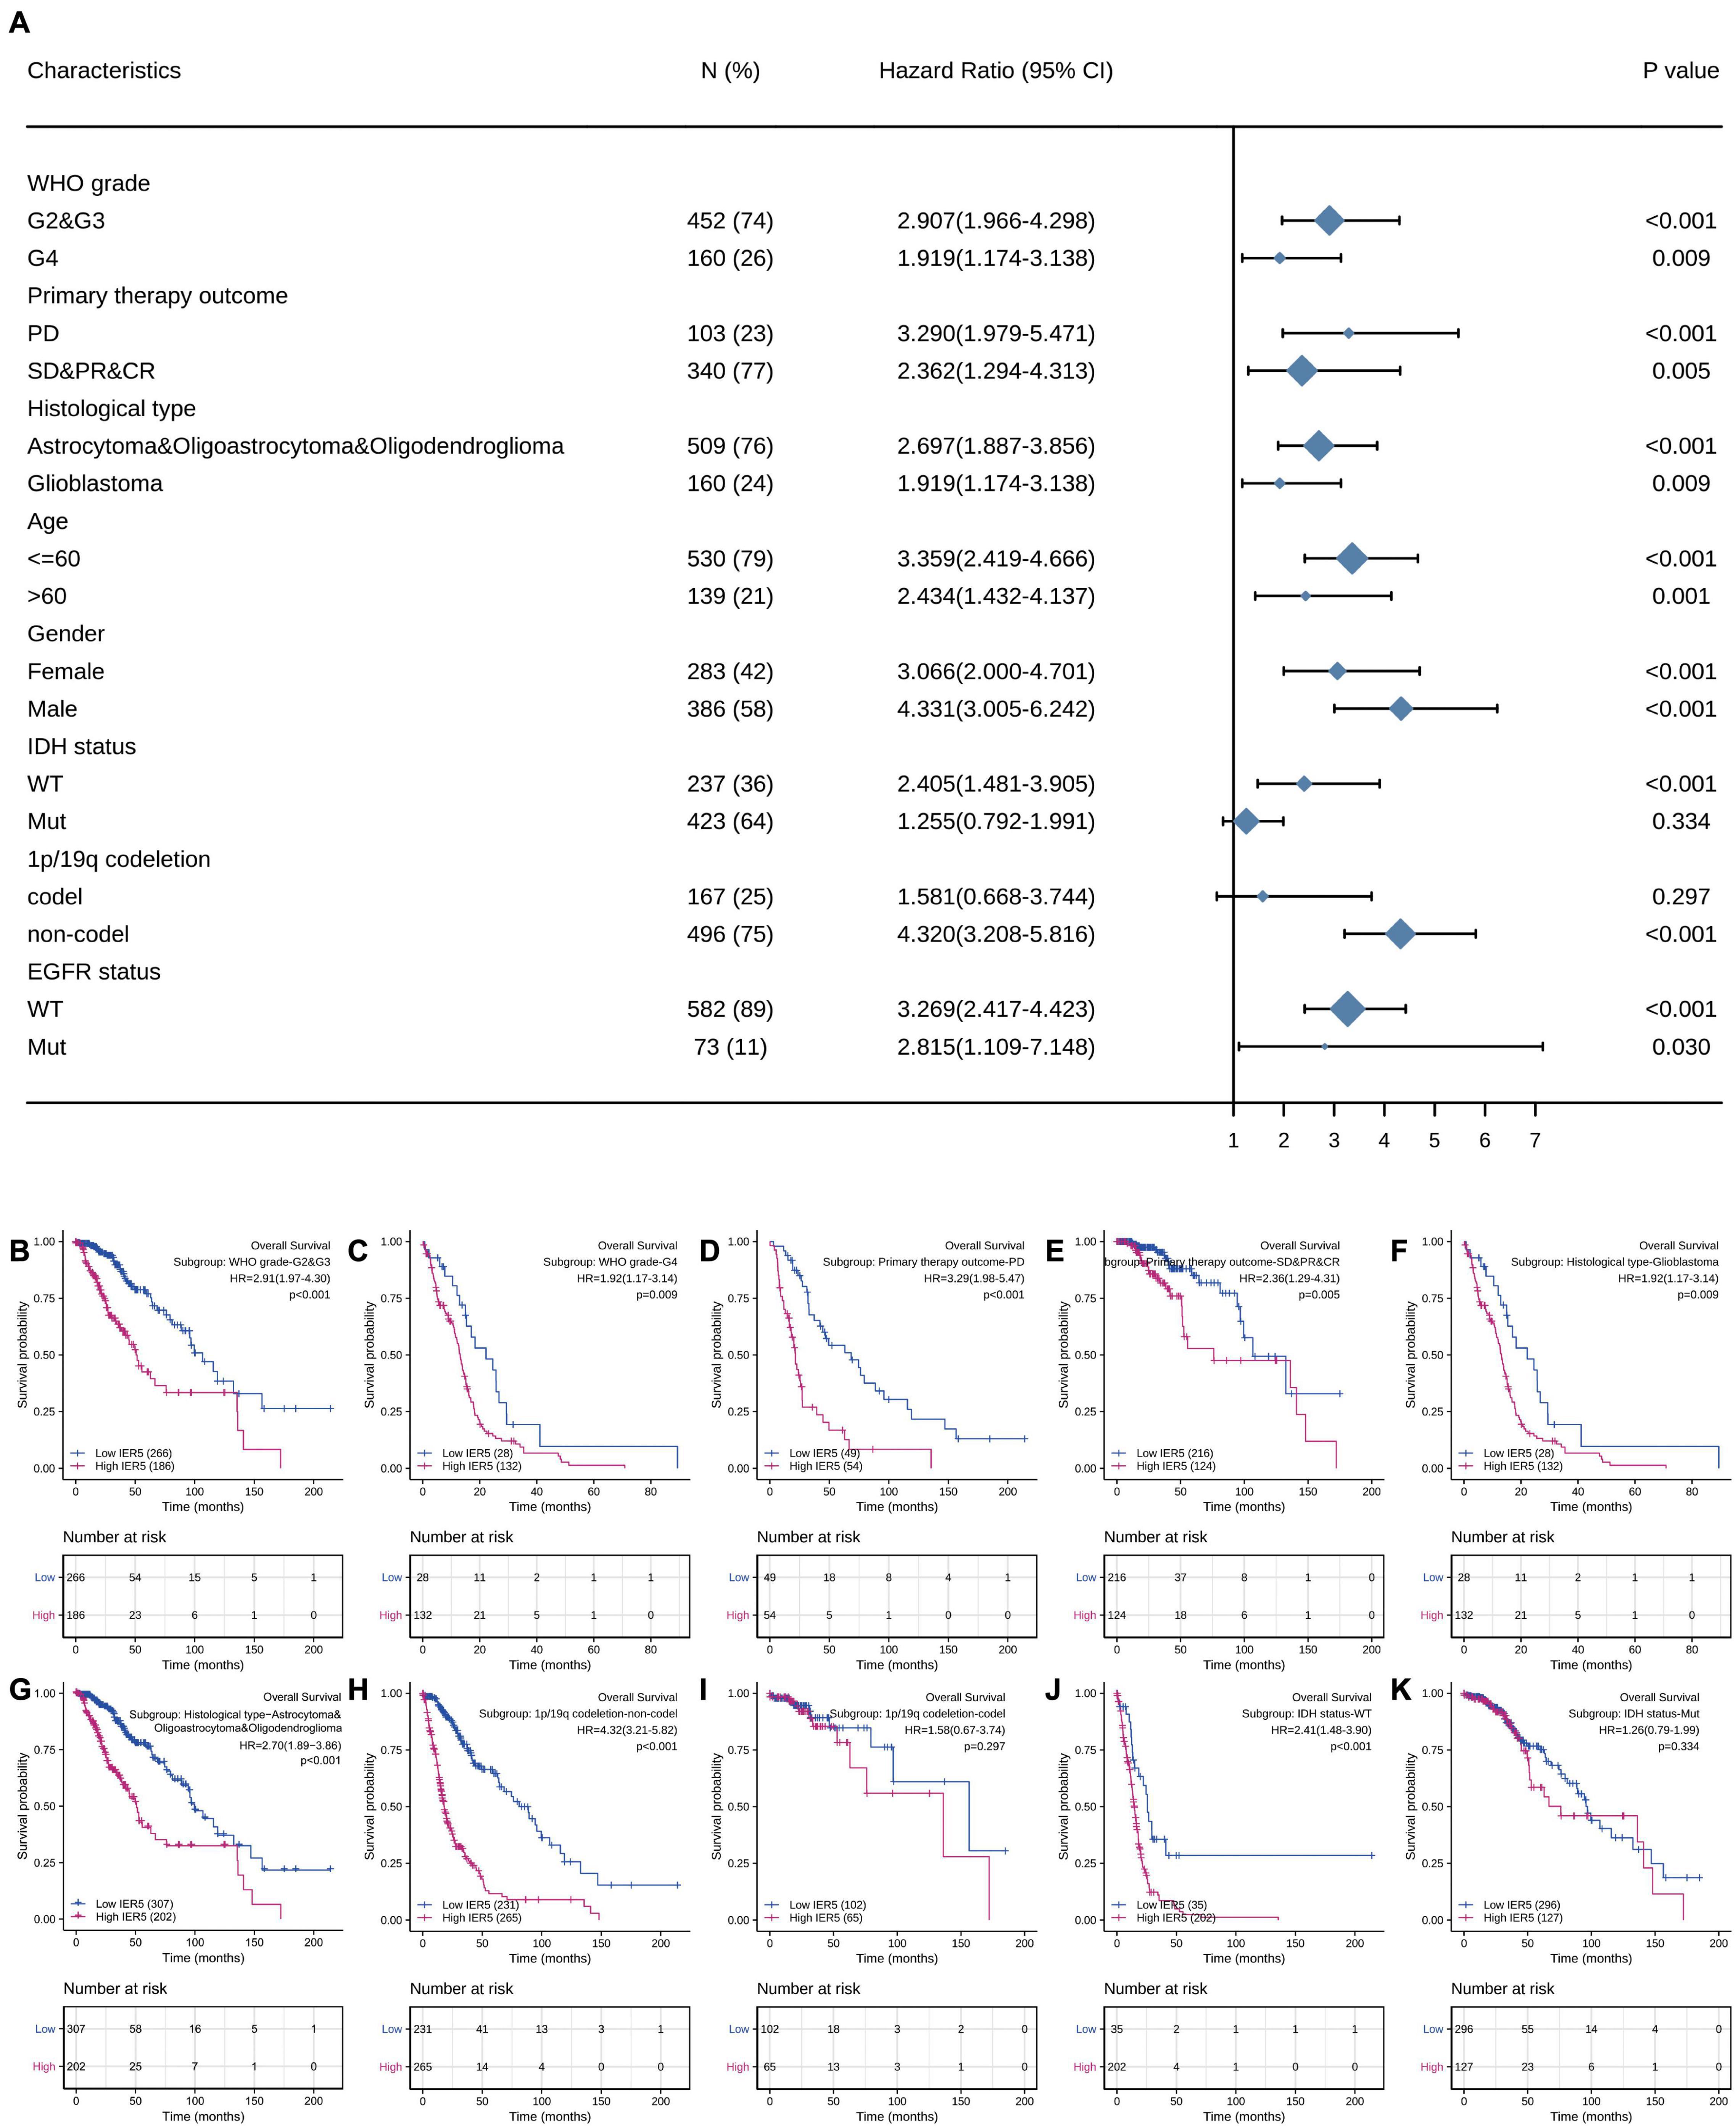
Figure 5. Correlation of IER5 expression and clinical prognosis in glioma patients with different clinicopathological factors. (A) Forest plots showing subgroup analyses of overall survival. (B–K) Kaplan–Meier survival subgroup analysis in patients stratified by clinical characteristics.
Development and Verification of a Nomogram on the Basis of IER5 Expression and Clinicopathological Factors
To predict the prognosis of glioma patients, we constructed a nomogram that integrated IER5 expression and independent clinical risk factors (WHO grade, IDH status, primary therapy outcome, age, and 1p/19q codeletion; Figure 4D). The selection of clinical risk factors was according to the multivariate Cox analysis data. In the nomogram, a higher total number of points predicted a worse prognosis than a lower total number of points. We used the C-index and a calibration plot to explore the performance of the prediction model. The C-index for the nomogram was 0.841 (95% CI: 0.822–0.861) with 1,000 bootstrap replicates. The calibration plot of the survival probability at 1, 3, and 5 years illustrated good consistency between the predictions made by the nomogram and the actual observations (Figure 4E). In summary, these data indicate that our nomogram was a better model for estimating the survival probability at 1, 3, and 5 years in glioma patients than independent prognostic factors.
Validation of the Prognostic Value of IER5 in TMA and CGGA Datasets
Using TMA containing samples from 180 glioma patients, the protein expression levels of IER5 were analyzed through IHC staining. In Figure 6A, the representative negative, weak, moderate, and strong staining of IER5 in glioma tissues were illustrated (Table 4). Kaplan–Meier analysis illustrated that high IER5 protein expression was significantly related to shorter OS (HR: 1.84; 95% CI: 1.10–3.07; P = 0.021; Figure 6C) and poorer DSS (HR: 1.82; 95% CI: 1.09–3.04; P = 0.023; Figure 5C) than low IER5 protein expression. In addition, we also use CGGA to validate the prognostic value of IER5 in three independent datasets (including mRNAseq_325, mRNAseq_693, and mRNA-array_301). Kaplan–Meier analysis based on CGGA showed that high IER5 expression was significantly correlated to shorter OS in mRNAseq_325 dataset (HR: 1.50; 95% CI: 1.07–2.09; P = 0.019; Figure 6C), mRNAseq_693 dataset (HR: 1.76; 95% CI: 1.33–2.32; P < 0.001; Figure 6E), and mRNA-array_301 dataset (HR: 2.44; 95% CI: 1.77–3.38; P < 0.001; Figure 6F). These results confirmed that the IER5 expression was able of prediction the prognosis of glioma patients.

Figure 6. Immunohistochemistry of IER5 expression in the glioma tissue microarray cohort and the validation of prognosis value of IER5 expression in Chinese Glioma Genome Atlas (CGGA) datasets. (A) Representative images of IER5 staining in the negative, weak, moderate, and strong expression groups. (B) Kaplan–Meier survival curves of overall survival stratified by IER5 protein expression. (C) Kaplan–Meier survival curves of disease-specific survival stratified by IER5 protein expression. (D–F) Kaplan–Meier survival curves of overall survival stratified by IER5 expression in three independent datasets of CGGA.
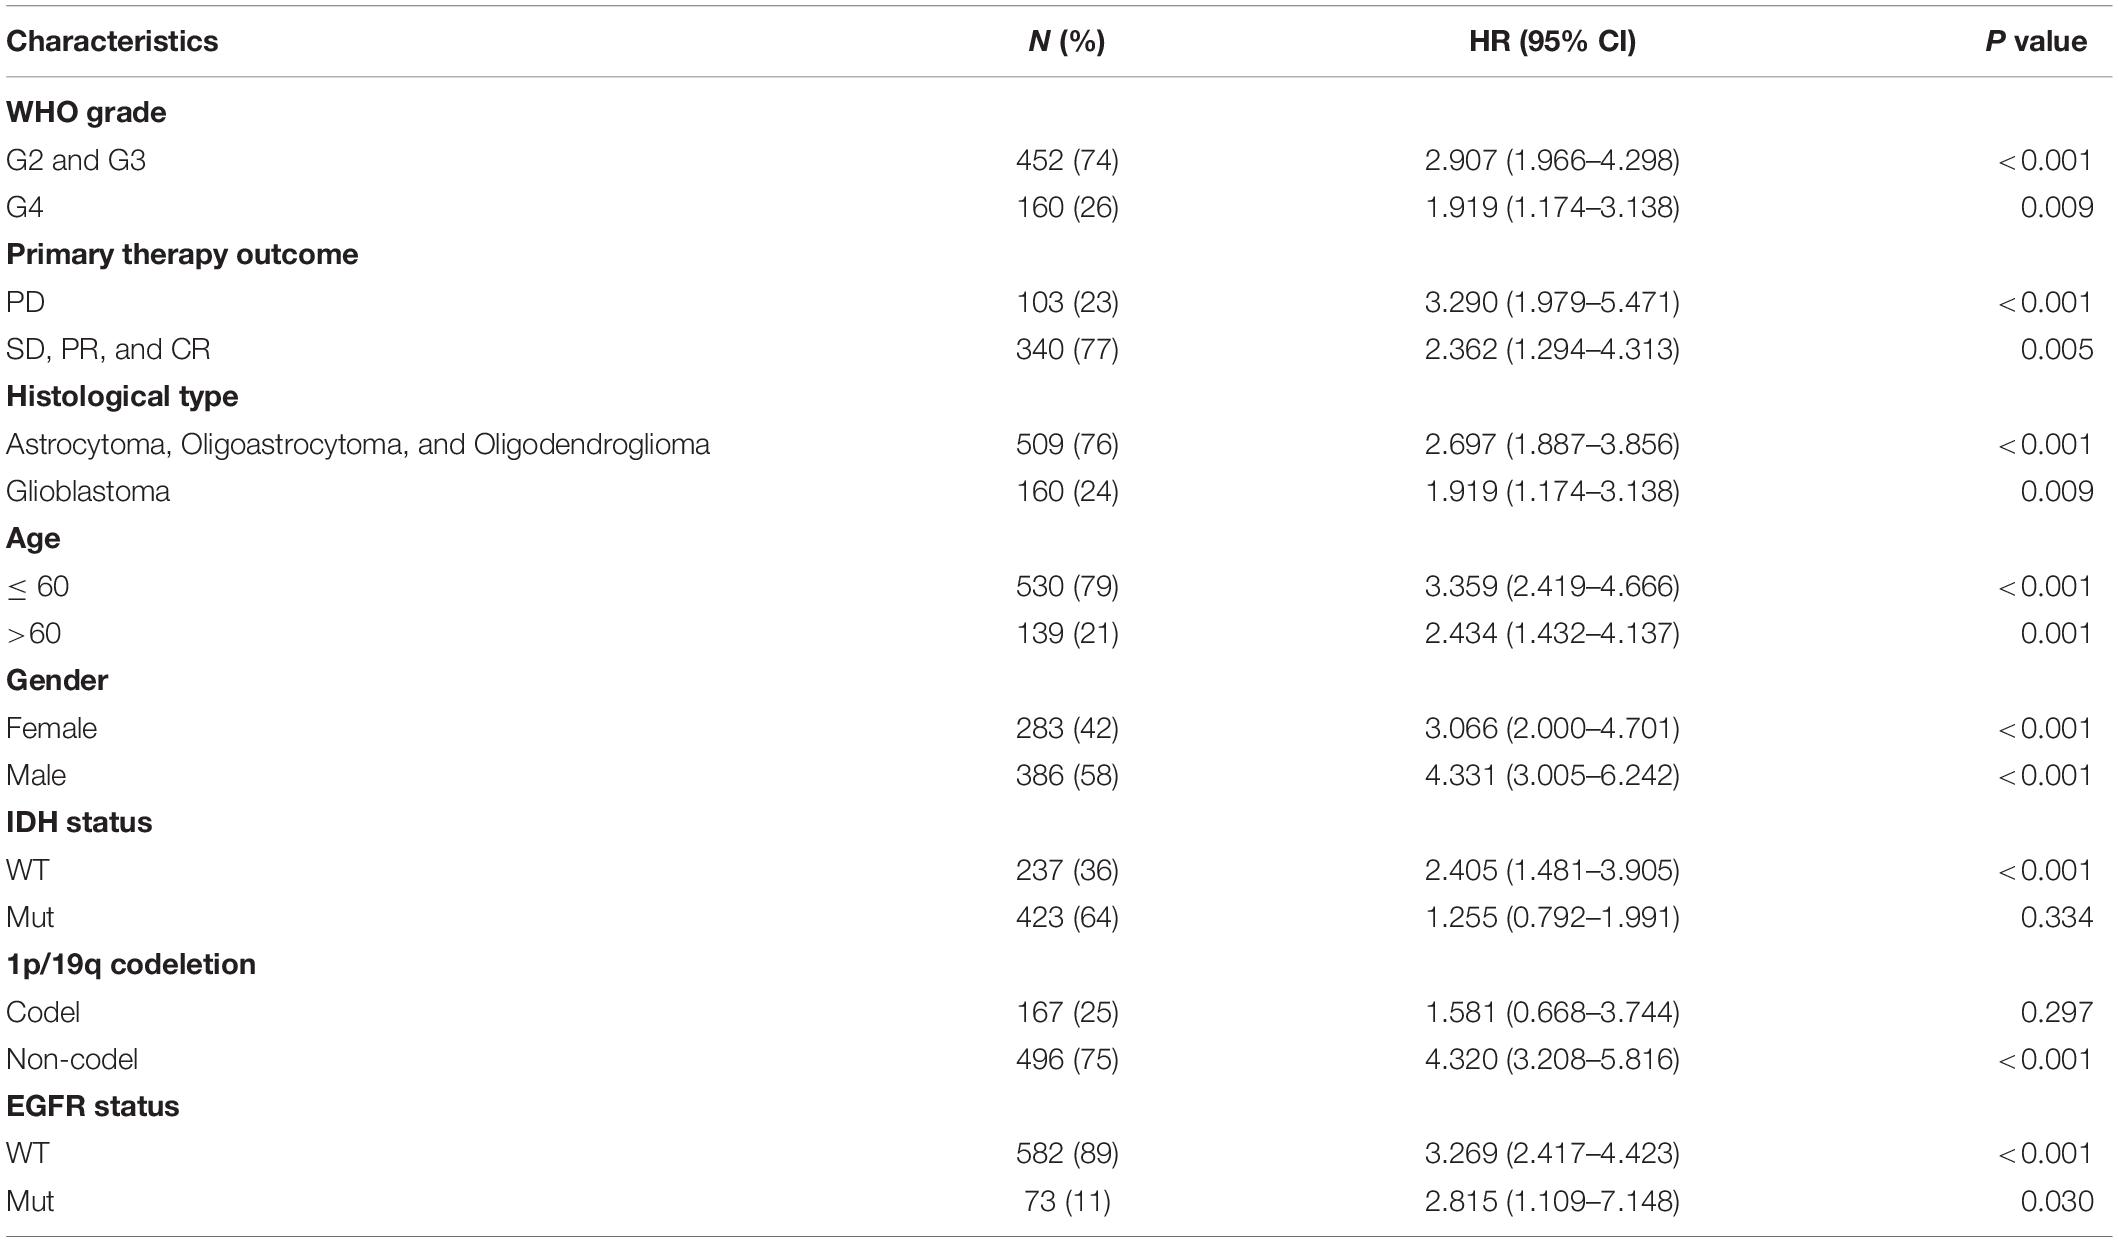
Table 4. Correlation of IER5 expression and clinical prognosis in glioma patients with different clinicopathological characteristics.
Identification of DEGs Between Glioma Patients With High- and Low-IER5 Expression
The HTSeq-Counts data from TCGA were analyzed using the R package DESeq2 (with threshold values of adjusted P < 0.05 along with |log2 FC| > 2; Love et al., 2014). DEG expression was visualized with a heat map and volcano plot (Figures 7A, B). As shown in the heat map, the top 5 gene sets were significantly positively and negatively correlated with IER5 (Figure 7A). As shown in the volcano plot, there were 335 genes with a significant positive correlation with IER5 and 18 genes with a significant negative correlation with IER5 (Figure 7B). Scatter plots of individual genes showed a significant positive correlation between IER5 and E2F7 (Spearman r value = 0.650, P-value < 0.001), PTX3 (Spearman r value = 0.640, P-value < 0.001), and VAV3 (Spearman r value = 0.620, P-value < 0.001) expression (Figures 7C–E). E2F7, PTX3, and VAV3 have been reported as oncogene in many kinds of tumors especially in glioma (Liu et al., 2014, 2018; Yang et al., 2020). These results illuminated that IER5 may have a wide range of functions through modulating different genes.
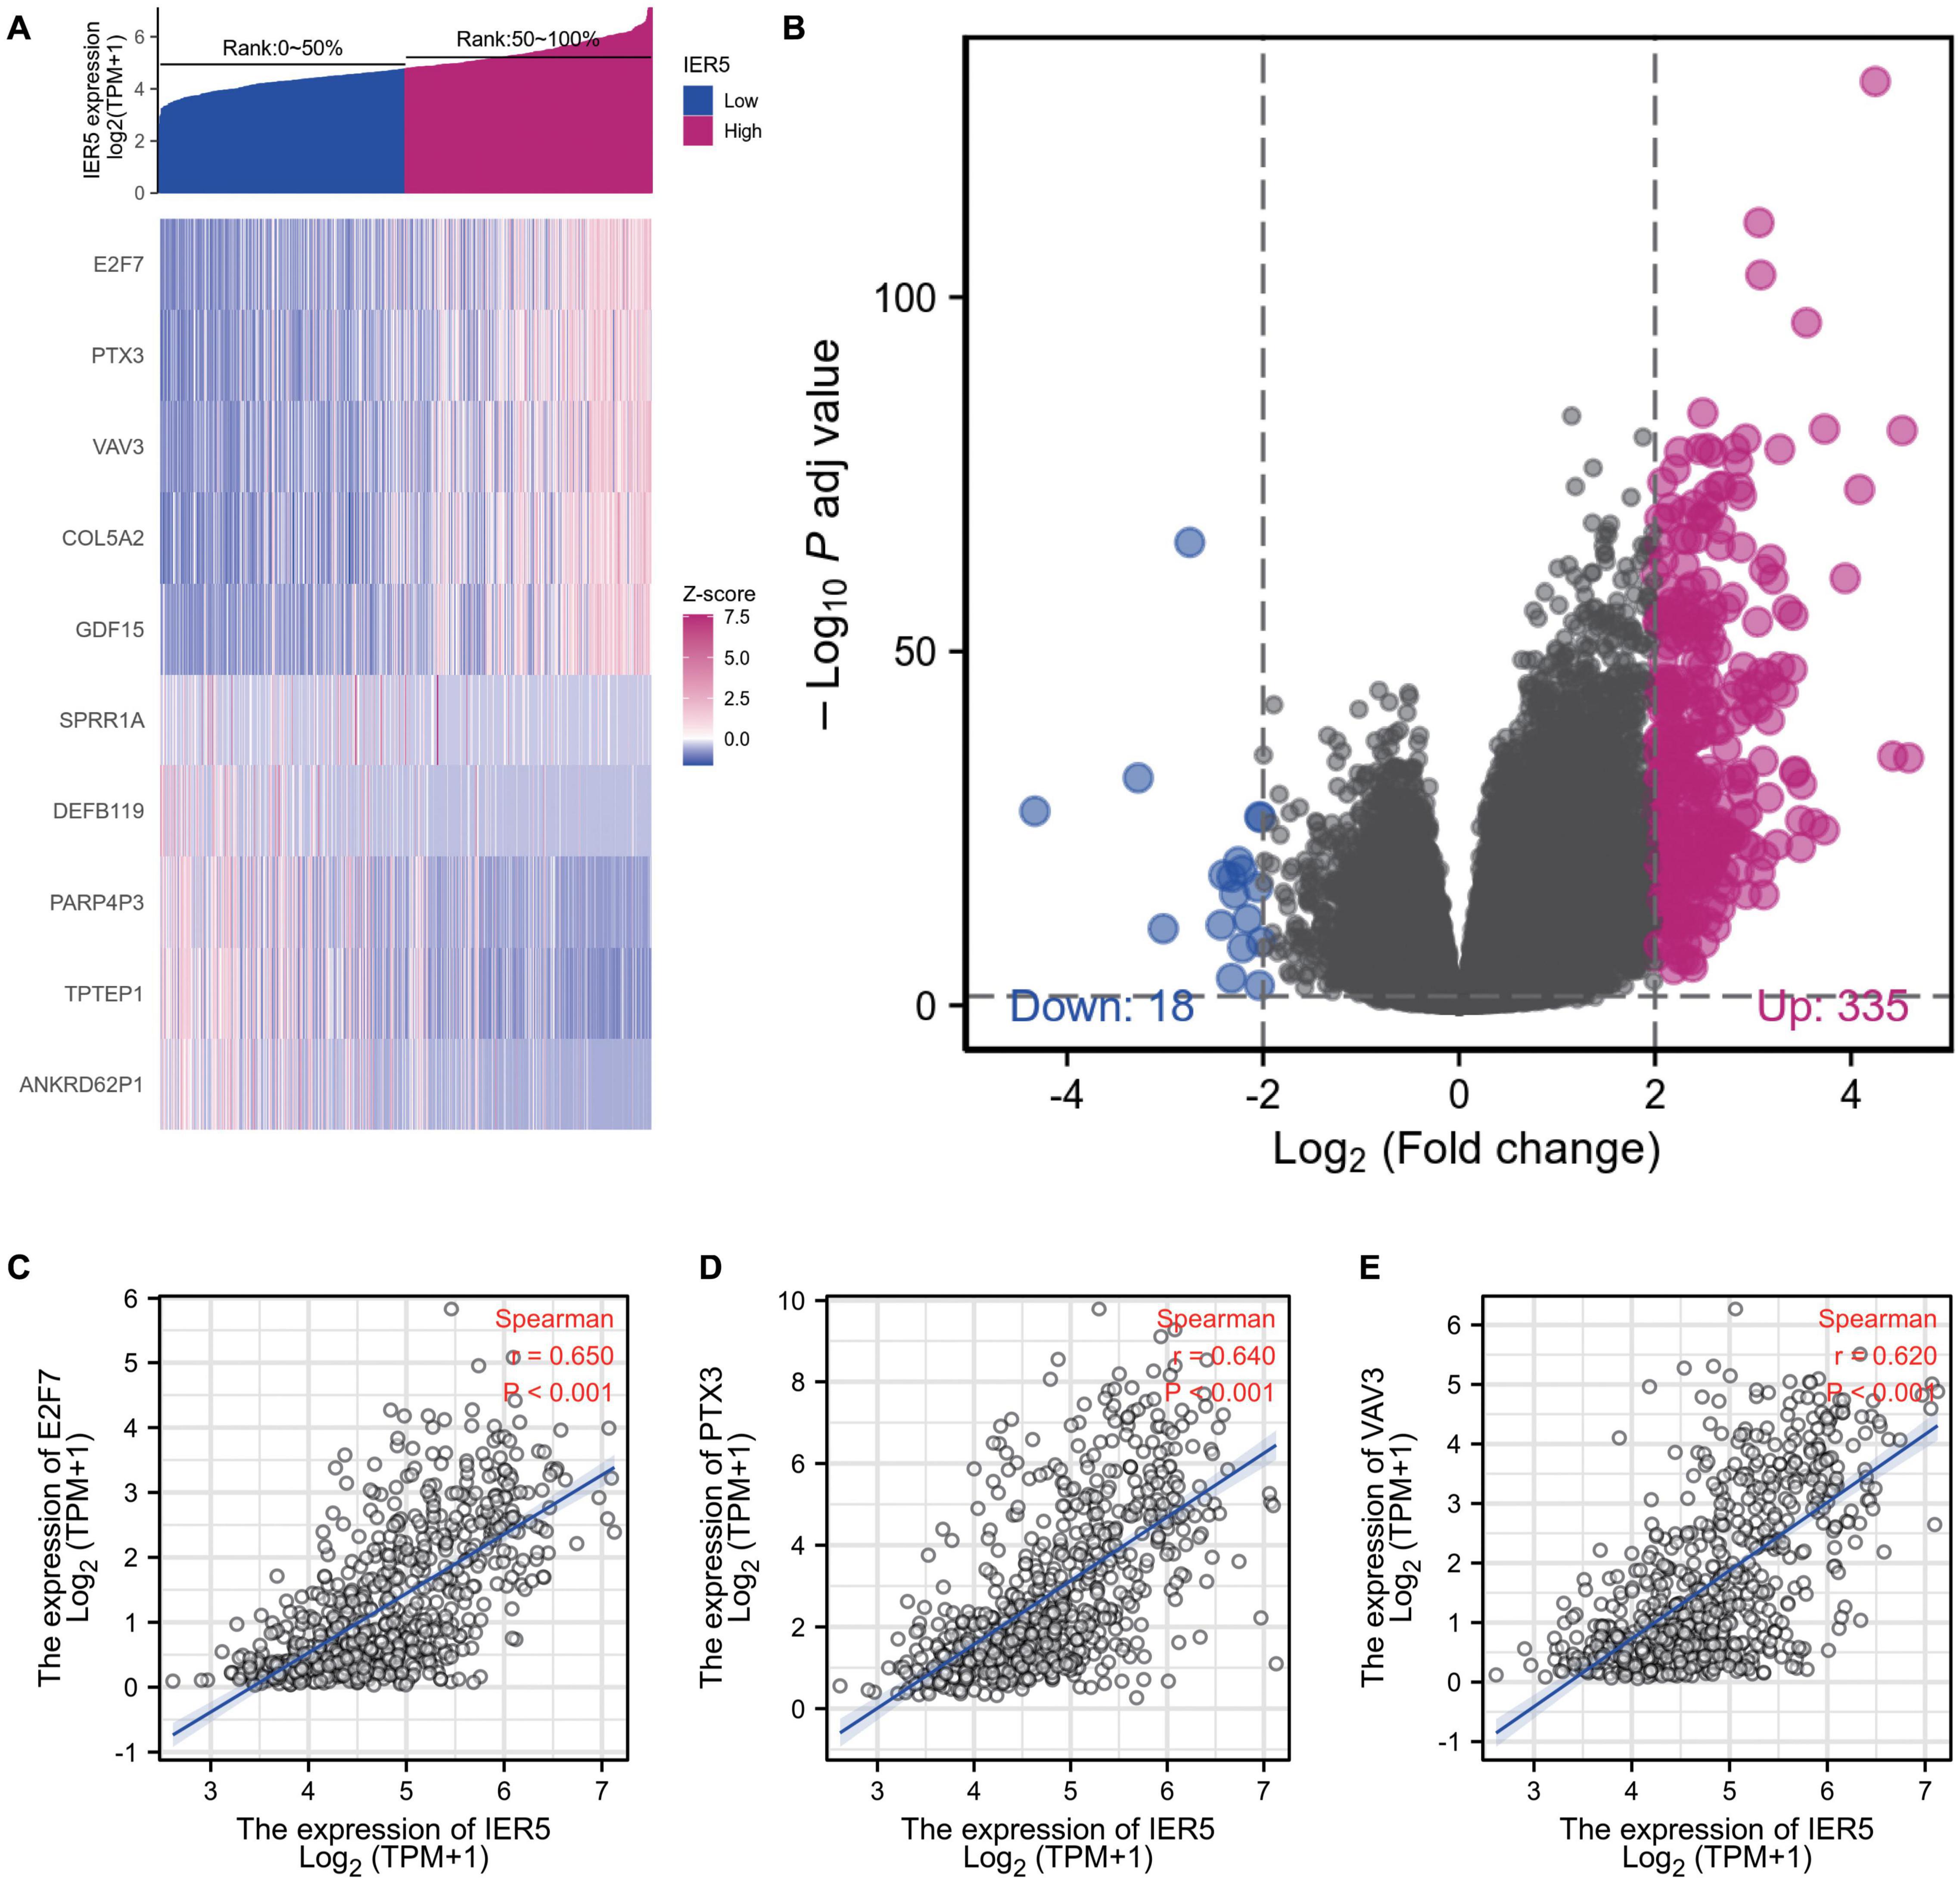
Figure 7. DEGs between glioma patients with high- and low- IER5 expression. (A) Heat map of the 10 differentially expressed genes in the high- and low-IER5 expression groups. (B) Volcano plot of differentially expressed genes. (C–E) Correlation of IER5 expression with expression of E2F7 (C), PTX3 (D), and VAV3 (E) in the scatter plot.
Functional Enrichment Analysis of DEGs
To analyze the functional implication information of IER5 in glioma patients, GO, and KEGG functional enrichment assessments were performed within Metascape using the 353 DEGs identified between the high- and low-IER5 expression groups. IER5-associated genes were found to be linked to several biological processes, cellular components, and molecular functions. We found that skeletal system development, extracellular structure organization, blood vessel development, tissue morphogenesis, granulocyte chemotaxis, connective tissue development, skin development, endocrine system development, and muscle structure development were related to the regulation of IER5-related genes (Figure 8). Overall, the DEGs were closely associated with embryonic development. In addition, we analyzed the PPI network by Metascape to better understand the role of IER5 in the development of glioma (Figure 8D). The significant densely connected network constituents were shown in Figure 8E, and each network is assigned a unique color.
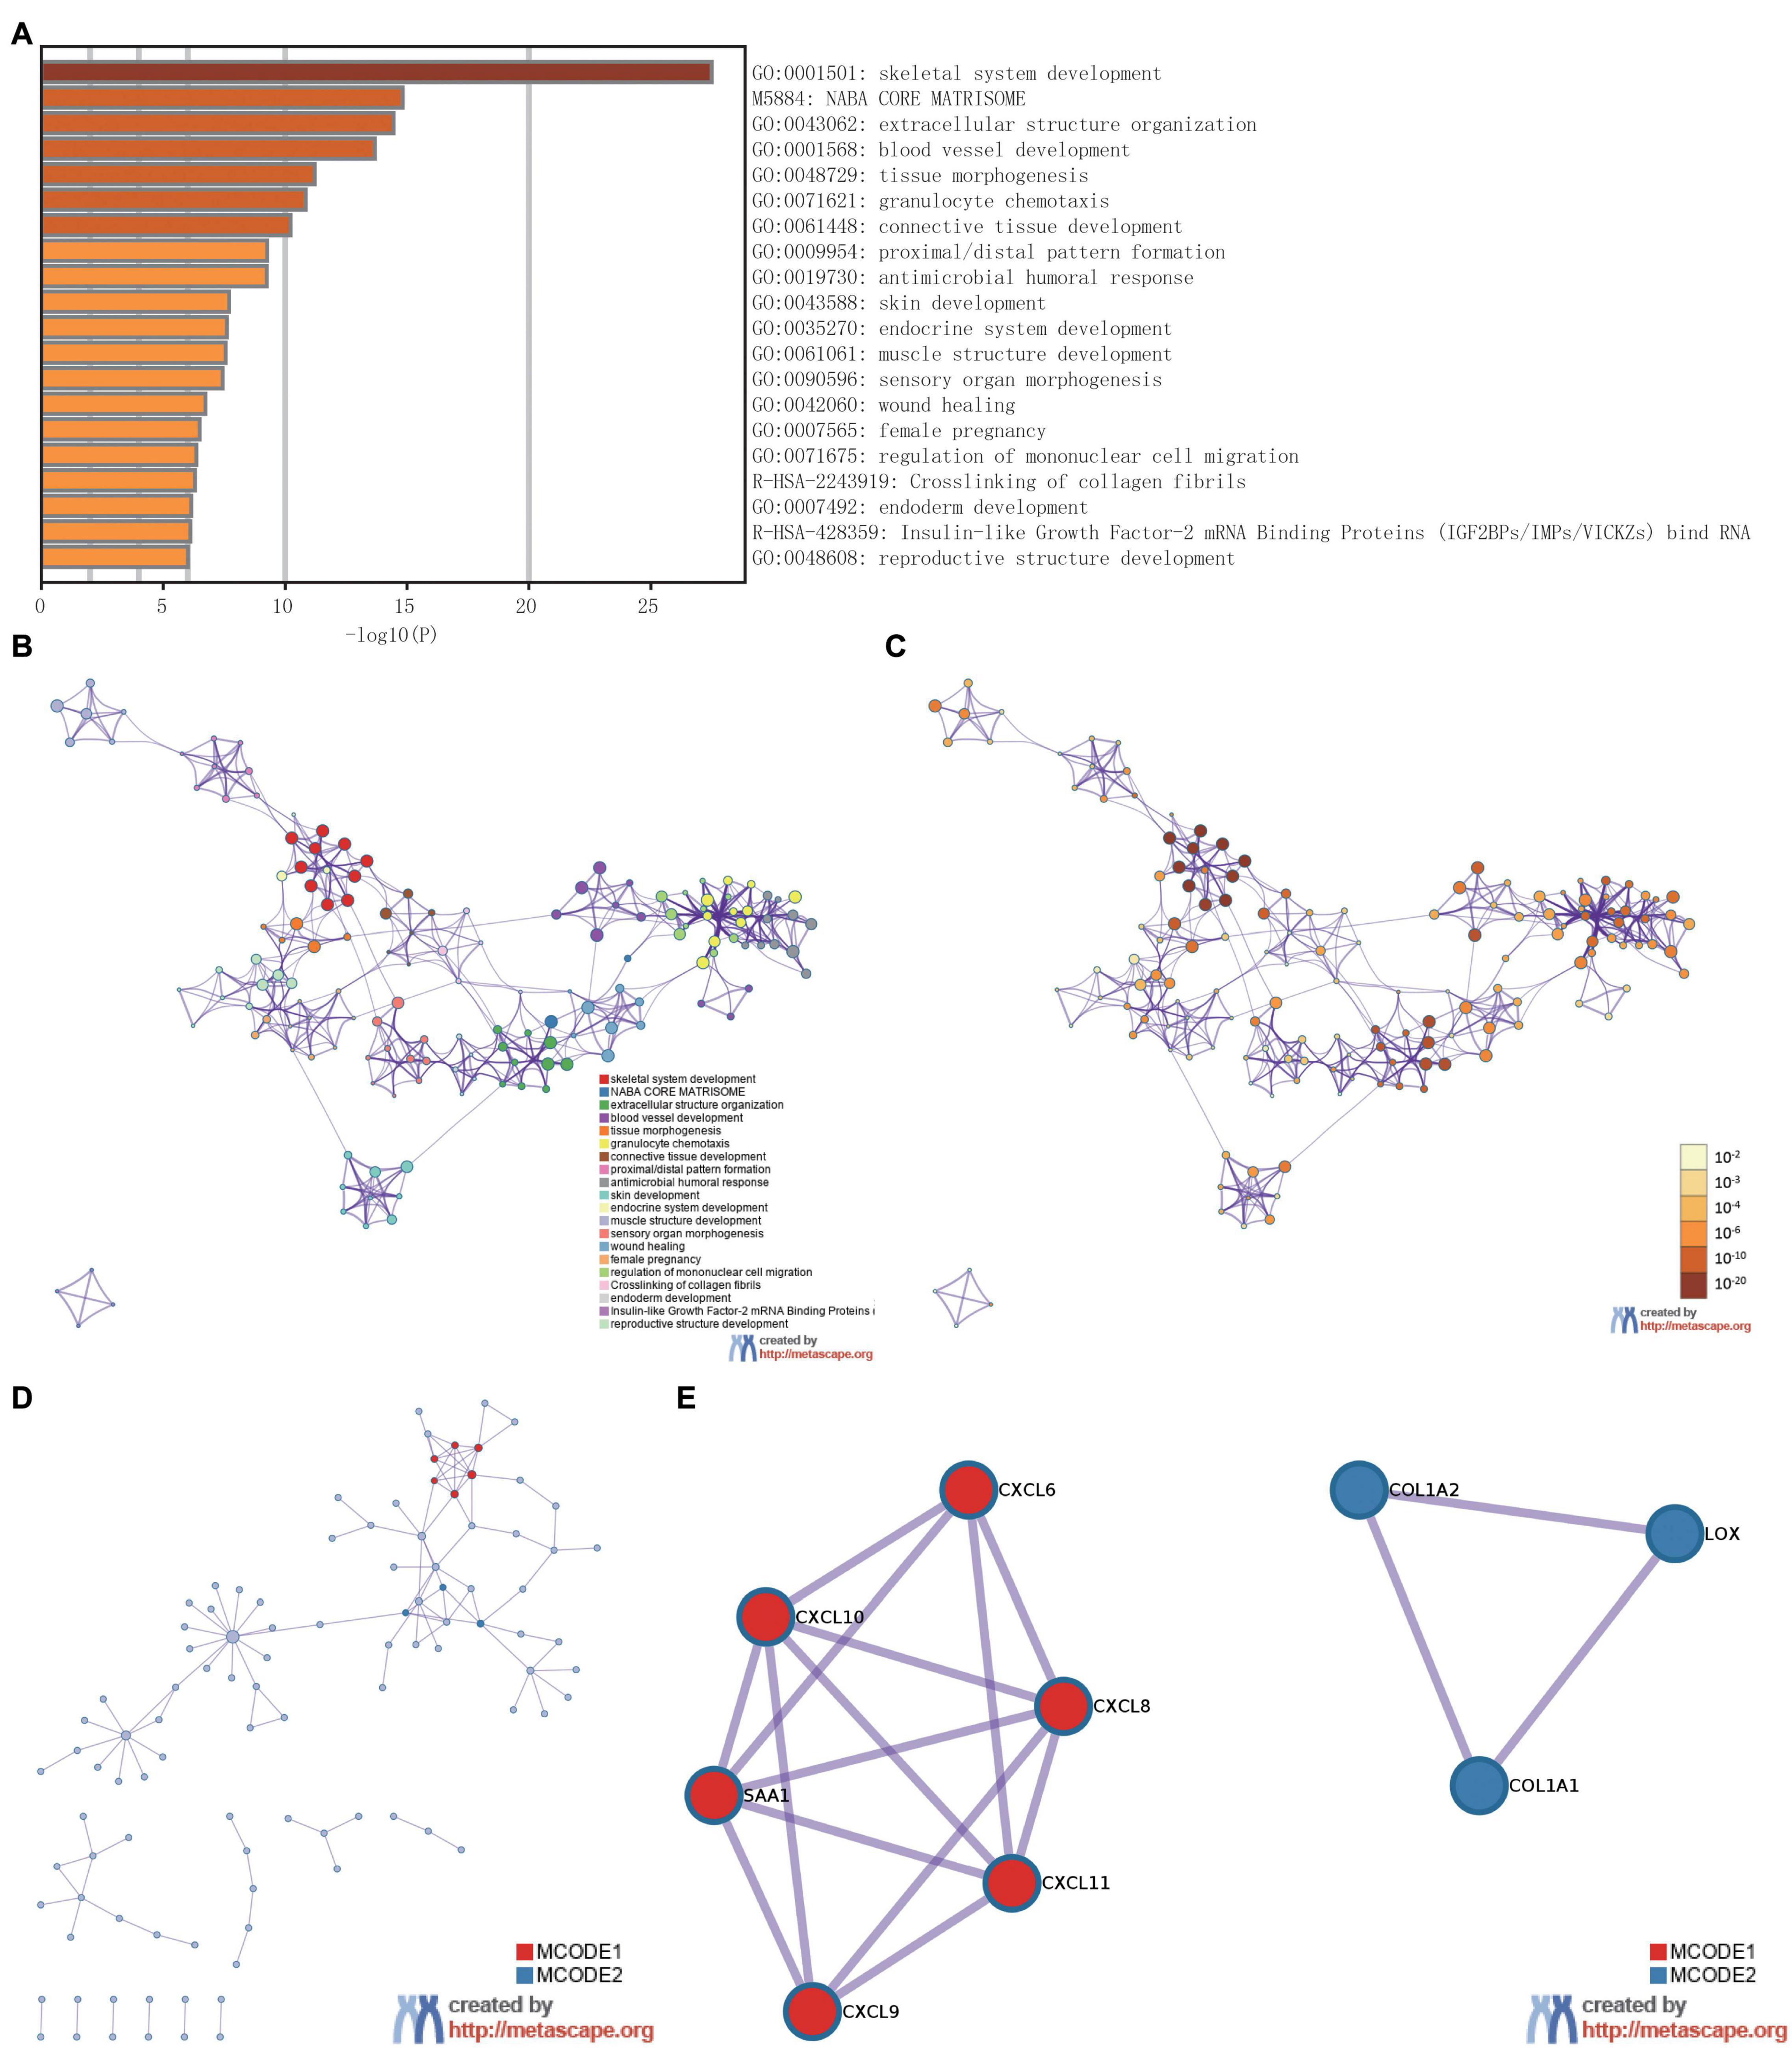
Figure 8. The enrichment analysis and visualized protein-protein interaction (PPI) enrichment analysis of DEGs (Metascape). (A) A heatmap of Gene Ontology analysis colored by P-values. (B,C) An interactive network of the top 20 enrichment terms. (D,E) PPI network and densely connected network components identified by the Molecular Complex Detection (MCODE) algorithm.
Gene-Related Signaling Pathways Identified by GSEA
Gene set enrichment analysis was carried out to determine the biological signaling cascades related to glioma by comparing the high- and low-IER5 expression datasets. Dramatic differences (FDR < 0.25, adjusted P-value < 0.05) in the enrichment of many pathways in the MSigDB Collection (c2.cp.v7.2.symbols, h.all.v7.2.symbols, and c5.all.v7.2.symbols) were revealed. Figure 9 shows the PPI network of IER5 and its potential co-expression genes within the IER5-related DEGs. Nine pathways, including pathways related to P53, MTORC1 signaling, KRAS signaling, angiogenesis, the cell cycle, the cell cycle G1 S phase transition, the response to ionizing radiation, DNA double-strand repair and hypoxia, exhibited remarkably differential enrichment in the IER5-high expression phenotype, indicating the potential role of IER5 in the onset of glioma.
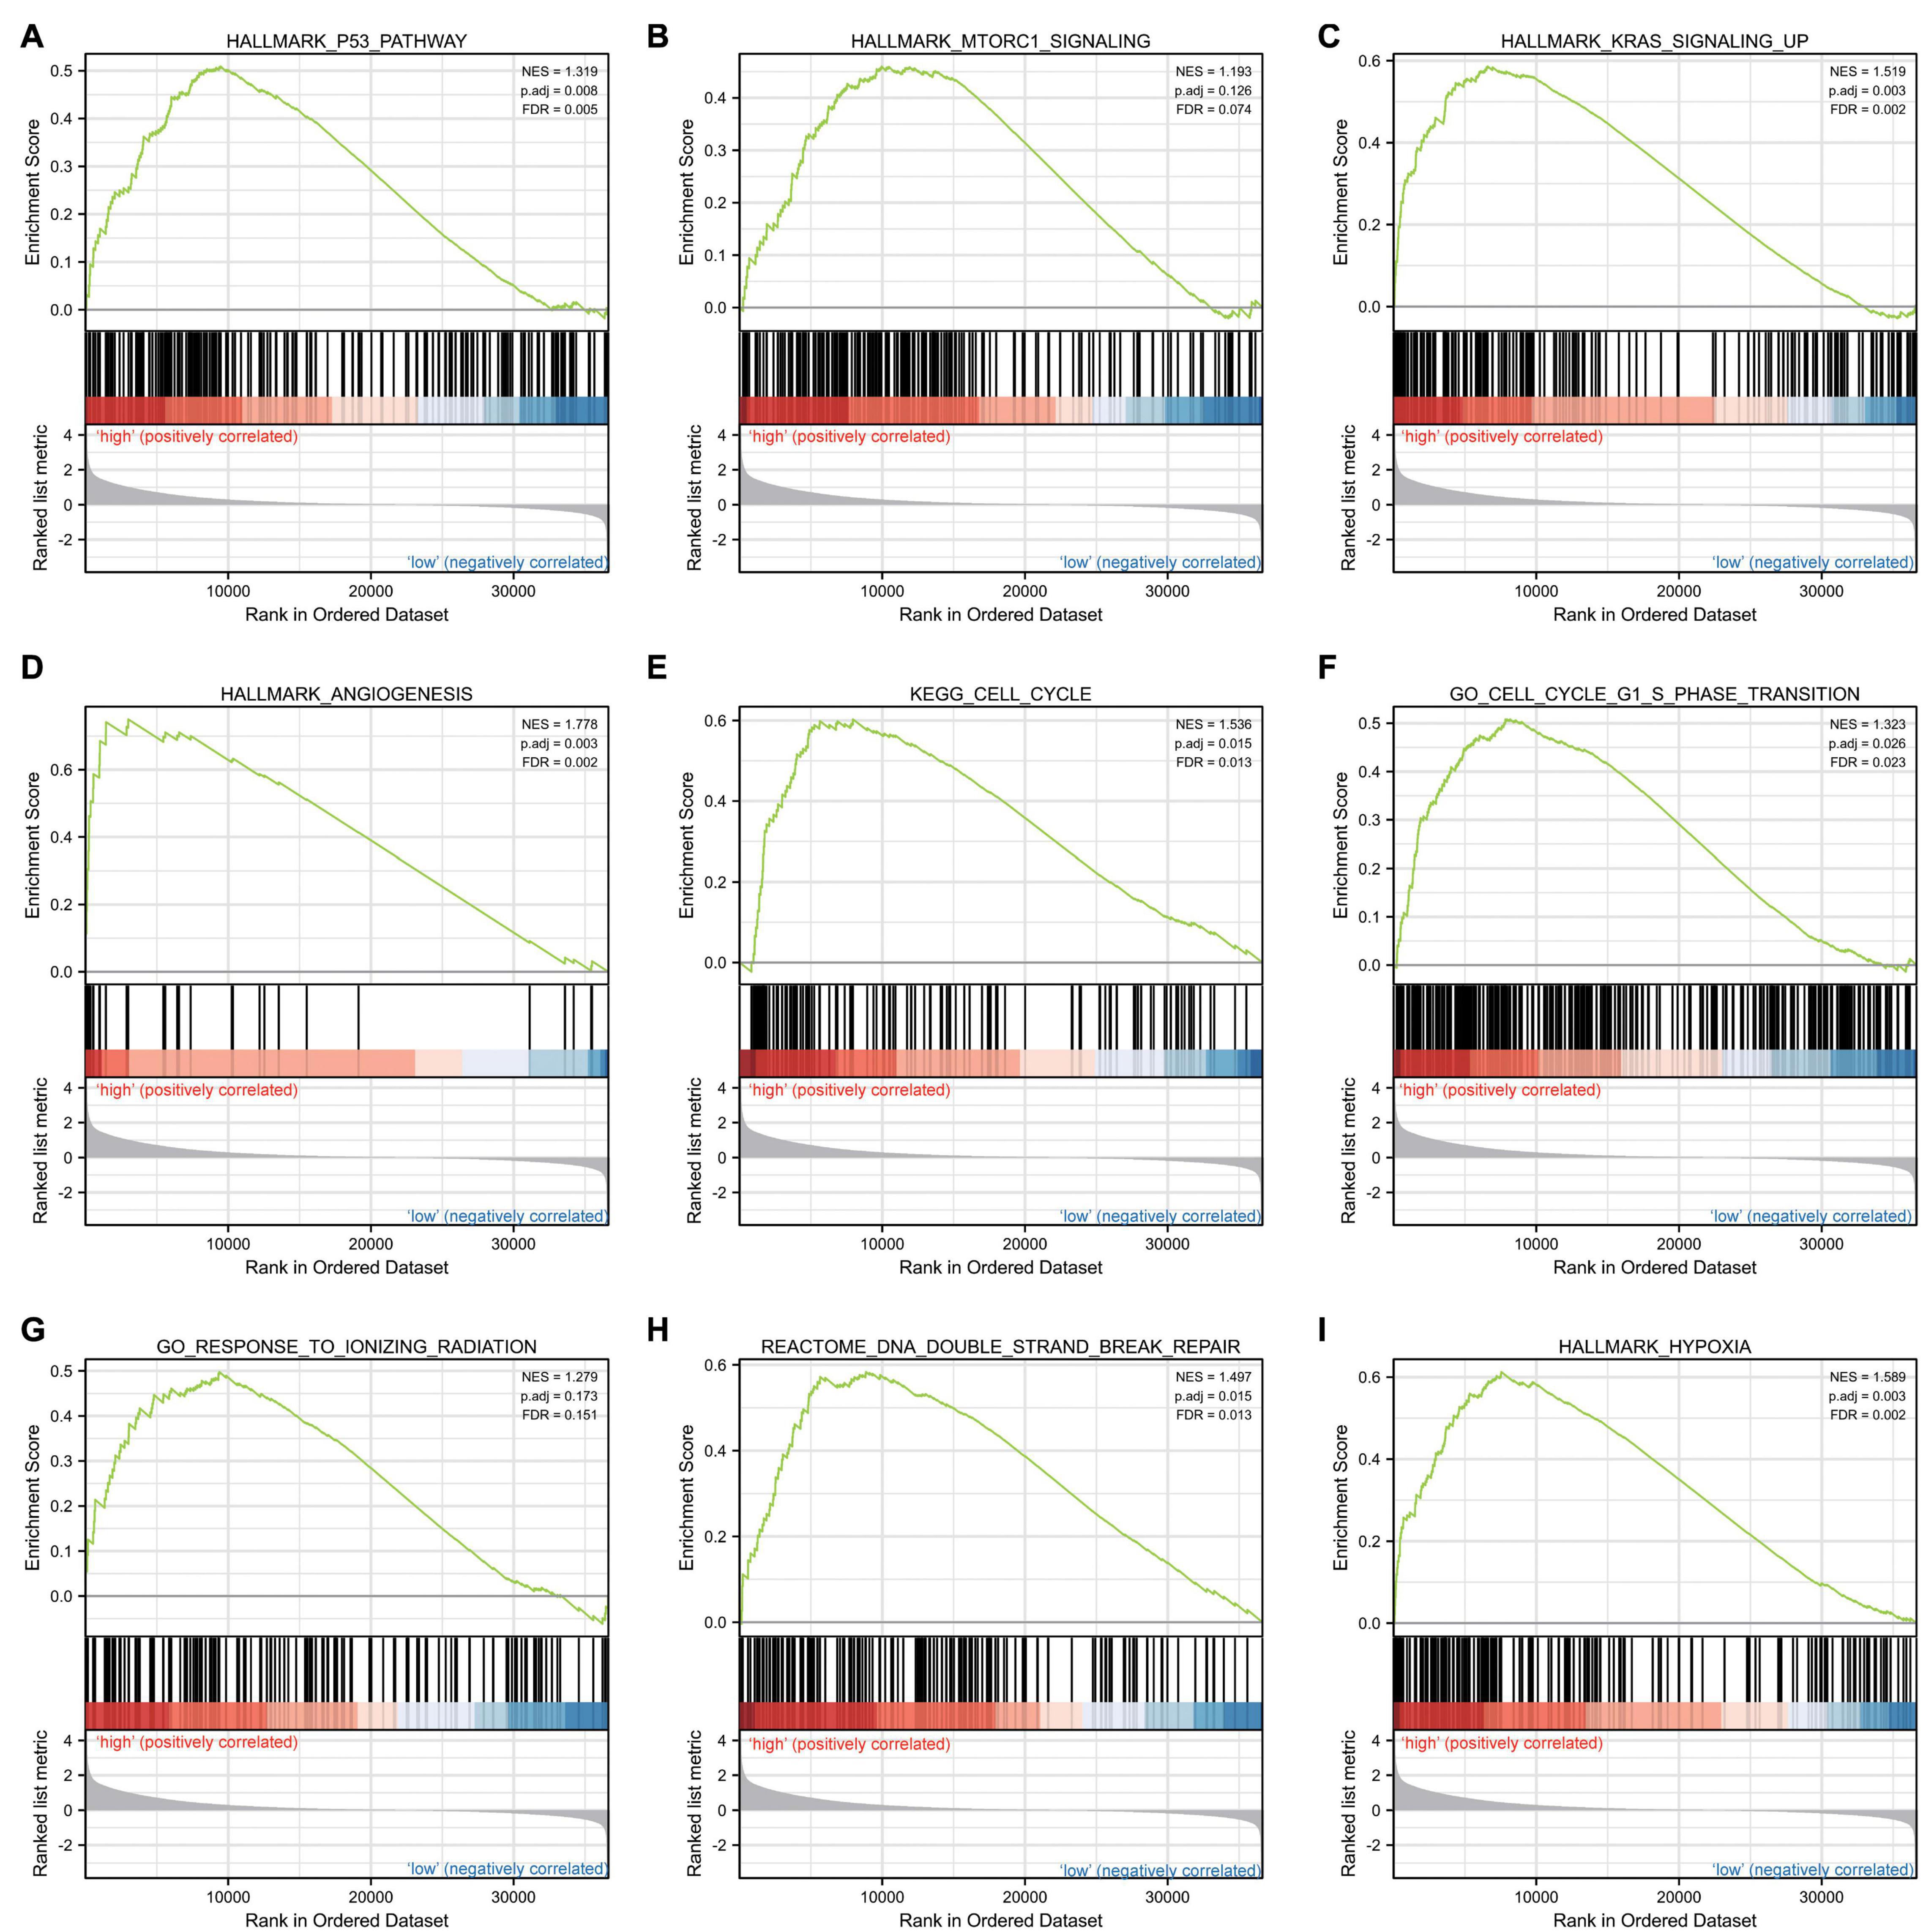
Figure 9. Enrichment plots from gene set enrichment analysis (GSEA). Several pathways and biological processes were enriched, including the (A) p53 pathway, (B) MTORC1 signaling, (C) KRAS signaling, (D) angiogenesis, (E) cell cycle, (F) cell cycle G1 S phase transition, (G) response to ionizing radiation, (H) DNA double strand repair and (I) hypoxia.
Correlation Between IER5 Expression and Immune Infiltration
We used Spearman correlation analysis to determine the association between the expression level (in TPM values) of IER5 and the immune cell invasion level (quantified by ssGSEA). As indicated in Figure 10, T helper 2 (Th2) cells were remarkably positively linked to IER5 expression, with a Spearman r value of 0.503 and a P-value < 0.001. Additionally, in contrast with the IER5-low expression group, the IER5-high expression group had a significantly higher enrichment score of Th2 cells as per the Wilcoxon rank sum test. The levels of other immune cells, including macrophages, eosinophils, activated dendritic cells (aDCs), and gamma delta (γδ) T cells, were moderately correlated with IER5 expression.
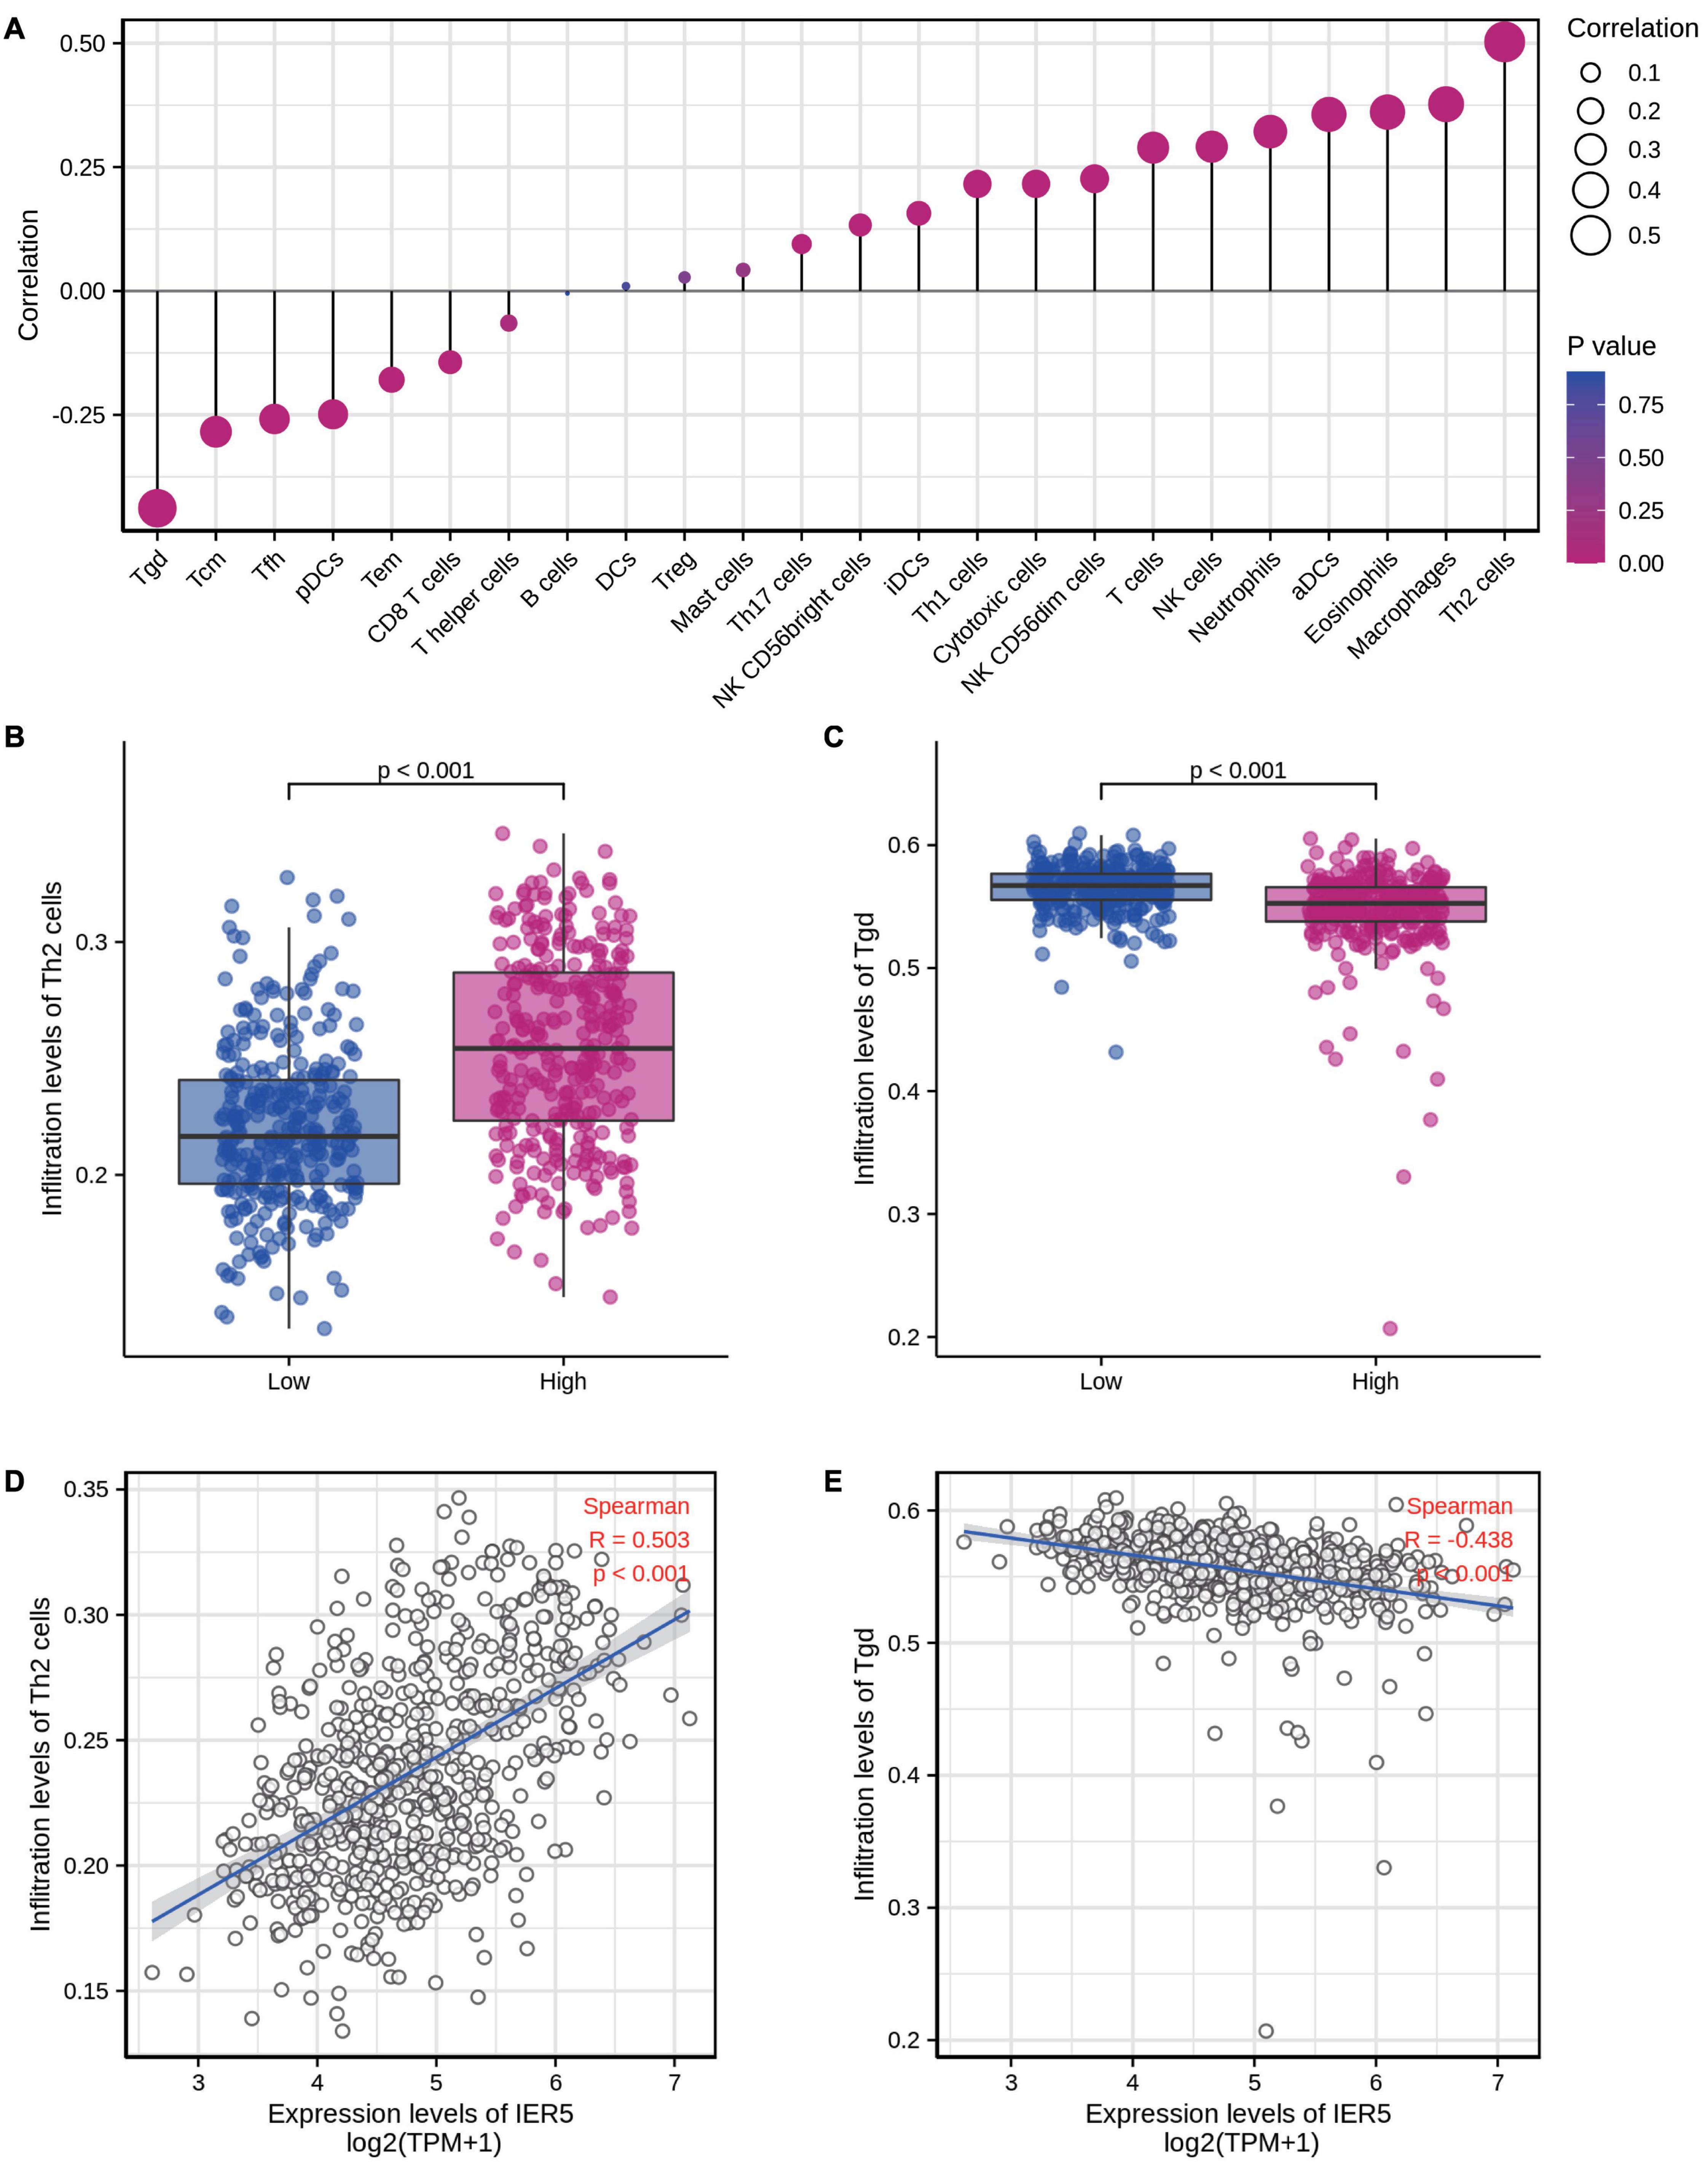
Figure 10. The expression level of IER5 was associated with immune infiltration in the tumor microenvironment. (A) Correlation between the relative abundances of 24 immune cells and IER5 expression levels. (B,C) Infiltration levels of Th2 cells and Tgd cells in the low- and high-IER5 expression groups. (D,E) Correlation between the relative enrichment score of Th2 cells and Tgd cells and the expression level of IER5.
Discussion
Previous investigations have reported the expression, as well as the functions of IER5 in cancers (Asano et al., 2016; Yang et al., 2016). Growth-promoting stimuli and genotoxic factors such as radiation can activate IER5 expression (Ishikawa and Sakurai, 2015; Shi et al., 2016). IER5 may influence cell proliferation along with survival in response to ionizing radiation and thermal stress by regulating cell cycle checkpoints (Ding et al., 2009, 2019). Nonetheless, the expression level of IER5 and its prognostic significance in glioma patients remain unclear.
Herein, bioinformatics analyses of the prognostic significance of IER5 expression in glioma patients were carried out using high-throughput RNA-sequencing data from TCGA. IER5 overexpression in glioma patients was correlated with advanced clinicopathological characteristics (advanced WHO grade, WT IDH status, a primary therapy outcome of CR, age ≤ 60 years, and 1p/19q codeletion), short survival time, as well as poor prognosis. We also found that IER5 expression was associated with poor prognosis in CGGA datasets. Moreover, we conducted IHC using a TMA to assess the association of the protein level of IER5 with the prognosis of individuals with glioma. The IHC results illustrated that individuals with high IER5 protein levels had poor prognosis. This result was consistent with our bioinformatic results. To elucidate the function of IER5 in glioma patients, we performed GSEA and found that pathways related to p53, MTORC1 signaling, angiogenesis, apoptosis, the cell cycle, KRAS signaling, and response to ionizing radiation were enriched differentially in the IER5-high expression phenotype. All the results suggest that the potential of IER5 as a prognostic biomarker and treatment target in glioma patients. In the following sections, we will discuss some critical points of our study.
We performed Kaplan-Meier survival assessment to explore the utility of IER5 expression levels in glioma patients stratified by clinicopathological characteristics. High IER5 contents were linked to poor prognosis in the subgroup analyses. These subgroups included groups categorized according to WHO grade, primary therapy outcome, age, gender, IDH status, histological type, 1p/19q codeletion, and EGFR status. The results strongly suggest that IER5 is a powerful prognostic biomarker within these subsets. It is interesting that the Kaplan–Meier survival analysis illustrated a remarkable association of IER5 expression level with OS in WT IDH status gliomas but not mutant gliomas in patients with 1p/19q codeletion gliomas but not in patients without 1p/19q codeletion. These results indicate that the relationship of IER5 expression level with survival may be influenced by IDH status, as well as 1p/19q codeletion.
We developed a nomogram to predict the survival of glioma patients. Our findings illustrate that IER5 is an independent prognostic marker for glioma. The nomogram included WHO grade, IDH status, primary therapy outcome, age, 1p/19q codeletion and IER5 expression. A previous study reported that age is an independent predictor of glioma prognosis, and an older age conferred a worse prognosis (Ostrom et al., 2014a). IDH mutation is an early event in gliomagenesis and prevents glioma progression (Weller et al., 2015). The codeletion of chromosome arms 1p, as well as 19q (1p/19q codeletion) is linked to glioma sensitivity to chemotherapy and the astrocytic histologic type (Eckel-Passow et al., 2015). Tumors without 1p/19q codeletion, WT IDH, PD as the primary therapy outcome and high WHO grade (III or IV) tend to have a poor outcome (Weller et al., 2015; Kristensen et al., 2019). Our results are consistent with those published in the literature. Based on the calibration plot, the actual values for 1, 3, and 5 year OS were in good agreement with the predicted values. Therefore, our nomogram could be a potential novel prognostic strategy to be used in the clinic in the future.
Previous studies have documented that IER5 may be employed as a molecular biomarker for biodosimetry purposes upon ionizing radiation exposure (Yu et al., 2017). Several studies have reported the functions of IER5 in the response to ionizing radiation and modulation of the cell cycle (Ding et al., 2009; Nakamura et al., 2011). The activation of IER5 after radiation may promote cell survival by modulating the cell cycle. In this study, we similarly found that IER5 was associated with positive modulation of the cell cycle and the G1/S phase transition and the response to ionizing radiation. Studies have reported that p53 activates IER5 transcription by localizing in the vicinity of its promoter upon DNA damage. The activation of IER5 can lead to tumor progression (Toma-Jonik et al., 2019). Herein, there was enrichment of the p53 cascade in the IER5-high expression phenotype. Besides, we established that high IER5 expression was linked to the KRAS signaling pathway, MTORC1 signaling pathway, hypoxia and angiogenesis by GSEA. These pathways and pathological processes are related to glioblastoma pathogenesis (Pachow et al., 2015; Boyd et al., 2021; Hajj et al., 2021). However, this is the first report of the association of IER5 expression with the KRAS signaling pathway, MTORC1 signaling pathway, hypoxia and angiogenesis. The precise regulatory mechanisms responsible for these associates remain incompletely understood and need to be further studied.
Another equally pivotal aspect of this study is the finding that IER5 expression is linked to the invading levels of diverse immune cells in glioma. We found that the associations of IER5 with Th2 cells and γδ T cells were the strongest. Our results show that the high IER5 expression group has increased levels of Th2 cell, whereas the levels of γδ T cells were decreased. Our results suggest possible mechanisms by which IER5 regulates the infiltration of Th2 cells, along with γδ T cells in glioma patients. Th2 cytokines such as IL-4, IL-10, IL-5, IL-9, and IL-6 can down-regulate tumor-specific immunity (Protti and De Monte, 2020). These cytokines along with their receptors were highly expressed in glioblastoma samples and cell lines (Hao et al., 2002). The overexpression of Th2 cytokines and increased Th1 infiltration in glioblastoma are associated with poor prognosis (Hao et al., 2002; Gousias et al., 2010; Piperi et al., 2011). γδ T cells paly vital roles in antitumor immunity and the ability to kill tumor cells (Lee et al., 2019). In glioblastoma patients, γδ T cell proliferation is impaired, and γδ T cell deficiency occurs in the tumor microenvironment (Bryant et al., 2009). We speculate that overexpression of IER5 promotes Th2 cell infiltration and induces γδ T cell depletion. This situation indicates an “immunosuppressive state” in glioblastoma and could account for the poor therapeutic effect of immunotherapy in such tumors. In summary, IER5 likely plays a core role in the modulation of immune cell infiltration in glioma. However, to understand the precise regulatory relationships between IER5 and immune cells, more preclinical and clinical data are needed.
Although our study revealed the association of IER5 with glioma, there were still some limitations that remain to be addressed. First, most of our findings were obtained from bioinformatics analysis and public databases, which lack experimental verification in cells. Second, our results were mainly based on the RNA sequencing data from TCGA data resource. Data on the expression levels of proteins other than IER5 in patients were lacking, and we could not explore the direct mechanism of IER5 in the development of glioma. Therefore, we will perform laboratory experiments to further validate our results and investigate the mechanism of IER5 in glioma.
In conclusion, the IER5 expression might serve as a reliable molecular marker for patient survival in glioma. Moreover, pathways related to the cell cycle, the P53 pathway, MTORC1 signaling, KRAS signaling, angiogenesis and response to ionizing radiation may be the key pathways regulated by IER5 in glioma patients. This study may be beneficial for elucidating the clinicopathological significance and molecular underpinning of glioma. However, further studies should be conducted to validate the molecular mechanism and the clinical application of IER5 as a prognostic indicator or therapeutic target for glioma patients.
Data Availability Statement
The original contributions presented in the study are included in the article/supplementary material, further inquiries can be directed to the corresponding author/s.
Author Contributions
MW and SL contributed to the conception of the study. ZW and DW performed the data analyses and wrote the manuscript. FZ, YZ, GZ, YM, and BS helped perform the analysis with constructive discussions. All authors contributed to the article and approved the submitted version.
Funding
This work was supported by the National Natural Science Foundation of China (Grant 81501462); the Sichuan Science and Technology Program (Grant 2019YJ0116); the Chengdu International Science and Technology Cooperation Funding (Grant 2019-GH02-00074-HZ); the 1⋅3⋅5 Project for Disciplines of Excellence-Clinical Research Incubation Project, West China Hospital, Sichuan University; and the Functional and Molecular Imaging Key Laboratory of Sichuan Province (Grant 2012JO0011).
Conflict of Interest
The authors declare that the research was conducted in the absence of any commercial or financial relationships that could be construed as a potential conflict of interest.
Footnotes
- ^ http://www.cgga.org.cn/index.jsp
- ^ http://metascape.org
- ^ http://www.bioconductor.org/packages/release/bioc/html/GSVA.html
- ^ https://www.egene.org.cn/cms/g-index.jhtml
References
Alexander, B. M., and Cloughesy, T. F. (2017). Adult Glioblastoma. J. Clin. Oncol. 35, 2402–2409. doi: 10.1200/JCO.2017.73.0119
Asano, Y., Kawase, T., Okabe, A., Tsutsumi, S., Ichikawa, H., Tatebe, S., et al. (2016). IER5 generates a novel hypo-phosphorylated active form of HSF1 and contributes to tumorigenesis. Sci. Rep. 6:19174. doi: 10.1038/srep19174
Barretina, J., Caponigro, G., Stransky, N., Venkatesan, K., Margolin, A. A., Kim, S., et al. (2012). The Cancer Cell Line Encyclopedia enables predictive modelling of anticancer drug sensitivity. Nature 483, 603–607. doi: 10.1038/nature11003
Bindea, G., Mlecnik, B., Tosolini, M., Kirilovsky, A., Waldner, M., Obenauf, A. C., et al. (2013). Spatiotemporal dynamics of intratumoral immune cells reveal the immune landscape in human cancer. Immunity 39, 782–795. doi: 10.1016/j.immuni.2013.10.003
Boyd, N. H., Tran, A. N., Bernstock, J. D., Etminan, T., Jones, A. B., Gillespie, G. Y., et al. (2021). Glioma stem cells and their roles within the hypoxic tumor microenvironment. Theranostics 11, 665–683. doi: 10.7150/thno.41692
Bryant, N. L., Suarez-Cuervo, C., Gillespie, G. Y., Markert, J. M., Nabors, L. B., Meleth, S., et al. (2009). Characterization and immunotherapeutic potential of gammadelta T-cells in patients with glioblastoma. Neuro. Oncol. 11, 357–367. doi: 10.1215/15228517-2008-111
Ding, K.-K., Shang, Z.-F., Hao, C., Xu, Q.-Z., Shen, J.-J., Yang, C.-J., et al. (2009). Induced expression of the IER5 gene by gamma-ray irradiation and its involvement in cell cycle checkpoint control and survival. Radiat. Environ. Biophys. 48, 205–213. doi: 10.1007/s00411-009-0213-4
Ding, K.-K., Yang, F., Jiang, H.-Q., Yuan, Z.-Q., Yin, L.-L., Dong, L.-Y., et al. (2019). Overexpression of the immediate early response 5 gene increases the radiosensitivity of HeLa cells. Oncol. Lett. 18, 2704–2711. doi: 10.3892/ol.2019.10590
Eckel-Passow, J. E., Lachance, D. H., Molinaro, A. M., Walsh, K. M., Decker, P. A., Sicotte, H., et al. (2015). Glioma Groups Based on 1p/19q, IDH, and TERT Promoter Mutations in Tumors. N. Engl. J. Med. 372, 2499–2508. doi: 10.1056/NEJMoa1407279
Gousias, K., Markou, M., Arzoglou, V., Voulgaris, S., Vartholomatos, G., Kostoula, A., et al. (2010). Frequent abnormalities of the immune system in gliomas and correlation with the WHO grading system of malignancy. J. Neuroimmunol. 226, 136–142. doi: 10.1016/j.jneuroim.2010.05.027
Gusyatiner, O., and Hegi, M. E. (2018). Glioma epigenetics: from subclassification to novel treatment options. Semin. Cancer Biol. 51, 50–58. doi: 10.1016/j.semcancer.2017.11.010
Hajj, G. N. M., Nunes, P. B. C., and Roffe, M. (2021). Genome-wide translation patterns in gliomas: an integrative view. Cell. Signal. 79:109883. doi: 10.1016/j.cellsig.2020.109883
Hao, C., Parney, I. F., Roa, W. H., Turner, J., Petruk, K. C., and Ramsay, D. A. (2002). Cytokine and cytokine receptor mRNA expression in human glioblastomas: evidence of Th1, Th2 and Th3 cytokine dysregulation. Acta Neuropathol. 103, 171–178.
Ishikawa, Y., Kawabata, S., and Sakurai, H. (2015). HSF1 transcriptional activity is modulated by IER5 and PP2A/B55. FEBS Lett. 589, 1150–1155. doi: 10.1016/j.febslet.2015.03.019
Ishikawa, Y., and Sakurai, H. (2015). Heat-induced expression of the immediate-early gene IER5 and its involvement in the proliferation of heat-shocked cells. FEBS J. 282, 332–340. doi: 10.1111/febs.13134
Kawabata, S., Ishita, Y., Ishikawa, Y., and Sakurai, H. (2015). Immediate-early response 5 (IER5) interacts with protein phosphatase 2A and regulates the phosphorylation of ribosomal protein S6 kinase and heat shock factor 1. FEBS Lett. 589, 3679–3685. doi: 10.1016/j.febslet.2015.10.013
Kleihues, P., Louis, D. N., Scheithauer, B. W., Rorke, L. B., Reifenberger, G., Burger, P. C., et al. (2002). The WHO classification of tumors of the nervous system. J. Neuropathol. Exp. Neurol. 61, 215–25.
Kristensen, B. W., Priesterbach-Ackley, L. P., Petersen, J. K., and Wesseling, P. (2019). Molecular pathology of tumors of the central nervous system. Ann. Oncol. 30, 1265–1278. doi: 10.1093/annonc/mdz164
Lee, M., Park, C., Woo, J., Kim, J., Kho, I., Nam, D.-H., et al. (2019). Preferential Infiltration of Unique Vγ9Jγ2-Vd2 T Cells Into Glioblastoma Multiforme. Front. Immunol. 10:555. doi: 10.3389/fimmu.2019.00555
Liu, J. K., Lubelski, D., Schonberg, D. L., Wu, Q., Hale, J. S., Flavahan, W. A., et al. (2014). Phage display discovery of novel molecular targets in glioblastoma-initiating cells. Cell Death Differ. 21, 1325–1339. doi: 10.1038/cdd.2014.65
Liu, Q., Wang, X.-Y., Qin, Y.-Y., Yan, X.-L., Chen, H.-M., Huang, Q.-D., et al. (2018). SPOCD1 promotes the proliferation and metastasis of glioma cells by up-regulating PTX3. Am. J. Cancer Res. 8, 624–635.
Louis, D. N., Ohgaki, H., Wiestler, O. D., Cavenee, W. K., Burger, P. C., Jouvet, A., et al. (2007). The 2007 WHO classification of tumours of the central nervous system. Acta Neuropathol. 114, 97–109.
Love, M. I., Huber, W., and Anders, S. (2014). Moderated estimation of fold change and dispersion for RNA-seq data with DESeq2. Genome Biol. 15:550.
Nakamura, S., Nagata, Y., Tan, L., Takemura, T., Shibata, K., Fujie, M., et al. (2011). Transcriptional repression of Cdc25B by IER5 inhibits the proliferation of leukemic progenitor cells through NF-YB and p300 in acute myeloid leukemia. PLoS One 6:e28011. doi: 10.1371/journal.pone.0028011
Ostrom, Q. T., Bauchet, L., Davis, F. G., Deltour, I., Fisher, J. L., Langer, C. E., et al. (2014a). The epidemiology of glioma in adults: a “state of the science” review. Neuro. Oncol. 16, 896–913.
Ostrom, Q. T., Gittleman, H., Liao, P., Rouse, C., Chen, Y., Dowling, J., et al. (2014b). CBTRUS statistical report: primary brain and central nervous system tumors diagnosed in the United States in 2007-2011. Neuro. Oncol. 16, iv1–63. doi: 10.1093/neuonc/nou223
Pachow, D., Wick, W., Gutmann, D. H., and Mawrin, C. (2015). The mTOR signaling pathway as a treatment target for intracranial neoplasms. Neuro Oncol. 17, 189–199. doi: 10.1093/neuonc/nou164
Piperi, C., Samaras, V., Levidou, G., Kavantzas, N., Boviatsis, E., Petraki, K., et al. (2011). Prognostic significance of IL-8-STAT-3 pathway in astrocytomas: correlation with IL-6, VEGF and microvessel morphometry. Cytokine 55, 387–395. doi: 10.1016/j.cyto.2011.05.012
Pontén, F., Jirström, K., and Uhlen, M. (2008). The Human Protein Atlas–a tool for pathology. J. Pathol. 216, 387–393. doi: 10.1002/path.2440
Protti, M. P., and De Monte, L. (2020). Thymic Stromal Lymphopoietin and Cancer: th2-Dependent and -Independent Mechanisms. Front. Immunol. 11:2088. doi: 10.3389/fimmu.2020.02088
Robin, X., Turck, N., Hainard, A., Tiberti, N., Lisacek, F., Sanchez, J.-C., et al. (2011). pROC: an open-source package for R and S+ to analyze and compare ROC curves. BMC Bioinform. 12:77. doi: 10.1186/1471-2105-12-77
Shi, H.-M., Ding, K.-K., Zhou, P.-K., Guo, D.-M., Chen, D., Li, Y.-S., et al. (2016). Radiation-induced expression of is dose-dependent and not associated with the clinical outcomes of radiotherapy in cervical cancer. Oncol. Lett. 11, 1309–1314.
Stupp, R., Mason, W. P., van den Bent, M. J., Weller, M., Fisher, B., Taphoorn, M. J. B., et al. (2005). Radiotherapy plus concomitant and adjuvant temozolomide for glioblastoma. New Engl. J. Med. 352, 987–996.
Thakkar, J. P., Dolecek, T. A., Horbinski, C., Ostrom, Q. T., Lightner, D. D., Barnholtz-Sloan, J. S., et al. (2014). Epidemiologic and molecular prognostic review of glioblastoma. Cancer Epidemiol. Biomark. Preven. 23, 1985–1996. doi: 10.1158/1055-9965.EPI-14-0275
Toma-Jonik, A., Vydra, N., Janus, P., and Widłak, W. (2019). Interplay between HSF1 and p53 signaling pathways in cancer initiation and progression: non-oncogene and oncogene addiction. Cell. Oncol. 42, 579–589. doi: 10.1007/s13402-019-00452-0
Vivian, J., Rao, A. A., Nothaft, F. A., Ketchum, C., Armstrong, J., Novak, A., et al. (2017). Toil enables reproducible, open source, big biomedical data analyses. Nat. Biotechnol. 35, 314–316. doi: 10.1038/nbt.3772
Vredenburgh, J. J., Desjardins, A., Herndon, J. E., Dowell, J. M., Reardon, D. A., Quinn, J. A., et al. (2007). Phase II trial of bevacizumab and irinotecan in recurrent malignant glioma. Clin. Cancer Res. 13, 1253–1259.
Weller, M., Wick, W., Aldape, K., Brada, M., Berger, M., Pfister, S. M., et al. (2015). Glioma. Nat. Rev. Dis. Primers 1:15017. doi: 10.1038/nrdp.2015.17
Yang, C., Wang, Y., Hao, C., Yuan, Z., Liu, X., Yang, F., et al. (2016). IER5 promotes irradiation- and cisplatin-induced apoptosis in human hepatocellular carcinoma cells. Am. J. Transl. Res. 8, 1789–1798.
Yang, R., Wang, M., Zhang, G., Bao, Y., Wu, Y., Li, X., et al. (2020). E2F7-EZH2 axis regulates PTEN/AKT/mTOR signalling and glioblastoma progression. Br. J. Cancer 123, 1445–1455. doi: 10.1038/s41416-020-01032-y
Yu, G., Wang, L.-G., Han, Y., and He, Q.-Y. (2012). clusterProfiler: an R package for comparing biological themes among gene clusters. J. Integr. Biol. 16, 284–287. doi: 10.1089/omi.2011.0118
Yu, X.-P., Wu, Y.-M., Liu, Y., Tian, M., Wang, J.-D., Ding, K.-K., et al. (2017). IER5 is involved in DNA Double-Strand Breaks Repair in Association with PAPR1 in Hela Cells. Int. J. Med. Sci. 14, 1292–1300. doi: 10.7150/ijms.21510
Keywords: IER5, glioma, prognosis, bioinformatics analysis, biomarker
Citation: Wu Z, Wang D, Zeng F, Zhang Y, Zhu G, Ma Y, Song B, Lui S and Wu M (2021) High IER5 Gene Expression Is Associated With Poor Prognosis in Glioma Patients. Front. Cell Dev. Biol. 9:679684. doi: 10.3389/fcell.2021.679684
Received: 19 March 2021; Accepted: 13 May 2021;
Published: 17 June 2021.
Edited by:
Rossella Rota, Bambino Gesù Children Hospital (IRCCS), ItalyCopyright © 2021 Wu, Wang, Zeng, Zhang, Zhu, Ma, Song, Lui and Wu. This is an open-access article distributed under the terms of the Creative Commons Attribution License (CC BY). The use, distribution or reproduction in other forums is permitted, provided the original author(s) and the copyright owner(s) are credited and that the original publication in this journal is cited, in accordance with accepted academic practice. No use, distribution or reproduction is permitted which does not comply with these terms.
*Correspondence: Min Wu, d3VtaW5zY3VAc2N1LmVkdS5jbg==; Su Lui, bHVzdXdjdW1zQHRvbS5jb20=
†These authors have contributed equally to this work and share first authorship