 Benchen Rao1,2†
 Jianhao Li1,2†
 Tong Ren3†
 Jing Yang4
 Guizhen Zhang1,2
 Liwen Liu1,2
 Haiyu Wang1,2
 Maoxin Huang5
 Zhigang Ren1,2*
 Zujiang Yu1,2*
- 1Department of Infectious Diseases, The First Affiliated Hospital of Zhengzhou University, Zhengzhou, China
- 2Precision Medicine Center, Gene Hospital of Henan Province, The First Affiliated Hospital of Zhengzhou University, Zhengzhou, China
- 3Department of Breast Surgery, The Affiliated Cancer Hospital of Zhengzhou University, Zhengzhou, China
- 4Department of Pharmacy, The First Affiliated Hospital of Zhengzhou University, Zhengzhou, China
- 5Department of Dermatology, The First Affiliated Hospital of Zhengzhou University, Zhengzhou, China
Background: Hepatocellular carcinoma (HCC) is one of the most common malignancies, and the therapeutic outcome remains undesirable due to its recurrence and metastasis. Gene dysregulation plays a pivotal role in the occurrence and progression of cancer, and the molecular mechanisms are largely unknown.
Methods: The differentially expressed genes of HCC screened from the GSE39791 dataset were used to conduct weighted gene co-expression network analysis. The selected hub genes were validated in The Cancer Genome Atlas (TCGA) database and 11 HCC datasets from the Gene Expression Omnibus (GEO) database. Then, a tissue microarray comprising 90 HCC specimens and 90 adjacent normal specimens was used to validate the hub genes. Moreover, the Hallmark, Gene Ontology (GO) and Kyoto Encyclopedia of Genes and Genomes (KEGG) databases were used to identify enriched pathways. Then, we conducted the immune infiltration analysis.
Results: A total of 17 co-expression modules were obtained by weighted gene co-expression network analysis. The green, blue, and purple modules were the most relevant to HCC samples. Four hub genes, RPL19, RPL35A, RPL27A, and RPS12, were identified. Interestingly, we found that all four genes were highly expressed in HCC and that their high expression was related to a poor prognosis by analyzing the TCGA and GEO databases. Furthermore, we investigated RPL19 in HCC tissue microarrays and demonstrated that RPL19 was overexpressed in tumor tissues compared with non-tumor tissues (p = 0.016). Moreover, overexpression of RPL19 predicted a poor prognosis in hepatocellular carcinoma (p < 0.0007). Then, enrichment analysis revealed that cell cycle pathways were significantly enriched, and bile acid metabolism-related pathways were significantly down-regulated when RPL19 was highly expressed. Furthermore, immune infiltration analysis showed that immune response was suppressed.
Conclusion: Our study demonstrates that RPL19 may play an important role in promoting tumor progression and is correlated with a poor prognosis in HCC. RPL19 may serve as a promising biomarker and therapeutic target for the precise diagnosis and treatment of HCC in the future.
Introduction
Liver cancer is one of the leading causes of global disease burden worldwide, with 42,810 new cases and 30,160 deaths in 2020 (Yu and Schwabe, 2017; Siegel et al., 2020). Hepatocellular carcinoma (HCC) is the most frequent and common type of primary liver cancer and is attributed mainly to the progression of chronic liver disease. Most HCC patients are diagnosed in the advanced stage, and it has been reported that the 5-year recurrence rate is more than 70% (Rahbari et al., 2011). In view of the high incidence and mortality of HCC, it is imperative to find a novel biomarker for diagnosis, prognosis and treatment to improve the patient survival rate.
With the development of high-throughput research methods, precious resources for the analysis of whole-genome co-expression networks and screening of tumor biomarkers associated with prognosis and phenotypes have been provided by a large public transcriptome database. Weighted gene co-expression network analysis (WGCNA) is suitable for multisample complex data analysis and can be used to analyze the relationship between gene clusters and sample phenotypes and the networks between genes in gene sets to identify key transition genes (Panwar et al., 2021). Currently, systematic biological analysis has been widely used to identify diagnostic and prognostic markers and therapeutic targets. For instance, two modules and 10 hub genes identified by Zhang et al. (2018) were related to the tumorigenesis of oral squamous cell carcinoma. Two cervical squamous cell carcinoma-related hub modules and 116 hub genes were identified by the WGCNA method (Liu et al., 2019). Ribosomal protein L19 (RPL19) as a hub gene was identified in HCC by WGCNA in this study. RPL19 is a member of the ribosomal protein family that assembles to form small and large ribosomal subunits. RPL19 has been reported as a biomarker for many cancers (Dressman et al., 2003; Bee et al., 2006; Huang et al., 2008). However, the diagnostic, prognostic and therapeutic value of RPL19 in HCC has not been investigated.
In this study, WGCNA was conducted based on the GSE39791 dataset, which included 144 HCC and paracancerous tissues. After screening, 54 pairs of HCC and paracancerous tissues were selected to identify 17 co-expression modules and four hub genes (RPS12, RPL19, RPL35A, and RPL27A). Then, we screened the above four genes again in The Cancer Genome Atlas (TCGA) and Gene Expression Omnibus (GEO) databases. Subsequently, we validated RPL19 in an HCC tissue microarray. RPL19 was speculated to be a prognostic biomarker and promote tumor progression in HCC.
Materials and Methods
Datasets
The study design is shown in a flow diagram (Figure 1). GSE39791 tissue chip data for 144 cancer samples (72 pairs of HCC and paracancerous samples paired one by one) were downloaded from the GEO database1, and corresponding sample information was used to conduct WGCNA (Kim et al., 2014). Then, to verify the results of the above analysis, we searched the GEO and TCGA database again. A total of 369 liver cancer data and 50 non-tumor data points were obtained from the TCGA database2. We used the GEO to gather and analyze 11 liver cancer mRNA microarray datasets. BRB-array tools were used to determine the differentially expressed genes between HCC tissues and normal liver tissues in each dataset. Detailed information is shown in Table 1. The human protein–protein interactions (PPI) were compiled from the Human Integrated Protein–Protein Interaction rEference (HIPPIE) database3 (Misselbeck et al., 2019).
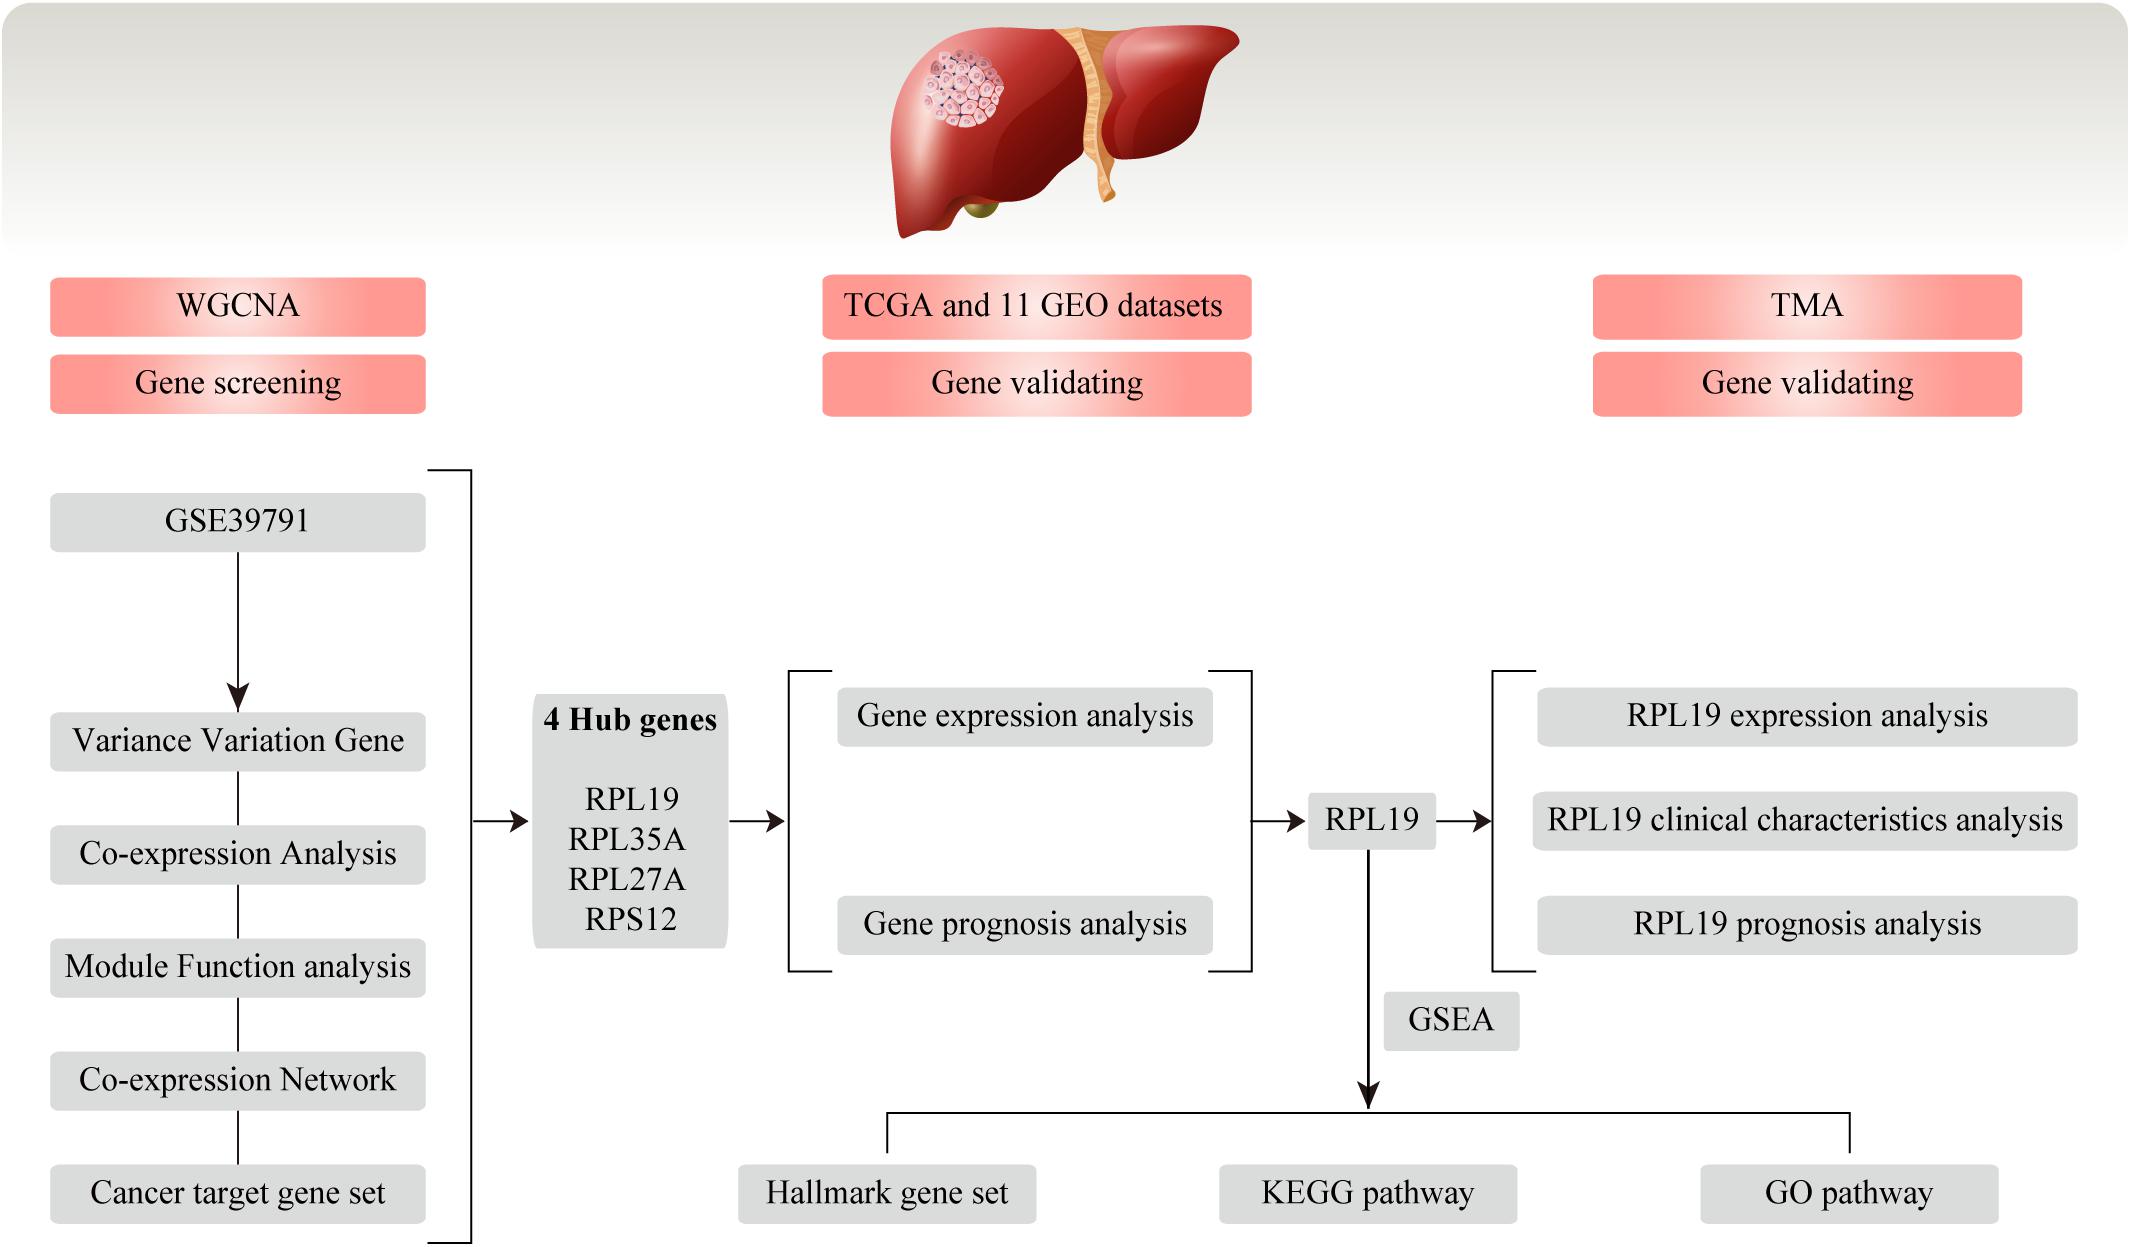
Figure 1. Flow chart for this study. In this study, we conducted WGCNA and screened four hub genes (RPL19, RPL35A, RPL27A, and RPS12) based on the GEO database GSE39791. Then, the four hub genes were validated in TCGA database and 11 GEO datasets. Moreover, we chose RPL19 as a key gene and validated it in the TMA. WGCNA, weighted gene co-expression network analysis; GEO, Gene Expression Omnibus; TCGA, The Cancer Genome Atlas; TMA, tissue microarray; HCC, hepatocellular carcinoma; GSEA, gene set enrichment analysis; KEGG, Kyoto Encyclopedia of Genes and Genomes; GO, Gene Ontology.
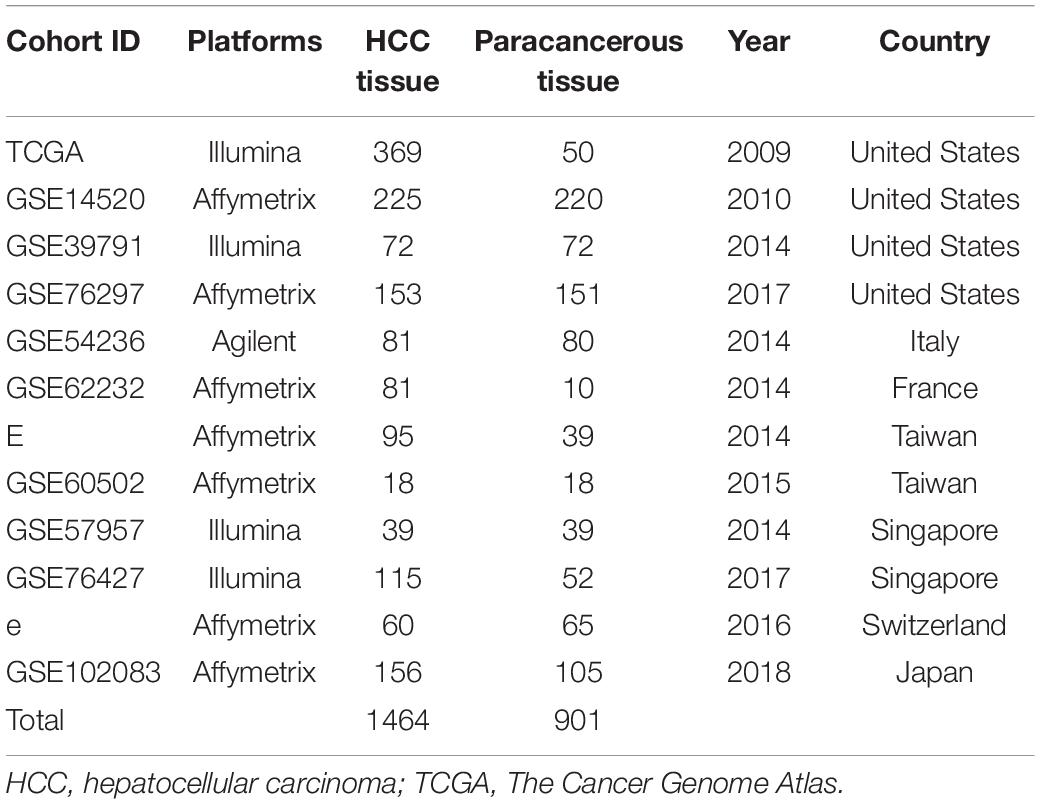
Table 1. HCC expression profile cohorts used in this study.
Construction of the Co-expression Network
Weighted gene co-expression network analysis is a systematic biology method that uses gene expression data to construct a scale-free network. WGCNA analyzes thousands of genes with the greatest changes instead of genes that are differentially expressed, and at the same time it converts the associations between thousands of genes and phenotypes into associations between several gene sets and phenotypes, eliminating the problem of multiple hypothesis testing and correction. First, we selected the expression data of genes that changed in each sample (seed genes) and used the R software package WGCNA to construct a weighted gene co-expression network. We calculated the coefficient of variation (CV) for each gene and chose 3.6 as the cut-off value to identify the differentially expressed genes (DEGs). Then, a soft threshold of β = 6 was chosen to ensure that the co-expression network was a scale-free distribution. And we screened the co-expression module. Next, the expression matrix was converted to an adjacency matrix and then to a topological matrix. Based on TOM, clustering was accomplished by using the average linkage algorithm. In accordance with the dynamic hybrid tree cutting algorithm, the minimum number of genes (lncRNAs) in the network module was set to 30. We calculated the eigengenes of each module, conducted cluster analysis on the modules, merged the close modules into new modules and set the height = 0.25. The higher the correlation coefficient is, the more important the module. According to the expression relationship of the genes in each co-expression module, we chose the co-expression pairs whose co-expression weights were larger than 0.1 as the edges of the final co-expression network.
Tissue Samples
The tissue microarray (TMA) from Asians containing 90 normal liver specimens and 90 HCC specimens (HLiv-HCC180Sur-15) from cancer-adjacent tissues was purchased from Shanghai Outdo Biotech Co., Ltd. We further validated RPL19 expression and its prognostic value in HCC by TMA. None prior radiotherapy, immunotherapy or chemotherapy were conducted on the patients whose samples were included in the TMA before surgery. This study was approved by the Ethics Committee of The First Affiliated Hospital of Zhengzhou University, Zhengzhou, China.
Immunohistochemistry (IHC) Staining
Immunohistochemistry staining was carried out as described previously (Cui et al., 2019). According to the Remmele scoring system (Remmele et al., 1986), four fields of view were randomly selected under low and high power, 100 cells were counted in each field, and the percentage of RPL19 cytoplasmic staining in each field of power was calculated as a percentage of positive cells. Two experienced pathologists separately evaluated the immunostained samples. The results were divided into four groups: score 1, <25%; score 2, 25%∼50%; score 3, 50%∼75%; and score 4, >75%. Scores of 1 and 2 were defined as low expression, and scores of 3 and 4 were defined as high expression.
Biological Functional Analysis
The Metascape software4 was used to analyze the functional gene clustering. The Kyoto Encyclopedia of Genes and Genomes (KEGG) database5, Gene Ontology (GO) gene sets6 and Hallmark gene sets7 were used to conduct gene set enrichment analysis (GSEA).
Single-Sample Gene Set Enrichment Analysis (ssGSEA)
The ssGSEA in R package gsva was used to quantify the infiltration levels of the immune cell types. SsGSEA applies gene signatures expressed by immune cell populations to individual cancer samples. We used the deconvolution approach to analyze the immune cells involved innate immunity and adaptive immunity.
Statistical Analysis
All statistical tests and graphing were performed using R software (version 3.4.3)8 and GraphPad Prism 7.0 (GraphPad Software, San Diego, United States). Differences between two groups were analyzed by Student’s t-test. Clinicopathologic variables were analyzed by chi-square tests. The overall survival (OS), relapse-free survival (RFS), and progress-free survival (PFS) of HCC patients were calculated with Kaplan–Meier curves and log-rank tests. GSEA was used to determine which gene sets were associated with the expression of hub genes in datasets. P < 0.05 was considered to be statistically significant.
Results
Construction of the Weighted Co-expression Network
We downloaded the raw data of GSE39791, which includes 144 HCC and paracancerous tissues, to construct the gene co-expression networks. Results of the cluster analysis of the correlation between samples are shown in Figure 2. However, it can be clearly seen that the correlations between HCC samples can be divided into two groups (Figure 2A), and the intragroup correlation was high, which showed that these samples had some heterogeneity. The paracancerous tissue samples could be divided into three groups because two samples had weak correlations (Figure 2B). We chose the group with the highest correlation as the datasets for this study. Given that the cancer and paracancerous samples were paired, we ultimately selected 54 pairs of samples. A total of 31,334 genes were obtained (Supplementary Table 1). Then, 7,814 DEGs were identified (Supplementary Table 2).
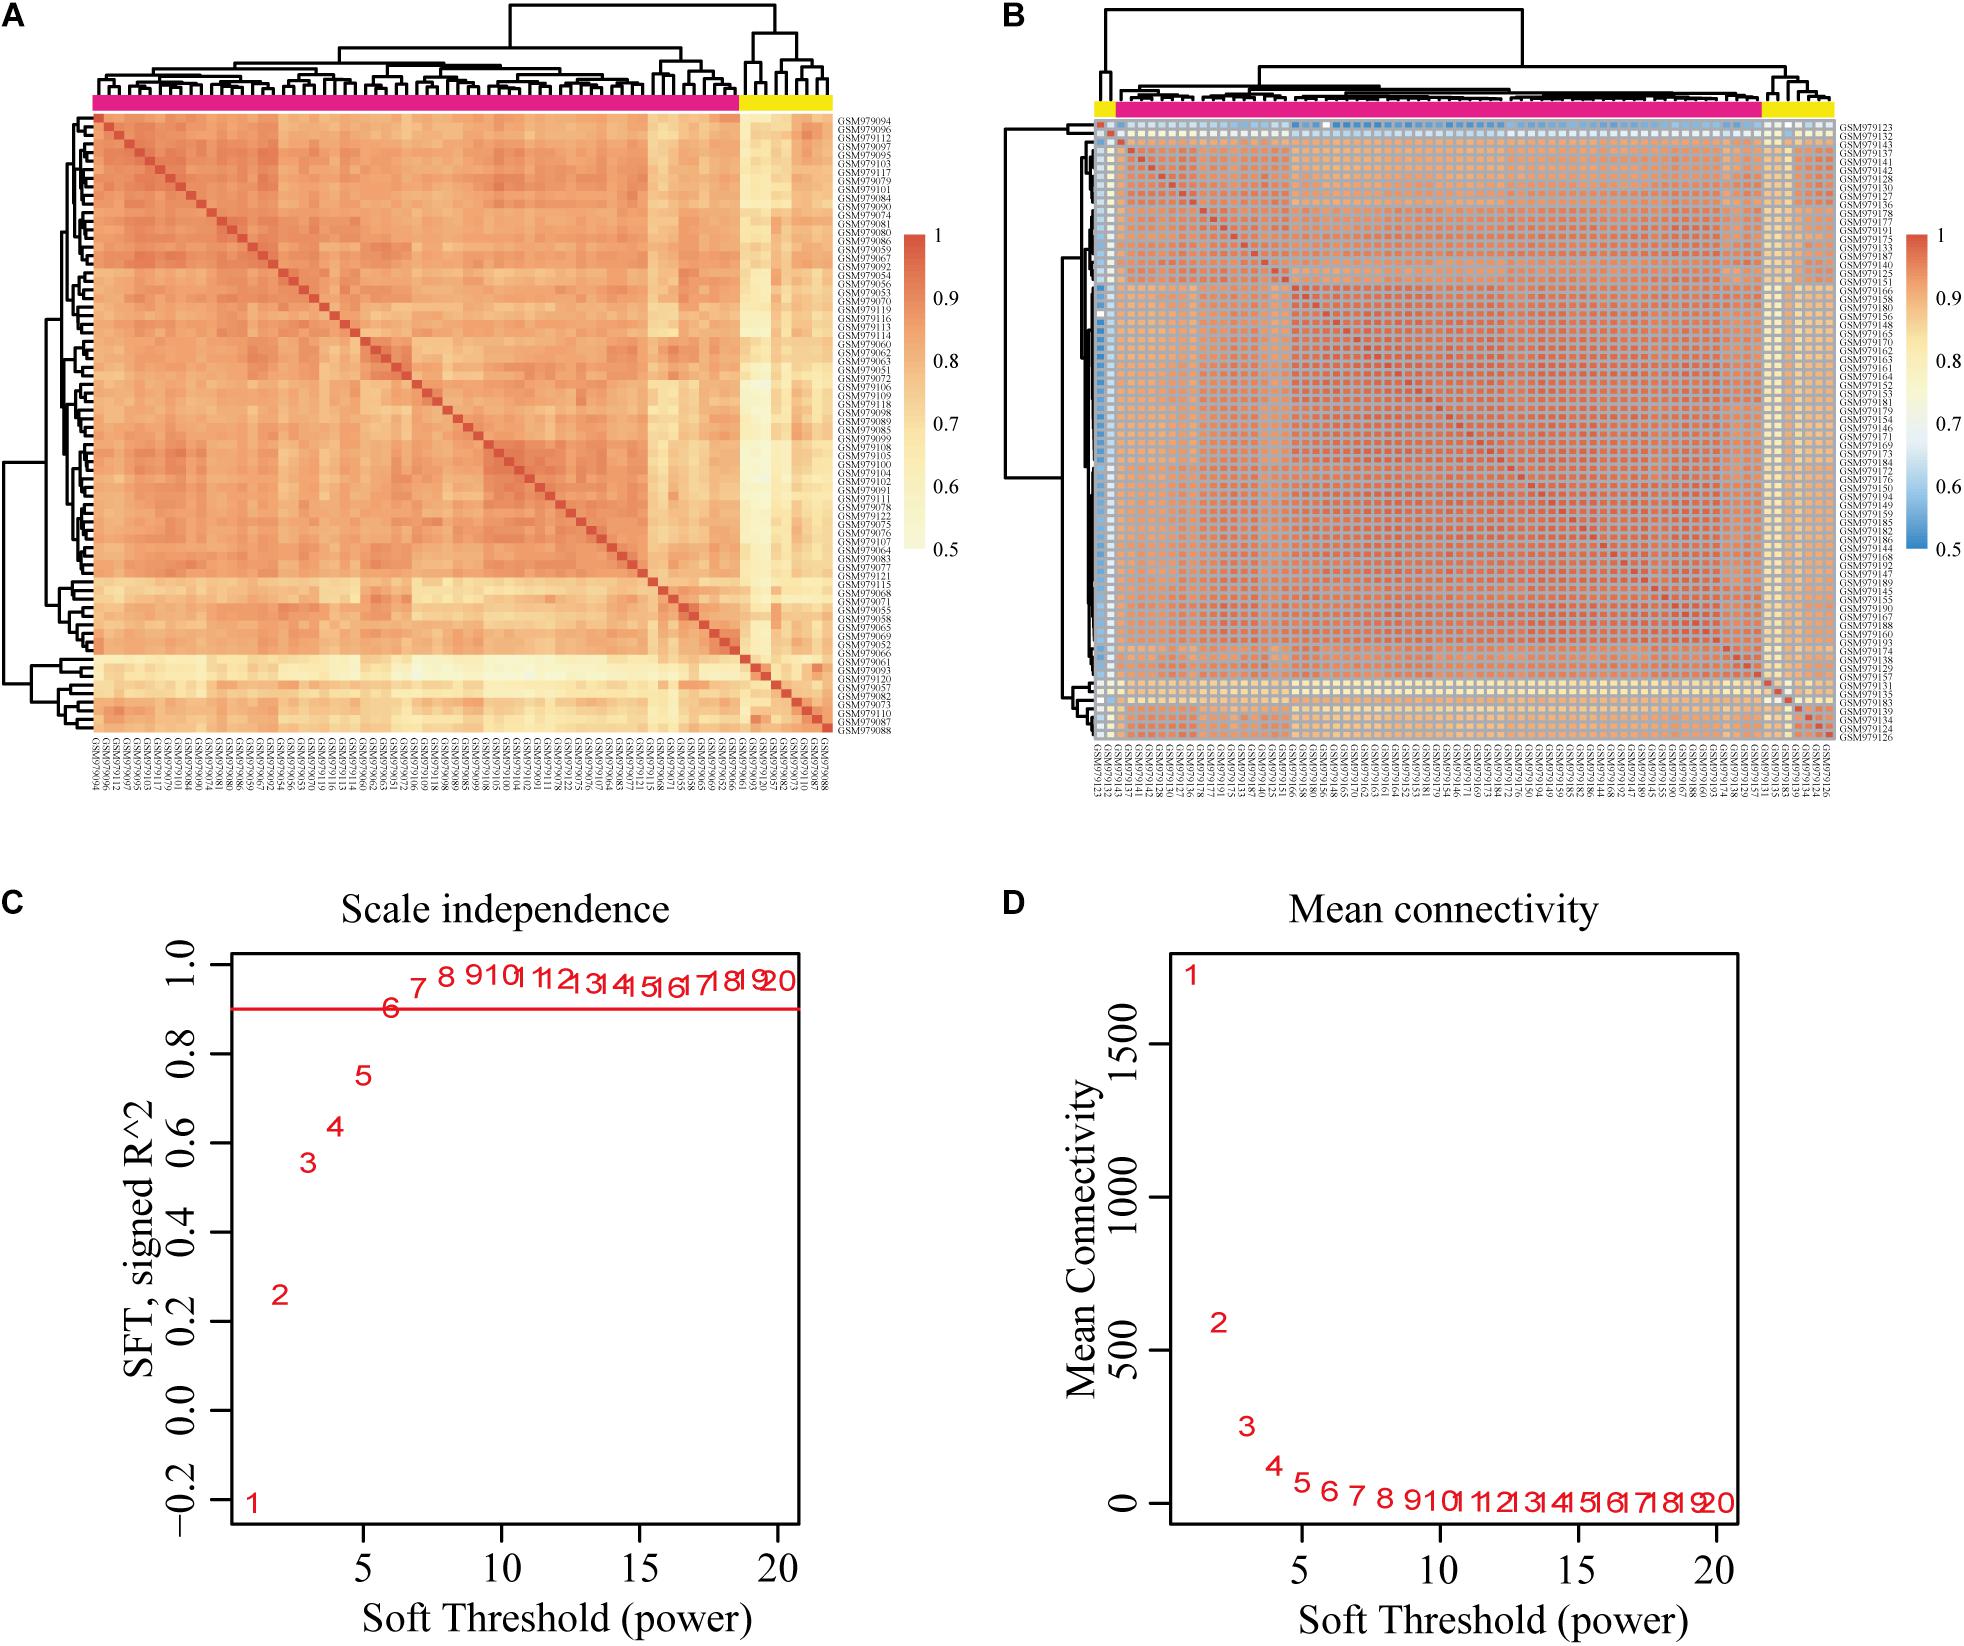
Figure 2. Correlation analysis of each sample and construction of the weighted gene co-expression network based on GEO database GSE39791. (A) Correlation between HCC samples. (B) Correlation between paracancerous samples. (C,D) Analysis of network topology for various soft-thresholding powers. Pearson’s correlation test was used to assess the correlation between samples. HCC, hepatocellular carcinoma; GEO, Gene Expression Omnibus.
We chose β = 6 to ensure that the co-expression network was scale free (Figures 2C,D). Then, a total of 17 modules were obtained (Figure 3A). The gene statistics in each module are shown in Supplementary Table 3. Overall, 7814 genes were allocated into 17 modules (Supplementary Table 4), and the gray module included all the genes that could not be clustered. The Pearson correlation coefficients between each module eigengene (ME) and sample trait were calculated (Figure 3B). We can conclude that these three modules (green, blue and purple) are the most relevant to HCC samples. In addition, we used the R package clusterProfiler to conduct the KEGG enrichment analysis and GO enrichment analysis of 17 modules. The results showed that 11 modules were significantly enriched in 121 KEGG pathways (Supplementary Table 5 and Supplementary Figure 1). The green module was enriched in 6 KEGG pathways, including 2 cancer-related pathways (DNA replication and the cell cycle). Additionally, the blue module was enriched in ribosomes, RNA transport and necroptosis, which are closely related to tumorigenesis and progression. These results imply that both the green and blue modules are closely related to tumorigenesis and progression. The co-expression network contained a total of three gene modules, and their distribution is shown in Supplementary Figure 2 and Supplementary Tables 6, 7. As the gene node degree increased, the number of nodes decreased.
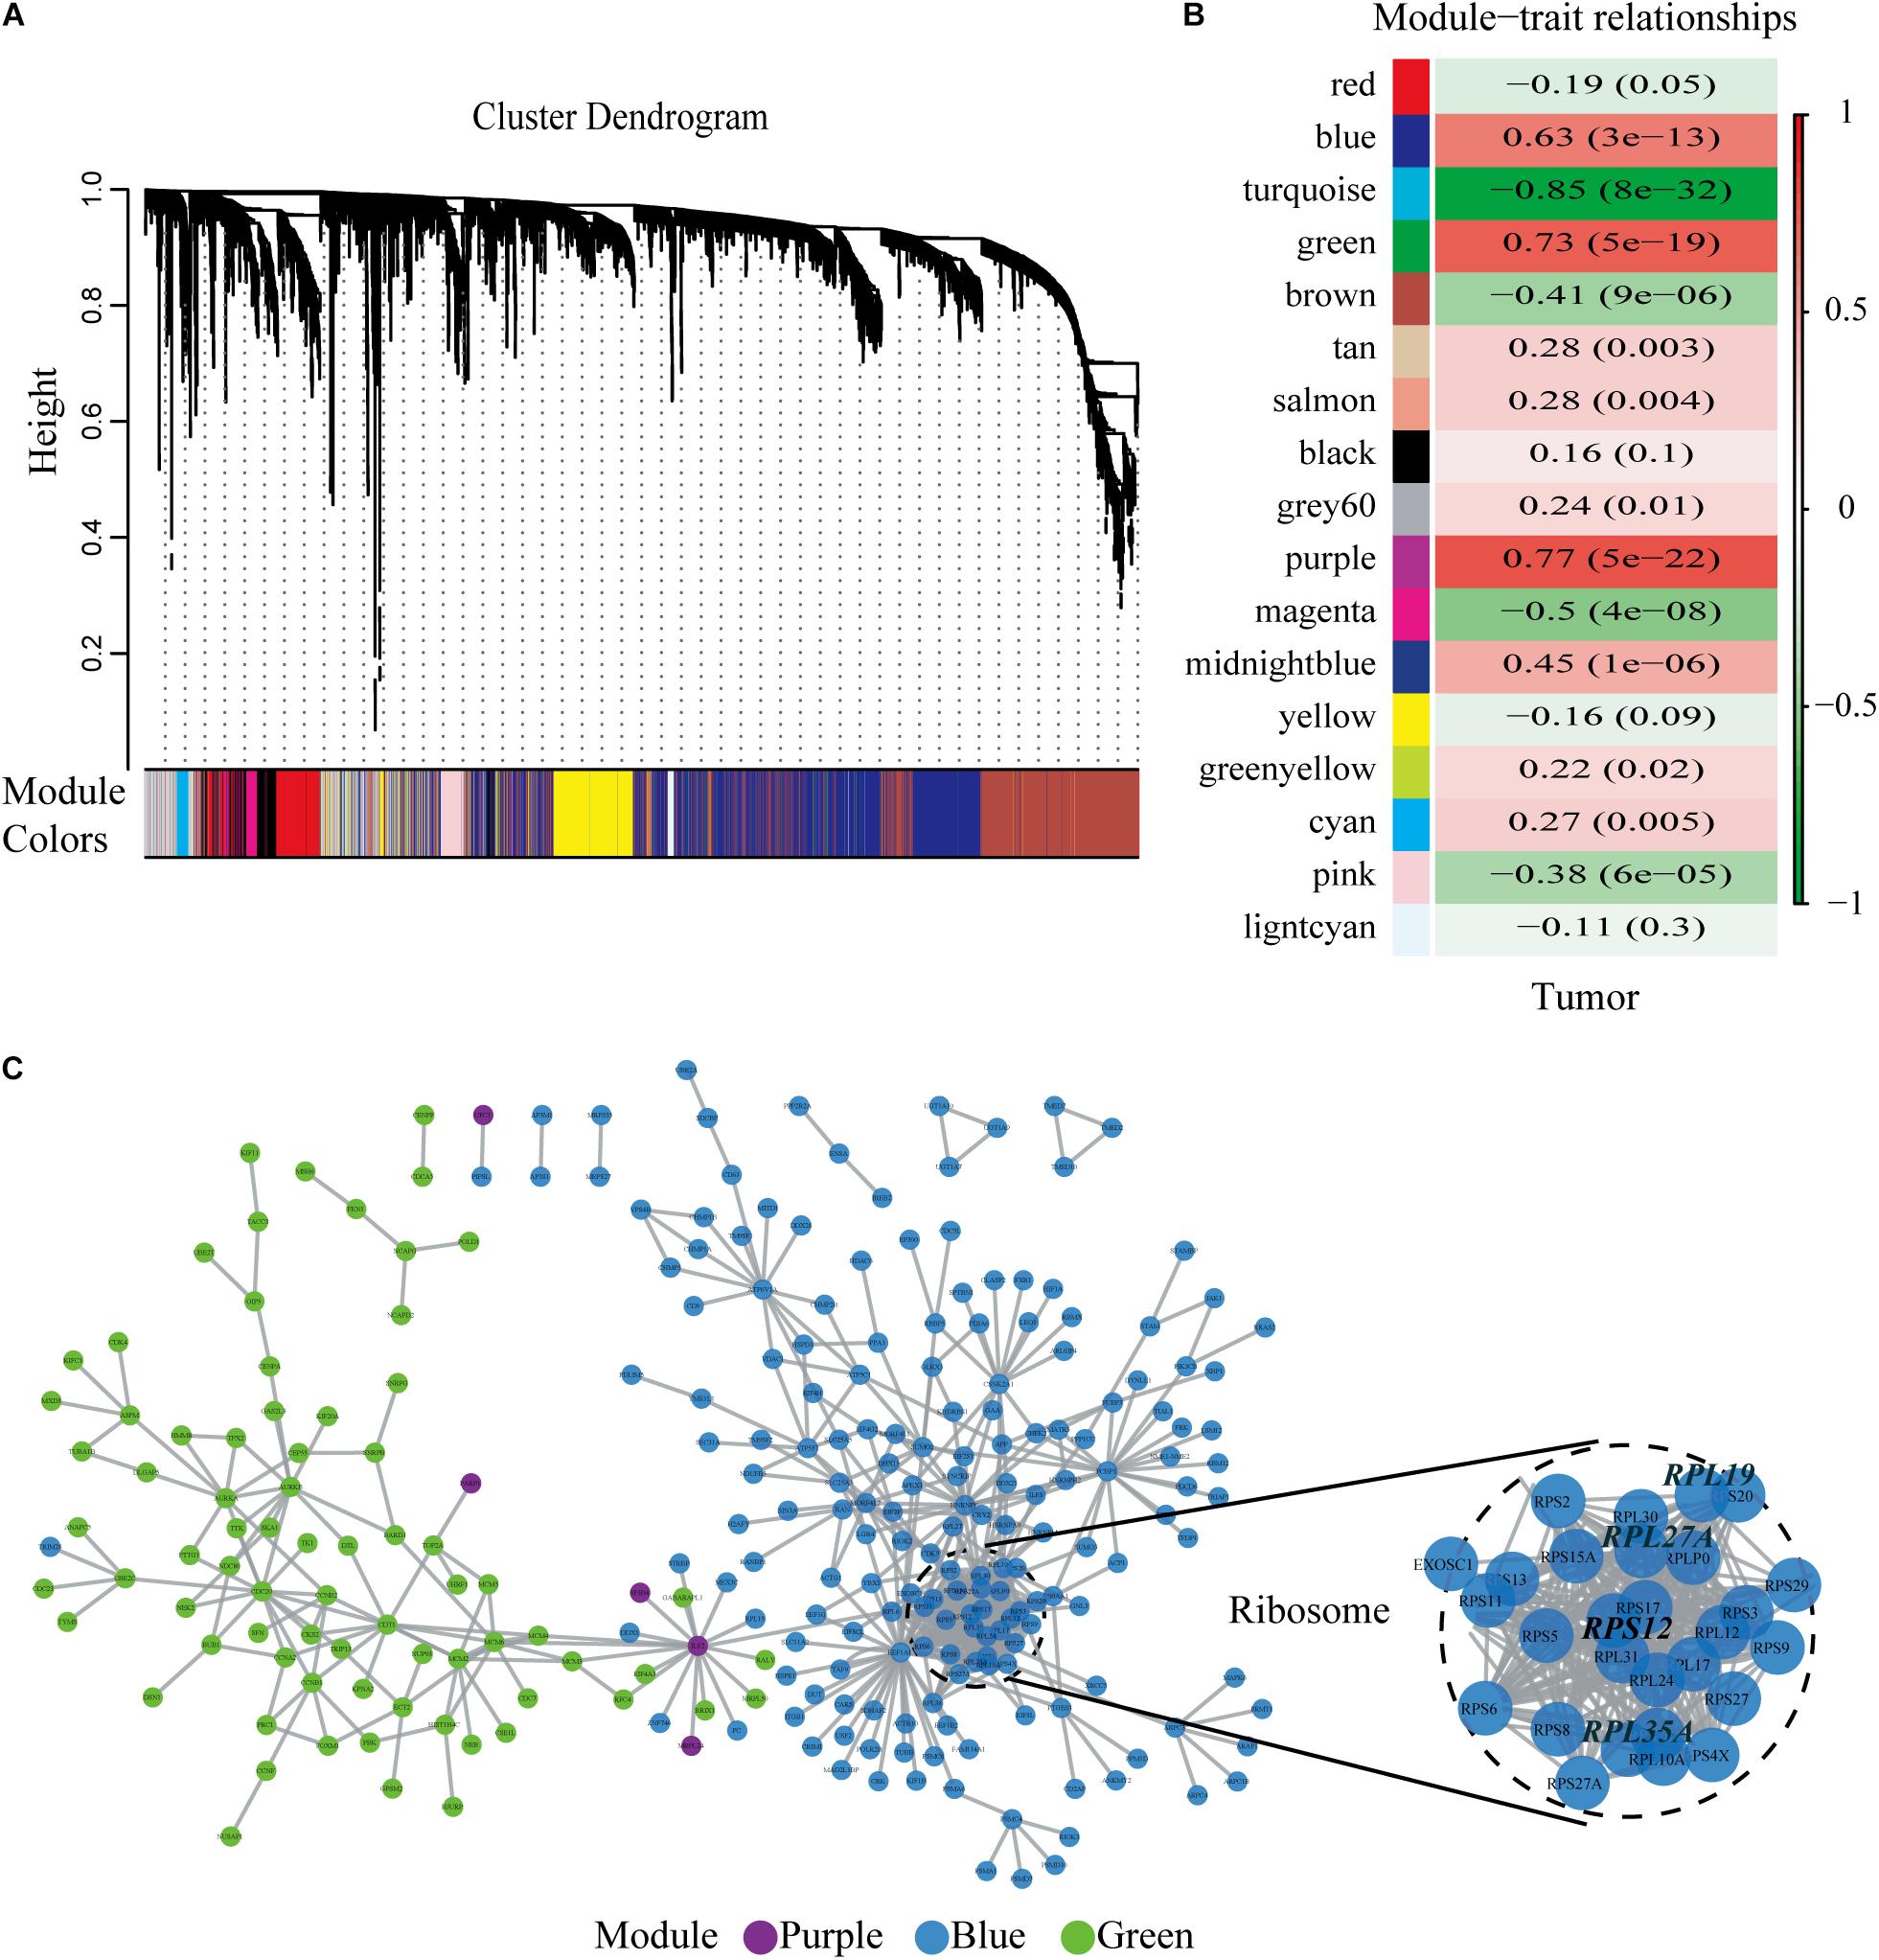
Figure 3. Selected hub modules and the human PPI network. (A) Gene dendrogram and module colors. (B) Relationship between modules and traits. The figure showed the correlation coefficients and the P-values. Red meant positive correlation, while green meant negative correlation. (C) Human PPI network was conducted based on the three hub modules. PPI, protein–protein interaction.
Identification of the Four Hub Genes by the Human Protein–Protein Interaction Network
The human PPI network contained 17,381 nodes with 19.6 neighboring nodes on average (Supplementary Table 8). Then, all the responsive genes were mapped to the human PPI network. In total, 1148 genes were covered in the PPI network. Among them, 265 interacted with and co-expressed 2.33 neighboring nodes on average (Figure 3C and Supplementary Table 9). Through topological property and biological enrichment analyses, it was finally determined that the screening threshold was at least 10% of co-expressed genes in the neighboring nodes, and genes whose FDR-corrected p-value was less than 0.05 were defined as significantly differentially expressed in the co-expression-interaction gene enrichment analysis. The results are shown in Table 2. As shown in the table, four genes, RPL19, RPS12, RPL27A, and RPL35A, were obtained. These four genes are related to ribosomes. According to the literature, RPS12 is a tumor marker for liver cancer (Wang et al., 2009).
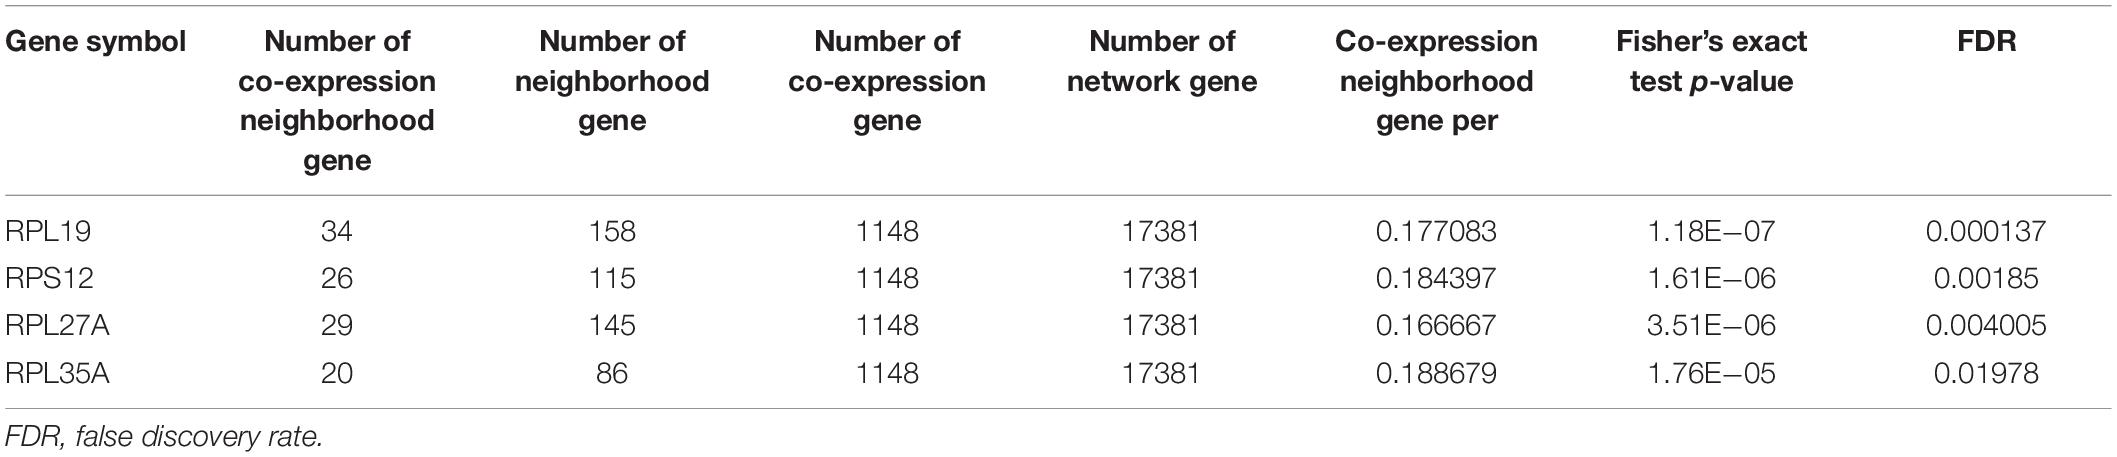
Table 2. Screened cancer-specific genes.
Expression, Clinicopathological, and Prognostic Analyses of the Four Hub Genes in the GEO and TCGA Databases
Through the analysis and comparison of 11 HCC datasets in the GEO database, we found that the expression levels of RPL19 were significantly higher in HCC tissues than in paracancerous tissues in 10 datasets (P < 0.05). Moreover, RPL27A was markedly increased in eight datasets, and RPL35A and RPS12 were markedly increased in eight datasets (Figures 4A–D). In addition, we compared 369 liver cancer samples and 50 paracancerous samples in the TCGA database. The results showed that the expression levels of the four hub genes were significantly higher in HCC tissues than in paracancerous tissues (P < 0.0001). The expression levels of the four hub genes in different stages of liver disease are shown in Supplementary Figure 3. In addition, the relationship between different expression levels of RPL19, RPL27A, RPL35A, and RPS12 and the clinical prognosis of patients was compared through survival analysis. The OS and relapse-free survival (RFS) of HCC patients with high expression of the four hub genes were significantly shorter than those with low expression (Figures 4E–H). Among the HCC patients with TNM stage I∼II disease, OS and RFS were significantly shorter in those with high expression of the four hub genes than in those with low expression (P < 0.0001), and the same results were obtained from HCC patients with TNM stage III∼IV disease (P < 0.0001) (Supplementary Figure 4). Then, we investigated the expression levels of the four hub genes in different AJCC stages of HCC. The expression levels of the four hub genes were significantly higher in stages I, II, and III than in stage 0 (P < 0.01) (Figures 4I–L). The expression changes in these four genes in stages I, II, and III were not significantly different (P > 0.05), indicating that these four genes can be used as important molecular biomarkers for the early diagnosis of HCC. These four genes can also be used as prognostic biomarkers according to the results of the subsistence analysis.
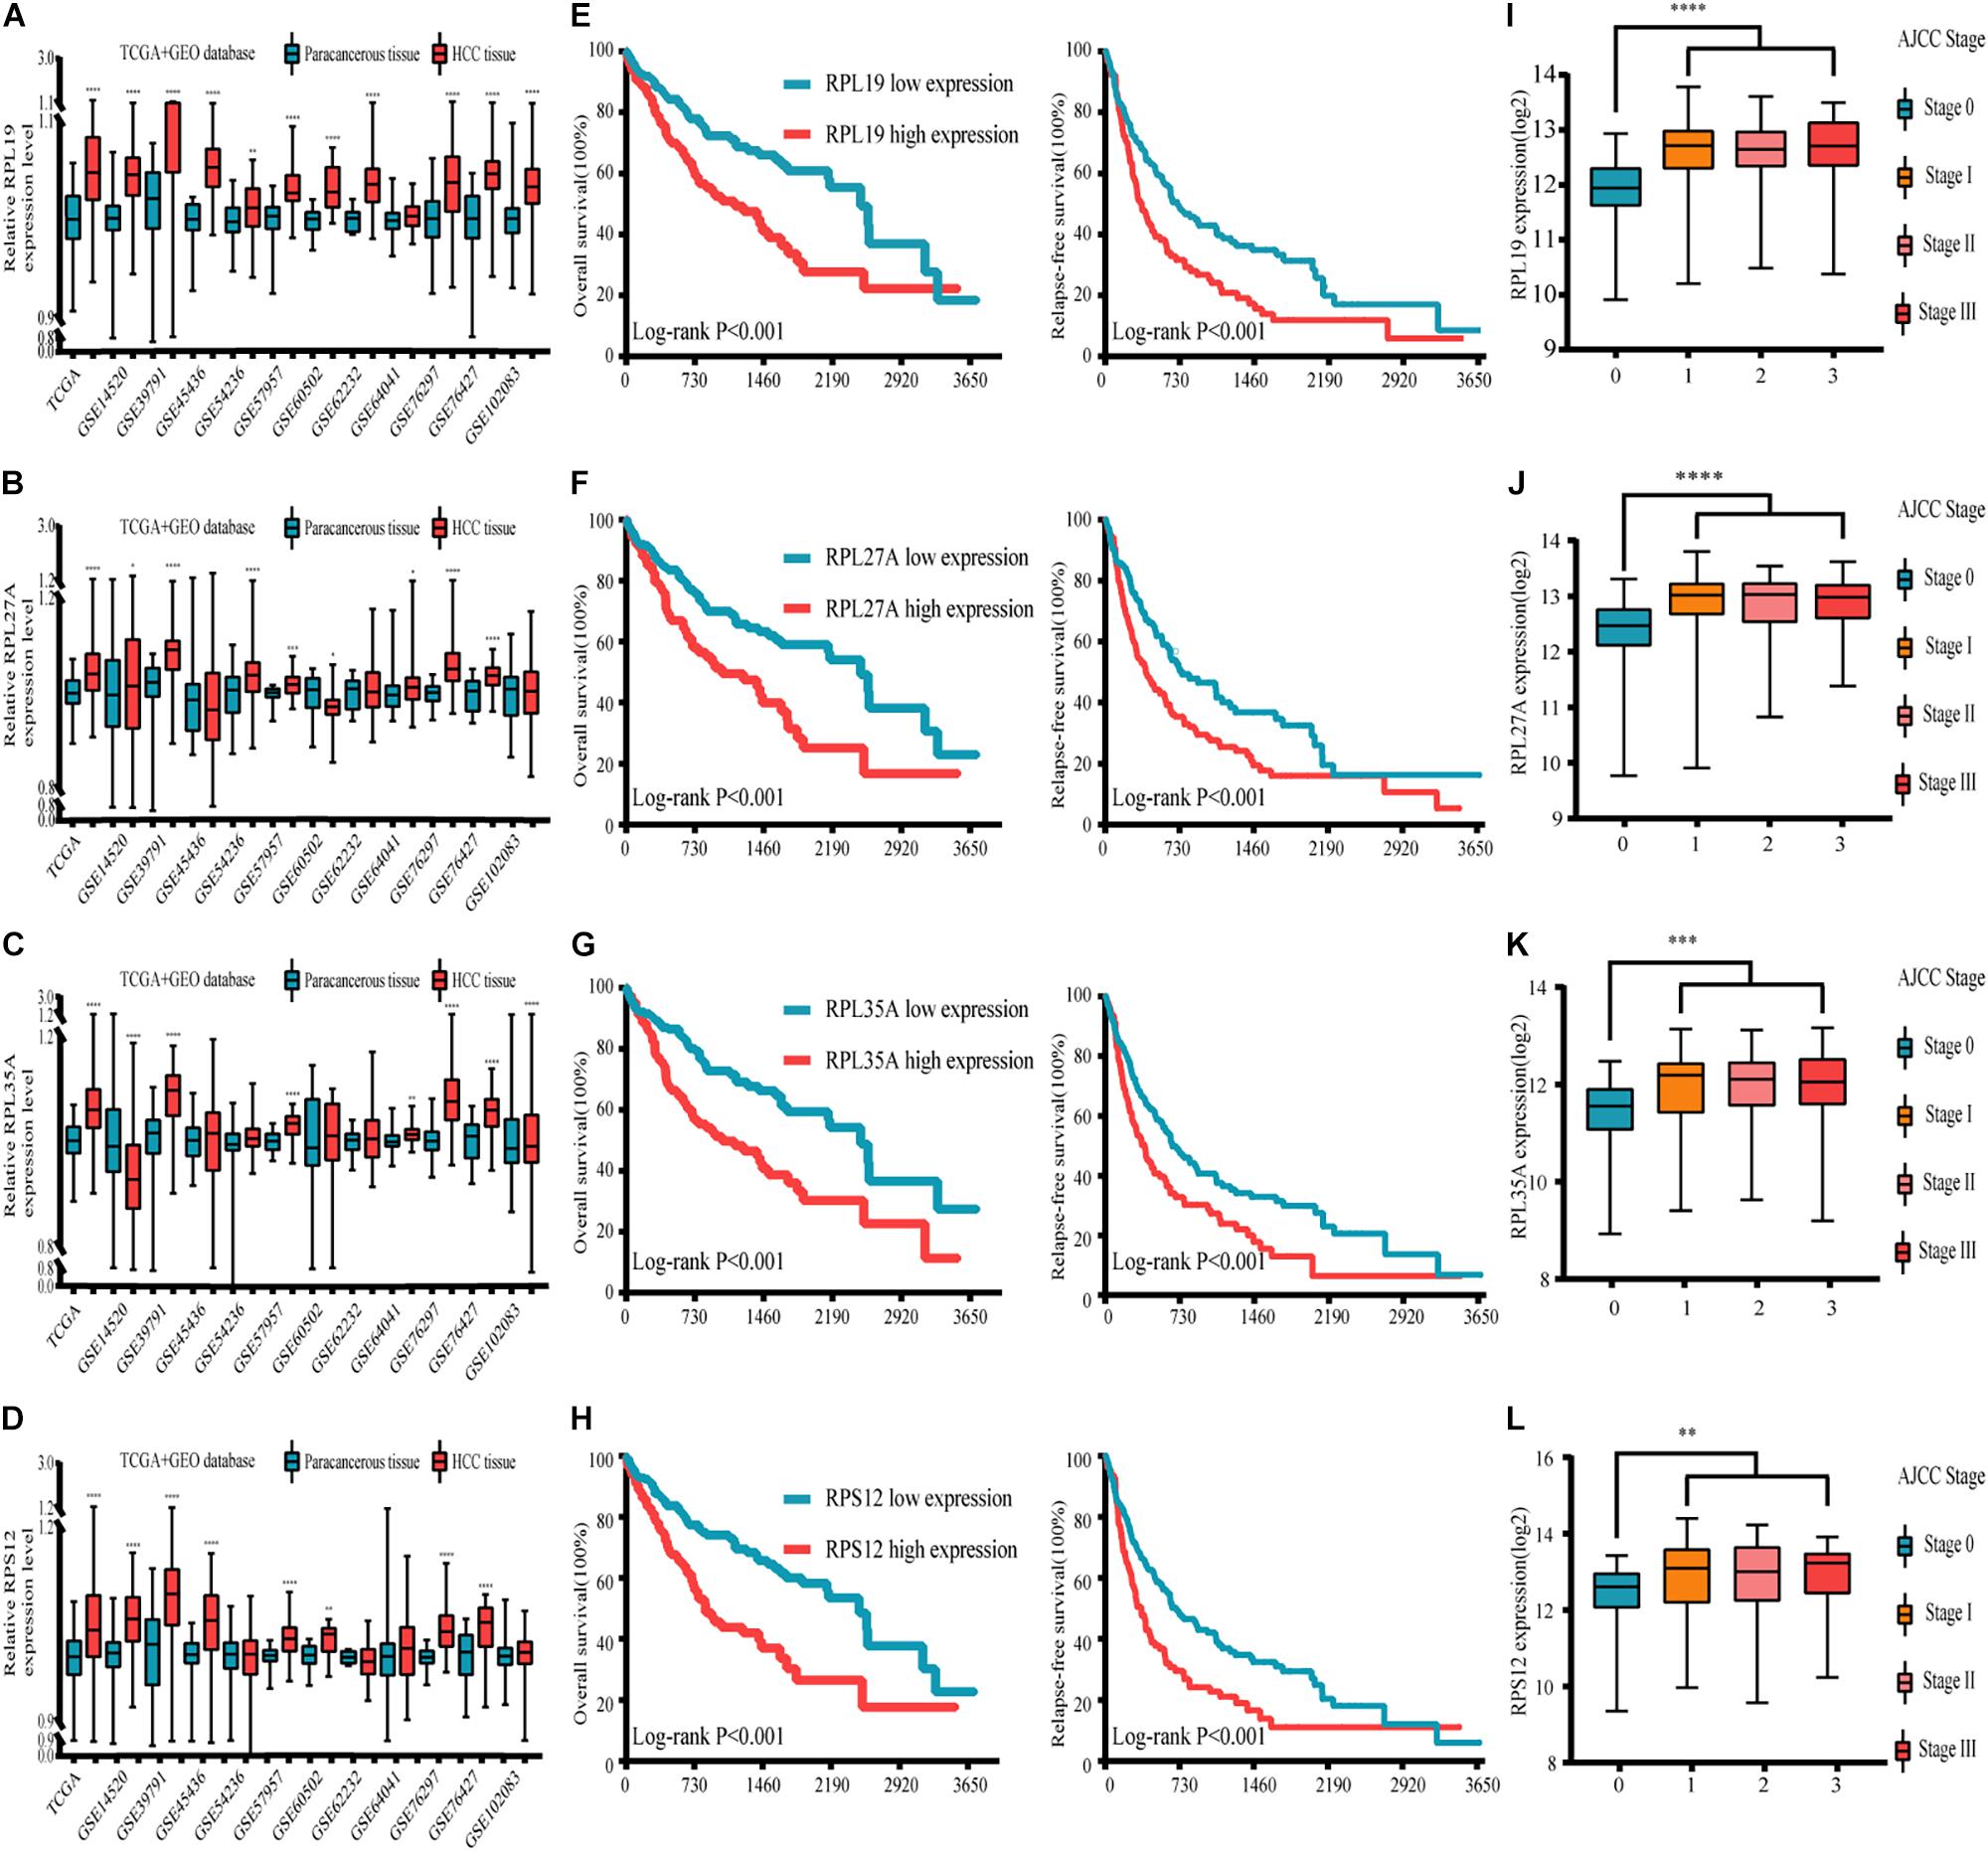
Figure 4. Expression, clinicopathological and prognostic analyses of the four hub genes in the GEO and TCGA databases. (A–D) Expression of the four hub genes in the GEO and TCGA databases. (E–H) Relationship between the expression levels of the four hub genes and the OS and RFS of HCC patients. (I–L) Expression levels of the four hub genes in different AJCC stages of HCC. TCGA database and 11 GEO datasets (including GSE14520, GSE39791, GSE45436, GSE54236, GSE57957, GSE60502, GSE62232, GSE64041, GSE76297, GSE76427, and GSE102083) were used for analysis in this section. Differences between two groups were analyzed by Student’s t-test. The OS and RFS of HCC patients were calculated with Kaplan–Meier curves. GEO, Gene Expression Omnibus; TCGA, The Cancer Genome Atlas; OS, overall survival; RFS, relapse-free survival; HCC, hepatocellular carcinoma; GSEA, gene set enrichment analysis. *P < 0.05, **P < 0.01, ***P < 0.001, ****P < 0.0001.
From the above results, at the expression level of the four genes, we found that RPL19 has the most significant difference in the gene expression level between HCC and paracancerous tissues. Compared with the other three genes, the expression level of RPL19 was significantly different in the most GEO data sets. Moreover, the difference in the expression level of RPL19 between HCC and paracancerous tissues has the largest fold change value in the TCGA database. Therefore, judging from the expression levels of the four genes, we thought it was more meaningful to choose RPL19 for further research. Furthermore, at the protein level of the four molecules, we searched the Human Protein Atlas database and found that RPL19 was highly expressed in HCC tissues based on the staining intensity. However, the other three molecules were moderately expressed, lowly expressed or not expressed in HCC tissues. Therefore, judging from the protein level of the four molecules, we thought it was more meaningful to choose RPL19 for further research. At last, we focused on the functions of the four genes. We found that RPL19 served as a biomarker and was involved in the progression of multiple tumors except HCC. In summary, we comprehensively considered the expression level, protein level, and gene function of the four genes. Finally, we chose RPL19 for further research in HCC.
RPL19 Is Closely Related to the Tumor Progress and the Poor Prognosis of HCC
The above results indicated that the four hub genes (RPL19, RPL27A, RPL35A, and RPS12) are closely related to the clinical prognosis of HCC. Through preliminary experiments and a literature search, we ultimately chose RPL19 for further research. According to the IHC staining intensity, the expression of the RPL19 protein in tumor tissues was significantly higher than that in paracancerous tissues (P = 0.016) (Figures 5A–C). The different levels of staining intensity are shown in Figure 5B. Furthermore, RPL19 expression was significantly positively related to alpha fetoprotein (AFP) and potentially positively related to the TNM stage in patients (Table 3). Moreover, the expression level of the RPL19 protein increased significantly with progression from TNM stage I to III (P = 0.046) (Figure 5D). Kaplan-Meier analysis also showed that the OS of HCC patients with low RPL19 expression was significantly longer than that of patients with high RPL19 expression (P = 0.0007) (Figure 5E). Finally, univariate and multivariate analyses demonstrated that, in addition to AFP and TNM stage, RPL19 might also be an independent prognostic factor for HCC patients (Table 4). The above results once again suggest that the expression level of RPL19 is upregulated in HCC tissues and closely related to the clinical prognosis of patients with liver cancer.
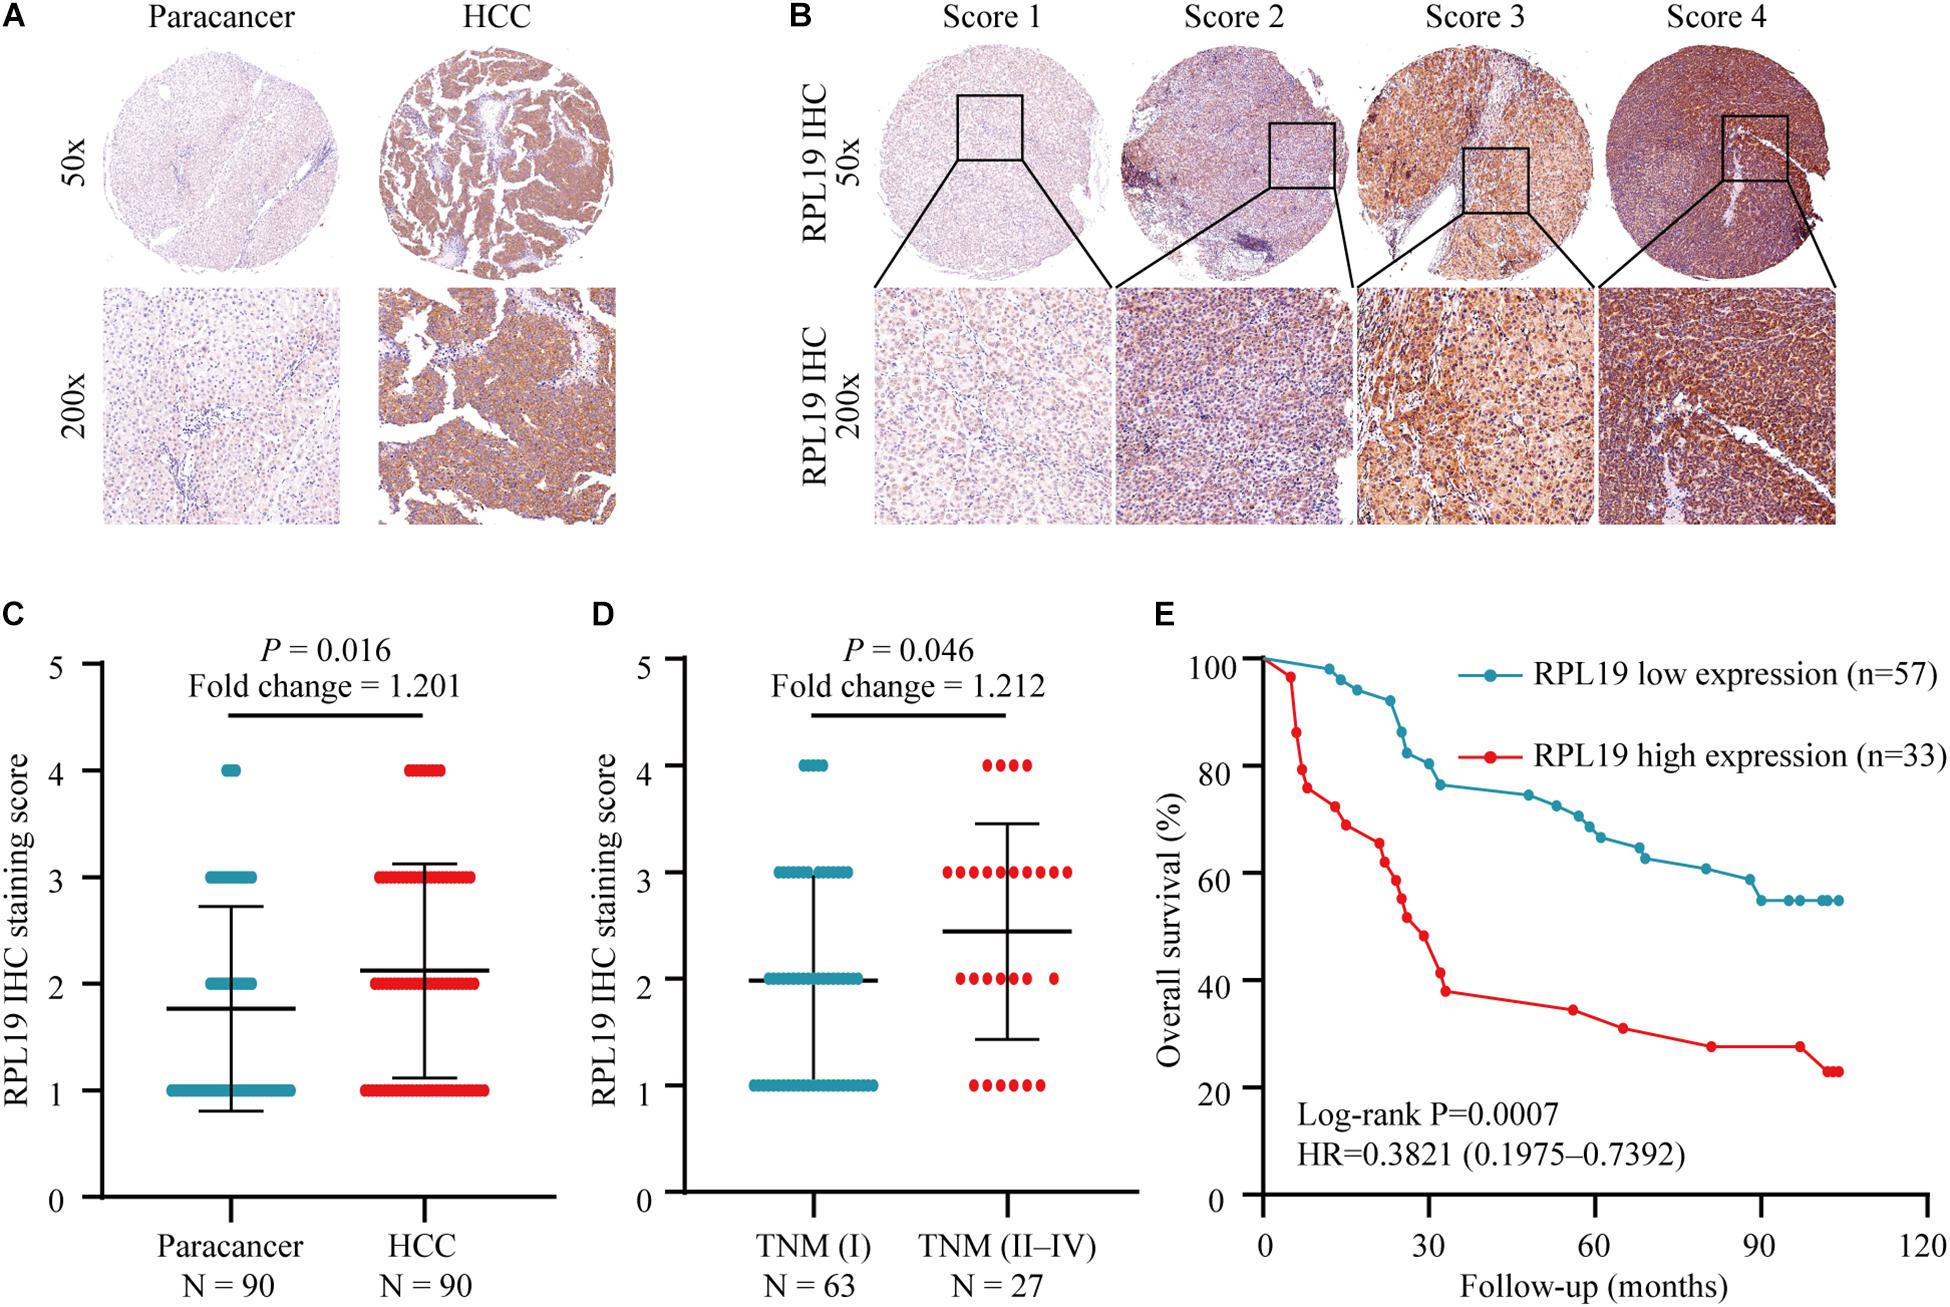
Figure 5. Relationship between the expression of RPL19 in hepatocellular carcinoma and clinical prognosis. (A) RPL19 expression was higher in HCC patient tumor tissues than in paired paracancerous tissues. (B) IHC analysis of RPL19 expression in the TMA. (C) Expression of the RPL19 protein in the TMA in HCC and paracancerous tissues. (D) Expression of the RPL19 protein in the TMA in different TNM stages. (E) Relationship between the expression of the RPL19 protein and patient OS in the TMA. Differences between two groups were analyzed by Student’s t-test. The OS of HCC patients were calculated with Kaplan–Meier curves. TMA, tissue microarray; IHC, immunohistochemistry; HCC, hepatocellular carcinoma; OS, overall survival.
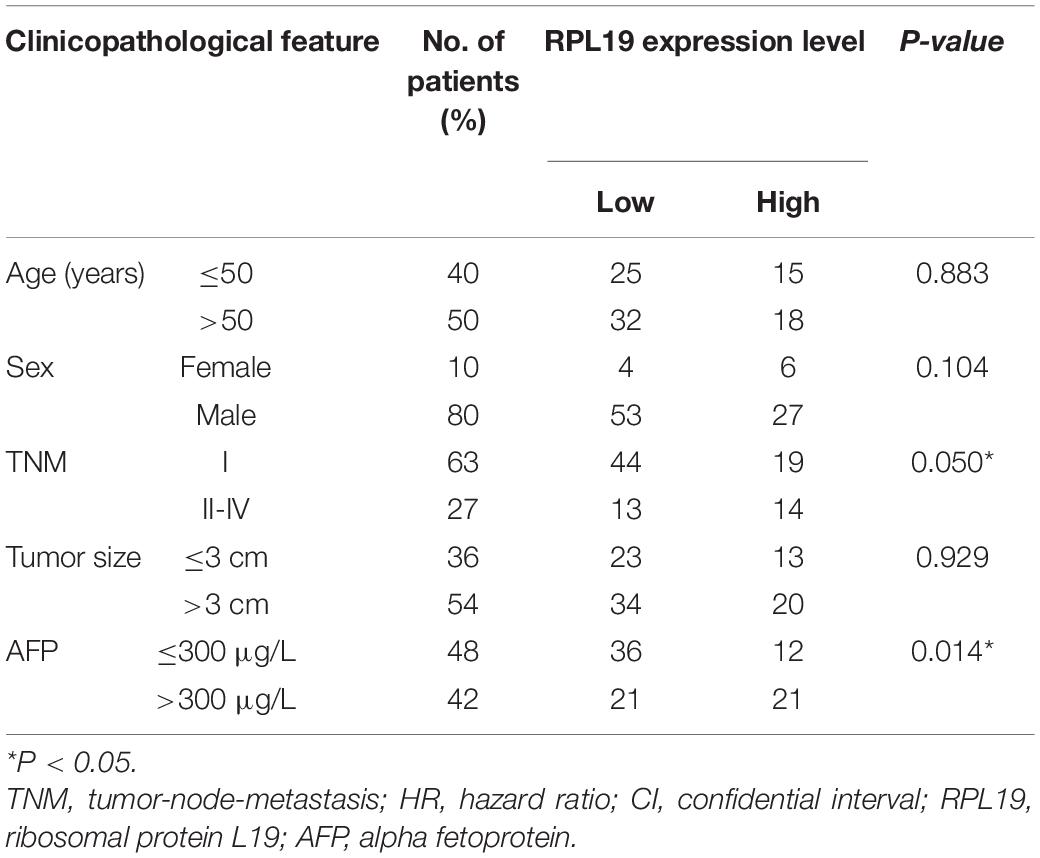
Table 3. Relationship between RPL19 expression and the clinicopathological features of hepatocellular carcinoma patients.
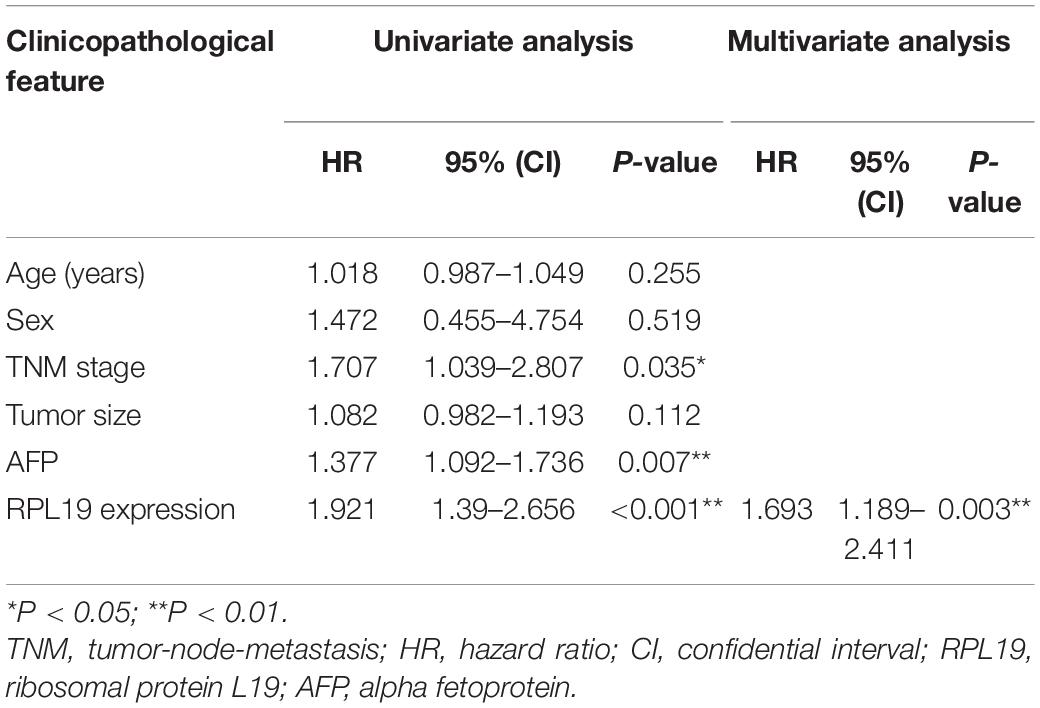
Table 4. Univariate and multivariate analyses of the overall survival of hepatocellular carcinoma patients.
Functional Annotation and Immune Infiltration Analysis of RPL19
To further elucidate the mechanism by which RPL19 promotes the progression of HCC, we annotated the biological processes of RPL19 and conducted pathway analysis through Metascape. Metascape enrichment analysis revealed that “ribosome biogenesis,” “maturation of rRNA,” “TNF-alpha/NF-kappa B signaling pathway,” “negative regulation of ubiquitin ligase activity,” and “rRNA modification in the nucleus and cytosol” were enriched in biological processes and pathways that might be highly correlated with the malignant progression of HCC. Figure 6A showed the top 16 significantly enriched biological processes. Hallmark pathway analysis further revealed that “bile acid metabolism” and “fatty acid metabolism” were suppressed and that the “G2M checkpoint” was activated (Figure 6B). Then, gene set enrichment analysis (GSEA) was conducted to determine the hallmark pathways. The results indicated that cell cycle pathways were significantly enriched, and bile acid metabolism-related pathways were significantly downregulated when RPL19 was highly expressed (Figures 6C,D). In addition, GSEA was performed to investigate the enriched KEGG pathways. We found that “DNA replication” and “cell cycle” were significantly enriched and “bile secretion” was significantly downregulated (Figures 6E–G). Moreover, GSEA was performed to investigate the enriched GO pathways. The results showed that the mitotic cell cycle checkpoint pathway was enriched and that the bile acid transport and metabolic process pathway was downregulated (Figures 6H–J). The results showed similar pathways among the three enrichment analyses and indicate that RPL19 is associated with the tumorigenesis and progression of HCC. The immune infiltration analysis showed that activated dendritic cells (aDC), eosinophils, macrophages, natural killer cells (NK cells), mast cells, cytotoxic cells, B cells, regulatory cells (Tregs), Th17 cells, central memory T cell (Tcm), dendritic cells (DC), and neutrophils were negatively correlated with the expression of RPL19. While NK CD56bright cells were positively correlated with the expression of RPL19 (Figures 7A–F). To further assess the clinical impact of RPL19, the effect of immune infiltration on survival was analyzed (Supplementary Figures 5, 6). Most immune cells were protective factors except T helper cells and Th2 cells (Figure 7G). And the immune infiltration was significantly suppressed in HCC with high expression of RPL19.
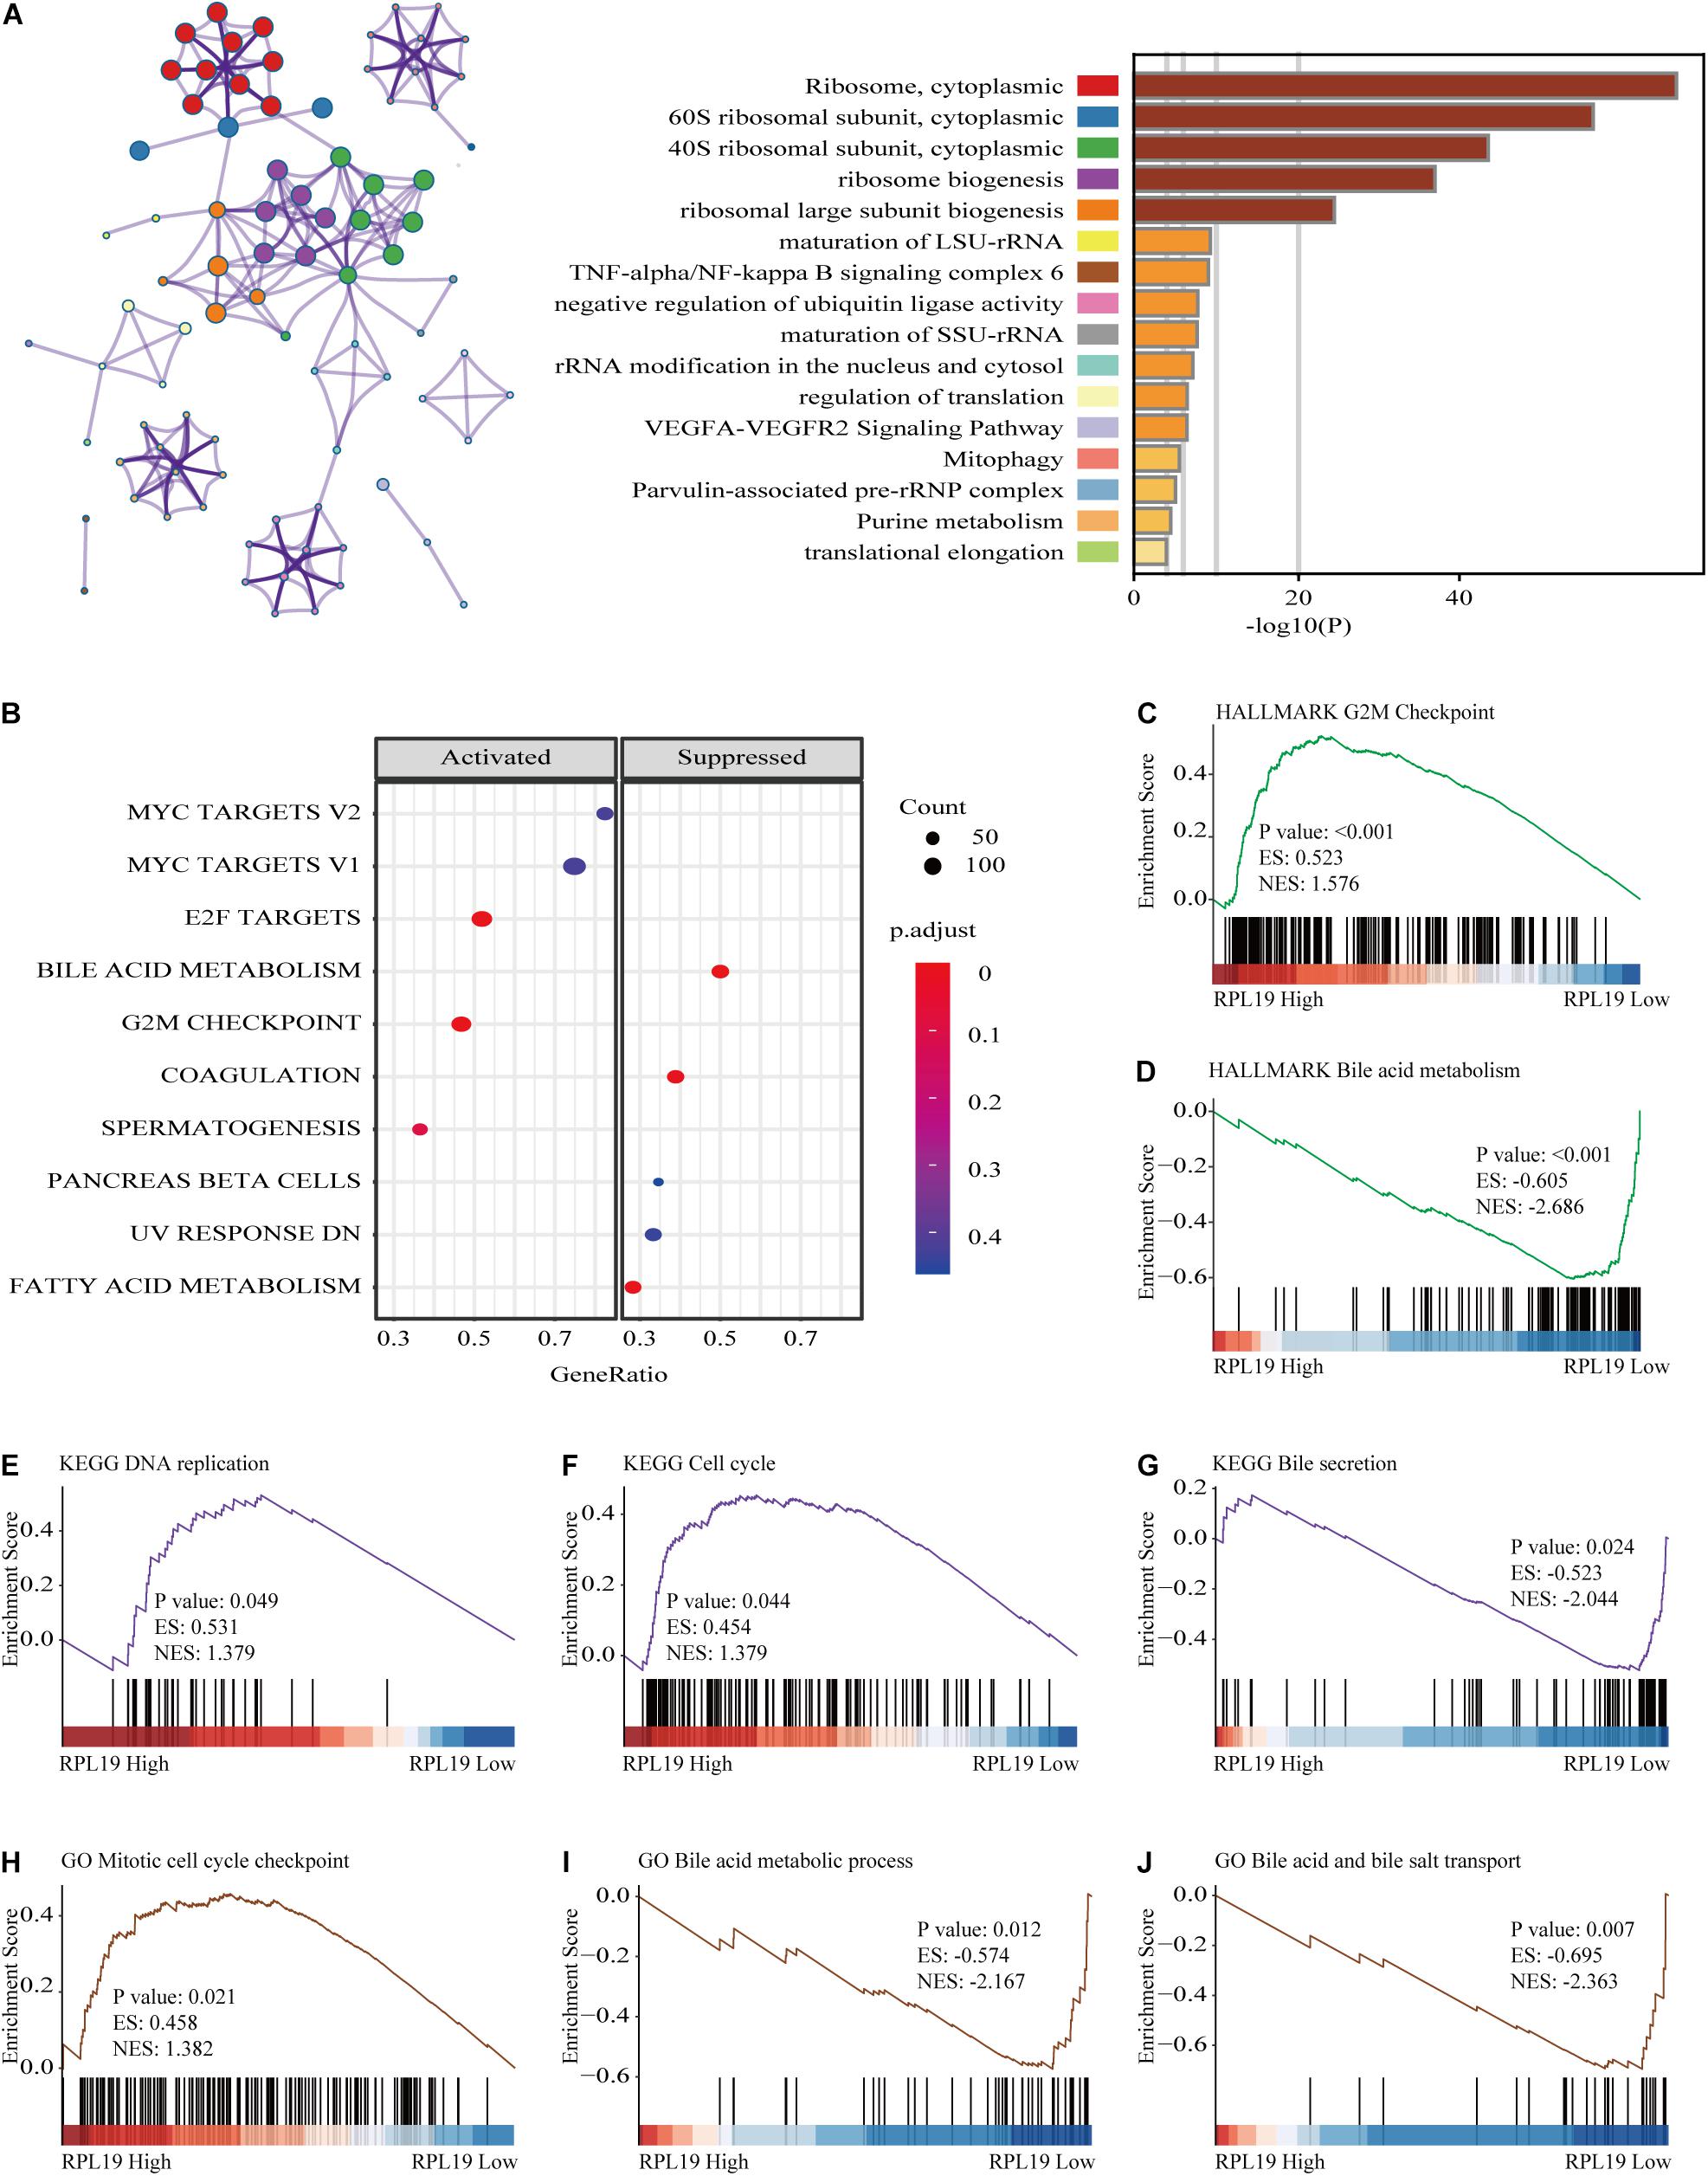
Figure 6. Functional annotation of RPL19. (A) Network and bar chart of 16 significantly enriched biological processes in HCC patients with high RPL19 expression. Each enriched node is presented in a different color. (B) The suppressed and activated hallmark pathways. (C,D) GSEA was conducted to determine the hallmark pathways. (E–G) GSEA was conducted to determine the KEGG pathways. (H–J) GSEA was conducted to determine the GO pathways. In this section, KEGG, HALLMARK, and GO database were used for analysis. GSEA, gene set enrichment analysis. KEGG, Kyoto Encyclopedia of Genes and Genomes; GO, Gene Ontology.
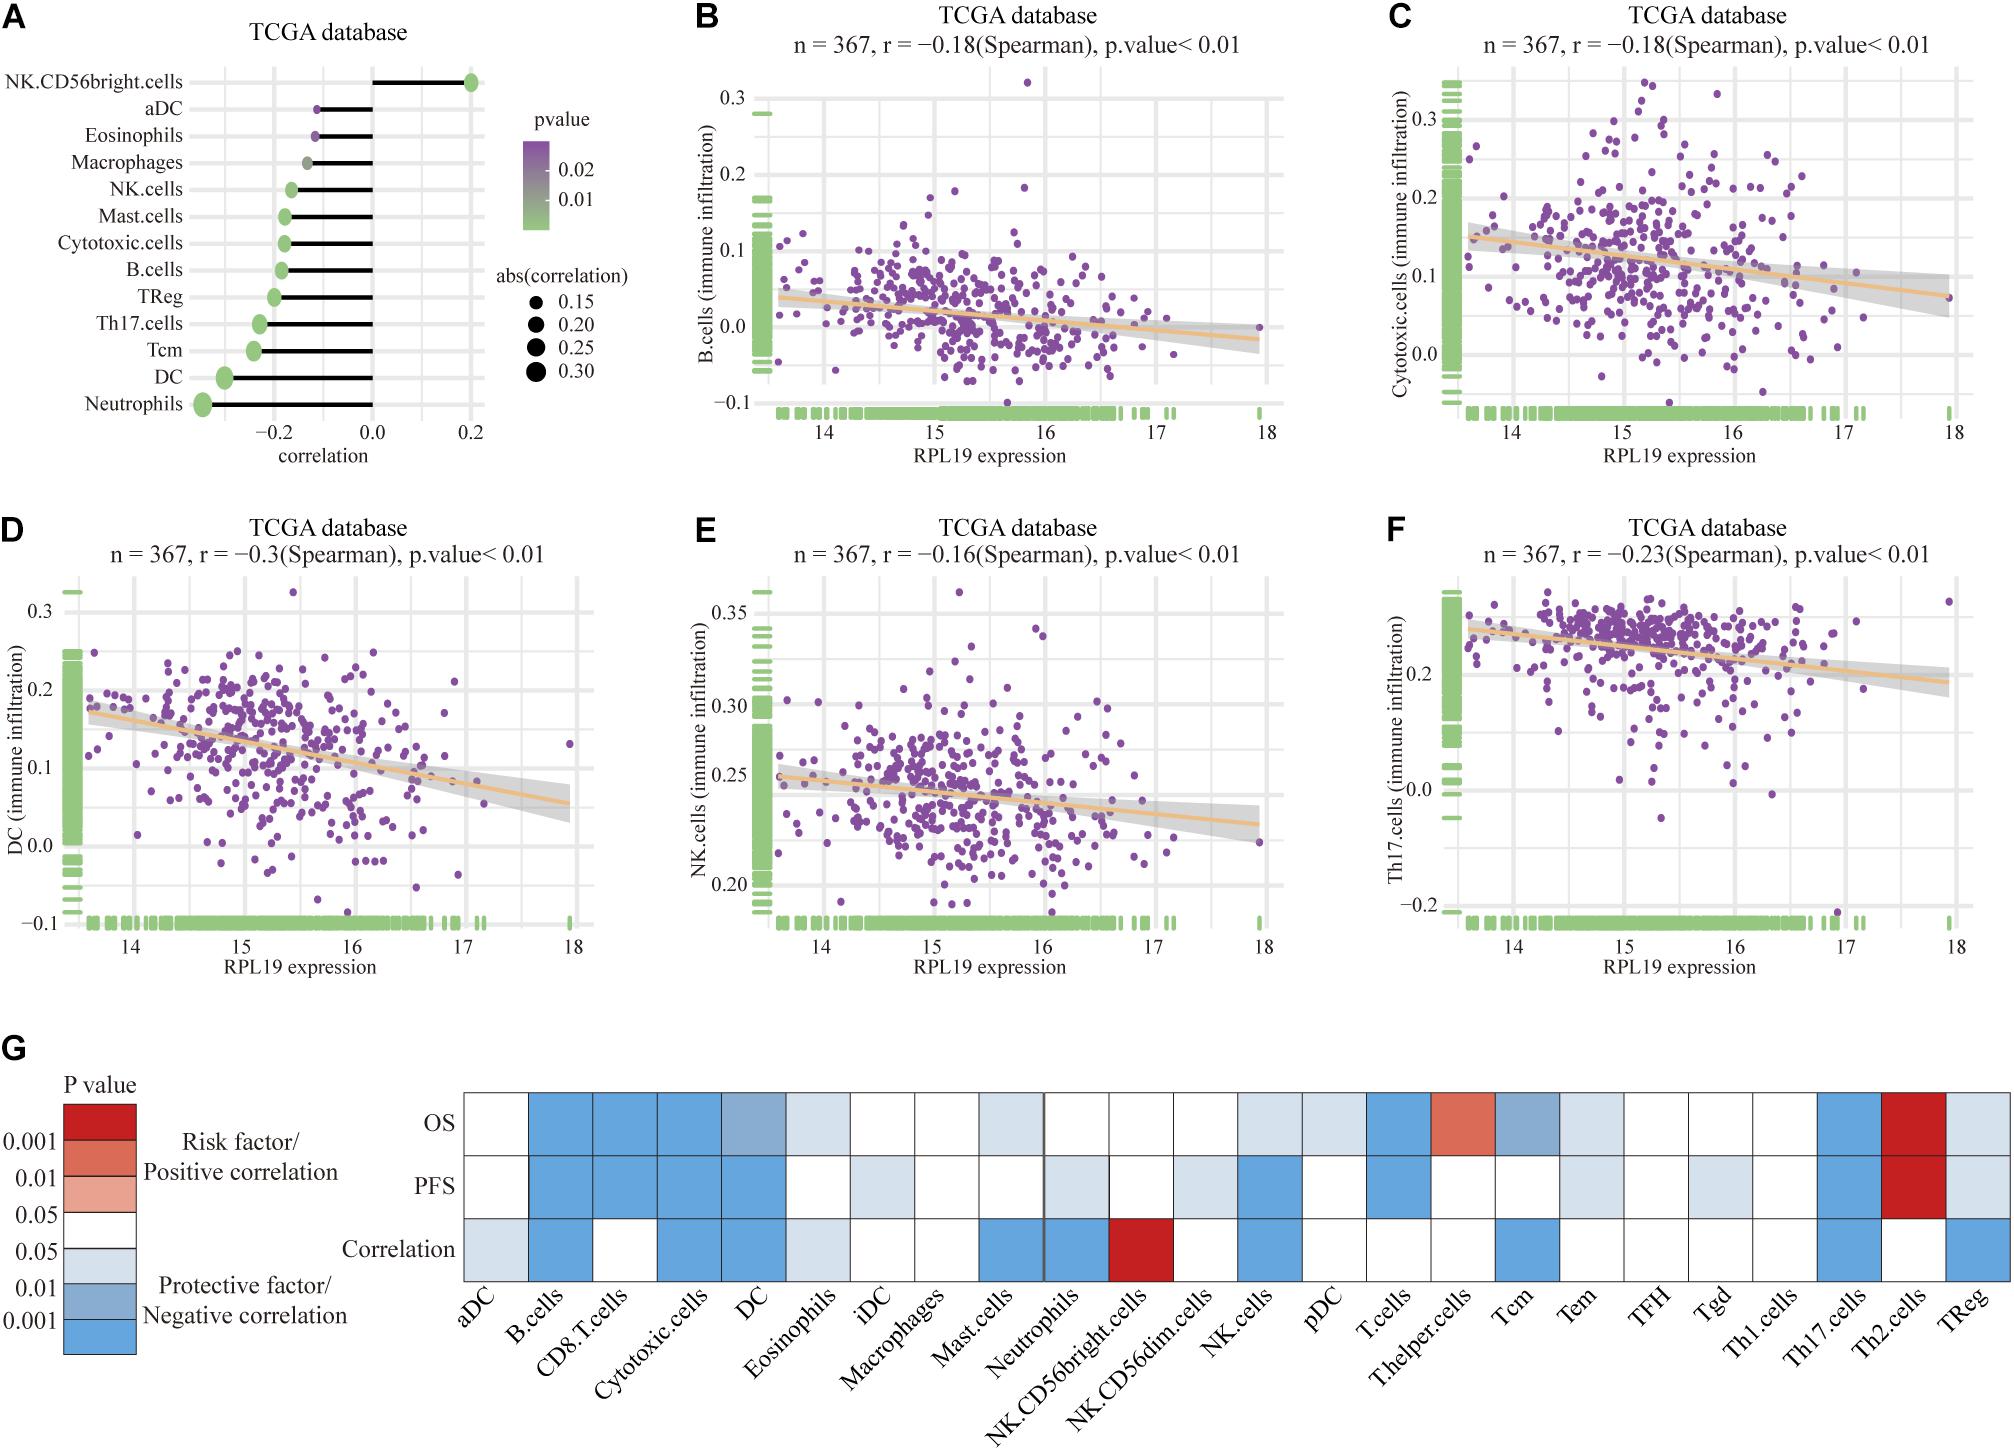
Figure 7. Immune infiltration analysis of RPL19. (A–F) Correlation between immune cells and the expression of RPL19, including B cells, Cytotoxic cells, DC, NK cells, and Th17 cells. (G) The heatmap of the correlation between OS, PFS and the expression of RPL19. In this section, TCGA database was used for analysis. Spearman’s correlation test was used to evaluate the correlation between the expression level of RPL19 and immune cells. DC, dendritic cells; NK cells, natural killer cells; OS, overall survival; PFS, progress free survival.
Discussion
Because of the role of genetic factors in the occurrence, development, progression and prognosis of HCC, we can study the functions of genes at the whole genome level through microarrays and high-throughput sequencing (Byron et al., 2016). As a systematic biological method used to describe how clinical features are related to genes, in this study, WGCNA was used to study gene co-expression in HCC and normal tissues. WGCNA divided genes into multiple modules by analyzing the relationship between genes. Then, correlation analysis between these modules and different phenotypes was used to determine the molecular characteristics of the specific phenotype. To date, WGCNA has been used to explore hub genes and tumor biomarkers of many cancers, such as bladder cancer (Jiang et al., 2020), prostate cancer (Wei et al., 2020), oral squamous cell carcinoma (Dai et al., 2020) and pancreatic cancer (Wang et al., 2020). In regard to HCC, many studies have been conducted to identify the hub genes correlated with its progression and prognosis. Gu et al. performed WGCNA based on the TCGA database and found two hub modules (turquoise module and blue module) and 13 hub genes (SNRPD2, PRR11, SKA3, etc.) that have a high correlation with progression and prognosis in HCC (Gu et al., 2020). They chose the GEO dataset GSE6764 to validate these genes. Moreover, they conducted real-time PCR to figure out the expression difference in HCC and paracancerous tissues. Li et al. (2020) performed WGCNA based on the GEO dataset GSE54238 and screened four hub genes (TDRKH, TARBP1, STK39, and SOX4) that were correlated with immune infiltration and found that these four genes had certain diagnostic value for HCC. The TCGA database was chosen to validate these genes. Previous studies have shown that 10 genes (CD8A, GMPS, STAT3, ERBB2, ACACA, ALB, EGFR, TGFB1, KRAS, and BCL2) are involved in multiple pathways, including cell adhesion, migration, locomotion, and differentiation, in the occurrence and progression of HCC (Zhang et al., 2017). Research on multiple different databases help us to understand the mechanism of the occurrence and development of HCC more comprehensively and guide clinical treatment.
In this study, we extracted co-expression networks of groups of genes from GSE39791 to conduct WGCNA and obtained 17 co-expression modules. Through further analysis, we found that three modules (green, blue, and purple) were most relevant to cancer samples. The green and blue modules were involved in multiple cancer-related KEGG pathways. We ultimately identified four genes, RPL19, RPS12, RPL35A, and RPL27A, and all four genes are related to ribosomes and are highly expressed in HCC tissues. The high expression of the four genes was related to the poor prognosis of patients. In addition, we identified the enrichment pathways based on the high expression of RPL19.
The four hub genes we discovered have been studied in multiple tumors. RPL19, which is a tumor-specific antigen of lung adenocarcinoma (Kuroda et al., 2010), can also be used as a prognostic biomarker for prostate cancer (Bee et al., 2006), colorectal cancer (Huang et al., 2008), and diffuse large B-cell lymphoma (Yan et al., 2019). One study (Bee et al., 2006) proposed that the expression of RPL19 in malignant prostate cancer cells was significantly higher than that in prostate cells. The degree of RPL19 staining in cancer tissues was significantly higher than that in normal prostate tissues and benign prostatic hyperplasia tissues, and the survival time of patients with high RPL19 expression was shortened, suggesting that RPL19 could be used as a biomarker for the diagnosis and prognosis of prostate cancer. Another study showed that the expression of cytokeratin 19 (CK19) and RPL19 in the stool of patients with advanced colorectal cancer was significantly increased. The simultaneous detection of two markers could better identify high-risk populations who are prone to metastasis (Huang et al., 2008). It was also found in lung cancer that the level of RPL19 mRNA expression in normal lung tissues was lower than that in lung cancer tissues (Kuroda et al., 2010), and the overexpression RPL19 was positively correlated with interferon IFN-γ. The synthesis of cyclin D1 and D3 decreased after RPL19 expression was inhibited. Therefore, the decrease in the proliferation of lung cancer cell lines caused by RPL19 knockdown may occur through inhibition of the cell cycle (Kuroda et al., 2010). We conducted further studies on RPL19 and obtained consistent results with the bioinformatics analysis on the TMA. RPL27A is a tumor biomarker for colorectal cancer (Yajima et al., 2007). High expression of the RPL27A gene will increase the risk of colorectal cancer (Takemasa et al., 2012). RPL27A was also identified as a biomarker for squamous cervical cancer (Fjeldbo et al., 2016). The RPL35A gene is located at chromosome 3q29-qter (Colombo et al., 1996), and almost all studies have suggested that Diamond-Blackfan anemia is caused by deletion of the RPL35A gene (Farrar et al., 2008, 2011; Gianferante et al., 2020). Finally, the RPS12 gene has been shown to be related to the biological functions of various plants (Lee et al., 2019) and insects (Ji et al., 2019; Kirby and Koslowsky, 2020). Studies have shown that RPS12 gene deletion is associated with diffuse large B-cell lymphoma (Derenzini et al., 2019). The RPS12 gene has been demonstrated to be a hypoxia-related gene, and high expression of the RPS12 gene increases the risk of gastric cancer (Chen et al., 2013), squamous cell carcinoma (Fjeldbo et al., 2016) and HCC (Wang et al., 2009).
Ribosomal proteins are the main component of ribosomes and play an important role in protein biosynthesis in cells. Ribosomes participate in DNA repair, cell development regulation and cell differentiation (Petibon et al., 2021). In addition, the dysregulation of RPs affects the progression and prognosis of multiple diseases (Bolze et al., 2013; Ebright et al., 2020). Moreover, there are many studies on the relationship between ribosomal proteins and HCC. Researchers analyzed HCC cell lines and tissue samples and found that the expression levels of RPS3A in HCC cell lines and tissues were higher than those in normal liver cells and adjacent tumor-free tissues, and patients with high RPS3A expression had shorter OS and RFS than patients with low RPS3A expression (Zhou et al., 2020c). Guo et al. (2018) proposed that ribosomal protein S15a promotes tumor angiogenesis by enhancing Wnt/β-catenin-induced FGF18 expression in HCC. It has been reported that RPS11 is highly expressed in liver cancer tissues, and its high expression indicates a poor prognosis (Zhou et al., 2020b). On the other hand, studies (Chen et al., 2020; Zhou et al., 2020a) have shown that ribosomal proteins can be used as intermediate targets to inhibit the progression of HCC. Therefore, in the future, ribosomal proteins may become important targets in the diagnosis, treatment and prognosis of HCC.
Through the functional annotation and enrichment pathway analysis of RPL19, we found that high RPL19 expression suppressed bile acid metabolism and activated the cell cycle. Bile acids are produced in the liver and metabolized by enzymes derived from gut bacteria. They are essential for maintaining healthy gut microbiota, balancing lipid and carbohydrate metabolism, insulin sensitivity and innate immunity (Li et al., 2017). Increasing evidence has shown that bile acids play a vital role in the occurrence and progression of HCC (Jia et al., 2018). Studies have shown that the inhibition of bile acid metabolism can lead to cholestasis and increase the risk of HCC (Knisely et al., 2006). On the other hand, ursodeoxycholic acid can prevent liver cholestasis, thereby exerting its hepatoprotective effect (Beuers et al., 2015). Bioinformatic analysis indicated that high DDX11 expression was closely related to the G2-M phase transition of the cell cycle and DNA replication. Uncontrolled excessive proliferation is one of the main characteristics of tumor cells. Multiple studies have shown that the cell cycle pathway of liver cancer cells is significantly enhanced (Rebouissou and Nault, 2020), and the progression of liver cancer can be inhibited by inhibiting the cell cycle (Lee et al., 2018). Moreover, the immune infiltration analysis showed that the immune infiltration was significantly suppressed in HCC with high expression of RPL19. Ma et al. (2020) found that the expression of Aurora kinase A and ninein-interacting protein (AUNIP) was positively correlated with the degree of infiltration of dendritic cells, macrophages, neutrophils, CD8 + T cells, CD4 + T cells and B cells in HCC. Subsequent study showed that TANK-binding kinase 1 (TBK1) was a potential target for HCC by enhancing tumor immune infiltration (Jiang et al., 2021).
We acknowledge that there were some limitations and shortcomings to this study. First, WGCNA is based on highly correlated key modules to conduct the analysis, some key genes with low correlation may be missed. In addition, in this study we chose three hub modules with the highest correlation coefficient and positive correlation for model construction. In the process, we missed some highly negatively correlated modules (such as turquoise model in Figure 3). In the future research, we need to pay attention to the genes in these modules. Second, in this study, we identified four hub genes through WGCNA. We comprehensively considered the expression level, protein level, and gene function of the four genes. Only RPL19 has been validated in this study, the functions of the other three molecules (RPL35A, RPL27A, and RPS12) need further studies. Third, we only analyzed the relationship between the expression and clinical features but did not verify these findings through in vivo and in vitro experiments. Finally, we only explored the underlying mechanism based on bioinformatic prediction. The molecular mechanism of up-regulated RPL19 promoting the progression of HCC remains a subject for further study.
Conclusion
In conclusion, WGCNA was used to construct a co-expression gene network and revealed four hub genes (RPL19, RPL35A, RPL27A, and RPS12) that were highly expressed in HCC and whose expression were negatively correlated with HCC prognosis. Then, the effect of high RPL19 expression on the prognosis of HCC was verified through a TMA. Enrichment analysis revealed that cell cycle pathways were significantly enriched, and bile acid metabolism-related pathways were significantly down-regulated when RPL19 was highly expressed. The immune infiltration analysis showed that the immune infiltration was significantly suppressed in HCC with high expression of RPL19. As a result, RPL19 may be a molecular biomarker and drug target for the early diagnosis and prognosis of HCC. However, the mechanism by which RPL19 promotes the occurrence and development of HCC through the above pathways is still unknown, which is our next key research direction.
Data Availability Statement
The datasets presented in this study can be found in online repositories. The names of the repository/repositories and accession number(s) can be found in the article/Supplementary Material.
Ethics Statement
The studies involving human participants were reviewed and approved by Institutional Review Board of The First Affiliated Hospital of Zhengzhou University. The patients/participants provided their written informed consent to participate in this study.
Author Contributions
ZY and ZR designed the study. BR, JL, and TR provided equal contributions to the research design, data analysis, and article writing. JY, GZ, LL, HW, and MH revised the manuscript. All authors contributed to the article and approved the submitted version.
Funding
This study was supported by the China Postdoctoral Science Foundation (2020T130609 and 2020T130109ZX), National Natural Science Foundation of China (U2004121, 82070643, and U1904164), and Key Scientific Research Projects of Higher Education Institutions in Henan Province (20A320056).
Conflict of Interest
The authors declare that the research was conducted in the absence of any commercial or financial relationships that could be construed as a potential conflict of interest.
Supplementary Material
The Supplementary Material for this article can be found online at: https://www.frontiersin.org/articles/10.3389/fcell.2021.686547/full#supplementary-material
Supplementary Figure 1 | The 11 modules were enriched in 121 KEGG pathways. KEGG, Kyoto Encyclopedia of Genes and Genomes.
Supplementary Figure 2 | Distribution of the co-expression network degree.
Supplementary Figure 3 | Expression levels of the four hub genes in different stages of liver disease. (A) Expression level of RPL19 in different stages of liver diseases. (B) Expression level of RPL27A in different stages of liver diseases. (C) Expression level of RPL35A in different stages of liver diseases. (D) Expression level of RPS12 in different stages of liver diseases. ∗P < 0.05, ∗∗P < 0.01.
Supplementary Figure 4 | Relationship between the expression levels of the four hub genes and the prognosis of HCC patients with different TNM stages. (A) Relationship between RPL19 expression and the OS and RFS of HCC patients according to TNM stage (stages I∼II and III∼IV). (B) Relationship between RPL27A expression and the OS and RFS of HCC patients according to TNM stage (stages I∼II and III∼IV). (C) Relationship between RPL35A expression and the OS and RFS of HCC patients according to TNM stage (stages I∼II and III∼IV). (D) Relationship between RPS12 expression and the OS and RFS of HCC patients according to TNM stage (stages I∼II and III∼IV). OS, overall survival. RFS, relapse- free survival.
Supplementary Figure 5 | Overall survival curves of the immune infiltrating cells in HCC. Kaplan-Meier analysis showing the correlation between the immune cells scores and the OS of HCC patients. OS, overall survival.
Supplementary Figure 6 | Progression free survival curves of the immune infiltrating cells in HCC. Kaplan-Meier analysis showing the correlation between the immune cells scores and the PFS of HCC patients. PFS, progress free survival.
Supplementary Table 1 | All 31,334 genes identified.
Supplementary Table 2 | All 7,814 DEGs.
Supplementary Table 3 | Statistical results of genes corresponding to each module.
Supplementary Table 4 | Distribution of 7,814 selected genes in the different modules.
Supplementary Table 5 | Eleven modules were enriched in 121 KEGG pathways.
Supplementary Table 6 | All genes whose co-expression values were greater than 0.1.
Supplementary Table 7 | Eleven modules were enriched in 121 KEGG pathways.
Supplementary Table 8 | Human PPI data from the HIPPIE database.
Supplementary Table 9 | Human PPI network.
Footnotes
- ^ http://www.ncbi.nlm.nih.gov/geo/
- ^ https://tcga-data.nci.nih.gov/tcga/
- ^ http://cbdm.mdc-berlin.de/tools/hippie/hippie_current.txt
- ^ http://metascape.org
- ^ https://www.kegg.jp/
- ^ http://geneontology.org/
- ^ http://www.gsea-msigdb.org/gsea/msigdb/genesets.jsp?collection=H
- ^ www.r-project.org
References
Bee, A., Ke, Y., Forootan, S., Lin, K., Beesley, C., Forrest, S. E., et al. (2006). Ribosomal protein l19 is a prognostic marker for human prostate cancer. Clin. Cancer Res. 12(7 Pt. 1), 2061–2065. doi: 10.1158/1078-0432.CCR-05-2445
Beuers, U., Trauner, M., Jansen, P., and Poupon, R. (2015). New paradigms in the treatment of hepatic cholestasis: from UDCA to FXR, PXR and beyond. J. Hepatol. 62(1 Suppl.), S25–S37. doi: 10.1016/j.jhep.2015.02.023
Bolze, A., Mahlaoui, N., Byun, M., Turner, B., Trede, N., Ellis, S. R., et al. (2013). Ribosomal protein SA haploinsufficiency in humans with isolated congenital asplenia. Science (New York N. Y.) 340, 976–978. doi: 10.1126/science.1234864
Byron, S. A., Van Keuren-Jensen, K. R., Engelthaler, D. M., Carpten, J. D., and Craig, D. W. (2016). Translating RNA sequencing into clinical diagnostics: opportunities and challenges. Nat. Rev. Genet. 17, 257–271. doi: 10.1038/nrg.2016.10
Chen, D., Zhang, R., Shen, W., Fu, H., Liu, S., Sun, K., et al. (2013). RPS12-specific shRNA inhibits the proliferation, migration of BGC823 gastric cancer cells with S100A4 as a downstream effector. Int. J. Oncol. 42, 1763–1769. doi: 10.3892/ijo.2013.1872
Chen, M., Wang, D., Liu, J., Zhou, Z., Ding, Z., Liu, L., et al. (2020). MicroRNA-587 functions as a tumor suppressor in hepatocellular carcinoma by targeting ribosomal protein SA. Biomed. Res. Int. 2020:3280530. doi: 10.1155/2020/3280530
Colombo, P., Read, M., and Fried, M. (1996). The human L35a ribosomal protein (RPL35A) gene is located at chromosome band 3q29-qter. Genomics 32, 148–150. doi: 10.1006/geno.1996.0093
Cui, X., Liu, X., Han, Q., Zhu, J., Li, J., Ren, Z., et al. (2019). DPEP1 is a direct target of miR-193a-5p and promotes hepatoblastoma progression by PI3K/Akt/mTOR pathway. Cell Death Dis. 10:701. doi: 10.1038/s41419-019-1943-0
Dai, Y., Lv, Q., Qi, T., Qu, J., Ni, H., Liao, Y., et al. (2020). Identification of hub methylated-CpG sites and associated genes in oral squamous cell carcinoma. Cancer Med. 9, 3174–3187. doi: 10.1002/cam4.2969
Derenzini, E., Agostinelli, C., Rossi, A., Rossi, M., Scellato, F., Melle, F., et al. (2019). Genomic alterations of ribosomal protein genes in diffuse large B cell lymphoma. Br. J. Haematol. 185, 330–334. doi: 10.1111/bjh.15442
Dressman, M. A., Baras, A., Malinowski, R., Alvis, L. B., Kwon, I., Walz, T. M., et al. (2003). Gene expression profiling detects gene amplification and differentiates tumor types in breast cancer. Cancer Res. 63, 2194–2199.
Ebright, R. Y., Lee, S., Wittner, B. S., Niederhoffer, K. L., Nicholson, B. T., Bardia, A., et al. (2020). Deregulation of ribosomal protein expression and translation promotes breast cancer metastasis. Science (New York N. Y.) 367, 1468–1473. doi: 10.1126/science.aay0939
Farrar, J. E., Nater, M., Caywood, E., McDevitt, M. A., Kowalski, J., Takemoto, C. M., et al. (2008). Abnormalities of the large ribosomal subunit protein, Rpl35a, in Diamond-Blackfan anemia. Blood 112, 1582–1592. doi: 10.1182/blood-2008-02-140012
Farrar, J. E., Vlachos, A., Atsidaftos, E., Carlson-Donohoe, H., Markello, T. C., Arceci, R. J., et al. (2011). Ribosomal protein gene deletions in Diamond-Blackfan anemia. Blood 118, 6943–6951. doi: 10.1182/blood-2011-08-375170
Fjeldbo, C. S., Aarnes, E. K., Malinen, E., Kristensen, G. B., and Lyng, H. (2016). Identification and validation of reference genes for RT-qPCR studies of hypoxia in squamous cervical cancer patients. PLoS One 11:e0156259. doi: 10.1371/journal.pone.0156259
Gianferante, D. M., Wlodarski, M. W., Atsidaftos, E., Da Costa, L., Delaporta, P., Farrar, J. E., et al. (2020). Genotype-phenotype association and variant characterization in Diamond-Blackfan anemia caused by pathogenic variants in RPL35A. Haematologica 106, 1303–1310. doi: 10.3324/haematol.2020.246629
Gu, Y., Li, J., Guo, D., Chen, B., Liu, P., Xiao, Y., et al. (2020). Identification of 13 key genes correlated with progression and prognosis in hepatocellular carcinoma by weighted gene Co-expression network analysis. Front. Genet. 11:153. doi: 10.3389/fgene.2020.00153
Guo, P., Wang, Y., Dai, C., Tao, C., Wu, F., Xie, X., et al. (2018). Ribosomal protein S15a promotes tumor angiogenesis via enhancing Wnt/beta-catenin-induced FGF18 expression in hepatocellular carcinoma. Oncogene 37, 1220–1236. doi: 10.1038/s41388-017-0017-y
Huang, C. J., Chien, C. C., Yang, S. H., Chang, C. C., Sun, H. L., Cheng, Y. C., et al. (2008). Faecal ribosomal protein L19 is a genetic prognostic factor for survival in colorectal cancer. J. Cell. Mol. Med. 12, 1936–1943. doi: 10.1111/j.1582-4934.2008.00253.x
Ji, Z., Kiparaki, M., Folgado, V., Kumar, A., Blanco, J., Rimesso, G., et al. (2019). Drosophila RpS12 controls translation, growth, and cell competition through Xrp1. PLoS Genet. 15:e1008513. doi: 10.1371/journal.pgen.1008513
Jia, W., Xie, G., and Jia, W. (2018). Bile acid-microbiota crosstalk in gastrointestinal inflammation and carcinogenesis. Nat. Rev. Gastroenterol. Hepatol. 15, 111–128. doi: 10.1038/nrgastro.2017.119
Jiang, J., Bi, Y., Liu, X. P., Yu, D., Yan, X., Yao, J., et al. (2020). To construct a ceRNA regulatory network as prognostic biomarkers for bladder cancer. J. Cell. Mol. Med. 24, 5375–5386. doi: 10.1111/jcmm.15193
Jiang, Y., Chen, S., Li, Q., Liang, J., Lin, W., Li, J., et al. (2021). TANK-binding kinase 1 (TBK1) serves as a potential target for hepatocellular carcinoma by enhancing tumor immune infiltration. Front. Immunol. 12:612139. doi: 10.3389/fimmu.2021.612139
Kim, J. H., Sohn, B. H., Lee, H. S., Kim, S. B., Yoo, J. E., Park, Y. Y., et al. (2014). Genomic predictors for recurrence patterns of hepatocellular carcinoma: model derivation and validation. PLoS Med. 11:e1001770. doi: 10.1371/journal.pmed.1001770
Kirby, L. E., and Koslowsky, D. (2020). Cell-line specific RNA editing patterns in Trypanosoma brucei suggest a unique mechanism to generate protein variation in a system intolerant to genetic mutations. Nucleic Acids Res 48, 1479–1493. doi: 10.1093/nar/gkz1131
Knisely, A. S., Strautnieks, S. S., Meier, Y., Stieger, B., Byrne, J. A., Portmann, B. C., et al. (2006). Hepatocellular carcinoma in ten children under five years of age with bile salt export pump deficiency. Hepatology 44, 478–486. doi: 10.1002/hep.21287
Kuroda, K., Takenoyama, M., Baba, T., Shigematsu, Y., Shiota, H., Ichiki, Y., et al. (2010). Identification of ribosomal protein L19 as a novel tumor antigen recognized by autologous cytotoxic T lymphocytes in lung adenocarcinoma. Cancer Sci. 101, 46–53. doi: 10.1111/j.1349-7006.2009.01351.x
Lee, D., Jang, M. K., Seo, J. H., Ryu, S. H., Kim, J. A., and Chung, Y. H. (2018). ARD1/NAA10 in hepatocellular carcinoma: pathways and clinical implications. Exp. Mol. Med. 50, 1–12. doi: 10.1038/s12276-018-0106-1
Lee, K., Park, S. J., Colas des Francs-Small, C., Whitby, M., Small, I., and Kang, H. (2019). The coordinated action of PPR4 and EMB2654 on each intron half mediates trans-splicing of rps12 transcripts in plant chloroplasts. Plant J. 100, 1193–1207. doi: 10.1111/tpj.14509
Li, J., Wang, X., Yang, J., Zhao, S., Liu, T., and Wang, L. (2020). Identification of hub genes in hepatocellular carcinoma related to progression and prognosis by weighted gene Co-expression network analysis. Med. Sci. Monit. 26:e920854. doi: 10.12659/MSM.920854
Li, M., Cai, S. Y., and Boyer, J. L. (2017). Mechanisms of bile acid mediated inflammation in the liver. Mol. Aspects Med. 56, 45–53. doi: 10.1016/j.mam.2017.06.001
Liu, J., Nie, S., Gao, M., Jiang, Y., Wan, Y., Ma, X., et al. (2019). Identification of EPHX2 and RMI2 as two novel key genes in cervical squamous cell carcinoma by an integrated bioinformatic analysis. J. Cell. Physiol. 234, 21260–21273. doi: 10.1002/jcp.28731
Ma, C., Kang, W., Yu, L., Yang, Z., and Ding, T. (2020). AUNIP expression is correlated with immune infiltration and is a candidate diagnostic and prognostic biomarker for hepatocellular carcinoma and lung adenocarcinoma. Front. Oncol. 10:590006. doi: 10.3389/fonc.2020.590006
Misselbeck, K., Parolo, S., Lorenzini, F., Savoca, V., Leonardelli, L., Bora, P., et al. (2019). A network-based approach to identify deregulated pathways and drug effects in metabolic syndrome. Nat. Commun. 10:5215. doi: 10.1038/s41467-019-13208-z
Panwar, B., Schmiedel, B. J., Liang, S., White, B., Rodriguez, E., Kalunian, K., et al. (2021). Multi-cell type gene coexpression network analysis reveals coordinated interferon response and cross-cell type correlations in systemic lupus erythematosus. Genome Res. 31, 659–676. doi: 10.1101/gr.265249.120
Petibon, C., Malik Ghulam, M., Catala, M., and Abou Elela, S. (2021). Regulation of ribosomal protein genes: an ordered anarchy. Wiley Interdiscip. Rev. RNA 12:e1632. doi: 10.1002/wrna.1632
Rahbari, N. N., Mehrabi, A., Mollberg, N. M., Muller, S. A., Koch, M., Buchler, M. W., et al. (2011). Hepatocellular carcinoma: current management and perspectives for the future. Ann. Surg. 253, 453–469. doi: 10.1097/SLA.0b013e31820d944f
Rebouissou, S., and Nault, J. C. (2020). Advances in molecular classification and precision oncology in hepatocellular carcinoma. J. Hepatol. 72, 215–229. doi: 10.1016/j.jhep.2019.08.017
Remmele, W., Hildebrand, U., Hienz, H. A., Klein, P. J., Vierbuchen, M., Behnken, L. J., et al. (1986). Comparative histological, histochemical, immunohistochemical and biochemical studies on oestrogen receptors, lectin receptors, and Barr bodies in human breast cancer. Virchows Arch. A Pathol. Anat. Histopathol. 409, 127–147. doi: 10.1007/BF00708323
Siegel, R. L., Miller, K. D., and Jemal, A. (2020). Cancer statistics, 2020. CA Cancer J. Clin. 70, 7–30. doi: 10.3322/caac.21590
Takemasa, I., Kittaka, N., Hitora, T., Watanabe, M., Matsuo, E., Mizushima, T., et al. (2012). Potential biological insights revealed by an integrated assessment of proteomic and transcriptomic data in human colorectal cancer. Int. J. Oncol. 40, 551–559. doi: 10.3892/ijo.2011.1244
Wang, F., Kuang, Y., Salem, N., Anderson, P. W., and Lee, Z. (2009). Cross-species hybridization of woodchuck hepatitis viral infection-induced woodchuck hepatocellular carcinoma using human, rat and mouse oligonucleotide microarrays. J. Gastroenterol. Hepatol. 24, 605–617. doi: 10.1111/j.1440-1746.2008.05581.x
Wang, W., Xing, H., Huang, C., Pan, H., and Li, D. (2020). Identification of pancreatic cancer type related factors by weighted gene Co-expression network analysis. Med. Oncol. 37:33. doi: 10.1007/s12032-020-1339-0
Wei, J., Yin, Y., Deng, Q., Zhou, J., Wang, Y., Yin, G., et al. (2020). Integrative analysis of MicroRNA and gene interactions for revealing candidate signatures in prostate cancer. Front. Genet. 11:176. doi: 10.3389/fgene.2020.00176
Yajima, S., Ishii, M., Matsushita, H., Aoyagi, K., Yoshimatsu, K., Kaneko, H., et al. (2007). Expression profiling of fecal colonocytes for RNA-based screening of colorectal cancer. Int. J. Oncol. 31, 1029–1037.
Yan, W., Li, S. X., Gao, H., and Yang, W. (2019). Identification of B-cell translocation gene 1-controlled gene networks in diffuse large B-cell lymphoma: a study based on bioinformatics analysis. Oncol. Lett. 17, 2825–2835. doi: 10.3892/ol.2019.9900
Yu, L. X., and Schwabe, R. F. (2017). The gut microbiome and liver cancer: mechanisms and clinical translation. Nat. Rev. Gastroenterol. Hepatol. 14, 527–539. doi: 10.1038/nrgastro.2017.72
Zhang, C., Peng, L., Zhang, Y., Liu, Z., Li, W., Chen, S., et al. (2017). The identification of key genes and pathways in hepatocellular carcinoma by bioinformatics analysis of high-throughput data. Med. Oncol. 34:101. doi: 10.1007/s12032-017-0963-9
Zhang, X., Feng, H., Li, Z., Li, D., Liu, S., Huang, H., et al. (2018). Application of weighted gene co-expression network analysis to identify key modules and hub genes in oral squamous cell carcinoma tumorigenesis. Onco Targets Ther. 11, 6001–6021. doi: 10.2147/OTT.S171791
Zhou, C., Liu, C., Liu, W., Chen, W., Yin, Y., Li, C. W., et al. (2020a). SLFN11 inhibits hepatocellular carcinoma tumorigenesis and metastasis by targeting RPS4X via mTOR pathway. Theranostics 10, 4627–4643. doi: 10.7150/thno.42869
Zhou, C., Sun, J., Zheng, Z., Weng, J., Atyah, M., Zhou, Q., et al. (2020b). High RPS11 level in hepatocellular carcinoma associates with poor prognosis after curative resection. Ann. Transl. Med. 8:466. doi: 10.21037/atm.2020.03.92
Keywords: hepatocellular carcinoma, ribosomal protein L19, weighted gene co-expression network analysis, prognostic biomarker, immune infiltration
Citation: Rao B, Li J, Ren T, Yang J, Zhang G, Liu L, Wang H, Huang M, Ren Z and Yu Z (2021) RPL19 Is a Prognostic Biomarker and Promotes Tumor Progression in Hepatocellular Carcinoma. Front. Cell Dev. Biol. 9:686547. doi: 10.3389/fcell.2021.686547
Received: 27 March 2021; Accepted: 30 June 2021;
Published: 19 July 2021.
Edited by:
Giampaolo Morciano, University of Ferrara, ItalyReviewed by:
Danillo G. Augusto, University of California, San Francisco, United StatesManikandan Mayakannan, Case Western Reserve University, United States
Copyright © 2021 Rao, Li, Ren, Yang, Zhang, Liu, Wang, Huang, Ren and Yu. This is an open-access article distributed under the terms of the Creative Commons Attribution License (CC BY). The use, distribution or reproduction in other forums is permitted, provided the original author(s) and the copyright owner(s) are credited and that the original publication in this journal is cited, in accordance with accepted academic practice. No use, distribution or reproduction is permitted which does not comply with these terms.
*Correspondence: Zhigang Ren, ZmNjcmVuemdAenp1LmVkdS5jbg==; Zujiang Yu, am9obnl1ZW1Aenp1LmVkdS5jbg==
†These authors have contributed equally to this work