 Na Li
Na Li Qin Guo
 Qiao Zhang2†
- 1Department Of Gastroenterology, The First People’s Hospital of Aksu District, Aksu, China
- 2The First Affiliated Hospital of Chengdu Medical College, School of clinical medicine, Chengdu Medical College, Chengdu, China
- 3Mianyang Central Hospital, School of Medicine, University of Electronic Science and Technology of China, Mianyang, China
Aim: To comprehensively profile the landscape of the mRNA N6-methyladenosine (m6A) modification in human colorectal cancer (CRC).
Methods: Methylated RNA immunoprecipitation sequencing (MeRIP-seq) was explored to compare the difference in mRNA N6-methyladenosine (m6A) methylation between CRC tissues and adjacent normal control (NC) tissue. RNA-sequencing (RNA-seq) was performed to transcribe differentially expressed mRNAs. Conjoint analysis of MeRIP-seq and RNA-seq data was conducted to predict RNA-binding proteins (RBPs).
Results: MeRIP-seq identified 1110 differentially m6A methylated sites (DMMSs) and 980 differentially m6A methylated genes (DMMGs) in CRC, with 50.13% of all modified genes showing unique m6A-modified peaks in CRC. RNA-seq showed 915 upregulated genes and 1463 downregulated genes in CRC. QRT-PCR verified the RNA-seq results by detecting the expression of some mRNAs. Conjoint analysis of MeRIP-seq and RNA-seq identified 400 differentially m6A methylated and expressed genes (DEGs), and pathway analysis detected that DMMGs and DEGs were closely related to cancer. After analyzing these DMMGs and DEGs through the GEPIA database, we found that the expression of B3GNT6, DKC1, SRPK1, and RIMKLB were associated with prognosis, and the expression of B3GNT6 and RIMKLB were associated with clinical stage. 17 RBPs were identified based on the DMMGs and DEGs, among which FXR1, FXR2, FMR1, IGF2BP2, IGF2BP3, and SRSF1 were obviously highly expressed in CRC, and FMR1, IGF2BP2, and IGF2BP3 were closely related to methylation, and might be involved in the development of CRC.
Conclusion: This study comprehensively profiled m6A modification of mRNAs in CRC, which revealed possible mechanisms of m6A-mediated gene expression regulation.
Introduction
N6-methyladenosine (m6A) is the most abundant modification of eukaryotic mRNAs (Fustin et al., 2013). It is also widely associated with transfer RNAs, small nuclear RNAs, circular RNAs, as well as long-chain non-coding RNAs (Dominissini et al., 2012; Machnicka et al., 2013; Li and Mason, 2014; Meyer and Jaffrey, 2014; Kirchner and Ignatova, 2015; Li et al., 2017a), which participates in various biological processes in tissues and cells, including self-renewal, reproductive development, lipid metabolism, nervous system development, and immune regulation (Wang et al., 2015; Yang et al., 2016; Li et al., 2017b; Ivanova et al., 2017; Wang et al., 2018; Berry et al., 2020). RNA m6A modification is prevalent in plants (Kennedy and Lane, 1979), vertebrates (Desrosiers et al., 1975), viruses (Canaani et al., 1979), and bacteria (Deng et al., 2015), which has a consistently conserved sequence RRm6ACH [(G/A/U) (G > A) m6AC (U > A > C)] (Csepany et al., 1990; Narayan et al., 1994).
Three types of enzyme profiles are required for m6A methylation modification, including writers (m6A methyltransferases), erasers (m6A demethylases), and readers. Writers include methyltransferase 3 (METTL3, HGNC:17563), methyltransferase 14 (METTL14, HGNC:29330), Wilms tumor 1 associated protein (WTAP, HGNC: 16846), and possibly vir like m6A methyltransferase associated (VIRMA, HGNC:24500) and RNA binding motif protein 15 (RBM15, HGNC:14959) (Deng et al., 2018). FTO alpha-ketoglutarate dependent dioxygenase (FTO, HGNC:24678) and AlkB homolog 5 (ALKBH5, HGNC:25996) serve as m6A erasers, and set of YTH N6-methyladenosine RNA binding protein 1/2/3 (YTHDF1/2/3, HGNC: 15867/31675/26465), YTH domain containing 1 (YTHDC1/2, HGNC:30626/24721), and eukaryotic translation initiation factor 3 subunit A (eIF3A, HGNC:3271) play the role of m6A “readers” (Meyer et al., 2015; Roundtree and He, 2016; Ha et al., 2019; He et al., 2019; Liu et al., 2020a; Liu et al., 2020b; Chao et al., 2020). In addition, the function of m6A methylation is closely related to RNA-binding proteins (RBPs), which selectively bind to m6A-modified mRNAs and transport them to the mRNA degradation site to regulate mRNA metabolism (Meyer et al., 2015; He et al., 2019). These m6A methylation-related proteins are involved in modulating mRNA stability, shearing, transport, degradation, and translation, which regulate epigenetic changes in RNAs. Under normal physiological conditions, the dynamic balance of m6A methylation maintains the stable metabolism of RNA molecules. When m6A methylation imbalanced, the original metabolic process of RNA molecules is disrupted, resulting in epigenetic changes in RNAs.
RNA m6A modification is not only involved in normal metabolism in the body, but also associated with the development of different types of tumors, such as colorectal tumors (CRC), acute myeloid leukemia, non-small cell lung cancer, hepatocellular carcinoma, cervical squamous cell carcinoma, and breast cancer (He et al., 2019). A number of studies display that RNA m6A methylation of CRC is involved in the activity regulations of cancer Stem Cell, as well as the growth, proliferation, anti-chemotherapy and immunotherapy of tumour cells (Bai et al., 2019; Wang et al., 2020; Yang et al., 2021). Therefore, to further reveal the pathogenesis of CRC, it is worthwhile to study the modification patterns of CRC methylation.
Methylated RNA immunoprecipitation sequencing (MeRIP-seq) technology have become the main detection method for m6A modification (Dominissini et al., 2012). In this study, we conducted MeRIP-seq and RNA-sequencing (RNA-seq) in CRC tissues and the corresponding normal control (NC) tissues to investigate the m6A modification patterns in colorectal cancer, the involvement of m6A modification in the development of CRC, the relationship between mRNA m6A modification and mRNA expression, together with the predicted RBPs closely related to mRNA m6A methylation for a comprehensive understanding of m6A methylation in CRC.
Materials and Methods
Tissue Samples
All five specimens of patients diagnosed with CRC were obtained at the Chengdu Medical College from March 2017 to June 2018. None of these patients received radiation or chemotherapy before the specimens were collected. Clinicopathological informations of 5 CRC patients were displayed in Supplementary Table S1. Three to four specimens with diameters of 0.5–1.0 cm were collected from the center of the CRC tissues. At the same time, three to four pieces of the NC tissues of a similar size were collected 5 cm away from the edge of the cancer tissue. Informed consent was obtained from patients regarding the collection and use of these specimens. The collected specimens were frozen sectioned and stained with hemAtoxylin-eosin to confirm that the collected specimens were colon cancer (COAD) or rectal cancer (READ) tissues and corresponding NC tissues. This study had been approved by the Ethics Committee of the First Affiliated Hospital of Chengdu Medical College.
RNA Isolation
RNA was extracted using TRIzol Reagent (Invitrogen, Carlsbad, CA, United States) according to the manufacturer’s instructions. The NEBNext rRNA Depletion Kit (New England Biolabs, Inc., Ipswich, MA, United States) was used to remove ribosomal RNA from the total RNA. The concentration and purity of RNA were detected using a NanoDrop ND-1000 spectrophotometer (Thermo, Waltham, MA, United States), and the integrity of RNA was evaluated using denaturing gel electrophoresis.
MeRIP-Seq and RNA-Seq
MeRIP-seq and RNA-seq were provided by Cloudseq Biotech Inc. (Shanghai, China). RNA was fragmentated using RNA fragmentation reagents (Thermo, Waltham, MA, United States). A total of 5 μg of fragmented mRNA was saved as input control for RNA-Seq, while 500 μg of fragmented mRNA was used to perform m6A RNA immunoprecipitation with GenSeqTM m6A-MeRIP Kit (GenSeq, Beijing, China). Both the input samples without immunoprecipitation and the m6A IP samples were used to generate libraries for RNA sequencing using the NEBNext®Ultra II Directional RNA Library Prep Kit (New England Biolabs, Inc., Ipswich, MA, United States). Library quality was evaluated using a BioAnalyzer 2100 system (Agilent Technologies, Inc., Palo Alto, CA, United States). Libraries were sequenced on an Illumina HiSeq instrument 4000 with 150 bp paired-end reads. The main reagents and instruments of the research were shown in Supplementary Tables S2, S3 respectively.
Real-Time Quantitative PCR
The cDNA primer sequences used in the study designed and synthesized by QingKe Biotechnology Co., Ltd. (Chengdu, China). The primer sequences of the target genes, β-actin and GAPDH used for RT-qPCR were displayed in Supplementary Table S4. Total RNA Extraction KIT (Solarbio, Beijing, China) was used to extract total RNA from tissues according to the manufacturer’s instructions. The concentration and purity of the isolated RNA were determined by NanoDrop ND-1000 spectrophotometer and the iScript cDNA Synthesis Kit (Bio-Rad, Hercules, CA, United States) was used for reversal. RT-qPCR was performed using SsoAdvanced Universal SYBR Green Supermix (Bio-Rad, Hercules, CA, United States). All qPCR analyses were conducted in triplicate and the average value was calculated. The expression values of genes were normalized β-actin and GAPDH, and then log2-ΔΔCt for the gene expression.
Data Analysis
Reads were harvested from Illumina HiSeq sequencer, and were quality controlled by Q30. After 3’ adaptor-trimming and low quality reads removing by cutadapt software (v1.9.3). First, clean reads of input libraries were aligned to reference genome (UCSC HG19) by Hisat2 software (v2.0.4). After that, The MACS (v1.4.2) software compared the clean reads with the human genome to identify the methylation sites (peaks) on RNAs. Differentially m6A methylated sites (DMMSs, fold-change ≥ 2 and p-value < 0.05) were identified by diffReps (v1.55.3). Sequence motifs were identified using Homer (v3.0). Under the guidance of the Gene Transfer Format gene annotation file, gene expression was calculated by Cufflinks (v2.2.1) using FPKM values (Fragments per kilobase of exon per million fragments mapped). Fold change ≥2, p-value <0.05 and FPKM ≥0.1 were acted as the threshold for differentially m6A methylated genes (DMMGs) screening. These peaks identified by both software with overlapping mRNA exons were identified by home-made scripts. Genes of interest were visualized in the Integrative Genomics Viewer (IGV) software (v2.8.3). Screening of differentially expressed genes (DEGs) in CRC group and NC group using Cuffdiff (v2.2.1) software.
Gene ontology (GO) and Kyoto Encyclopedia of Genes and Genomes (KEGG) pathway enrichment analysis were performed by DAVID (v6.7) database. p < 0.05 was used as the threshold of significant enrichment.
The combined analysis of MeRIP-seq and RNA-seq screened out the genes that were differentially methylated and expressed. The differential methylation regions of CRC vs. NC were divided into 9 portions from −5 to 4 according to the methylation fold change. The binding region of RBP intersected with the differentially methylated region of the selected gene to find the RBP that can bind to the methylated region via RMbase (v2.0) database. [columns (Log2FC): the ratio of differentially methylated areas of CRC/NC; rows: RBPs]. The color in the figure represented the RBPs binding rate. The RBPs binding rate was calculated through the number of RBPs binding divided by the number of differential methylation regions within the interval multiplied by the number of binding information of the RBP in the database. The darker the color, the greater the binding rate, which meant that the differentially methylated regions in the range were more likely to be bound by the RBPs. The main software information used in the research was shown in Supplementary Table S5.
Statistical Analysis
Data from three or more independent experiments were presented as mean ± standard deviation. Paired student’s t-tests were performed between cancer tissue samples and NC tissue samples. One-way analysis of variance was used to access the differences among five or more groups. Differences with p < 0.05 were considered statistically significant (*p < 0.05, **p < 0.01, ***p < 0.001).
Results
General Features of mRNA m6A Modification Patterns in CRC and NC Tissues
The MeRIP-seq technology was used to perform methylation sequencing on samples from CRC and NC. Reads data and quality testing were shown in Supplementary Table S6. A total of 23181 m6A peaks were identified in the CRC tissues, representing 13890 m6A-modified transcripts. In NC tissues, 20183 m6A peaks were identified, representing 12903 m6A-modified transcripts. Compared to NC tissues, CRC tissues had 9456 individual peaks and 3873 m6A-modified transcripts indicating a significant difference in global m6A modification patterns between CRC tissues and NC normal tissues (Figures 1A,B). The identified m6A peak was consistent with the most common m6A methylation motif GG/A (m6A) CH (Figure 1C) (Wu et al., 2019). It also confirmed the reliability of the obtained MeRIP-seq results. In addition, it was found that 50.13% of all modified genes had the unique m6A-modified peak in CRC tissues, and 50.33% in NC tissues. A relatively small number of m6A-modified genes contained two or more peaks (Figure 1D).
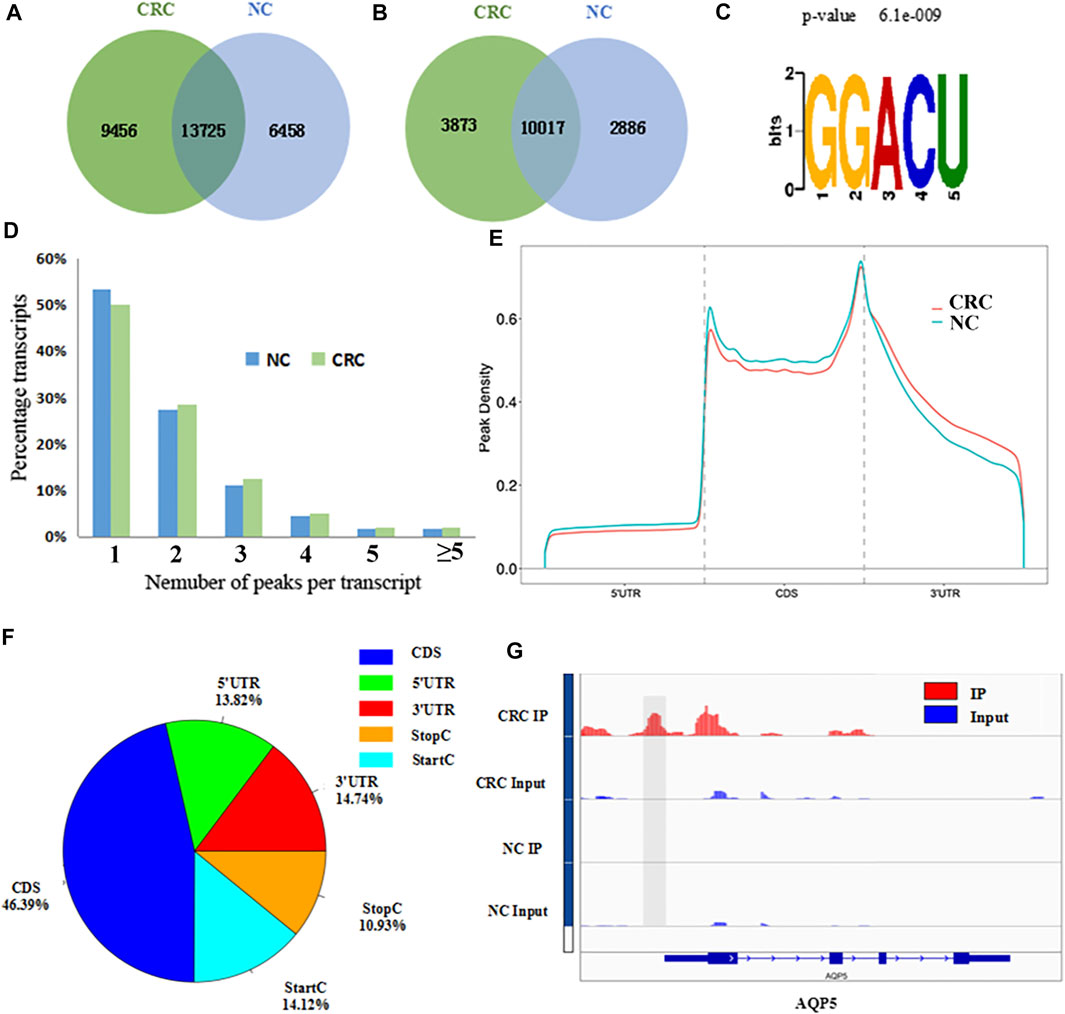
FIGURE 1. Overview of m6A methylation patterns in CRC tissues and NC tissues. (A) Venn diagram indicating the intersection of mRNA m6A peaks in CRC tissues and NC tissues. (CRC: colorectal cancer; NC: normal control). (B) The number of m6A peak-represented transcripts in CRC tissues and NC tissues. (C) Sequence motif of m6A peak regions. (D) The proportions of transcripts with different number of m6A peaks in CRC tissues and NC tissues. (E) Distribution of m6A peaks identified in the entire transcriptome in CRC and NC. (F) The percentage of m6A peaks in five non-overlapping segments. (G) Data visualization of AQP5 mRNA m6A modification in CRC tissues and NC tissues.
Distribution of Differentially Methylated m6A Peaks
With respect to the m6A distribution patterns in the entire transcriptome, the results displayed that the m6A peaks were mainly enriched in the vicinity of the CDs and at the beginning of the 3’untranslated region (3′UTRs) in both groups (Figures 1E,F). IGV was used to visually analyze the differential m6A peak of AQP5 (HGNC:638), KISS1 (HGNC:6341) and MUC16 (HGNC:15582) in CRC and NC. The differential hypermethylated peak of AQP5 on outside of the 5′UTRs was detected. The differential hypermethylated peaks of KISS1 and MUC16 were both enriched in the CDS regions (Figure 1G, Supplementary Figure S1).
A total of 1110 DMMSs and 980 differentially m6A methylated genes (DMMGs) were identified in CRC tissues. Out of the 980 DMMGs, 43.78% (429/980) were significantly hypermethylated, and 56.22% (551/980) were significantly hypomethylated (Supplementary Figure S2A). The top 10 genes of m6A hypermethylated or hypomethylated with the highest fold-change values were shown in Table 1. There was no significant difference in the distribution pattern of hypermethylated sites. The distribution of hypomethylation sites in the 5′UTR was significantly less than the 3′ UTR and CDS regions (Supplementary Figure S2B, Supplementary Table S7). All DMMSs were mapped to chromosomes to analyze their distribution profiles. DMMSs were mostly on chromosomes 1, 2, 11, and 19 (Supplementary Figure S2C).
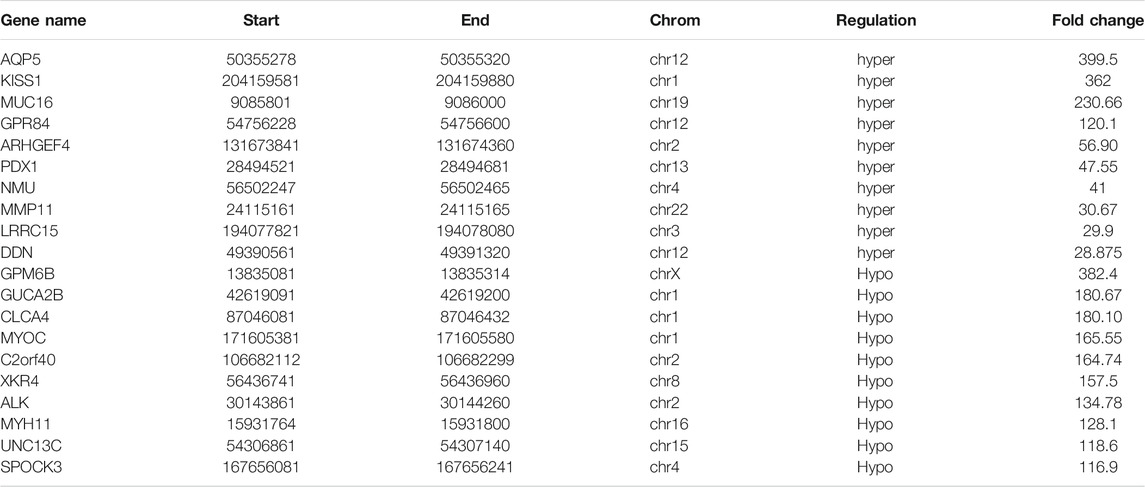
TABLE 1. The top 10 genes of m6A hypermethylated or hypomethylated.
Differentially Methylated RNAs Were Involved in Important Biological Pathways
To explore the biological significance of m6A modification in CRC tissues, GO analysis and KEGG pathway analysis were performed for DMMGs. Go analysis revealed that the hypermethylated genes were significantly enriched in the cell cycle process, intracellular organelle lumen, and nucleic acid binding (Figure 2A). The hypomethylated genes were significantly involved in the regulation of ion homeostasis, intracellular, and ion channel binding (Figure 2B). Cell cycle process, intracellular, and nucleic acid binding played an important role in tumor development (Dominissini et al., 2012).
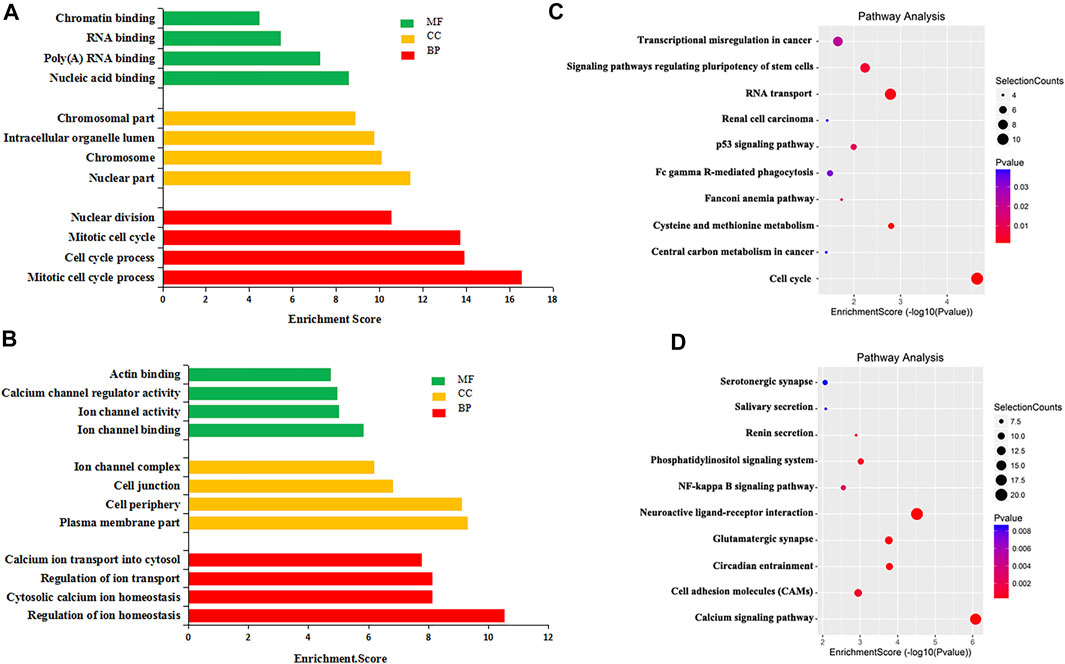
FIGURE 2. GO analysis and KEGG pathway analysis of differentially methylated mRNA. (A) The top 10 GO terms significantly enriched for hypermethylated genes. (B) The top 10 GO terms significantly enriched for hypomethylated genes. (C) The top 10 KEGG pathways significantly enriched for hypermethylated genes. (D) The top 10 KEGG pathways significantly enriched for hypomethylated genes.
KEGG pathway analysis revealed that hypermethylated genes were enriched in signaling pathways regulating the pluripotency of stem cells and the tumor protein p53 (TP53, HGNC:11998) signaling pathway (Figure 2C). Hypomethylated genes were enriched in the calcium signaling pathway and the nuclear factor kappa B (NF-κB, HGNC:9954) signaling pathway (Figure 2D). Stem cell pluripotency regulation, the TP53 signaling pathway, the NF-κB signaling pathway, and calcium ion regulation were closely related to the formation, metastasis, and drug resistance of multiple tumors (Ha et al., 2019; Liu et al., 2020b).
Functional Analysis of Differentially Expressed Genes in CRC
RNA-seq was used to detect DEGs (fold-change ≥ 2 and p-value < 0.05) in CRC and NC tissues, which showed 915 upregulated genes and 1463 downregulated genes (Figure 3A). Reads data and quality testing were shown in Supplementary Table S8. The top 10 upregulated and downregulated genes were listed in Table 2.
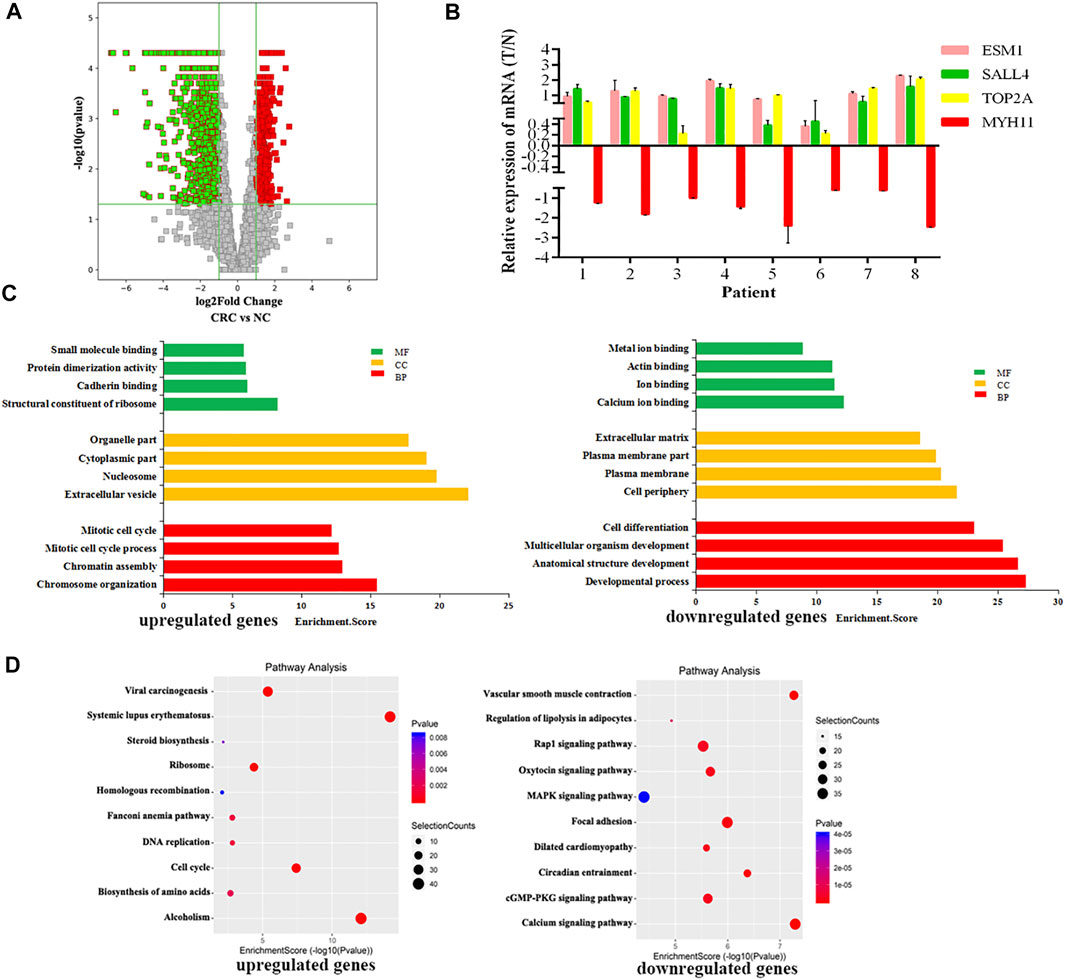
FIGURE 3. Identification of differentially expressed genes (DEGs) in CRC by RNA-seq. (A) The volcano plot showing the DEGs in CRC and NC groups. (B) The results of qRT-PCR for ESM1, SALL4, TOP2A, MYH11. (C) The top 10 GO terms significantily enriched for the upregulated genes on the left and downregulated genes on the right. (D) The top 10 GO terms significantly enriched for the upregulated genes on the left and downregulated genes on the right.
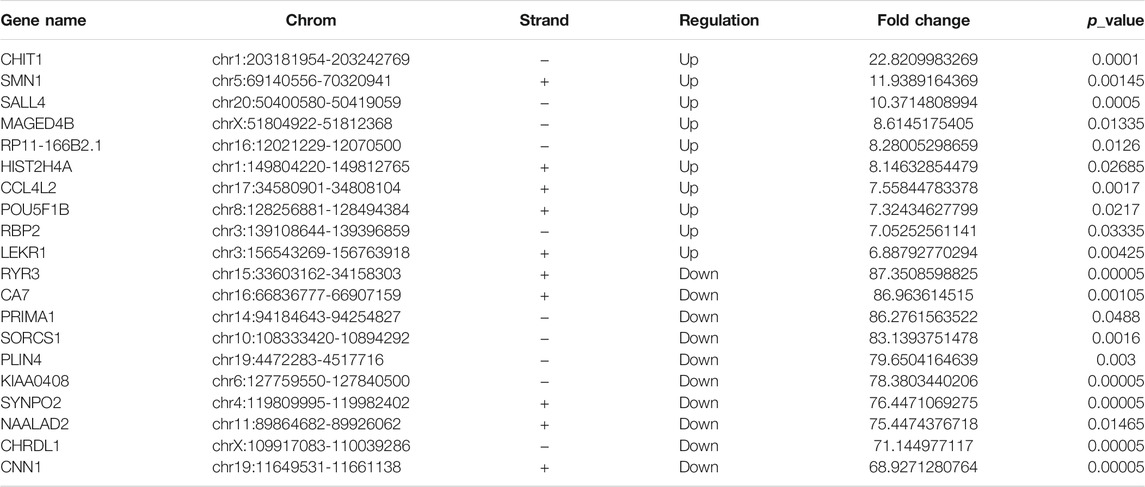
TABLE 2. The top 10 upregulated or downregulated genes.
Among these differentially expressed mRNAs, qRT-PCR was used to verify the expression of 4 mRNAs in 8 pairs of CRC and NC tissues. The results of qRT-PCR showed same expression trend with the RNA-Seq results. ESM1 (HGNC:3466), SALL4 (HGNC:15924), TOP2A (HGNC:11989) were upregulated, and MYH11 (HGNC:7569) was downregulated in CRC (Figure 3B).
To explore the physiological and pathological significance of DEGs in CRC, GO analysis and KEGG pathway analysis were performed. GO analysis revealed that the upregulated genes were significantly enriched in chromosome organization, extracellular organelles, and structural constituent of ribosomes, while the downregulated genes were significantly enriched in the developmental process, cell periphery, and calcium ion binding (Figure 3C). KEGG pathway analysis revealed that the upregulated genes were enriched in DNA replication and the TP53 signaling pathway, while downregulated genes were involved in the calcium signaling pathway and the MAPK signaling pathway (Figure 3D). The TP53 signaling pathway, calcium signaling pathway, and MAPK signaling pathway were important for the malignant progression of tumors (Nucera et al., 2011).
Differentially Methylated and Expressed mRNAs Were Related to Cancer
Using conjoint analysis of MeRIP-seq and RNA-seq data, 400 genes with differential m6A methylation and differential expression were identified. Among the 118 m6A hypermethylated genes, 117 genes had upregulated mRNA expression, and one gene had downregulated mRNA expression (Figure 4A). The top 10 hypermethylated and upregulated genes with the highest methylation fold changes were listed in Table 3. Additionally, there were 281 downregulated genes and one upregulated gene among the 282 m6A hypomethylated genes (Figure 4A). The top 10 hypomethylated and downregulated genes with the highest methylation fold changes were listed in Table 4. Almost all genes showed the same trend of methylation and expression. Hyper-methylation was accompanied by upregulation of mRNA expression, while hypo-methylation was accompanied by downregulation of mRNA expression. The results showed that the methylation of mRNA in CRC tissues may maintains the stability of mRNA and promotes post-transcriptional translation of mRNA.
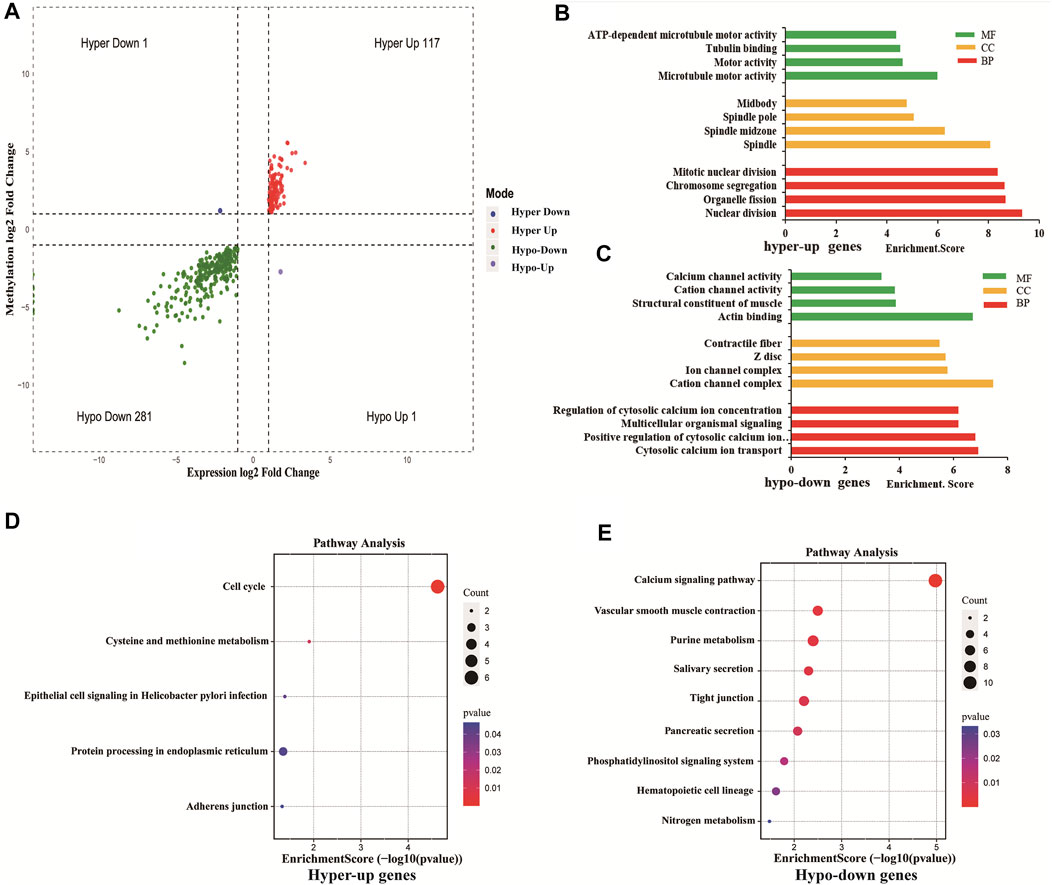
FIGURE 4. Differentially methylated and differentially expressed mRNAs were related to cancer. (A) Four-quadrant graph showing positive correlations between differential m6A methylation (fold-change ≥ 2 and p-value < 0.05) and differential expression (fold-change ≥ 2 and p-value < 0.05). (B) The top 10 GO terms significantly enriched for hyper-up genes. (C) The top 10 GO terms significantly enriched for hypo-down genes. (D) The top 10 KEGG pathways significantly enriched for hyper-up genes. (E) The top 10 KEGG pathways significantly enriched for hypo-down genes.
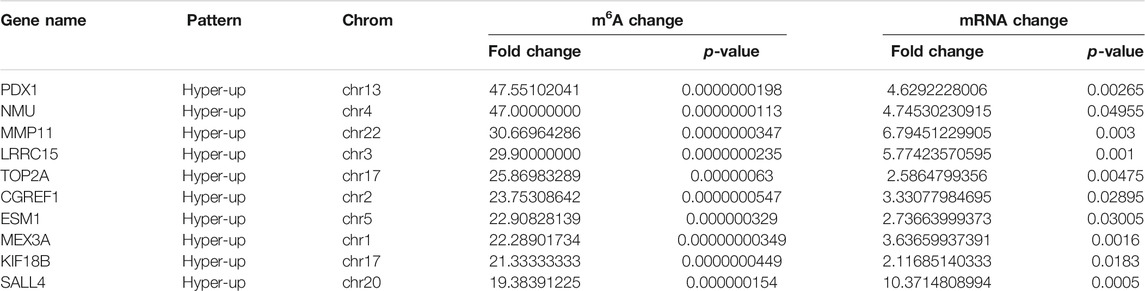
TABLE 3. The top 10 hypermethylated and upregulated genes.
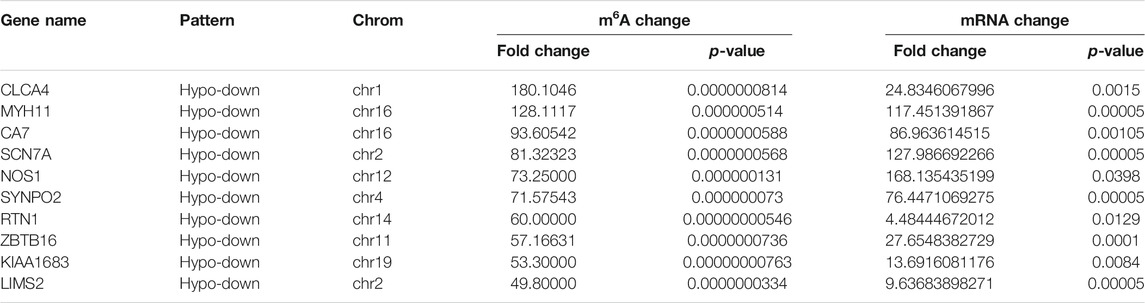
TABLE 4. The top 10 hypomethylated and downregulated genes.
To explore the role of differentially methylated and expressed mRNAs in the biological process of CRC, GO analysis and KEGG pathway were performed on hypermethylated-upregulated (hyper-up) genes and hypomethylated-downregulated (hypo-down) genes.
GO analysis indicated that hyper-up genes were mainly involved in the processes of microtubule motor activity, spindle and nuclear division (Figure 4B). The hypo-down genes were mainly involved in actin binding, cation channel complex, cytosolic calcium ion transport (Figure 4C). KEGG pathway analysis showed that hyper-up genes were enriched in the cell cycle and protein processing endoplasmic reticulum pathways (Figure 4D). Hypo-down genes were mainly enriched in calcium signaling pathway, vascular smooth muscle constraction and purine metabolism pathways (Figure 4E).
Correlation Between m6A-Regulated Gene Expression and Clinical Parameters
To assess the clinical significance of m6A-regulated gene, UALCAN and GEPIA databases were explored. These databases were used to investigate the relationship between the expression of 400 differentially methylated-expressed genes with tumor staging, lymphatic metastasis, and survival period. B3GNT6 (HGNC:24141), RIMKLB (HGNC:29228) in COAD, and DKC1 (HGNC:2890), SRPK1 (HGNC:11305) in READ were analyzed. Survival analysis showed that patients with high B3GNT6, DKC1, SRPK1, and low RIMKLB expression had a longer overall survival period (Figure 5). Compared with NC, the expressions of B3GNT6, RIMKLB, DKC1, and SRPK1 in COAD or READ were significantly different, which consistented with our sequencing datas. There was a significant difference in the expression of B3GNT6 in COAD stage 2 and stage 3. The expression of RIMKLB was significantly lower in COAD stage 1 than stage 2, 3, and 4. Meawhile, the expression of RIMKLB in COAD N1 stage was different from that of N0 and N2, respectively (Figure 6).
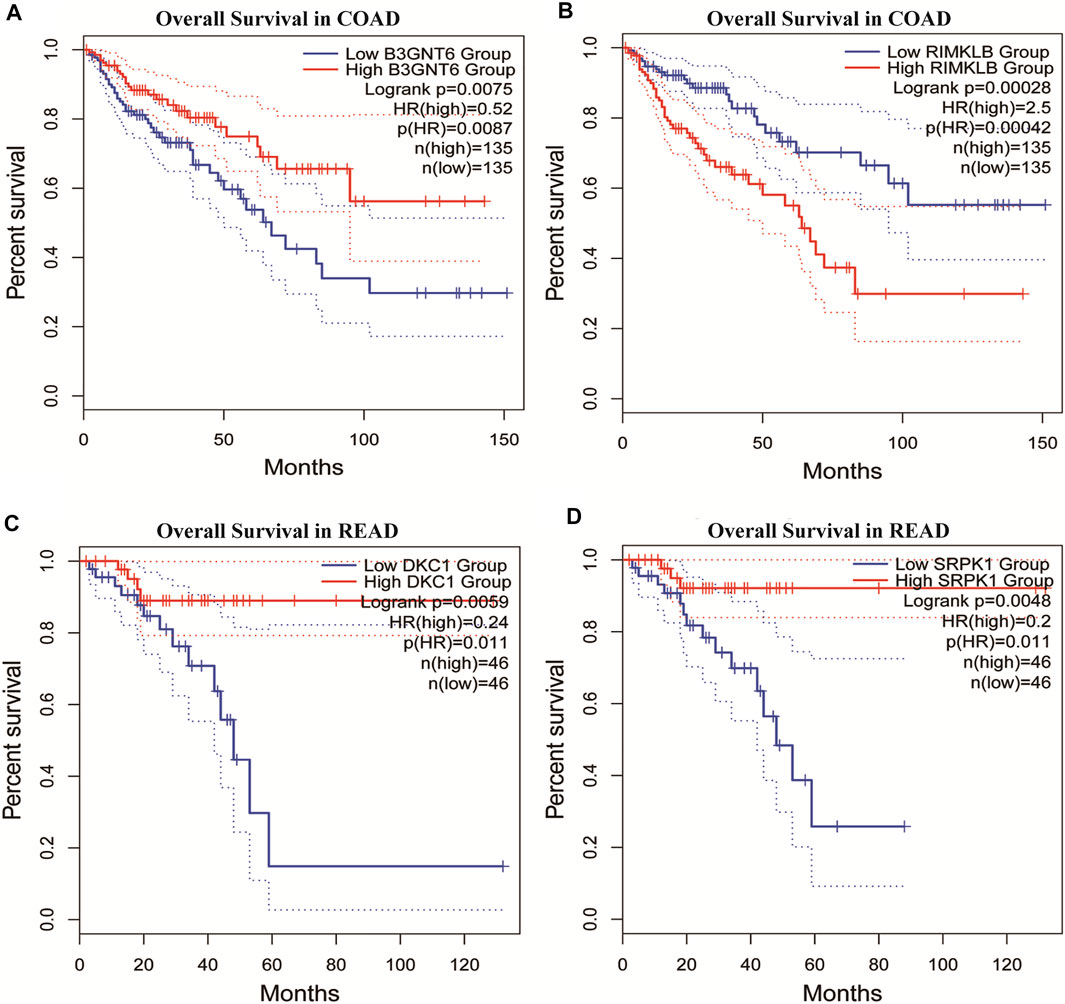
FIGURE 5. Survival analysis of differentially methylated and differentially expressed genes. (A,B) Survival analysis of B3GNT6/RIMKLB in COAD. (C,D) Survival analysis of DKC1/SRPK1 in READ. (COAD: colon cancer; READ: rectal cancer).
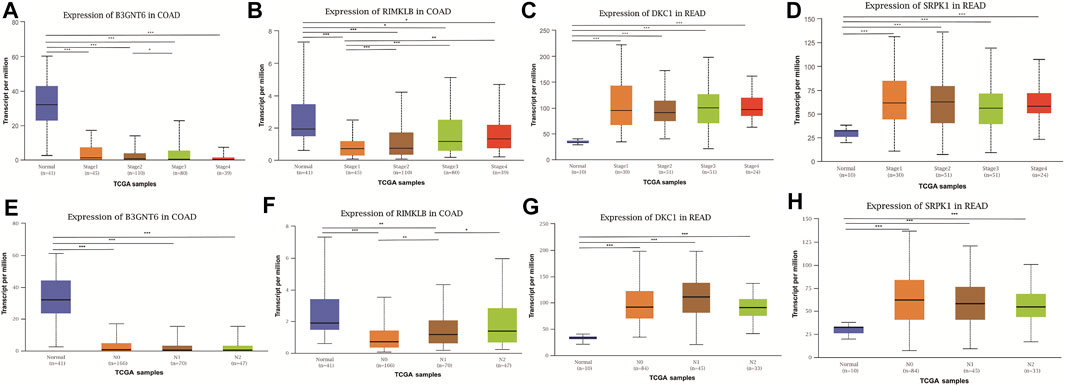
FIGURE 6. Relationship between the expression of differentially methylated and expressed genes with CRC staging and lymphatic metastasis. Expression of B3GNT6 (A,E), RIMKLB (B,F), DKC1 (C,G), SRPK1 (D,H) in normal tissues or tumour tissues with different clinical staging and lymphatic metastasis. (*p < 0.05, **p < 0.01, ***p < 0.001).
Conjoint Analysis of RBPs Based on Differentially Methylated and Differentially Expressed mRNA
Many proteins encoded by m6A methylated genes played an important role in CRC tissues. The biological functions of RNAs modified by m6A methylation were closely related to RBPs. In order to further studied the RBPs related to m6A modification in the occurrence and development of colon cancer, 400 different m6A methylation modified and expressed genes were screened out to predict the RBPs through the RMBase database. According to the ratio of potential RBPs bound to m6A sites in all differentially methylated and differentially expressed mRNAs. The overview of the RBPs was presented as a heatmap (Figure 7A). In order to further verify the expression level of RBPs in colorectal cancer, we searched the protein expression in 100 NC tissues and 97 COAD tissues through the CPTAC database. Consistent with our conclusion, FXR1 (HGNC:4023), FXR2 (HGNC:4024), FMR1 (HGNC:3775), IGF2BP2 (HGNC:28867), IGF2BP3 (HGNC:28868), and SRSF1 (HGNC:10780) were obviously highly expressed in COAD (Figures 7B–G).
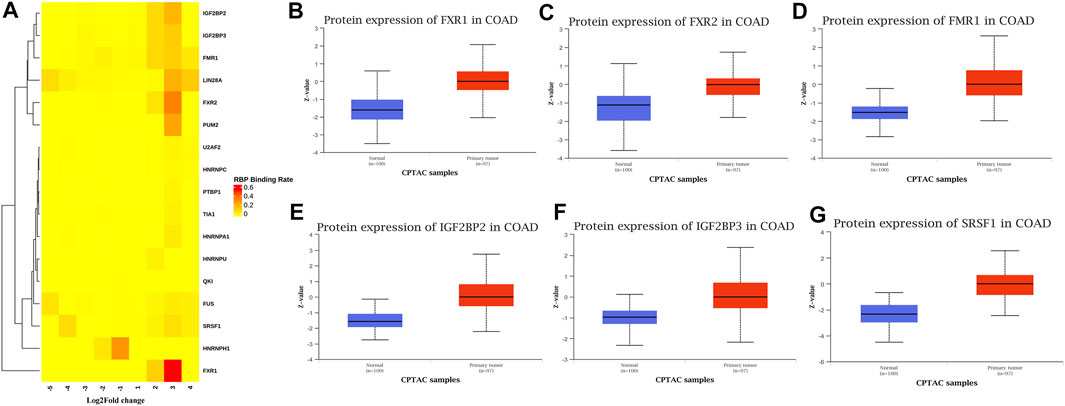
FIGURE 7. RNA binding protein based on differential methylation and expression gene prediction. (A) The heatmap showing 17 RBPs of differentially methylated and expressed genes (columns: the ratio of differentially methylated areas of CRC/NC; rows: RBPs). (B–G) Expression of FXR1/FXR2/FMR1/IGF2BP2/IGF2BP3/SRSF1 in normal tissues and primary COAD tissues based on CPTAC database. (Z-values represent standard deviations from the median across samples for COAD).
Among the 17 RBPs, FXR1/2, FMR1, PUM2 (HGNC:14958), LIN28A (HGNC:15986), IGF2BP2/3, HNRNPH1 (HGNC:5041), and SRSF1 were closely related to mRNA m6A methylation in CRC. FXR1/2, FMR1, PUM2, LIN28A, and IGF2BP2/3 were involved in the process of hyper-methylation. HNRNPH1 and SRSF1 were involved in the process of hypo-methylation. Specifically, FXR1/2, FMR1, IGF2BP2/3, and SRSF1 were closely related to the occurrence and malignant progress of CRC. The corresponding mRNAs of FMR1, IGF2BP2, and SRSF1 were presented in Table 5, and a diagram showing the pattern of m6A methylation regulation in CRC was shown in Figure 8. FXR1/2, FMR1, IGF2BP2/3, and SRSF1 were RBPs that shuttled between the nucleus and cytoplasm, which could increase the stability of targeted mRNA translation. In this study, we detected many hypermethylated and highly-expressed mRNAs related to these RBPs, which were closely related to the occurrence and malignant progression of CRC. For example, HOXD10 (HGNC:5133) was a major factor that negatively regulates tumor metastasis, and the expression of the HODX10 gene in the CRC tissue with lymphatic metastasis was lower than that in tissues without lymphatic metastasis (Wang et al., 2016). ORC6 (HGNC:17151) was related to the survival outcome of CRC (Hu et al., 2019). CDC20 (HGNC:1723), a cell cycle regulator, can bind to and activate the APC (HGNC:583) complex and participate in the development of CRC (Yu, 2007). Overexpression of the BLM (HGNC:1058) gene increased the risk of CRC (Laitman et al., 2016). Patients with a high expression of ASPM (HGNC:19048) were at more advanced clinical stages and were more prone to lymph node metastasis (An et al., 2017).
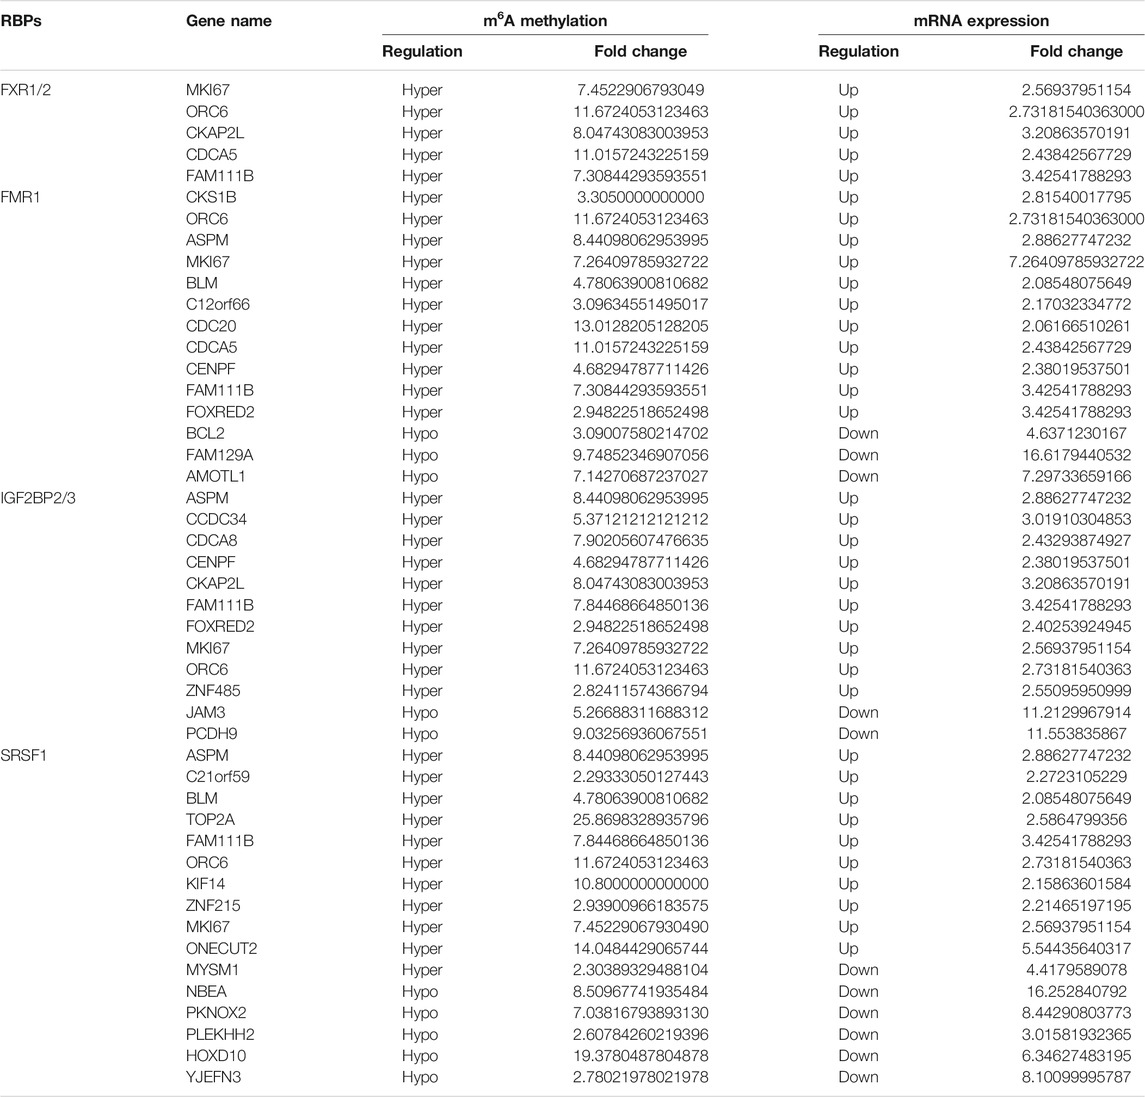
TABLE 5. The corresponding mRNA of FXR1/2, FMR1, IGF2BP2/3, and SRSF1.
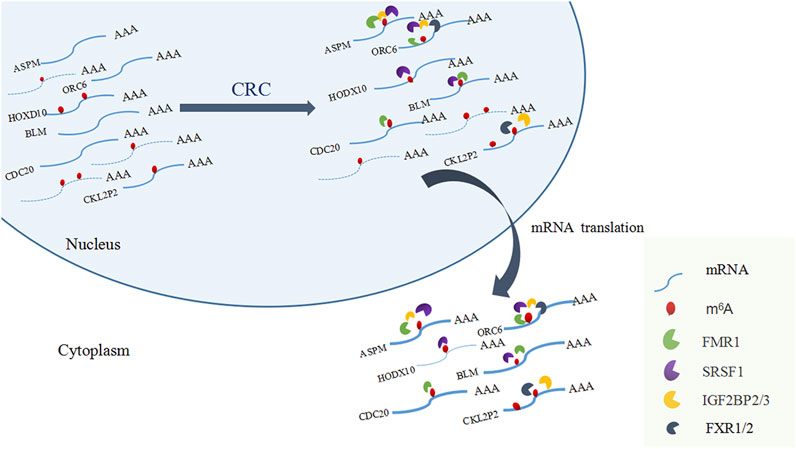
FIGURE 8. A diagram showing the pattern of m6A methylation regulation in CRC.
Discussion
N6-methyladenosine methylation is the most abundant modification in eukaryotic mRNAs. Compared to the normal physiological process, there were cases of both hyper- and hypo-methylations in m6A methylation in tumors, and they both affected the development of tumors by regulating oncogene expression, cancer cell growth, survival, and invasion. METTL14 inhibited hematopoietic stem cell/progenitor cell differentiation and promotes leukemia by enhancing the m6A modification of MYB (HGNC:7545)/MYC (HGNC:7553) (Weng et al., 2018). YTHDF1 augmented the translation of EIF3C (HGNC:3279) in an m6A-dependent manner by binding to m6A-modified EIF3C mRNA and concomitantly promoted the overall translational output, thereby facilitating tumorigenesis and metastasis of ovarian cancer (Liu et al., 2020a). M6A demethylase ALKBH5 affected the proliferation and invasion of lung adenocarcinoma cells by downregulating m6A modification on FOXM1 (HGNC:3818) mRNA and promoting FOXM1 expression (Chao et al., 2020). Therefore, the study of methylation contributed to further understand the pathogenesis of tumors and provide directions for treatment.
In this study, MeRIP-seq and RNA-seq analyses were conducted in CRC tissues and corresponding NC tissues to profile m6A modification patterns in CRC. MeRIP-seq analysis revealed a total of 23181 m6A peaks in the CRC group, representing 13890 m6A-modified transcripts. Compared to the NC group, the CRC group had 9456 individual peaks and 3873 m6A-modified transcripts. A total of 1110 DMMSs and 980 DMMGs were identified in the CRC group, and 50% of the modified genes had the unique m6A-modified peak in CRC. DMMSs were more abundant on chromosomes 1, 2, 11, and 19, and predominantly distributed in the CDs and 3′ UTR.
To understand the relationship between m6A methylation and mRNA expression, conjoint analysis of MeRIP-seq and RNA-seq datas was conducted, and 400 genes with differential m6A methylation and differential expression were identified. There was a positive correlation between methylation and expression that hyper-methylation was found to be accompanied by upregulation of mRNA expression, and hypo-methylation was accompanied by downregulation of mRNA expression. Notably, m6A methylation can either reduce or enhance the stability, cleavage, and transport of target mRNAs (Taketo et al., 2017; Lin et al., 2019).
GO and KEGG analysis showed that the differentially methylated and expressed genes mainly enriched in Spindle and Nuclear division, calcium signaling pathway, cell cycle and protein processing endoplasmic reticulum pathways etc. Parts of pathways were closely related to cancer. Previous studies showed that ASPM was highly expressed in hepatocellular carcinoma (HCC), and the high expression of ASPM was correlated with poor HCC prognosis. Mechanism studies showed that METTL3 promoted HCC cells growth and metastasis via m6A modification of ASPM (Wang et al., 2021). Mettl14-mediated m6A played a critical role in liver regeneration by regulating the expression of polypeptide-processing proteins and maintaining endoplasmic reticulum homeostasis (Cao et al., 2021). The prediction of these pathways provided clues for further research on the methylation mechanism of colorectal cancer.
The regulation of m6A methylation was mediated by key enzymes and RBPs. RBPs prediction showed that 17 RBPs may be closely related to the differentially methylated and expressed genes in CRC. Among the 17 RBPs, FXR1, FXR2, FMR1, PUM2, IGF2BP2, IGF2BP3, and SRSF1 were closely related to mRNA m6A methylation in CRC. FXR1 was a new driver in the 3q26-29 amplicon and predicted poor prognosis in human cancers (Qian et al., 2015). It shuttled between the nucleus and cytoplasm, highly expressed in lung and ovarian cancer (Le Tonquese et al., 2016), and may act as a tumor promoter to increase the proliferation, migration, and invasion of colorectal cancer (Jin et al., 2016). FMR1 facilitated the nuclear export of N6-methyladenosine-containing mRNAs (Hsu et al., 2019). The expression of PUM2 was significantly increased in glioblastoma, and the downregulation of PUM2 can significantly inhibit the proliferation and migration of glioblastoma cells (Wang et al., 2019). METTL3 stabilized the expressions of HK2 (HGNC:4923) and SLC2A1 (HGNC:11005) in CRC through a m6A-IGF2BP2/3-dependent mechanism to regulate glycolytic pathways and promote colorectal cancer progression (Shen et al., 2020). Research demonstrated that IGF2BP3 bound to the mRNA of CCND1 (HGNC:1582), and reduced its mRNA stability via reading m6A modification in the CDs region. Overexpression of CCND1 in IGF2BP3 down-regulated cells completely rescued the inhibited percentage of S phase in cell cycle as well as cell proliferation. (Yang et al., 2020). SRSF1 was identified as a proto-oncogene that shuttled between the cytoplasm and nucleus and bound to the GGAG base sequence on mRNAs to regulate the processes of mRNA transcription, stabilization, nucleation, and translation (Long and Caceres, 2009; Das and Krainer, 2014). Long non-coding RNA AGAP2-AS1 (HGNC:48633) accelerated cell proliferation, migration, invasion and the EMT process in CRC via regulating the miR-4668-3p/SRSF1 axis (Li et al., 2020). The involvements of FMR1, IGF2BP2, IGF2BP3 in methylation have been preliminarily explored. However, the researchs on the mechanism of more RBPs involvement in CRC methylation deserve to be investigated further.
Conclusion
This study established the mRNA m6A methylation modification map of CRC. Genes of differential m6A methylation and differential expression were identified and the RBPs of these genes were predicted. The possible molecular mechanism of m6A methylation in the development of CRC was revealed. This study provided a foundation for in-depth mechanistic analysis of m6A methylation in CRC.
Data Availability Statement
The data presented in the study are deposited in the GEO database repository, accession number GSE190388.
Ethics Statement
The studies involving human participants were reviewed and approved by the First Affiliated Hospital of Chengdu Medical College. The patients/participants provided their written informed consent to participate in this study. Written informed consent was obtained from the individual(s) for the publication of any potentially identifiable images or data included in this article.
Author Contributions
YZ and X-AL were involved in the conception and design of the study. QG and NL acquired the data and drafted the manuscript. QZ conducted data analysis. B-JC collected the samples. YZ critically revised the manuscript for intellectual content, approved the final version. All authors read and approved the final manuscript.
Funding
The present study was supported by the Seedling Engineering Cultivation Foundation of Science and Technology (grant No. 2018075).
Conflict of Interest
The authors declare that the research was conducted in the absence of any commercial or financial relationships that could be construed as a potential conflict of interest.
Publisher’s Note
All claims expressed in this article are solely those of the authors and do not necessarily represent those of their affiliated organizations, or those of the publisher, the editors and the reviewers. Any product that may be evaluated in this article, or claim that may be made by its manufacturer, is not guaranteed or endorsed by the publisher.
Supplementary Material
The Supplementary Material for this article can be found online at: https://www.frontiersin.org/articles/10.3389/fcell.2021.760912/full#supplementary-material
References
An, X., Huang, Y., and Zhao, P. (2017). Expression of ASPM in Colonic Adenocarcinoma and its Clinicopathologic Significance. Int. J. Clin. Exp. Pathol. 10 (8), 8968–8973.
Bai, Y., Yang, C., Wu, R., Huang, L., Song, S., Li, W., et al. (2019). YTHDF1 Regulates Tumorigenicity and Cancer Stem Cell-like Activity in Human Colorectal Carcinoma. Front. Oncol. 9, 332. doi:10.3389/fonc.2019.00332
Berry, K., Wang, J., and Lu, Q. R. (2020). Epigenetic Regulation of Oligodendrocyte Myelination in Developmental Disorders and Neurodegenerative Diseases. F1000Res 9, 1–16. doi:10.12688/f1000research.20904.1
Canaani, D., Kahana, C., Lavi, S., and Groner, Y. (1979). Identification and Mapping of N6-Methyladenosine Containing Sequences in Simian Virus 40 RNA. Nucl. Acids Res. 6, 2879–2899. doi:10.1093/nar/6.8.2879
Cao, X., Shu, Y., Chen, Y., Xu, Q., Guo, G., Wu, Z., et al. (2021). Mettl14-Mediated m6A Modification Facilitates Liver Regeneration by Maintaining Endoplasmic Reticulum Homeostasis. Cell Mol. Gastroenterol. Hepatol. 12 (2), 633–651. doi:10.1016/j.jcmgh.2021.04.001
Chao, Y., Shang, J., and Ji, W. (2020). ALKBH5-m6A-FOXM1 Signaling axis Promotes Proliferation and Invasion of Lung Adenocarcinoma Cells under Intermittent Hypoxia. Biochem. Biophysical Res. Commun. 521 (2), 499–506. doi:10.1016/j.bbrc.2019.10.145
Csepany, T., Lin, A., Baldick, C. J., and Beemon, K. (1990). Sequence Specificity of mRNA N6-Adenosine Methyltransferase. J. Biol. Chem. 265, 20117–20122. doi:10.1016/s0021-9258(17)30477-5
Das, S., and Krainer, A. R. (2014). Emerging Functions of SRSF1, Splicing Factor and Oncoprotein, in RNA Metabolism and Cancer. Mol. Cancer Res. 12 (9), 1195–1204. doi:10.1158/1541-7786.mcr-14-0131
Deng, X., Chen, K., Luo, G.-Z., Weng, X., Ji, Q., Zhou, T., et al. (2015). Widespread Occurrence ofN6-Methyladenosine in Bacterial mRNA. Nucleic Acids Res. 43, 6557–6567. doi:10.1093/nar/gkv596
Deng, X., Su, R., Weng, H., Huang, H., Li, Z., and Chen, J. (2018). RNA N6-Methyladenosine Modification in Cancers: Current Status and Perspectives. Cell Res 28, 507–517. doi:10.1038/s41422-018-0034-6
Desrosiers, R. C., Friderici, K. H., and Rottman, F. M. (1975). Characterization of Novikoff Hepatoma mRNA Methylation and Heterogeneity in the Methylated 5' Terminus. Biochemistry 14, 4367–4374. doi:10.1021/bi00691a004
Dominissini, D., Moshitch-Moshkovitz, S., Schwartz, S., Salmon-Divon, M., Ungar, L., Osenberg, S., et al. (2012). Topology of the Human and Mouse m6A RNA Methylomes Revealed by m6A-Seq. Nature 485 (7397), 201–206. doi:10.1038/nature11112
Fustin, J.-M., Doi, M., Yamaguchi, Y., Hida, H., Nishimura, S., Yoshida, M., et al. (2013). RNA-methylation-dependent RNA Processing Controls the Speed of the Circadian Clock. Cell 155, 793–806. doi:10.1016/j.cell.2013.10.026
Ha, S. H., Kwon, K. M., Park, J. Y., Abekura, F., Lee, Y. C., Chung, T. W., et al. (2019). Esculentoside H Inhibits colon Cancer Cell Migration and Growth through Suppression of MMP‐9 Gene Expression via NF‐kB Signaling Pathway. J. Cell Biochem 120 (6), 9810–9819. doi:10.1002/jcb.28261
He, L., Li, H., Wu, A., Peng, Y., Shu, G., and Yin, G. (2019). Functions of N6-Methyladenosine and its Role in Cancer. Mol. Cancer 18 (1), 176. doi:10.1186/s12943-019-1109-9
Hsu, P. J., Shi, H., Zhu, A. C., Lu, Z., Miller, N., Edens, B. M., et al. (2019). The RNA-Binding Protein FMRP Facilitates the Nuclear export of N6-Methyladenosine-Containing mRNAs. J. Biol. Chem. 294 (52), 19889–19895. doi:10.1074/jbc.ac119.010078
Hu, Y., Wang, L., Li, Z., Wan, Z., Shao, M., Wu, S., et al. (2019). Potential Prognostic and Diagnostic Values of CDC6, CDC45, ORC6 and SNHG7 in Colorectal Cancer. Ott 12, 11609–11621. doi:10.2147/ott.s231941
Ivanova, I., Much, C., Di Giacomo, M., Azzi, C., Morgan, M., Moreira, P. N., et al. (2017). The RNA M 6 A Reader YTHDF2 Is Essential for the Post-transcriptional Regulation of the Maternal Transcriptome and Oocyte Competence. Mol. Cell 67, 1059–1067. doi:10.1016/j.molcel.2017.08.003
Jin, X., Zhai, B., Fang, T., Guo, X., and Xu, L. (2016). FXR1 Is Elevated in Colorectal Cancer and Acts as an Oncogene. Tumor Biol. 37 (2), 2683–2690. doi:10.1007/s13277-015-4068-9
Kennedy, T. D., and Lane, B. G. (1979). Wheat Embryo Ribonucleates. XIII. Methyl-Substituted Nucleoside Constituents and 5′-terminal Dinucleotide Sequences in Bulk Poly(A)-rich RNA from Imbibing Wheat Embryos. Can. J. Biochem. 57, 927–931. doi:10.1139/o79-112
Kirchner, S., and Ignatova, Z. (2015). Emerging Roles of tRNA in Adaptive Translation, Signalling Dynamics and Disease. Nat. Rev. Genet. 16, 98–112. doi:10.1038/nrg3861
Laitman, Y., Boker-Keinan, L., Berkenstadt, M., Liphsitz, I., Weissglas-Volkov, D., Ries-Levavi, L., et al. (2016). The Risk for Developing Cancer in Israeli ATM, BLM, and FANCC Heterozygous Mutation Carriers. Cancer Genet. 209 (3), 70–74. doi:10.1016/j.cancergen.2015.12.006
Le Tonquese, O., Kollou, S., Lee, S., Al-Salah, M., Truesdell, S. S., and Vasudevan, S. (2016). Regulation of Monocyte Induced Cell Migration by the RNA Binding Protein, FXR1. Cell Cycle 15, 1874–1882. doi:10.1080/15384101.2016.1189040
Li, H., Guo, S., Zhang, M., Li, L., Wang, F., and Song, B. (2020). Long Non-coding RNA AGAP2-AS1 Accelerates Cell Proliferation, Migration, Invasion and the EMT Process in Colorectal Cancer via Regulating the miR-4,668-3p/SRSF1 axis. J. Gene Med. 22 (11), e3250. doi:10.1002/jgm.3250
Li, H.-B., Tong, J., Zhu, S., Batista, P. J., Duffy, E. E., Zhao, J., et al. (2017). m6A mRNA Methylation Controls T Cell Homeostasis by Targeting the IL-7/STAT5/SOCS Pathways. Nature 548 (7667), 338–342. doi:10.1038/nature23450
Li, S., and Mason, C. E. (2014). The Pivotal Regulatory Landscape of RNA Modifications. Annu. Rev. Genom. Hum. Genet. 15, 127–150. doi:10.1146/annurev-genom-090413-025405
Li, X., Xiong, X., Zhang, M., Wang, K., Chen, Y., Zhou, J., et al. (2017). Base-Resolution Mapping Reveals Distinct m1A Methylome in Nuclear- and Mitochondrial-Encoded Transcripts. Mol. Cell 68, 993–1005. doi:10.1016/j.molcel.2017.10.019
Lin, S., Liu, J., Jiang, W., Wang, P., Sun, C., Wang, X., et al. (2019). METTL3 Promotes the Proliferation and Mobility of Gastric Cancer Cells. Open Med. (Wars) 14 (1), 25–31. doi:10.1515/med-2019-0005
Liu, K., Jin, M., Ye, S., and Yan, S. (2020). CHI3L1 Promotes Proliferation and Improves Sensitivity to Cetuximab in colon Cancer Cells by Down‐regulating P53. J. Clin. Lab. Anal. 34 (1), 23026. doi:10.1002/jcla.23026
Liu, T., Wei, Q., Jin, J., Luo, Q., Liu, Y., Yang, Y., et al. (2020). The m6A Reader YTHDF1 Promotes Ovarian Cancer Progression via Augmenting EIF3C Translation. Nucleic Acids Res. 48 (7), 3816–3831. doi:10.1093/nar/gkaa048
Long, J. C., and Caceres, J. F. (2009). The SR Protein Family of Splicing Factors: Master Regulators of Gene Expression. Biochem. J. 417, 15–27. doi:10.1042/bj20081501
Machnicka, M. A., Milanowska, K., Osman Oglou, O., Purta, E., Kurkowska, M., Olchowik, A., et al. (2013). MODOMICS: a Database of RNA Modification Pathways--2013 Update. Nucleic Acids Res. 41, D262–D267. doi:10.1093/nar/gks1007
Meyer, K. D., and Jaffrey, S. R. (2014). The Dynamic Epitranscriptome: N6-Methyladenosine and Gene Expression Control. Nat. Rev. Mol. Cell Biol. 15 (5), 313–326. doi:10.1038/nrm3785
Meyer, K. D., Patil, D. P., Zhou, J., Zinoviev, A., Skabkin, M. A., Elemento, O., et al. (2015). 5′ UTR m6A Promotes Cap-independent Translation. Cell 163 (4), 999–1010. doi:10.1016/j.cell.2015.10.012
Narayan, P., Ludwiczak, R. L., Goodwin, E. C., and Rottman, F. M. (1994). Context Effects on N6-Adenosine Methylation Sites in Prolactin mRNA. Nucl. Acids Res. 22, 419–426. doi:10.1093/nar/22.3.419
Nucera, C., Lawler, J., and Parangi, S. (2011). BRAFV600E and Microenvironment in Thyroid Cancer: A Functional Link to Drive Cancer Progression. Cancer Res. 71 (7), 2417–2422. doi:10.1158/0008-5472.can-10-3844
Qian, J., Hassanein, M., Hoeksema, M. D., Harris, B. K., Zou, Y., Chen, H., et al. (2015). The RNA Binding Protein FXR1 Is a New Driver in the 3q26-29 Amplicon and Predicts Poor Prognosis in Human Cancers. Proc. Natl. Acad. Sci. USA 112 (11), 3469–3474. doi:10.1073/pnas.1421975112
Roundtree, I. A., and He, C. (2016). Nuclear M6 A Reader YTHDC1 Regulates mRNA Splicing. Trends Genet. 32 (6), 320–321. doi:10.1016/j.tig.2016.03.006
Shen, C., Xuan, B., Yan, T., Ma, Y., Xu, P., Tian, X., et al. (2020). m6A-dependent Glycolysis Enhances Colorectal Cancer Progression. Mol. Cancer 19 (1), 72. doi:10.1186/s12943-020-01190-w
Taketo, K., Konno, M., Asai, A., Koseki, J., Toratani, M., Satoh, T., et al. (2017). The Epitranscriptome m6A Writer METTL3 Promotes Chemo- and Radioresistance in Pancreatic Cancer Cells. Int. J. Oncol. 52 (2), 621–629. doi:10.3892/ijo.2017.4219
Wang, A., Chen, X., Li, D., Yang, L., and Jiang, J. (2021). METTL3-mediated m6A Methylation of ASPM Drives Hepatocellular Carcinoma Cells Growth and Metastasis. J. Clin. Lab. Anal. 35 (9), e23931. doi:10.1002/jcla.23931
Wang, L., Hui, H., Agrawal, K., Kang, Y., Li, N., Tang, R., et al. (2020). m6 A RNA Methyltransferases METTL3/14 Regulate Immune Responses to Anti-PD-1 Therapy. EMBO J. 39 (20), e104514. doi:10.15252/embj.2020104514
Wang, X., Zhu, L., Chen, J., and Wang, Y. (2015). mRNA m6A Methylation Downregulates Adipogenesis in Porcine Adipocytes. Biochem. Biophysical Res. Commun. 459, 201–207. doi:10.1016/j.bbrc.2015.02.048
Wang, Y., Li, Y., Yue, M., Wang, J., Kumar, S., Wechsler-Reya, R. J., et al. (2018). N6-methyladenosine RNA Modification Regulates Embryonic Neural Stem Cell Self-Renewal through Histone Modifications. Nat. Neurosci. 21, 195–206. doi:10.1038/s41593-017-0057-1
Wang, Y., Li, Z., Zhao, X., Zuo, X., and Peng, Z. (2016). miR-10b Promotes Invasion by Targeting HOXD10 in Colorectal Cancer. Oncol. Lett. 12, 488–494. doi:10.3892/ol.2016.4628
Wang, Y., Sun, W., Yang, J., Yang, L., Li, C., Liu, H., et al. (2019). PUM2 Promotes Glioblastoma Cell Proliferation and Migration via Repressing BTG1 Expression. Cell Struct. Funct. 44, 29–39. doi:10.1247/csf.18030
Weng, H., Huang, H., Wu, H., Qin, X., Zhao, B. S., Dong, L., et al. (2018). METTL14 Inhibits Hematopoietic Stem/Progenitor Differentiation and Promotes Leukemogenesis via mRNA m6A Modification. Cell Stem Cell 22 (2), 191–205.e9. doi:10.1016/j.stem.2017.11.016
Wu, R., Li, A., Sun, B., Sun, J.-G., Zhang, J., Zhang, T., et al. (2019). A Novel m6A Reader Prrc2a Controls Oligodendroglial Specification and Myelination. Cell Res 29 (1), 23–41. doi:10.1038/s41422-018-0113-8
Yang, Y., Huang, W., Huang, J.-T., Shen, F., Xiong, J., Yuan, E.-F., et al. (2016). Increased N6-Methyladenosine in Human Sperm RNA as a Risk Factor for Asthenozoospermia. Sci. Rep. 6, 24345. doi:10.1038/srep24345
Yang, Z., Zhao, F., Gu, X., Feng, L., Xu, M., Li, T., et al. (2021). Binding of RNA m6A by IGF2BP3 Triggers Chemoresistance of HCT8 Cells via Upregulation of ABCB1. Am. J. Cancer Res. 11 (4), 1428–1445.
Yang, Z., Wang, T., Wu, D., Min, Z., Tan, J., and Yu, B. (2020). RNA N6-Methyladenosine Reader IGF2BP3 Regulates Cell Cycle and Angiogenesis in colon Cancer. J. Exp. Clin. Cancer Res. 39 (1), 203. doi:10.1186/s13046-020-01714-8
Keywords: colorectal cancer, MeRIP sequencing, m6A, RNA-binding protein, RNA-seq
Citation: Li N, Guo Q, Zhang Q, Chen B-J, Li X-A and Zhou Y (2022) Comprehensive Analysis of Differentially Expressed Profiles of mRNA N6-Methyladenosine in Colorectal Cancer. Front. Cell Dev. Biol. 9:760912. doi: 10.3389/fcell.2021.760912
Received: 19 August 2021; Accepted: 08 December 2021;
Published: 07 January 2022.
Edited by:
Deilson Elgui De Oliveira, São Paulo State University, BrazilReviewed by:
Shu-Ping Wang, Academia Sinica, TaiwanYingying Cao, Shanghai Jiao Tong University, China
Copyright © 2022 Li, Guo, Zhang, Chen, Li and Zhou. This is an open-access article distributed under the terms of the Creative Commons Attribution License (CC BY). The use, distribution or reproduction in other forums is permitted, provided the original author(s) and the copyright owner(s) are credited and that the original publication in this journal is cited, in accordance with accepted academic practice. No use, distribution or reproduction is permitted which does not comply with these terms.
*Correspondence: Yan Zhou, enFsdnp5MzE5QDE2My5jb20=; Xiao-An Li, bGl4aWFvYW4xOTY4OTFAMTYzLmNvbQ==
†These authors have contributed equally to this work