 Riley McMahon
 Tennille Sibbritt1
 Nadar Aryamanesh
 V. Pragathi Masamsetti
 Patrick P. L. Tam
- 1Embryology Research Unit, Children’s Medical Research Institute, Sydney, NSW, Australia
- 2School of Medical Sciences, Faculty of Medicine and Health, The University of Sydney, Darlington, NSW, Australia
The specification of anterior head tissue in the late gastrulation mouse embryo relies on signaling cues from the visceral endoderm and anterior mesendoderm (AME). Genetic loss-of-function studies have pinpointed a critical requirement of LIM homeobox 1 (LHX1) transcription factor in these tissues for the formation of the embryonic head. Transcriptome analysis of embryos with gain-of-function LHX1 activity identified the forkhead box gene, Foxd4, as one downstream target of LHX1 in late-gastrulation E7.75 embryos. Our analysis of single-cell RNA-seq data show Foxd4 is co-expressed with Lhx1 and Foxa2 in the anterior midline tissue of E7.75 mouse embryos, and in the anterior neuroectoderm (ANE) at E8.25 alongside head organizer genes Otx2 and Hesx1. To study the role of Foxd4 during early development we used CRISPR-Cas9 gene editing in mouse embryonic stem cells (mESCs) to generate bi-allelic frameshift mutations in the coding sequence of Foxd4. In an in vitro model of the anterior neural tissues derived from Foxd4-loss of function (LOF) mESCs and extraembryonic endoderm cells, expression of head organizer genes as well as Zic1 and Zic2 was reduced, pointing to a need for FOXD4 in regulating early neuroectoderm development. Mid-gestation mouse chimeras harbouring Foxd4-LOF mESCs displayed craniofacial malformations and neural tube closure defects. Furthermore, our in vitro data showed a loss of FOXD4 impacts the expression of cranial neural crest markers Twist1 and Sox9. Our findings have demonstrated that FOXD4 is essential in the AME and later in the ANE for rostral neural tube closure and neural crest specification during head development.
Introduction
The head is the first major body part to form immediately following gastrulation in vertebrate embryos, arising from the anterior germ layer tissues. In mice, the anterior-posterior axis is polarized by the visceral endoderm cells that are relocated from the distal tip of the epiblast to become the anterior visceral endoderm (AVE) Perea-Gómez et al. (1999). The AVE is involved in inducing anterior neuroectoderm (ANE) identity in the anterior epiblast prior to the anterior mesendoderm (AME) tissue re-enforcing the identity (Thomas and Beddington, 1996; Kimura et al., 2000). The role of the AME tissue at late gastrulation is to antagonize the posteriorizing signaling activity such as WNT and BMP (Arkell and Tam, 2012). Knock-out mouse models for key transcription factors Lhx1 and Foxa2, expressed in both the AVE and AME, result in severe truncation of the embryonic head (Ang and Rossant, 1994; Shawlot and Behringer, 1995). The lack of Lhx1 and Foxa2 activity disrupts the formation of AME and notochord tissues, resulting in the loss of head precursor tissues (Kinder et al., 2003). Earlier work has identified many of the downstream targets of LHX1 in the AME are involved in the suppression of WNT signaling including Gsc, Dkk1 and Cer1 (Fossat et al., 2015; McMahon et al., 2019). To further study the potential target of LHX1 in the E7.75 mouse embryos, a conditional Lhx1-LOF model was used to identify the genes that are down-regulated with Lhx1-LOF (Sibbritt et al., 2018). Genes identified as potential targets of LHX1 include head organizer transcription factors Hesx1 and Otx2, as well as Foxd4. Hesx1 and Otx2 are both expressed in the AME and ANE of early-head-fold stage (E7.75) embryos, Hesx1 expression is then up-regulated in the forebrain, whilst Otx2 is expressed in the midbrain of neurulation stage embryos (Simeone et al., 1993; Hermesz et al., 1996). Knockout of either genes resulted in a truncated head at early-organogenesis stage (Matsuo et al., 1995; Martinez-Barbera et al., 2000).
Foxd4 is a member of the forkhead/winged helix-box transcription factors that is expressed in the notochord, AME and ANE of mouse embryos (Kaestner et al., 1995). Foxd4 has been previously identified as a downstream target of Foxa2 and Otx2. In E7.75 embryos lacking Foxa2 activity, Foxd4 was only expressed in the anterior neurectoderm, and missing in the AME (Tamplin et al., 2008). Conversely, in E7.75 Otx2−/− embryos, the expression of Foxd4 was restricted to the distal AME and absent from the ANE (Rhinn et al., 1998). Foxd4 is highly conserved between vertebrate species including humans, mice, frogs and zebrafish (Odenthal and Nüsslein-Volhard, 1998; Neilson et al., 2012). It contains an N-terminal acidic blob (AB) domain, a 100-amino acid forkhead domain and a C-terminal Engrailed homology (Eh1) domain. In Xenopus the AB domain was shown to activate neural precursor genes Gem and Zic2, whilst the Eh1 domain acted as a transcriptional repressor of genes responsible for neural differentiation (Sox1, Irx) (Neilson et al., 2012). FOXD4 is required in the transition of the mouse embryonic stem cell (mESCs) from pluripotency to neuroectoderm precursor cells (Sherman et al., 2017), though the function of FOXD4 in vivo has not been elucidated.
Our study explored the role FOXD4 plays in the anterior midline tissue and the ANE of the mouse embryo. We showed that Foxd4 is co-expressed with head organizer genes Lhx1 and Foxa2 in the AME and notochord of late-gastrulation embryo, it is also co-expressed with Otx2 and Hesx1 in the ANE of the early somite stage embryo. Using in vitro and in vivo models generated using CRISPR-Cas9 gene edited mESCs, we showed that the loss of FOXD4 function resulted in a reduction in head organizer activity and the disruption of cranial neural crest (CNC) development. Furthermore, Foxd4-LOF chimeric embryos displayed dysmorphology of craniofacial structures and neural tube closure defects.
Materials and Methods
Cell Culture
R1 mESCs were grown on mouse embryonic fibroblasts (MEFs) and maintained in DMEM (Thermo Fisher Scientific), 12.5% heat inactivated fetal calf serum (Fisher Biotec), 10 mM β-mercaptoethanol, 1x non-essential amino acids (Thermo Fisher Scientific), 1X nucleosides (Merck) and 1X leukemia inhibitory factor (LIF). Cells were passaged at 70% confluency, 2–3 days after seeding onto pre-plated MEFs. For chimera generation, mESCs were maintained in 2i/LIF media (Ying et al., 2008) for at least 2 passages before use.
For Lhx1 overexpression in chimeric embryos, two doxycycline inducible A2. loxCre mESC lines were used that either express a FLAG tagged wild-type Lhx1 or tagged truncated Lhx1 coding region lacking the functional LIM domains and homeodomain (Sibbritt et al., 2018).
Extraembryonic endoderm (XEN) cells were generated from blastocyst stage embryos as previously described (Niakan et al., 2013). ARC/s and DsRed.T3 mice (from the Australian Animal Resources Centre) were maintained as homozygous breeding pairs. ARC/s females were crossed with DsRed.T3 males, blastocyst stage embryos were collected and plated onto MEFs in TS cell medium; RPMI 1640 (Gibco), 20% fetal calf serum (Fisher Biotec), 2 mM l-glutamine (Gibco), β-mercaptoethanol, 1 mM sodium pyruvate (Gibco), 1% penicillin-streptomycin plus 24 ng/ml FGF4 (Sigma-Aldrich, cat. no. F8424) and 1 μg/ml heparin (Sigma-Aldrich, cat. no. H3393) for 20 days. The dsRed expressing XEN cells were then expanded on gelatin and maintained without FGF4 and heparin.
CRISPR Editing
Foxd4 edited mESCs were generated as described previously (Sibbritt et al., 2019). Guide RNAs targeting the N-terminal region of Foxd4 were designed using (Benchling [Biology Software], 2021) (gRNA 1: 5′-CAGTCCTCTAAGTTCCGACC, gRNA 2: 5′-GGAGCGATCCCTGCAGAGGC) and ligated into pSpCas9(BB)-2A-Puro (PX459) V2.0 (a gift from Feng Zhang (Ran et al., 2013)). To induce editing, 5 × 10⁶ R1 mESCs were electroporated with 2.5 µg of plasmid DNA and plated onto mouse embryonic fibroblasts (MEFs) for 24 h before puromycin selection for 48 h. Individual clones were expanded on MEF coated plates and genotyped for correct edits in the Foxd4 coding region.
The genotyping PCR products were gel purified and sub-cloned into the pGEM-T Easy Vector System (Promega) as per manufacturer’s protocol. At least 10 plasmids from each cell line were Sanger sequenced to identify mutations in each allele.
Neuruloid Differentiation
Assemblies of mESCs and XEN cells (neuruloids) were generated as described previously (Bérenger-Currias et al., 2020) with some modifications. Approximately 2.5 × 10⁶ mESCs and 0.5 × 10⁶ XEN cells were mixed and placed in each well of a 24-well plate on 400 µm Aggrewells (Stem Cell Technologies) with 2 ml of N2B27 media, and then spun at 400 g for 3 minutes. The cells were cultured in Aggrewells for 48 h, and next transferred to low adhesion plates on a shaking platform with a 24-h pulse of 3 µm CHIR99021. CHIR99021 was then removed, and neuruloids were collected after a further 24 h of culture for RNA preparation and whole mount immunofluorescence microscopy.
Neural Precursor Differentiation
Neural precursor differentiation of mESCs was initiated using embryoid bodies (EBs) as previously described (Varshney et al., 2017; Fan et al., 2021). After 4 days of differentiation, EBs were collected and plated on laminin (5 μg/ml) coated tissue culture plates in N2B27 media for a further 4 days of culture, then collected for RNA preparation or fixed in 4% paraformaldehyde for immunofluorescence imaging.
Chimera Production
Chimeras were generated as previously described (Sibbritt et al., 2019; Fan et al., 2021). Briefly, ARC/s females were crossed with Ds. RedT3 stud males, at E2.5 the uteri and oviducts were flushed to collect 8-cell stage embryo collection. 13–15 mESCs were injected per 8-cell DsRed.T3 embryo, which were incubated overnight. 10 to 12 injected blastocyst-stage embryos were transferred to each E2.5 pseudo-pregnant ARC/s female recipient. E8.0—E11.5 embryos were collected 5–8 days after embryo transfer and imaged immediately on the Zeiss SteREO Lumar. V12 stereomicroscope to determine relative contribution of dsRed host cells versus injected mESCs. Relative intensity of dsRed.T3 fluorescence of each chimeric embryo was measured using ImageJ. The mean fluorescence of the dsRed.T3 channel was collated for each embryo and the background signal was subtracted. The mean fluorescence value was then displayed relative to embryo without ESC contribution at each stage. Animal experimentations were performed in compliance with animal ethics and welfare guidelines stipulated by the Children’s Medical Research Institute/Children’s Hospital at Westmead Animal Ethics Committee under protocol number C346.
Immunofluorescence Imaging
Whole-mount immunostaining of chimeric embryos was performed as described in Fan et al. (2021), while immunostaining of neuruloids was performed as described in Dekkers et al. (2019). A list of antibodies and concentrations used are outlined in Supplementary Table S2. Embryos and neuruloids were imaged using Zeiss Cell Observer Spinning Disk Confocal Microscope. Three-dimensional images of the samples were produced using optical slices and tiling. Zeiss Zen microscopy analysis software was used to collapse the confocal stacks and stitch together tiles to generate maximum intensity projection (MIP) images.
Immunofluorescence imaging of neural precursor cells on glass cover slips was performed as described in Sibbritt et al. (2018) and imaged using the Zeiss Axio Imager M1 microscope.
RT-qPCR
RNA was extracted using the RNeasy Mini Kit (Qiagen) for cells and Rneasy Micro Kit (Qiagen) for embryos, according to manufacturer’s protocol. cDNA was synthesised from 1 µg of RNA (or 0.3 µg for E8.0 embryos) using the SuperScript III First-Stand Synthesis System (Invitrogen, Cat. No. 18080-051) as per the manufacturer’s protocol, using random hexamers to prime the single-stranded RNA. Unless otherwise stated, quantitative PCR (qPCR) primers were designed using Primer-BLAST to span exon junctions of the functional mRNA transcript (all qPCR primers are listed in Supplementary Table S1). PowerUp SYBR Green PCR Master Mix (Thermo Fisher Scientific) and 0.4 µM of both forward and reverse primers were made to a total volume of 10uL PCR reaction. Samples were loaded into a 384 well plate (Thermo Fisher Scientific) and run on the QuantStudio 6 Flex Real-Time PCR System (Applied Biosystems). All reactions were performed in technical triplicates, relative gene expression was calculated using the comparative CT method, normalised to the housekeeping genes, Actb or Ubc.
Statistical significance was determined using an unpaired, two-tailed Student’s t-test, assuming unequal variances for single comparisons. p values were obtained relative to wild-type cells/chimeras if not indicated otherwise. Differences were considered significant if the *p < 0.05, **p < 0.01, ***p < 0.001, ****p < 0.0001.
Bioinformatics Analysis of Single-Cell RNA-Seq Data
The processed read counts and metadata from Pijuan-Sala et al. (2019) were downloaded from https://github.com/MarioniLab/EmbryoTimecourse 2018. Reads were converted to a Seurat object and quality control of scRNA-seq data was performed with the Seurat package version 4.0.0 (Stuart et al., 2019) in R version 4.0.3. The data consisted of 29,452 genes with 139,331 single cells. The scater/Bioconductor package (McCarthy et al., 2017) was used to create QC metrics for the genes of interest. The dittoSeq package/Bioconductor (Bunis et al., 2020) was used for visualization of reduced dimension plots. Hierarchical cluster analysis was performed on a subset of cells expressing Foxd4 for each stage using hclust (Müllner, 2013) with parameters “complete” method and “Euclidean” distance.
Results
Lhx1, Foxa2 and Otx2 Are Co-expressed With Foxd4 in Early Mouse Embryo
A previous study has shown that conditional ablation of Lhx1 in the epiblast reduced the expression of Foxd4 in the anterior tissues of embryos (Sibbritt et al., 2018). Based on this finding, we hypothesise that the LHX1/FOXA2/OTX2 transcription factor complex drives the expression of Foxd4 in the AME at E7.75 and in the ANE at E8.25. We validated our hypothesis that LHX1 can affect transcription of Foxd4 using an Lhx1-overexpressing embryo model. Doxycycline inducible FLAG-Lhx1 and FLAG-Lhx1-Δ (lacking functional domains) mESC lines were used to generate mouse chimeras (Figure 1A). Chimeras with high mESC contribution were collected at E7.75 following 24h of doxycycline treatment. Expression of wild-type Lhx1 mRNA was 60-fold higher in FLAG-Lhx1 vs FLAG-Lhx1-Δ (Figure 1B). A significant increase in Foxd4 transcripts (Figure 1C) indicates that enhanced LHX1 activity affected the expression of Foxd4.
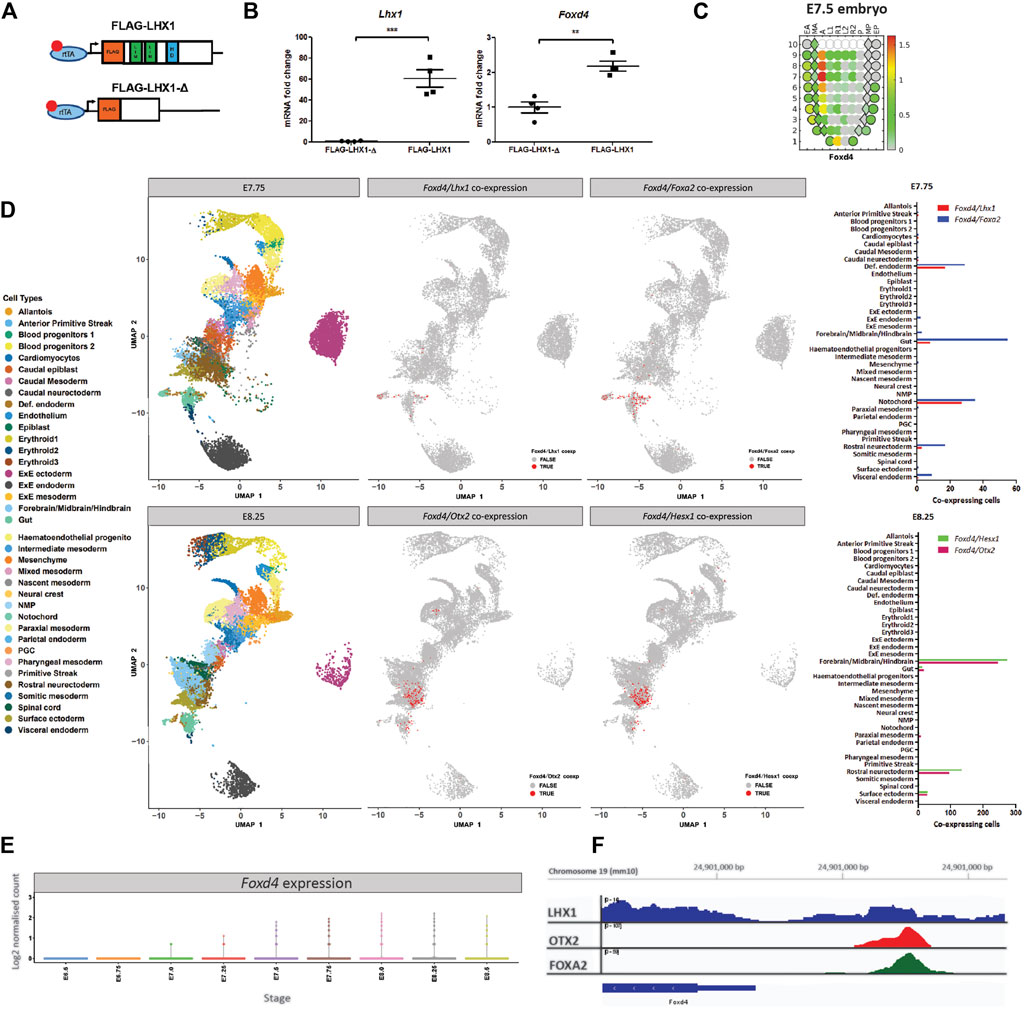
FIGURE 1. Foxd4 is upregulated in an Lhx1-overexpressing embryo system and shows co-expression with Lhx1, Foxa2 and Otx2 in the late-to post-gastrulation mouse embryo. (A) Schematic representation of the Hprt locus of the A2lox.cre mouse ESCs (Iacovino et al., 2011) containing a tetracycline response element (TRE) followed by either FLAG-Lhx1 wild-type coding sequence or FLAG-Lhx1-Δ mutant sequence lacking LIM domains and homeodomain. (B) RT-qPCR analysis of the expression of wild-type Lhx1 and Foxd4 (relative to Actb) in FLAG-Lhx1-Δ and FLAG-Lhx1 E7.75 chimeras, respectively, with 24h of doxycycline treatment. Graphs are presented as mean ± SEM of four independent treatments (**p < 0.01, ***p < 0.001 by Student’s t test). (C) Corn plot shows the expression pattern of Foxd4 in wild-type E7.5 embryos (Peng et al., 2019). High expression is seen in the anterior midline tissue and neurectoderm. The relative expression level is indicated by the color bar and the maximum relative expression in fragments per kilobase of transcript per million mapped reads (FPKM) is shown. (D) Uniform Manifold Approximation and Projection for Dimension Reduction (UMAP) for individual cells at E7.75 and at E8.25 (data from Pijuan-Sala et al., 2019). Colours represent the relevant cell types expressing the genes of interest. Co-expression of Foxd4/Lhx1 and Foxd4/Foxa2 are found in the notochord and definitive endoderm cell types in E7.75 embryo. Co-expression of Foxd4 and Otx2 as well as Foxd4 and Hesx1 in E8.25 embryos in the forebrain/midbrain/hindbrain and rostral neurectoderm cell types. (E) Expression of Foxd4 in whole mouse embryos at E6.5 to E8.5. Log2 normalised count is presented. (F) University of California at Santa Cruz (UCSC) track view of ChIP-seq wiggle plot overlays showing enrichment of LHX1 (blue), OTX2 (red) and FOXA2 (green) at an upstream regulatory region of Foxd4 on chromosome 19: 24,902,170–24,902,900 (mm10 genome).
Using the publicly available eGastrulation spatial transcriptome dataset (Peng et al., 2019), we are able to investigate the location and relative level of Foxd4 expression in the late gastrulation stage mouse embryo. The highest level of Foxd4 expression can be seen in the anterior midline cell population and the neurectoderm (Figure 1C), consistent with previous in situ hybridization data (Tamplin et al., 2008). The spatial expression of Foxd4 in late gastrulation mouse embryos overlaps with the known locations of genes that have been shown to be critical for embryonic head development such as Lhx1, Foxa2, Otx2 and Hesx1.
To investigate the expression of these transcription factors at higher resolution, we used previously published single-cell RNA-seq data of wild-type mouse embryos (Pijuan-Sala et al., 2019). At E7.75 Foxd4 is highly expressed in the notochord cell lineage (Supplementary Figure 1A), which gives rise to the midline mesendoderm tissues (Yamanaka et al., 2007). At this stage Lhx1 and Foxa2 share similar expression profiles (Supplementary Figure 1A) and our analysis identified co-expression of Foxd4 with either Lhx1 or Foxa2 expressing cells in the notochord and definitive endoderm populations (Figure 1D). At E8.25 Foxd4 is highly expressed in rostral neurectoderm and forebrain/midbrain/hindbrain cell populations. Similarly, the head organizer genes Otx2 and Hesx1 are expressed in these cell populations (Supplementary Figure 1A). Our analysis highlighted several groups of cells that share co-expression of Foxd4, Otx2 and Hesx1 at E8.25 (Figure 1D). Foxd4 expression in the whole embryo is increasing at E7.5 and peaks at E8.0 (Figure 1E).
To elucidate if these transcription factors bind to the regulatory region of the Foxd4 locus in mouse cells we retrieved the binding data from publicly available ChIP-seq dataset. LHX1 ChIP-seq data in differentiated P19 carcinoma cells shows a low confidence peak ∼1k bp upstream of the Foxd4 transcriptional start site (TSS) (Figure 1F) (Costello et al., 2015). ChIP-seq data of OTX2 in epiblast like-cells (Buecker et al., 2014) and FOXA2 in mesendoderm cells (Cernilogar et al., 2019) show high confidence peaks in the same locus on chromosome 19: 24,902,170–24,902,900 (mm10 genome). These data suggest the binding of a LHX1/OTX2/FOXA2 transcription factor complex upstream of the Foxd4 TSS.
CRISPR-Cas9 Editing of Foxd4 Coding Region Disrupts the Transcriptional Program of Anterior Epiblast in vitro
In Foxd4/5, the Foxd4 paralog in Xenopus, the AB domain has been shown to be a transcriptional activator of neural transcription factors (Neilson et al., 2012). We targeted this AB domain region in mESCs with CRISPR-Cas9 mediated genome editing (Figure 2A). Following screening, we chose clones with a bi-allelic frameshift mutation in the N-terminal region of Foxd4, at the beginning of the AB domain (Foxd4 Δ7/Δ8, Foxd4Δ2/Δ2 (Figure 2A, Supplementary Figure 2A). We also used a different gRNA targeting the region between the AB and forkhead domain of Foxd4, to exclude off-target effects of CRISPR-Cas9 genome editing. Using the second gRNA we obtained a clone with a 2 bp deletion and a 1 bp insertion in respective alleles (Foxd4Δ2/Δ1, Supplementary Figure 2D). Despite trying numerous antibodies from different manufacturers, we were unable to get a reliable signal to assay the expression of the predicted truncated FOXD4 protein in our knockout mESC line (data not shown).
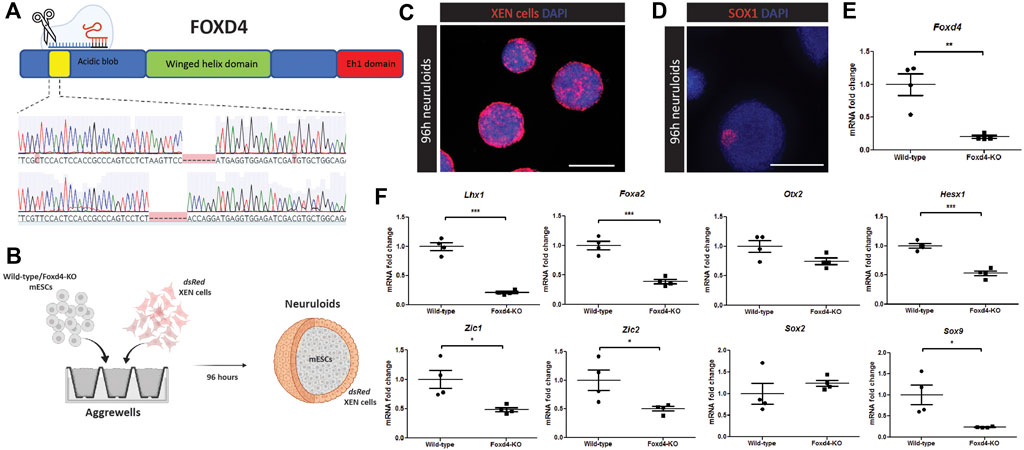
FIGURE 2. CRISPR-Cas9 editing of Foxd4 coding region in mESCs results in reduced expression of anterior head and neural markers in vitro. (A) Schematic representation of CRISPR-Cas9 editing on Foxd4. The protein domains of FOXD4 encompasses the N-terminal DNA binding acidic blob domain, the winged helix domain and the C-terminal Eh1 domain. CRISPR-Cas9 gRNAs targeted the DNA sequence corresponding to the N-terminal acidic blob domain of Foxd4, resulting in two alleles with 7bp and 8bp deletions, respectively. (B) Schematic representation of an in vitro model of anterior late gastrulation mouse embryos (Bérenger-Currias et al., 2020). Wild-type or Foxd4Δ7/Δ8 mESCs and dsRed XEN cells are co-cultured in aggrewells in N2B27 media. After 48 h, 3D organoids were moved to shaking culture with 3 μM of CHIR-99021 added for 24 h. The organoids were then collected after 96h of differentiation. (C) Neuruloids containing XEN cells expressing dsRed colonizing the outside of the neuruloids, and ESCs colonizing the core. Single z-stack. N = 4. Scale bar = 300 μm. (D) 96 h differentiated wild-type neuruloids show expression of early neural marker SOX1. Maximum intensity z projection. N = 4 replicate experiments. Scale bar = 300 μm. (E) RT-qPCR analysis of the expression of Foxd4 (relative to Ubc) in Wild-type and Foxd4Δ7/Δ8 neuruloids. (F) RNA expression of anterior tissue markers Foxa2, Lhx1, Otx2 and Hesx1, neural precursor markers Zic1, Zic2, Sox2 and neural crest marker Sox9 (relative to Ubc). Data are presented as mean ± SEM of four independent experiments (*p < 0.05, **p < 0.01, ***p < 0.001 by Student’s t test).
To study the downstream genetic targets of FOXD4 during development, we used an in vitro model of the anterior epiblast (neuruloid) generated through the co-culture of mESCs and extraembryonic endoderm (XEN) (Figure 2B) (Bérenger-Currias et al., 2020). The XEN cells express genes that are highly expressed in the extraembryonic endoderm including Foxa2, Sox17 and Gata4, but do not express pluripotency markers, Oct4 and Sox2 (Supplementary Figure 3A, B). The dsRed expressing XEN cells colonized the exterior portion of the neuruloid (Figure 2C, Supplementary Figure 3C), where they may act in a similar way to the anterior visceral endoderm population in the embryo. In contrast to embryoid bodies differentiated for the same period, we showed significantly higher expression of anterior markers Otx2, Lhx1, Hesx1 as well as Foxd4 (Supplementary Figure 3D). Wild-type neuruloids expressed early neurectoderm marker SOX1 in distinct regions of the neuruloids (Figure 2D, Supplementary Figure 3E).
Compared with neuruloids generated using wild-type mESCs, Foxd4Δ7/Δ8 neuruloids had significantly reduced expression of Foxd4 transcripts (Figure 2E). Lhx1, Hesx1 and Foxa2 transcripts were also significantly reduced (Figure 2F). This result indicates that FOXD4 is crucial for the appropriate specification of the precursor tissues to the embryonic head and notochord. Comparable to results seen in Xenopus (Neilson et al., 2012), knock-out of Foxd4 caused the reduction in expression of neural ectodermal genes Zic1 and Zic2 (Figure 2F). Expression of the neural progenitor gene Sox2 was not changed in Foxd4Δ7/Δ8 neuruloids, whereas the transcripts of early neural crest cell (NCC) marker Sox9 was significantly reduced, indicating a role for Foxd4 in the establishment of the NCC population. Our analysis of scRNA-seq data from Pijuan-Sala et al. (2019) showed Foxd4 is co-expressed with Zic2 and Sox9 but not Zic1 at E7.75 and E8.25 in the ANE tissues (Supplementary Figure 1B).
Mouse Chimeric Embryos Derived From Foxd4-LOF mESCs Display Neural Tube and Craniofacial Defects
To analyze the function of FOXD4 during mouse development, wild-type or Foxd4-LOF mESCs were injected into 8-cell host embryos ubiquitously expressing dsRed (Figure 3A). Host embryos were injected with either wild-type or Foxd4Δ7/Δ8 mESCs (15 embryos each), chimeric embryos were collected at E8.0 and the relative contribution of mESCs was quantified using fluorescence microscopy. Three chimeras of each genotype with high (>60%) contribution were kept for RNA assay (Supplementary Figure 4A). E8.0 chimeras that showed high contribution of mESCs in fluorescence imaging had significantly lower dsRed expression compared to un-injected embryos (Figure 3B). Chimeras with high contribution of Foxd4 Δ7/Δ8 mESCs showed significantly reduced Foxd4 expression compared to wild-type mESC injected chimeras (Figure 3B).
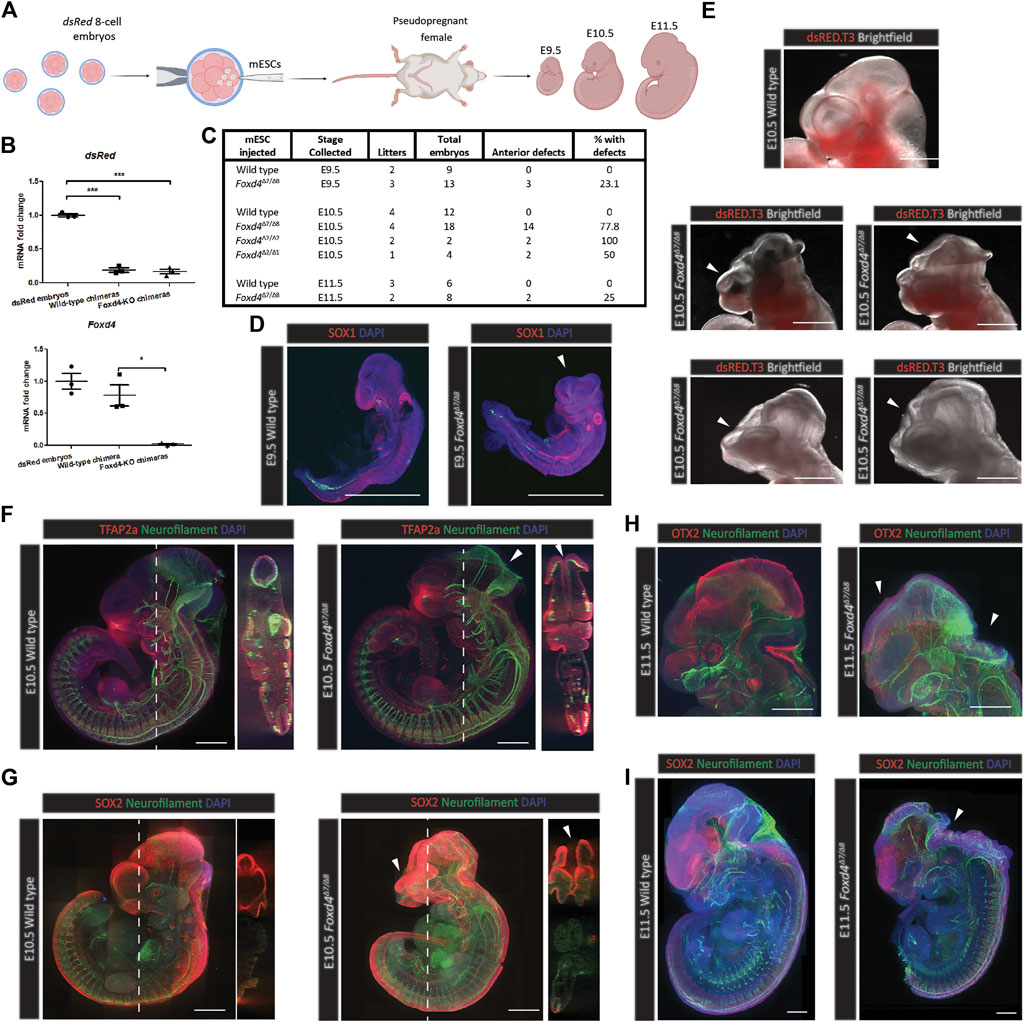
FIGURE 3. Foxd4-LOF mESC derived chimeras display neural tube closure defect and craniofacial dysmorphology. (A) Schematic representation of the generation of chimera mouse embryos. Chimeras were generated using wild-type or Foxd4Δ7/Δ8 mESCs injected into 8-cell mouse embryo expressing dsRed. Following in vitro culture, the blastocyst stage embryos were transferred to the uteri of pseudo-pregnant female mice and were collected at various post-implantation time points up to E11.5. (B) Wildtype and Foxd4Δ7/Δ8 mESC derived chimeras show similar contribution of mESCs through RT-qPCR analysis of dsRed mRNA compared to un-injected dsRed embryos (relative to Ubc) at E8.0. Expression of Foxd4 (relative to Ubc) shows a significant reduction in Foxd4Δ7/Δ8 chimeras vs wild-type chimeras. Data are presented as mean ± SEM of three independent embryos (***p < 0.001, *p < 0 0.05 by Student’s t test). (C) Wild-type and Foxd4-LOF chimeras collected at E9.5, E10.5 and E11.5 with percentage of specimens showing anterior defects. (D) Foxd4Δ7/Δ8 E9.5 chimera displays truncated head, stained for SOX1 (red) and DAPI (blue), Maximum intensity z projection (Full panels for immunofluorescence imaging of chimeras are in Supplementary Figure 3). (E) The range of head phenotypes in Foxd4Δ7/Δ8 E10.5 chimeras showing neural tube closure defects and craniofacial deformities. Brightfield imaging and dsRed merged image. (F) Neural tube closure defect of a representative Foxd4Δ7/Δ8 derived E10.5 chimera, stained for neurofilament (green), TFAP2a (red) and DAPI (blue). Left: Maximum intensity z projection, right: coronal plane through z stacks. (G) Craniofacial defect of a representative Foxd4Δ7/Δ8 E10.5 chimera stained for neurofilament (green), SOX2 (red) and DAPI (blue). Left: Maximum intensity z projection, right: coronal plane through z stacks. (H) OTX2 expression in the mid-brain and eye is reduced in representative Foxd4Δ7/Δ8 E11.5 chimera embryo (red), Neurofilament staining (green) reveals exencephaly in mutant chimera. Maximum intensity z projection. (I) Open neural tube in a representative Foxd4Δ7/Δ8 E11.5 chimera embryo, stained for neurofilament (green), SOX2 (red) and DAPI (blue). Maximum intensity z projection. All scale bars = 500 µm.
Foxd4-LOF chimeric embryos had visible neural tube closure defects and truncated forebrain tissue at E9.5, E10.5 and E11.5, whilst none of the wild-type mESC derived chimeras that were collected displayed an abnormal head phenotype (Figure 3C). At E9.5, 3/13 Foxd4Δ7/Δ8 chimeras displayed anterior defects, compared to 0/9 for wild-type chimeras (Supplementary Figures 5A,B and 6A,B). No anterior defects were evident in E10.5 wild-type chimeras (0/12) (Supplementary Figure 7A,B). 14/18 Foxd4Δ7/Δ8, 2/2 Foxd4Δ2/Δ2, and 2/4 Foxd4Δ2/Δ1 chimeras collected at E10.5 displayed anterior developmental defects (Supplementary Figures 2C,F and 8A,B). Finally, 0/6 wild-type E11.5 chimeras and 2/8 E11.5 Foxd4Δ7/Δ8 chimeras showed anterior defects (Supplementary Figure 9A,B).
Foxd4Δ7/Δ8 chimeras collected at E9.5 with high contribution had comparable expression of neuroectoderm marker SOX1, though displayed severe truncation of the head tissue compared to wild-type control (Figure 3D, Supplementary Figure 4B). At E10.5 a range of head defect phenotypes were evident in Foxd4Δ7/Δ8, Foxd4Δ2/Δ2 and Foxd4Δ2/Δ1 chimeras (Figure 3E, Supplementary Figure 2C,F). NEFM (neurofilament) staining shows exencephaly in the midbrain and hindbrain, though there were no defects in the caudal neural tube in any Foxd4-LOF chimeras (Figure 3F). Craniofacial defects were also common among Foxd4-LOF chimeras including truncated facial tissue and abnormal forebrain patterning (Figures 3E,G, Supplementary Figure 4D).
In Foxd4Δ7/Δ8 chimeras collected at E11.5, exencephaly was evident in the rostral neural tube (Figures 3H,I, Supplementary Figures 4E,F). The protein OTX2 that is normally expressed in the midbrain and eyes of E11.5 wild-type embryo, was not detected in Foxd4Δ7/Δ8 chimeras (Figure 3H). All the defects seen were in anterior head and neural tube tissues, indicating the specific role of FOXD4 in the anterior neural and midline tissue in late gastrulation/early organogenesis.
FOXD4 Is Required for Anterior Neurectoderm and Neural Crest Specification
We adapted a protocol from Varshney et al. (2017) for the differentiation of mESCs to neural precursor cells (NPC) (Figure 4A), revealed by high levels of Foxd4 expression in wild-type NPCs at Day 8 of culture (Figure 4B). NCC markers Twist1 and Sox9 were also highly expressed in the NPCs compared to undifferentiated mESCs (Figure 4B). Both wild-type and Foxd4Δ7/Δ8 mESCs expressed a high level of neural ectoderm marker SOX1 and neuron specific Class III β-tubulin (TUBB3) (Figure 4C). Foxd4Δ7/Δ8 day 8 NPCs had significantly reduced Foxd4 mRNA expression compared to the wild-type (Figure 4D). mRNA expression of neurectoderm markers Pax4 and Nestin (Nes) were not significantly different in Foxd4Δ7/Δ8 NPCs (Figure 4D). In contrast, the head organizer genes Otx2, Lhx1 and Foxa2 were significantly reduced (Figures 4E,F). The loss of Otx2 expression is consistent with the reduction in OTX2 expression seen in the in vivo model (Figure 3H). NCC markers Twist1 and Sox9 were also downregulated in Foxd4Δ7/Δ8 NPCs (Figure 4F) compared to wild-type, though our scRNA-seq analysis did not show significant co-expression of Foxd4 and Twist1 at E7.75 or E8.25 (Figure 1B).
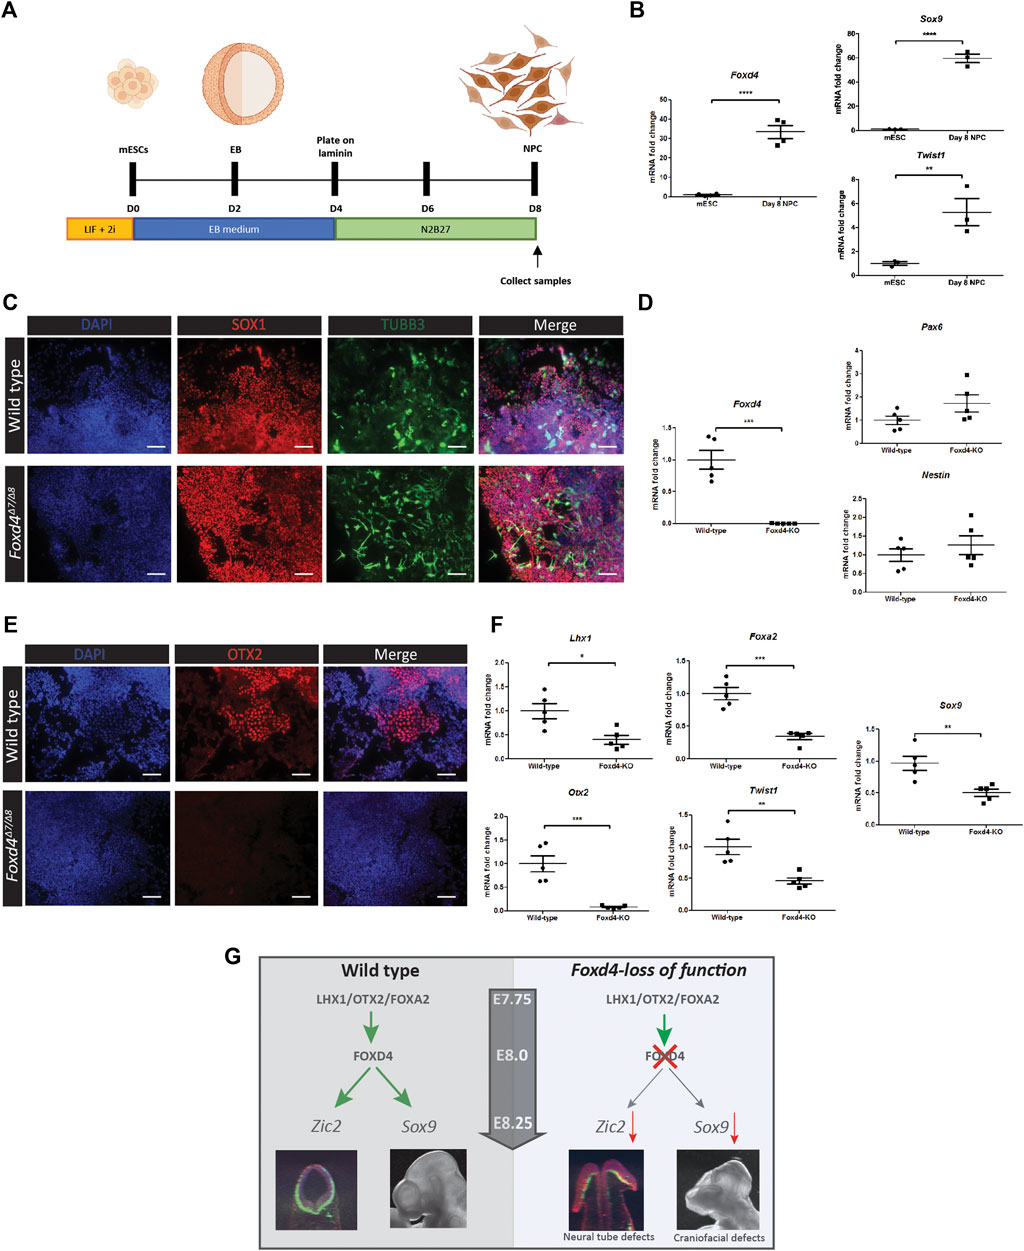
FIGURE 4. Genes associated with anterior tissues and neural crest cells are downregulated in Foxd4-LOF mESCs during neural differentiation. (A) Schematics of neural precursor cell differentiation protocol. mESCs were cultured in 2i/Lif media without feeder cells. mESCs are cultured in aggrewells in EB media for 48 h before being placed on shaker plates for a further 48 h. The EBs were then moved onto laminin coated dishes and cultured in N2B27 media for 4 days (B) RT-qPCR analysis shows 30-fold increase in expression of Foxd4 (relative to Ubc) neural precursor cells (NPCs) compared to mESCs. Sox9 and Twist1 are also highly expressed compared to undifferentiated mESCs (N = . (C) Wildtype and Foxd4Δ7/Δ8 NPCs both show strong expression of SOX1 (red) and Tubulin-βIII (green) after 8 days of differentiation. N = 4. Scale bar = 100 µm. (D) RT-qPCR analysis shows significantly reduced Foxd4 expression, though comparable level of expression of Pax6 and Nes (relative to Ubc) in Foxd4Δ7/Δ8 NPCs compared to wild-type NPCs. (E) Foxd4Δ7/Δ8 NPCs do not express OTX2 (red) after 8 days of differentiation. N = 4. Scale bar = 100 µm. (F) RT-qPCR analysis shows reduced expression of Foxd4, Lhx1, Otx2, Foxa2, Twist1 and Sox9 (relative to Ubc) in wild-type vs Foxd4Δ7/Δ8 Day 8 NPCs. Data are presented as mean ± SEM of four independent treatments (*p < 0 0.05, **p < 0 0.01, ***p < 0 0.001 by Student’s t test). (G) Schematic: In the anterior tissue of the E7.75 mouse embryo, Foxd4 expression is controlled by the LHX1/OTX2/FOXA2 TF complex. FOXD4 is then required for regulating the expression of Zic2 in the ANE for neurulation. The loss of FOXD4 function in the neuroectoderm leads deficiency of cranial neural crest cells, revealed by the reduced expression of Sox9 and craniofacial defects in Foxd4-LOF chimeric embryos.
Discussion
Our study has revealed a novel role of FOXD4 in the development of the embryonic head and neural tube in mouse embryos. Single cell transcriptomic analysis confirms published spatial RNA expression pattern in E7.5-E7.75 embryos showing Foxd4 expression in the anterior midline and anterior neurectoderm tissues (Kaestner et al., 1995). The anterior midline cell population at E7.75 marked by Lhx1 and Foxa2 are the precursors of the anterior mesendoderm underlying neuroectoderm of the head folds (Kinder et al., 2003). Co-expression of Foxd4 with Lhx1 and Foxa2 in the anterior midline (notochord) and definitive endoderm populations at E7.75 imply a shared mechanism of these transcription factors in these tissues. Reduced Foxa2 or Lhx1 expression in the anterior embryo has been shown to ablate Foxd4 expression in the same region (Tamplin et al., 2008; Sibbritt et al., 2018). Furthermore, ChIP-seq data show LHX1 and FOXA2 binding sites upstream of Foxd4. Our in vitro results show that a loss of FOXD4 activity also reduces the expression of Lhx1 and Foxa2. This shared relationship may indicate that all three transcription factors act together to define the anterior midline tissue of the late gastrulation stage mouse embryo.
For neural induction of the anterior epiblast, firstly the anterior visceral endoderm (AVE) establishes the adjacent neurectoderm, then the AME acts to maintain the neurogenic differentiation (reviewed in Martinez-Barbera and Beddington, 2003). Foxd4 is not expressed highly in the AVE; its expression peaks at E8.0-E8.25 in anterior neurectoderm where it is co-expressed with two other anterior neurectoderm marker genes Otx2 and Hesx1 (Figure 1D). Hesx1 and Otx2 are expressed in the forebrain and midbrain of the developing mouse embryos and mutations in each of these transcription factors result in truncated or deficient head tissues (Matsuo et al., 1995; Martinez-Barbera et al., 2000). In Foxd4Δ7/Δ8 neuruloids, Hesx1 expression is significantly reduced and similarly there is no OTX2 protein expression in Foxd4Δ7/Δ8 neural precursor cells. These findings indicate that FOXD4 is essential in the anterior neurectoderm tissues of the late gastrula stage mouse embryo. An evident phenotype of Foxd4-LOF mESC derived chimeras is the reduced head size and forebrain defect. This phenotype coupled with reduced expression of OTX2 in E11.5 Foxd4Δ7/Δ8 chimeras show that FOXD4 is required for the development of anterior neurectoderm in mouse embryos.
In Xenopus embryos, the homolog of Foxd4 (Foxd4/5) is crucial for the induction and maintenance of neurectoderm cells at gastrula and neural plate stage of development (Yan et al., 2009; Neilson et al., 2012). The AB domain in the N-terminal FOXD4/5 protein was shown to upregulate the immature neural precursor marker Zic2, and the mouse, FOXD4 has homologous activity when expressed in Xenopus embryos (Sherman et al., 2017). In an in vitro Foxd4-LOF neuruloid model, the expression of Zic2 is also significantly down-regulated, consistent with literature showing that a loss Zic2 function in the embryo leads to neural tube defects (Warr et al., 2008). Despite a reduction in Zic2 expression, closure defects were only found in the rostral neural tube Foxd4-LOF mESC derived chimeras. The expression of Zic2 in the caudal neural tube may therefore be influenced by other factors such as PAX3 or CDX2 (Zhao et al., 2014). It is likely that a primary function of FOXD4 is to regulate Zic2 activity in the anterior neurectoderm to enable proper neural tube closure (Figure 4G). Contrary to a previous study in mESCs (Sherman et al., 2017), we found FOXD4 is not needed to generate neural precursor cells in vitro. Foxd4Δ7/Δ8 neural precursor cells (NPCs) express neural precursor markers SOX1, TUBB3, Pax6 and Nes at levels equivalent to wild-type NPCs. Likewise, in Foxd4-LOF chimeras, neurofilament is expressed at levels similar to wild type, although the pattern of innervation is disrupted.
A closely related protein to FOXD4; FOXD3, also contains acidic, forkhead and Eh1 domains (Wijchers et al., 2006) and has been demonstrated to be essential for NCC specification and maintenance of neural crest progenitor cells (Dottori et al., 2001; Teng et al., 2008). Our in vitro models also indicate that FOXD4 is driving early NCC specification. The NCCs are a migratory population of cells that arise firstly at border of neural plate and non-neural ectoderm cells (Wang et al., 2011). After gastrulation, cranial neural crest (CNC) cells delaminate from the dorsal neural tube and begin to express CNC specific markers including Sox9 and Twist1 (Mori-Akiyama et al., 2003; Soldatov et al., 2019). In the Foxd4Δ7/Δ8 neuruloids and NPCs, Sox9 transcripts are significantly downregulated compared to wild-type controls. Similarly, RNA expression of neural crest-related gene, Twist1, was reduced in Foxd4Δ7/Δ8 NPCs. Our scRNA-seq analysis also shows co-expression of Foxd4 and Sox9 in CNC precursor populations of the rostral neurectoderm. We therefore propose that FOXD4 is regulating the expression of Sox9 in the CNC progenitor population and has a shared function alongside FOXD3 to specify CNC cells. A loss of FOXD4 activity may be affecting the allocation of the CNC precursor population and further impacts on the pattern of cranial nerve innervation of the head tissues (Figure 4G). These data indicate that FOXD4 is not required for the specification of neuronal cell lineages but is required for the differentiation of the head tissues and specification of CNC tissue.
Conclusion
Our study has revealed that FOXD4 acts in conjunction with LHX1, FOXA2, OTX2, and HESX1 to regulate the activity of key genes associated with neural tube morphogenesis and CNC specification in the anterior midline tissue and the anterior neurectoderm tissues. Further study of the transcriptional targets of FOXD4 in the neuroectoderm and neural crest cells will shed more light on the pleiotropic role of this transcription factor in craniofacial development.
Data Availability Statement
All the code for data analysis is publicly available at https://github.com/naryamanesh/Pijuan_Foxd4. All the mESC and XEN cell lines generated for this article are freely available to the scientific community upon request.
Ethics Statement
The animal study was reviewed and approved by the Children’s Medical Research Institute / Children’s Hospital at Westmead Animal Ethics Committee.
Author Contributions
RM designed experiments, carried out most of the experiments presented in the manuscript, analysed the data, and wrote the manuscript. TS conceived and designed experiments, generated the CRISPR-edited cell line and some of the chimera embryos. NA developed the code to analyse the single-cell bioinformatics data and generated figures. VM designed experiments, helped with the immunofluorescence imaging, supervised the research, and edited the manuscript. PT conceived, designed, and supervised the research and edited the manuscript.
Funding
Our work was supported by the Australian Research Council (DP 160100933), Mr James Fairfax (Bridgestar Pty Ltd) and the Luminesce Alliance—Innovation for Children’s Health, a joint venture between the Sydney Children’s Hospitals Network, the Children’s Medical Research Institute (CMRI), and the Children’s Cancer Institute, established with the support of the NSW Government. RM was supported by University of Sydney Research Training Program Scholarship and CMRI Scholarship. PPLT was supported by the National Health and Medical Research Council Research Fellowship (Grant 1110751).
Conflict of Interest
The authors declare that the research was conducted in the absence of any commercial or financial relationships that could be construed as a potential conflict of interest.
Publisher’s Note
All claims expressed in this article are solely those of the authors and do not necessarily represent those of their affiliated organizations, or those of the publisher, the editors and the reviewers. Any product that may be evaluated in this article, or claim that may be made by its manufacturer, is not guaranteed or endorsed by the publisher.
Supplementary Material
The Supplementary Material for this article can be found online at: https://www.frontiersin.org/articles/10.3389/fcell.2021.777652/full#supplementary-material
Supplementary Figure S1 | (A) Uniform Manifold Approximation and Projection for Dimension Reduction (UMAP) for individual cells at E7.75 and E8.25 (data from Pijuan-Sala et al, 2019). Colours represent the relevant cell types expressing the genes of interest: Foxd4, Lhx1 and Foxa2 at E7.75 and Foxd4, Otx2 and Hesx1 at E8.25. Foxd4 at E7.75 shows highest expression in notochord, neurectoderm and definitive endoderm. Foxd4 at E8.25 shows highest expression in definitive endoderm, notochord, forebrain/midbrain/hindbrain and rostral neurectoderm. (B) UMAP for individual cells at E7.75 and E8.25 (data from Pijuan-Sala et al. (2019). Colours represent the relevant cell types expressing the genes of interest. Co-expression data of Foxd4 with Zic1, Zic2, Twist1 or Sox9 are shown in red. Co-expression of Foxd4/Zic2 and Foxd4/Sox9 are mainly in the rostral neurectoderm at E7.75 and forebrain/midbrain/hindbrain in E8.25 embryos.
Supplementary Figure S2 | (A) Schematic representation of CRISPR-Cas9 editing on Foxd4 for clone Foxd4Δ2/Δ2. CRISPR-Cas9 gRNA 1 targeted the DNA sequence corresponding to the N-terminal AB domain of Foxd4, resulting in 2bp deletions in each allele. (B) Relative fluorescence intensity of host derived tissue (dsRed.T3) over area for each Foxd4Δ2/Δ2 chimera collected at E10.5 (compared to un-injected E10.5 embryos). (C) Brightfield and dsRed.T3 imaging of E10.5 Foxd4Δ2/Δ2 chimeras ranked from least mESC contribution to most. Arrows indicate anterior defect. (D) Schematic representation of CRISPR-Cas9 editing on Foxd4 for clone Foxd4Δ2/Δ1. CRISPR-Cas9 gRNA 2 targeted the DNA sequence corresponding to the region between the AB and forehead domains of Foxd4, resulting in a 2bp deletion and 1bp insertion in each allele. (E) Relative fluorescence intensity of host derived tissue (dsRed.T3) over area for each Foxd4Δ2/Δ1 chimera collected at E10.5 (compared to un-injected E10.5 embryos). (F) Brightfield and dsRed.T3 imaging of E10.5 Foxd4Δ2/Δ1 chimeras ranked from least mESC contribution to most. Arrows indicate anterior defect. All scale bars = 500µm
Supplementary Figure S3 | (A) Immunofluorescence imaging of extraembryonic endoderm (XEN) cells derived from dsRed-expressing E3.5 mouse blastocysts. XEN cells show expression of endoderm markers FOXA2 and SOX17 but not pluripotency factor OCT4. N=4. Scale bar = 50 µm. (B) RT-qPCR analysis shows expression of endoderm genes, Foxa2 and Sox17, extraembryonic endoderm gene Gata6 and pluripotency factor, Sox2 (relative to Actb) in dsRed-positive XEN cells compared to R1 mESCs. N=1. (C) Neuruloids showing dsRed-expressing XEN cells localized on the outside of the neuruloids, while the ESCs colonized the core. Wild-type neuruloids show SOX1 expression. Single z-stack. N=4. Scale bar = 300 μm. (D) RT-qPCR analysis shows increased expression of anterior tissue genes, Lhx1, Otx2, Foxd4 and Hesx1 (relative to Actb) in Day 4 neuruloids compared to conventional Day 4 embryoid bodies (EBs). N=1. (E) 96 hour differentiated wild-type neuruloids show expression of early neural marker SOX1. Maximum intensity z projection. N= 4. Scale bar = 300 μm.
Supplementary Figure S4 | (A) Brightfield and dsRed imaging of E8.0 dsRed.T3 embryos and E8.0 chimeras with either wild-type or Foxd4Δ7/Δ8 mESCs. (B) Wild-type and Foxd4Δ7/Δ8 E9.5 chimeras stained for SOX1 (red). Foxd4Δ7/Δ8 chimera displays truncated head. Maximum intensity z projection. (C) Neural tube defect of representative Foxd4Δ7/Δ8 E10.5 chimera embryo stained for neurofilament (green), TFAP2a (red) and DAPI (blue). Maximum intensity z projection. (D) Craniofacial defect of representative Foxd4Δ7/Δ8 E10.5 chimera embryo stained for neurofilament (green), SOX2 (red) and DAPI (blue). Maximum intensity z projection. (E) Mid-brain/eye marker OTX2 expression is reduced in representative Foxd4Δ7/Δ8 derived E11.5 chimera embryo (red), neurofilament staining (green) reveals exencephaly in mutant chimera. Maximum intensity z projection. (F) Exencephaly shown in representative Foxd4Δ7/Δ8 derived E11.5 chimera embryo, stained for neurofilament (green), SOX2 (red) and DAPI (blue). Maximum intensity z projection. Scale bar = 500 µm
Supplementary Figure S5 | (A) Relative fluorescence intensity of host derived tissue (dsRed.T3) over area for each wild-type chimera collected at E9.5 (compared to un-injected E9.5 embryos). (B) Brightfield and dsRed.T3 imaging of E9.5 wild-type chimeras ranked from low mESC contribution to high. All scale bars = 500µm
Supplementary Figure S6 | (A) Relative fluorescence intensity of host derived tissue (dsRed.T3) over area for each Foxd4Δ7/Δ8 chimera collected at E9.5 (compared to un-injected E9.5 embryos). (B) Brightfield and dsRed.T3 imaging of E9.5 Foxd4Δ7/Δ8 chimeras ranked from low mESC contribution to high. Arrows indicate anterior defect. All scale bars = 500 µm
Supplementary Figure S7 | (A) Relative fluorescence intensity of host derived tissue (dsRed.T3) over area for each wild-type chimera collected at E10.5 (compared to un-injected E10.5 embryos). (B) Brightfield and dsRed.T3 imaging of E10.5 wild-type chimeras ranked from low mESC contribution to high. All scale bars = 500 µM
Supplementary Figure S8 | (A) Relative fluorescence intensity of host derived tissue (dsRed.T3) over area for each Foxd4Δ7/Δ8 chimera collected at E10.5 (compared to un-injected E10.5 embryos). (B) Brightfield and dsRed.T3 imaging of E10.5 Foxd4Δ7/Δ8 chimeras ranked from low mESC contribution to high. Arrows indicate anterior defect. All scale bars = 500 µM
Supplementary Figure S9 | (A) Relative fluorescence intensity of host derived tissue (dsRed.T3) over area for each wild-type chimera collected at E11.5 (compared to un-injected E11.5 embryos). (B) Relative fluorescence intensity of host derived tissue (dsRed.T3) over area for each Foxd4Δ7/Δ8 chimera collected at E11.5 (compared to un-injected E11.5 embryos). (C) Brightfield and dsRed.T3 imaging of E11.5 wild-type chimeras ranked from low mESC contribution to high. (D) Brightfield and dsRed.T3 imaging of E11.5 Foxd4Δ7/Δ8 chimeras ranked from low mESC contribution to high. Arrows indicate anterior defect. All scale bars = 500µM
References
Ang, S.-L., and Rossant, J. (1994). HNF-3β Is Essential for Node and Notochord Formation in Mouse Development. Cell 78 (4), 561–574. doi:10.1016/0092-8674(94)90522-3
Arkell, R. M., and Tam, P. P. L. (2012). Initiating Head Development in Mouse Embryos: Integrating Signalling and Transcriptional Activity. Open Biol. 2 (3), 120030. doi:10.1098/rsob.120030
Benchling [Biology Software] (2021). Retrieved from https://benchling.com. (Accessed June 19, 2019).
Bérenger-Currias, N. M., Mircea, M., Adegeest, E., van den Berg, P. R., Feliksik, M., Hochane, M., et al. (2020). Early Neurulation Recapitulated in Assemblies of Embryonic and Extraembryonic Cells. BioRxiv. doi:10.1101/2020.02.13.947655
Buecker, C., Srinivasan, R., Wu, Z., Calo, E., Acampora, D., Faial, T., et al. (2014). Reorganization of Enhancer Patterns in Transition from Naive to Primed Pluripotency. Cell stem cell 14 (6), 838–853. doi:10.1016/j.stem.2014.04.003
Bunis, D. G., Andrews, J., Fragiadakis, G. K., Burt, T. D., and Sirota, M. (2020). dittoSeq: Universal User-Friendly Single-Cell and Bulk RNA Sequencing Visualization Toolkit. Bioinformatics 36 (22-23), 5535–5536. doi:10.1093/bioinformatics/btaa1011
Cernilogar, F. M., Hasenöder, S., Wang, Z., Scheibner, K., Burtscher, I., Sterr, M., et al. (2019). Pre-Marked Chromatin and Transcription Factor Co-Binding Shape the Pioneering Activity of Foxa2. Nucleic Acids Res. 47 (17), 9069–9086. doi:10.1093/nar/gkz627
Costello, I., Nowotschin, S., Sun, X., Mould, A. W., Hadjantonakis, A.-K., Bikoff, E. K., et al. (2015). Lhx1 Functions Together with Otx2, Foxa2, and Ldb1 to Govern Anterior Mesendoderm, Node, and Midline Development. Genes Dev. 29 (20), 2108–2122. doi:10.1101/gad.268979.115
Dekkers, J. F., Alieva, M., Wellens, L. M., Ariese, H. C. R., Jamieson, P. R., Vonk, A. M., et al. (2019). High-Resolution 3D Imaging of Fixed and Cleared Organoids. Nat. Protoc. 14 (6), 1756–1771. doi:10.1038/s41596-019-0160-8
Dottori, M., Gross, M. K., Labosky, P., and Goulding, M. (2001). The Winged-Helix Transcription Factor Foxd3 Suppresses Interneuron Differentiation and Promotes Neural Crest Cell Fate. Development 128 (21), 4127–4138. doi:10.1242/dev.128.21.4127
Fan, X., Masamsetti, V. P., Sun, J. Q., Engholm-Keller, K., Osteil, P., Studdert, J., et al. (2021). TWIST1 and Chromatin Regulatory Proteins Interact to Guide Neural Crest Cell Differentiation. Elife 10, e62873. doi:10.7554/elife.62873
Fossat, N., Ip, C. K., Jones, V. J., Studdert, J. B., Khoo, P.-L., Lewis, S. L., et al. (2015). Context-Specific Function of the LIM Homeobox 1 Transcription Factor in Head Formation of the Mouse Embryo. Development 142 (11), 2069–2079. doi:10.1242/dev.120907
Hermesz, E., Mackem, S., and Mahon, K. A. (1996). Rpx: A Novel Anterior-Restricted Homeobox Gene Progressively Activated in the Prechordal Plate, Anterior Neural Plate and Rathke's Pouch of the Mouse Embryo. Development 122 (1), 41–52. doi:10.1242/dev.122.1.41
Iacovino, M., Bosnakovski, D., Fey, H., Rux, D., Bajwa, G., Mahen, E., et al. (2011). Inducible Cassette Exchange: A Rapid and Efficient System Enabling Conditional Gene Expression in Embryonic Stem and Primary Cells. Stem Cells 29 (10), 1580–1588. doi:10.1002/stem.715
Kaestner, K. H., Monaghan, A. P., Kern, H., Ang, S.-L., Weitz, S., Lichter, P., et al. (1995). The Mouse Fkh-2 Gene. J. Biol. Chem. 270 (50), 30029–30035. doi:10.1074/jbc.270.50.30029
Kimura, C., Yoshinaga, K., Tian, E., Suzuki, M., Aizawa, S., and Matsuo, I. (2000). Visceral Endoderm Mediates Forebrain Development by Suppressing Posteriorizing Signals. Develop. Biol. 225 (2), 304–321. doi:10.1006/dbio.2000.9835
Kinder, S. J., Tsang, T. E., Ang, S. L., Behringer, R. R., and Tam, P. P. (2003). Defects of the Body Plan of Mutant Embryos Lacking Lim1, Otx2 or Hnf3beta Activity. Int. J. Dev. Biol. 45 (1), 347–355. doi:10.1387/IJDB.11291865
Martinez-Barbera, J. P., and Beddington, R. S. (2003). Getting Your Head Around Hex and Hesx1: Forebrain Formation in Mouse. Int. J. Dev. Biol. 45 (1), 327–336. doi:10.1387/IJDB.11291863
Martinez-Barbera, J. P., Rodriguez, T. A., and Beddington, R. S. P. (2000). The Homeobox Gene Hesx1 Is Required in the Anterior Neural Ectoderm for Normal Forebrain Formation. Develop. Biol. 223 (2), 422–430. doi:10.1006/dbio.2000.9757
Matsuo, I., Kuratani, S., Kimura, C., Takeda, N., and Aizawa, S. (1995). Mouse Otx2 Functions in the Formation and Patterning of Rostral Head. Genes Dev. 9 (21), 2646–2658. doi:10.1101/gad.9.21.2646
McCarthy, D. J., Campbell, K. R., Lun, A. T., and Wills, Q. F. (2017). Scater: Pre-Processing, Quality Control, Normalization and Visualization of Single-Cell RNA-Seq Data in R. Bioinformatics 33 (8), 1179–1186. doi:10.1093/bioinformatics/btw777
McMahon, R., Sibbritt, T., Salehin, N., Osteil, P., and Tam, P. P. L. (2019). Mechanistic Insights from the LHX1‐Driven Molecular Network in Building the Embryonic Head. Develop. Growth Differ. 61 (5), 327–336. doi:10.1111/dgd.12609
Mori-Akiyama, Y., Akiyama, H., Rowitch, D. H., and de Crombrugghe, B. (2003). Sox9 Is Required for Determination of the Chondrogenic Cell Lineage in the Cranial Neural Crest. Proc. Natl. Acad. Sci. 100 (16), 9360–9365. doi:10.1073/pnas.1631288100
Müllner, D. (2013). Fastcluster: Fast Hierarchical, Agglomerative Clustering Routines for R and Python. J. Stat. Softw. 53 (1), 1–18. doi:10.18637/jss.v053.i09
Neilson, K. M., Klein, S. L., Mhaske, P., Mood, K., Daar, I. O., and Moody, S. A. (2012). Specific Domains of FoxD4/5 Activate and Repress Neural Transcription Factor Genes to Control the Progression of Immature Neural Ectoderm to Differentiating Neural Plate. Develop. Biol. 365 (2), 363–375. doi:10.1016/j.ydbio.2012.03.004
Niakan, K. K., Schrode, N., Cho, L. T. Y., and Hadjantonakis, A.-K. (2013). Derivation of Extraembryonic Endoderm Stem (XEN) Cells from Mouse Embryos and Embryonic Stem Cells. Nat. Protoc. 8 (6), 1028–1041. doi:10.1038/nprot.2013.049
Odenthal, J., and Nüsslein-Volhard, C. (1998). Fork Head Domain Genes in Zebrafish. Develop. Genes Evol. 208 (5), 245–258. doi:10.1007/s004270050179
Peng, G., Suo, S., Cui, G., Yu, F., Wang, R., Chen, J., et al. (2019). Molecular Architecture of Lineage Allocation and Tissue Organization in Early Mouse Embryo. Nature 572 (7770), 528–532. doi:10.1038/s41586-019-1469-8
Perea-Gómez, A., Shawlot, W., Sasaki, H., Behringer, R. R., and Ang, S. (1999). HNF3beta and Lim1 Interact in the Visceral Endoderm to Regulate Primitive Streak Formation and Anterior-Posterior Polarity in the Mouse Embryo. Development 126 (20), 4499–4511. doi:10.1242/dev.126.20.4499
Pijuan-Sala, B., Griffiths, J. A., Guibentif, C., Hiscock, T. W., Jawaid, W., Calero-Nieto, F. J., et al. (2019). A Single-Cell Molecular Map of Mouse Gastrulation and Early Organogenesis. Nature 566 (7745), 490–495. doi:10.1038/s41586-019-0933-9
Ran, F. A., Hsu, P. D., Wright, J., Agarwala, V., Scott, D. A., and Zhang, F. (2013). Genome Engineering Using the CRISPR-Cas9 System. Nat. Protoc. 8 (11), 2281–2308. doi:10.1038/nprot.2013.143
Rhinn, M., Dierich, A., Shawlot, W., Behringer, R. R., Le Meur, M., and Ang, S. L. (1998). Sequential Roles for Otx2 in Visceral Endoderm and Neuroectoderm for Forebrain and Midbrain Induction and Specification. Development 125 (5), 845–856. doi:10.1242/dev.125.5.845
Shawlot, W., and Behringer, R. R. (1995). Requirement for Liml in Head-Organizer Function. Nature 374 (6521), 425–430. doi:10.1038/374425a0
Sherman, J. H., Karpinski, B. A., Fralish, M. S., Cappuzzo, J. M., Dhindsa, D. S., Thal, A. G., et al. (2017). Foxd4 Is Essential for Establishing Neural Cell Fate and for Neuronal Differentiation. Genesis 55 (6), e23031. doi:10.1002/dvg.23031
Sibbritt, T., Ip, C. K., Khoo, P. L., Wilkie, E., Jones, V., Sun, J. Q. J., et al. (2018). A Gene Regulatory Network Anchored by LIM Homeobox 1 for Embryonic Head Development. Genesis 56 (9), e23246. doi:10.1002/dvg.23246
Sibbritt, T., Osteil, P., Fan, X., Sun, J., Salehin, N., Knowles, H., et al. (2019). “Gene Editing of Mouse Embryonic and Epiblast Stem Cells,” in Mouse Cell Culture. Editor I Bertoncello (New York, NY: Springer), 77–95. doi:10.1007/978-1-4939-9086-3_6
Simeone, A., Acampora, D., Mallamaci, A., Stornaiuolo, A., D'Apice, M. R., Nigro, V., et al. (1993). A Vertebrate Gene Related to Orthodenticle Contains a Homeodomain of the Bicoid Class and Demarcates Anterior Neuroectoderm in the Gastrulating Mouse Embryo. EMBO J. 12 (7), 2735–2747. doi:10.1002/j.1460-2075.1993.tb05935.x
Soldatov, R., Kaucka, M., Kastriti, M. E., Petersen, J., Chontorotzea, T., Englmaier, L., et al. (2019). Spatiotemporal Structure of Cell Fate Decisions in Murine Neural Crest. Science 364 (6444), eaas9536. doi:10.1126/science.aas9536
Stuart, T., Butler, A., Hoffman, P., Hafemeister, C., Papalexi, E., Mauck, W. M., et al. (2019). Comprehensive Integration of Single-Cell Data. Cell 177 (7), 1888–1902. doi:10.1016/j.cell.2019.05.031
Tamplin, O. J., Kinzel, D., Cox, B. J., Bell, C. E., Rossant, J., and Lickert, H. (2008). Microarray Analysis of Foxa2 Mutant Mouse Embryos Reveals Novel Gene Expression and Inductive Roles for the Gastrula Organizer and its Derivatives. BMC genomics 9 (1), 511–519. doi:10.1186/1471-2164-9-511
Teng, L., Mundell, N. A., Frist, A. Y., Wang, Q., and Labosky, P. A. (2008). Requirement for Foxd3 in the Maintenance of Neural Crest Progenitors. Development 135 (9), 1615–1624. doi:10.1242/dev.012179
Thomas, P., and Beddington, R. (1996). Anterior Primitive Endoderm May Be Responsible for Patterning the Anterior Neural Plate in the Mouse Embryo. Curr. Biol. 6 (11), 1487–1496. doi:10.1016/s0960-9822(96)00753-1
Varshney, M. K., Inzunza, J., Lupu, D., Ganapathy, V., Antonson, P., Rüegg, J., et al. (2017). Role of Estrogen Receptor Beta in Neural Differentiation of Mouse Embryonic Stem Cells. Proc. Natl. Acad. Sci. USA 114 (48), E10428–E10437. doi:10.1073/pnas.1714094114
Wang, W.-D., Melville, D. B., Montero-Balaguer, M., Hatzopoulos, A. K., and Knapik, E. W. (2011). Tfap2a and Foxd3 Regulate Early Steps in the Development of the Neural Crest Progenitor Population. Develop. Biol. 360 (1), 173–185. doi:10.1016/j.ydbio.2011.09.019
Warr, N., Powles-Glover, N., Chappell, A., Robson, J., Norris, D., and Arkell, R. M. (2008). Zic2 -Associated Holoprosencephaly Is Caused by a Transient Defect in the Organizer Region during Gastrulation. Hum. Mol. Genet. 17 (19), 2986–2996. doi:10.1093/hmg/ddn197
Wijchers, P. J. E. C., Burbach, J. P. H., and Smidt, M. P. (2006). In Control of Biology: Of Mice, Men and Foxes. Biochem. J. 397 (2), 233–246. doi:10.1042/bj20060387
Yamanaka, Y., Tamplin, O. J., Beckers, A., Gossler, A., and Rossant, J. (2007). Live Imaging and Genetic Analysis of Mouse Notochord Formation Reveals Regional Morphogenetic Mechanisms. Develop. Cel 13 (6), 884–896. doi:10.1016/j.devcel.2007.10.016
Yan, B., Neilson, K. M., and Moody, S. A. (2009). foxD5 Plays a Critical Upstream Role in Regulating Neural Ectodermal Fate and the Onset of Neural Differentiation. Develop. Biol. 329 (1), 80–95. doi:10.1016/j.ydbio.2009.02.019
Ying, Q.-L., Wray, J., Nichols, J., Batlle-Morera, L., Doble, B., Woodgett, J., et al. (2008). The Ground State of Embryonic Stem Cell Self-Renewal. Nature 453 (7194), 519–523. doi:10.1038/nature06968
Keywords: Foxd4, head development, anterior neuroectoderm, neural tube defects, cranial neural crest
Citation: McMahon R, Sibbritt T, Aryamanesh N, Masamsetti VP and Tam PPL (2022) Loss of Foxd4 Impacts Neurulation and Cranial Neural Crest Specification During Early Head Development. Front. Cell Dev. Biol. 9:777652. doi: 10.3389/fcell.2021.777652
Received: 15 September 2021; Accepted: 30 December 2021;
Published: 01 February 2022.
Edited by:
Kerstin Feistel, University of Hohenheim, GermanyReviewed by:
Gabriel L. Galea, University College London, United KingdomHeather C. Etchevers, INSERM U1251 Centre de Génétique Médicale de Marseille (MMG), France
Copyright © 2022 McMahon, Sibbritt, Aryamanesh, Masamsetti and Tam. This is an open-access article distributed under the terms of the Creative Commons Attribution License (CC BY). The use, distribution or reproduction in other forums is permitted, provided the original author(s) and the copyright owner(s) are credited and that the original publication in this journal is cited, in accordance with accepted academic practice. No use, distribution or reproduction is permitted which does not comply with these terms.
*Correspondence: Riley McMahon, cm1jbWFob25AY21yaS5vcmcuYXU=; Patrick P. L. Tam, cHRhbUBjbXJpLm9yZy5hdQ==