 Richard B. Dickinson
 Tanmay P. Lele
- 1Department of Chemical Engineering, University of Florida, Gainesville, FL, United States
- 2Department of Biomedical Engineering, College of Engineering, Texas A&M University College Station, College Station, TX, United States
- 3Artie McFerrin Department of Chemical Engineering, College of Engineering, Texas A&M University, College Station, TX, United States
- 4Department of Translational Medical Sciences, Texas A&M University, College Station, TX, United States
Introduction: Nuclei have characteristic shapes dependent on cell type, which are critical for proper cell function, and nuclei lose their distinct shapes in multiple diseases including cancer, laminopathies, and progeria. Nuclear shapes result from deformations of the sub-nuclear components—nuclear lamina and chromatin. How these structures respond to cytoskeletal forces to form the nuclear shape remains unresolved. Although the mechanisms regulating nuclear shape in human tissues are not fully understood, it is known that different nuclear shapes arise from cumulative nuclear deformations post-mitosis, ranging from the rounded morphologies that develop immediately after mitosis to the various nuclear shapes that roughly correspond to cell shape (e.g., elongated nuclei in elongated cells, flat nuclei in flat cells).
Methods: We formulated a mathematical model to predict nuclear shapes of cells in various contexts under the geometric constraints of fixed cell volume, nuclear volume and lamina surface area. Nuclear shapes were predicted and compared to experiments for cells in various geometries, including isolated on a flat surface, on patterned rectangles and lines, within a monolayer, isolated in a well, or when the nucleus is impinging against a slender obstacle.
Results and Discussion: The close agreement between predicted and experimental shapes demonstrates a simple geometric principle of nuclear shaping: the excess surface area of the nuclear lamina (relative to that of a sphere of the same volume) permits a wide range of highly deformed nuclear shapes under the constraints of constant surface area and constant volume. When the lamina is smooth (tensed), the nuclear shape can be predicted entirely from these geometric constraints alone for a given cell shape. This principle explains why flattened nuclear shapes in fully spread cells are insensitive to the magnitude of the cytoskeletal forces. Also, the surface tension in the nuclear lamina and nuclear pressure can be estimated from the predicted cell and nuclear shapes when the cell cortical tension is known, and the predictions are consistent with measured forces. These results show that excess surface area of the nuclear lamina is the key determinant of nuclear shapes. When the lamina is smooth (tensed), the nuclear shape can be determined purely by the geometric constraints of constant (but excess) nuclear surface area, nuclear volume, and cell volume, for a given cell adhesion footprint, independent of the magnitude of the cytoskeletal forces involved.
1 Introduction
The shape of the mammalian cell nucleus is an important cellular feature that varies in different cell types and tissues. For example, in endothelial cells lining the blood vessels and capillaries, nuclei are typically flat, whereas they are more rounded in epithelia and elongated in fibroblasts. Although the mechanisms regulating nuclear shape in human tissues are not fully understood, it is known that different nuclear shapes arise from cumulative nuclear deformations post-mitosis, ranging from the rounded morphologies that develop immediately after mitosis to the various nuclear shapes that roughly correspond to cell shape (e.g., elongated cells have elongated nuclei, flat cells have flat nuclei). The cell nucleus is deformed by mechanical stresses generated in the cytoskeleton (Lele et al., 2018), and the resulting nuclear deformations are critical for mediating essential cellular activities. In particular, nuclear deformations enable fibroblast migration during wound healing (Harada et al., 2014), cell migration during early embryonic differentiation (Smith et al., 2017), neuronal migration (Wu et al., 2018) and neurokinesis during development (Chen et al., 2019), immune cell migration across the endothelium (Rowat et al., 2013), and muscle contraction (Lorber et al., 2020).
In addition, nuclear deformations can trigger cell-type-specific gene expression and signaling pathways through mechanisms that are currently not well-understood, due to an inadequate understanding of how sub-nuclear structures respond to nuclear forces. However, it has been shown that stretching of the nuclear envelope induces the opening of stretch-activated ion channels in the nuclear membrane, which in turn, activates the small GTPase RhoA and alters cell migration activity (Lomakin et al., 2020). Similarly, mechanical flattening of the nucleus can stretch nuclear pores, leading to translocation of yes-associated protein (YAP) into the nucleus (Dupont et al., 2011; Elosegui-Artola et al., 2017), and thereby alter gene expression (Kalukula et al., 2022).
Critically, nuclear deformations can also have pathological consequences. For example, extreme deformations may tear and rupture the nuclear envelope, leading to DNA damage, tumorigenesis (Denais et al., 2016), and invasive migratory phenotypes (Nader et al., 2021). Additionally, nuclear deformation due to a decrease in nuclear lamin A levels allows cell migration through confining spaces in the tissue interstitium, thereby contributing to tumor cell escape and metastasis (Friedl et al., 2011; Wolf et al., 2013; Vortmeyer-Krause et al., 2020). Cancer pathologists commonly use nuclear morphology to grade different cancers, assessing both shape deformation and enlargement in size (reviewed by us in (Singh and Lele, 2022)).
Generally, nuclear shape mimics the overall cell shape. For example, nuclei are elongated in elongated cells, and they take on a flattened disk-like shape in well-spread cells (Versaevel et al., 2012; Li et al., 2015; Neelam et al., 2016). The predominant model for explaining such shapes assumes that the nuclear lamina, chromatin, and other sub-nuclear structures deform elastically in response to cytoskeletal forces (reviewed previously in (Kalukula et al., 2022)). In this model, the nucleus is assumed to be a stiff, elastic object that deforms from an initial spherical shape by elastically straining the chromatin and stretching the stiffest surface element, which is the nuclear lamina. The models are motivated by measurements of nuclear deformation with force probes, such as the Atomic Force Microscope (AFM) and other techniques (e.g., micropipette aspiration) that apply controlled forces on short timescales of only a few seconds (Guilak et al., 2000; Dahl et al., 2005; Pajerowski et al., 2007; Ivanovska et al., 2010; Shin et al., 2013; Swift et al., 2013; Harada et al., 2014; Neelam et al., 2015; Stephens et al., 2017; Zhang et al., 2019; Wintner et al., 2020; Zuela-Sopilniak et al., 2020). In these models, the resting undeformed state of the nucleus is commonly assumed to be a sphere with a thin, mechanically stiff, surrounding lamina layer. However, since a sphere is the unique geometric shape with a minimal surface area for its volume (or maximal volume for its surface area), any deformation of a sphere requires either a change in surface area, a change in volume, or both. Consequently, if the resting nucleus is assumed spherical, the large deformations such as observed in flattened or elongated nuclei, would require large enough forces on the nucleus to either stretch the stiff nuclear lamina or to compress the nuclear volume. Yet, three-dimensional reconstructions of the nuclear shape in rounded cells show that the lamina is not a smooth spherical shell; rather, it has a significantly greater surface area than that of a sphere of the same nuclear volume, with the excess lamina area stored in surface folds, wrinkles, and undulations (Li et al., 2015; Neelam et al., 2016; Katiyar et al., 2019; Cosgrove et al., 2021; Dickinson et al., 2022) (Figure 1A). When an object’s surface area exceeds that of a sphere of the same volume, a wide range of three-dimensional shapes are geometrically possible for that volume and (excess) surface area without requiring a mechanical stretching of the surface. We have previously invoked excess lamina surface area to explain why the nucleus is highly compliant to shape changes during spreading of cells, and only is “stiff” to further flattening once the surface area is smoothed and where further deformations require volume compression or lamina area expansion (Li et al., 2015). The features of the resulting x-z (side-view) of nuclei in spread cells with smooth lamina are remarkably consistent, with a flat basal surface at the substratum, highly curved sides in contact with the cytoplasm, and a spherical cap-shaped apical surface in contact with the cell cortex (Figures 1B–D). The correlation between cell spreading, nuclear unwrinkling, and nuclear flattening, as well as the asymptotic limit to nuclear flattening, does not depend on various perturbations of the cytoskeleton including myosin inhibition (Li et al., 2015). Further, removal of cytoskeletal stresses does not relax elongated nuclear shapes back to circular (spherical) shapes (Tocco et al., 2018). Thus, contrary to the dominant mechanical models for nuclear shaping in the literature, asymptotic, limiting nuclear shapes in fully spread cells do not reflect a balance between elastic stresses in the nuclear shape and cytoskeletal forces, and any elastic energy that would cause the nucleus to recover its initial shape dissipates on the time scale (minutes) of cellular and nuclear shape changes.
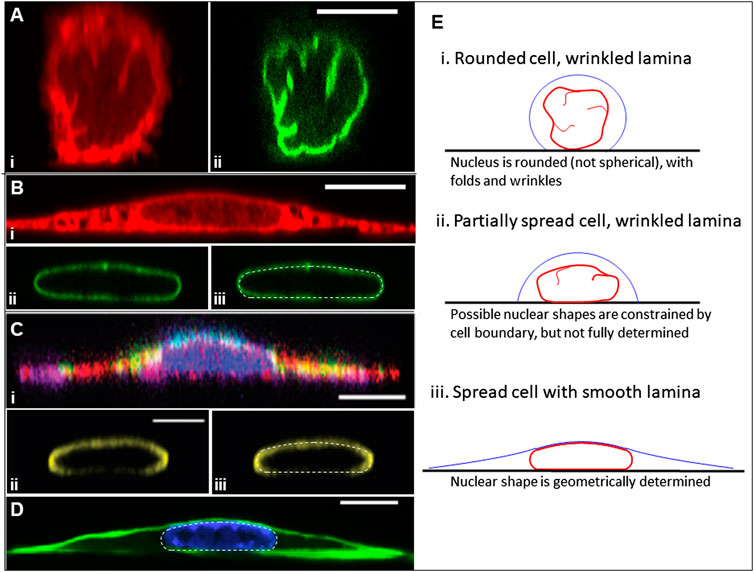
FIGURE 1. Geometry of rounded and fully spread cells from x-z perspective. (A) NIH3T3 fibroblasts fixed within 5 min of surface attachment with two fluorescence channels: (i) labeled with Dil D7556 lipid dye or (ii) GPF lamin-A [image from Dickinson et al. APL Bioeng 2021 (Dickinson et al., 2022)]. Excess area is seen clearly in the form of surface folds, wrinkles, and undulations. (B) (i-ii) Same conditions as (A) but at 24 h of spreading, showing different apical and side curvatures of smooth nuclear lamina, and the different apical cell surface curvatures on the nuclear cap versus elsewhere. (iii) The nuclear lamina overlayed with the predicted nuclear shape (white dotted line) for 45% excess lamina area, showing close agreement between the model and experiment, including the characteristic spherical cap of the joint nuclear-cortical surface, the nodoid nuclear sides in contact with the cytoplasm, and the flat nuclear bottom at the substratum. (D) An x-z perspective of a myoblast cell and lamina from Jana et al. Adv Sci 2022 (Jana et al., 2022) with (i) labeled cytoskeleton [actin (red), tubulin (purple), and vimentin (green)], (ii) labeled lamin A/C, and (iii) the lamina image overlayed with a computed shape (white dotted line) for 35% excess area. (C) Another x-z perspective of a NIH3T3 fibroblast where f-actin is labeled with phalloidin (green) and the chromatin is labeled with Hoechst (H33342), showing the cortical actin in green [from Katiyar et al. J. Microscopy 2021 (Katiyar et al., 2021)]. The nucleus is overlayed with the computational model predictions (white dotted line) for 40% excess area. (E) Cartoon illustrating the key principle in this paper. When cells are rounded or partially spread, the excess lamina surface area (manifested in folds and wrinkles) allows for a wide range of nuclear shapes within the confines of the cell boundary for fixed values of the cell volume, nuclear volume, and lamina surface area. However, when the nuclear lamina is smooth (tensed), these constraints yield a unique, geometrically determined Nuclear shape for a given cell adhesion footprint. All scale bars are 10 microns.
Motivated by the above observations, we show in this paper that the limiting nuclear shapes with smooth (tensed) lamina can be closely predicted based solely on a simple geometric principle: the excess surface area of the nucleus (relative to that of a sphere of the same volume) permits a wide range highly deformed nuclear shapes under the constraints of constant lamina surface area and constant cell and nuclear volumes, but when the lamina becomes smooth (tensed), as in fully spread cells, these geometric constraints yield a unique nuclear shape for a given cell adhesion footprint (Figure 1E). By accounting for the excess lamina surface area, highly deformed nuclear shapes can be predicted in various geometries without invoking further mechanical principles such as elastic deformation in response to cytoskeletal forces. Indeed, the observed nuclear shapes can be geometrically predicted independent of the magnitude of the cytoskeletal forces involved.
2 Theoretical model
The unique shape with a minimum surface area under the constraint of constant volume is a sphere. Its surface area
Because its area is at minimum, any deformation of shape from the sphere requires an increase in surface area, a decrease in volume, or both. A well-known physical example of a sphere in nature is a drop of water in oil which takes on a spherical shape to minimize its surface energy, equal to the product of surface tension and surface area. However, unlike a liquid drop, the nuclear lamina in the surface of a rounded nucleus is not spherical; rather it exhibits surface folds, wrinkles, and undulations, which only disappear in fully spread cells (Figure 1). This implies that in the unstressed nucleus, the lamina surface area,
Unlike the unique shape of a sphere with volume
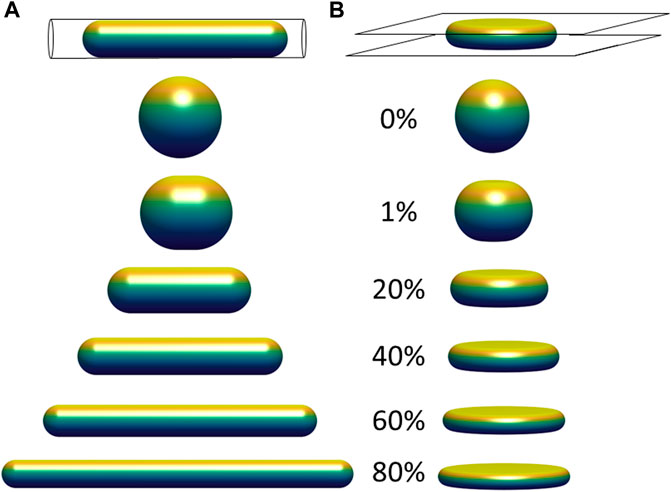
FIGURE 2. Limiting shapes in confined geometries of constant volume and constant surface area, with increasing fractional excess surface area relative to that a sphere of the same volume. Limiting shapes are shown for objects confined to (A) a cylindrical pore; and (B) between two flat plates. The excess surface area allows the object to occupy a smaller length dimension of confinement (pore diameter or gap distance between the plates), and the shapes shown represent the unique shape at the threshold length, below which there are no shapes possible that satisfy the fixed volume and area constraints, and above which infinite shapes are possible (e.g., with surface folds, wrinkles, or undulations).
Another relevant example is an object with constant surface area and constant volume vertically compressed between two flat surfaces (Figure 2B). Similar to Figure 2A, there is a threshold gap distance for an object confined between the two plates above which infinite shapes are possible for a fixed volume and excess area, but no shapes that satisfy these constraints are possible at smaller gap distances. At the threshold gap distance, the unique shape that satisfies the geometric volume and area constraints is a disk-like shape with nodoid sides. Similar to the hemispherical surfaces of a capsule, nodoids are convex axisymmetric surfaces with constant mean curvature (Plateau, 1873), and they have a minimum surface area for the enclosed volume. (If the object only resists changes to volume and surface area, maintaining a flattened shape would require no force at gap distances above the threshold gap distance. This geometric threshold would explain why nuclei in spreading cells asymptotically reach the same minimum height even when myosin activity is inhibited (Li et al., 2015), i.e., flattening the nucleus down to the minimum height can proceed without changing nuclear volume or lamina area while requiring minimal force, but flattening the nucleus below the minimum would stretch the (now taut) stiff lamina or compress the nuclear volume, which requires much higher force and is not observed during spreading. In these examples, the excess surface area permits a wide range of possible shapes without necessitating any compression of the volume or expansion of the surface area, but only down to a certain threshold length (i.e., pore size or gap distance) of confinement. For example, the cell nucleus can store its excess area in various surface folds, wrinkles, and undulations, which become smoothed out only when a flattened height is reached during cell spreading. This transition is clearly observed when the wrinkled lamina in rounded cells becomes smoothed out when the nucleus flattens in fully spread cells (Figure 1; (Dickinson et al., 2022)).
In both examples in Figure 2, the surfaces that are not in contact with the walls are surfaces of constant mean curvature (hemispherical caps in Figure 2A or nodoid sides in Figure 2B). When a curved two-dimensional surface is under tension
where Though
3 Application of model to interpret observed nuclear shapes
3.1 Nuclear shapes in a cell spreading on a flat substratum
We now extend the above conclusions to nuclear shapes in spread cells confined to various geometries to show that deformed, limiting shapes can be predicted for a given (excess) surface area, nuclear volume, and cell volume. This calculation seeks to capture the limiting cell and nuclear shapes in spread cells, and it neglects additional stresses that may arise from movement of the cell boundary or other cellular shape changes such as cell crawling (Li et al., 2015; Tocco et al., 2018; Katiyar et al., 2019). That is, we draw a distinction between the viscous or viscoelastic forces that drive the nucleus toward the limiting shape and any forces present in the limiting shape, focusing on the latter. First, we consider the case of an axisymmetric cell spread on a flat surface, where the nuclear and cell shape can be solved analytically (see derivation in Methods, Section 5). Cell and nuclear shapes were calculated by solving for the surfaces of constant mean curvature that satisfy the constraints of fixed lamina area, cell volume, and nuclear volume. As depicted in Figure 3A, the relevant interfaces are the cell cortex interface with the surrounding medium (an unduloid surface of curvature
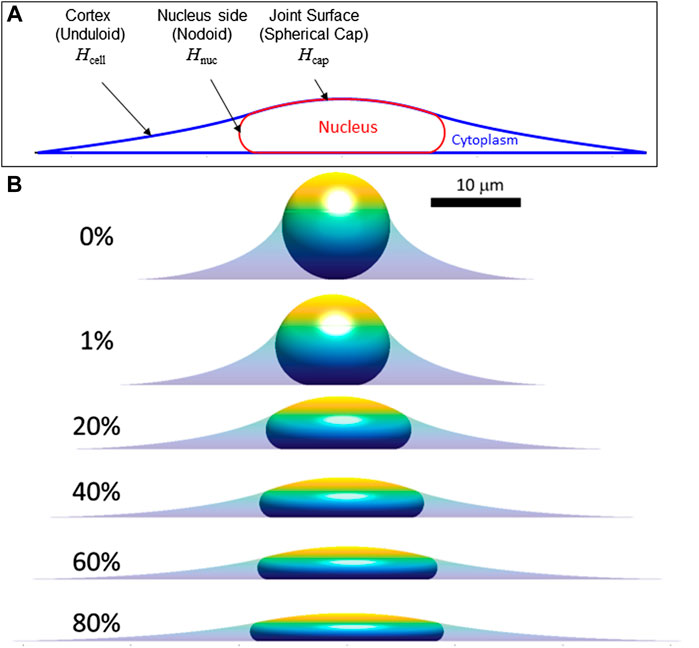
FIGURE 3. Calculated axisymmetric cell and nuclear x-z profiles in spread cells are shown for increasing amounts of fractional excess areas indicated by the percentages. (A) Characteristic calculated shape (x-z profile) showing the cell and nucleus surfaces. Consistent with experimental x-z profiles (Figure 1), spread cells with smooth nuclear lamina have surfaces of constant mean curvature, including the cortical cell surface (mean curvature, Hcell), the nuclear surface (containing the lamina) in contact with the cytoplasm (Hnuc), and the joint cortex/nuclear apical surface capping the cell (Hcap.) The cell and nuclear shapes were found by solving for the mean curvatures of each surface that satisfy the constant volume and surface area constraints (see Methods). (B) Calculated cell and nuclear shapes with varying lamina excess surface area. For the profiles shown, the spreading cell radius was taken as the radius where the slope of the cell edge just becomes parallel to the substratum. As shown, increasing excess lamina area permits flatter nuclei and greater spreading radius for the same nuclear and cell volume (V and Vcell, respectively). For the calculations shown here V = 900 μm3, Vcell = 3.4V, consistent with values for NIH 3T3 fibroblasts (Li et al., 2015). Comparison to experimental profiles like in Figure 1 suggests nuclei typically have 30%–60% excess surface area, which allows a flat equilibrium nuclear shape that is geometrically determined and independent of the magnitude of cellular forces.
When the lamina is smoothed and tensed, the surface curvatures are related to the tensions and pressure differences of the various interfaces by the Laplace equation. These pressure differences are sustained by the compartmentalization from the plasma membrane and nuclear envelope and the osmotic resistance of the nucleus and cytoplasm to volume changes. Following Eq. 3, the stress balances across the cortex-cytoplasm, cortex-nucleus and nucleus-cytoplasm interfaces are:
where the pressures are defined relative to the surrounding pressure. Rearranging Equation 4 yields
Hence,
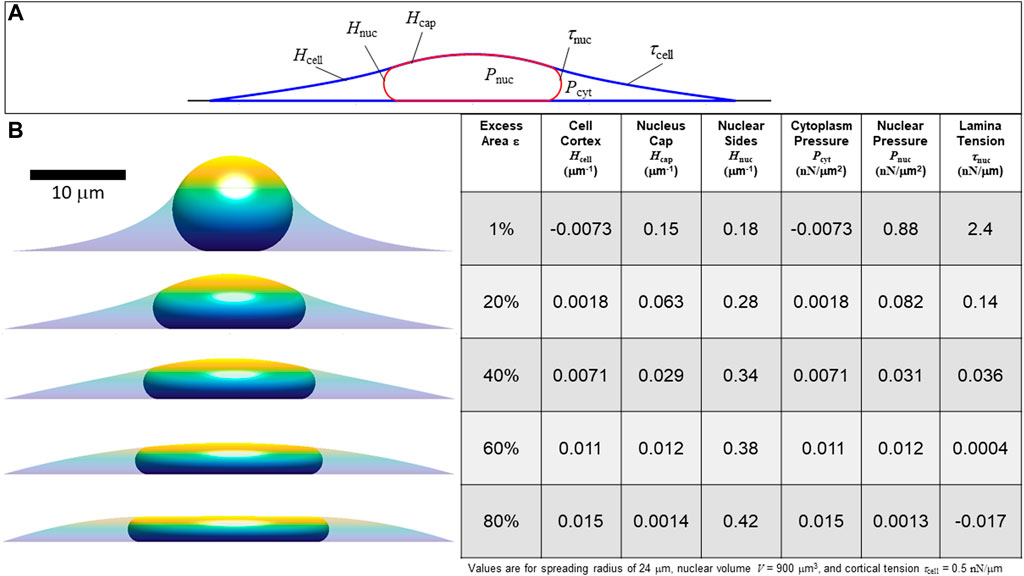
FIGURE 4. Calculated axisymmetric nuclear shapes showing the predicted effect of excess lamina area on the values of lamina surface tension, nuclear pressure, and cytoplasmic pressure, for a given cell spread radius. (A) The three curved interfaces are (1) the cell cortex (mean curvature Hcell and surface tension τcell), (2) nuclear interface with the cytoplasm (mean curvature Hnuc and tension τnuc), and (3) the apical cap where the lamina and cortex are in contact, interfacing the nucleus and the surrounding media (curvature Hcap and net surface tension equal to τnuc + τcell) (B) Cell and nuclear shapes are shown for the same spread radius and increasing amounts of excess surface area shown in the adjacent table column. The table shows the calculated curvatures, pressures, and lamina tension based on the excess area and the nuclear and cell volume constraints (in this case, V = 900 μm3, Vcell = 3.4V, consistent with values for NIH 3T3 fibroblasts (Li et al., 2015). The force scale is set by assuming τcell = 0.5 nN/μm. Note that for 80% excess area at this cell spreading radius, the calculation yields a negative lamina tension, which is a non-physical solution implying the spread radius is too small to fully confine the nucleus to a unique shape under the cortex. In this case, with a large excess nuclear surface area, given cell volume and spread radius, the nuclear and cortical surfaces would instead be expected to be separated and the nucleus would take on any the infinite possible nuclear shapes (with variable curvature and τnuc = 0) confined under a spherical cap-shape cell cortex.
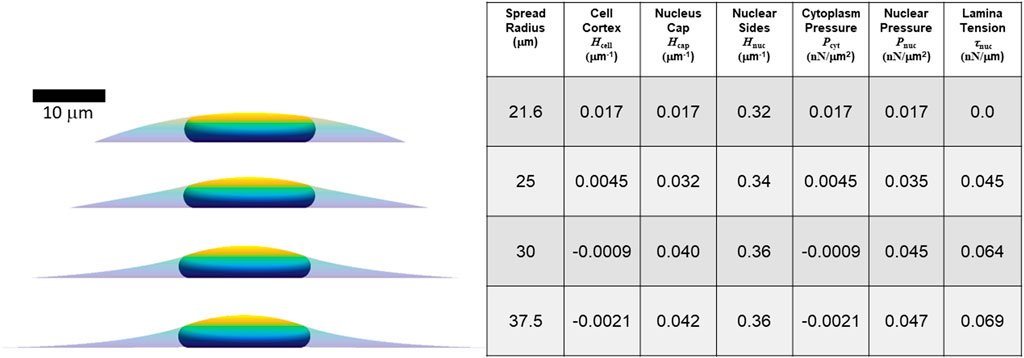
FIGURE 5. Calculated axisymmetric nuclear shapes, curvatures, and pressures, for cells with varying spread radius, 40% excess lamina area, and the same parameters used in Figure 4 (V = 900 μm3, Vcell = 3.4V, τcell = 0.5 nN/μm). The spread radius ranges from the minimum (21.6 microns) where the lamina is under positive tension to the maximum radius (37.5 microns) where the cell edge becomes parallel to the substratum.
3.2 Nuclear shapes in cells in an epithelial monolayer or isolated in a well
The shapes of epithelial cells in a monolayer in vivo can vary from columnar to cuboidal to squamous. We have previously reported that MCF10A breast epithelial cells in culture monolayers exhibit a flattened morphology with disk-shaped nuclei and remarkably uniform nuclear heights (Figure 6A; (Neelam et al., 2016)). While pulling or compressive stress transmitted to the nucleus from the moving cell boundaries is likely involved in shaping the nucleus during changes in cell shape due to viscous forces (Li et al., 2015; Dickinson et al., 2022), maintaining the resulting disk-like nuclear shape does not necessarily require cellular forces and can arise entirely from the constraints on excess area and cell volume, as indicated in Figure 2B. This nuclear shape along with the cell shape can also be predicted for a given cell spreading area, as shown in Figure 6A, using the approach in section 3.1, but now with the vertical position of the cell edge also specified. Interestingly, there is a unique cell radius that yields a flat apical surface of the nucleus; any larger radius would instead have concave regions of lower cell height between the adjacent nuclei in the monolayer, which was not observed experimentally. Nuclei were similarly flat and disk-like when isolated cells were cultured within a 5-μm deep well (Neelam et al., 2016), though in this case the cell cortex was not flat; rather, it exhibited a concave shape with a meniscus due to cell spreading up the side walls (Figure 6B, (Neelam et al., 2016)). These shapes of the cell and nucleus can also be predicted from the model by constraining both the radial and vertical edge position in an axisymmetric well of the same area as used in the experiments. Here, the vertical position of the cell boundary was varied until the observed disk-like nuclear shape was achieved. Importantly, a concave, upwardly curved tensed cortex would not be able to exert a downward compressive force, supporting the model prediction that the disk-like nuclear shape can arise without any downward compressive force on the nucleus. This conclusion holds for either the cell in the monolayer or the cell in the well because the apical nuclear surface appears flat (
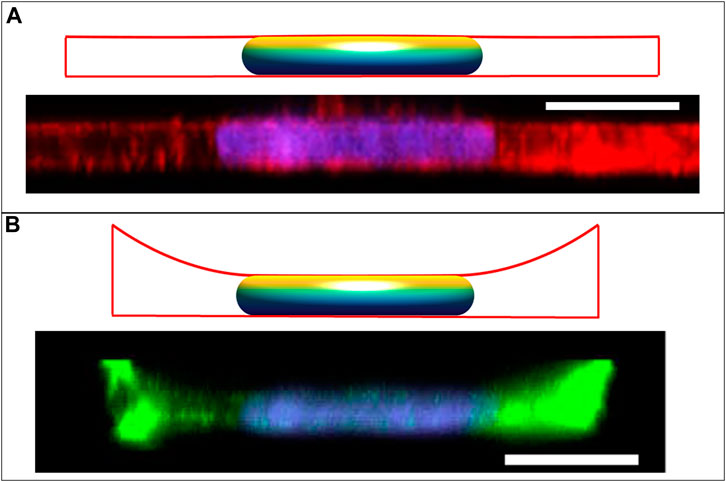
FIGURE 6. Calculated cell and nuclear shapes for cells in (A) epithelial monolayer; and (B) isolated within well, compared to the experimental x-z MCF10A cell and nuclear profiles reported in Neelam et al. Sci Rep 2016 (Neelam et al., 2016). Experimental x-z MCF10A cell profiles were stained for F-actin with Alexa Fluor 488 phalloidin and the nucleus with Hoechst 33342. Calculated cell boundaries are indicated by red lines, with lateral and basal boundaries are imposed by the solid boundaries, and apical surfaces being calculated surfaces of constant mean curvature). The flat disk-shaped nuclei like those observed in epithelial cells are solutions to the axisymmetric model for the cell and nuclear volumes reported in (V = 700 μm3, Vcell = 6.4V), and assuming an excess area ε ∼ 65%. The flat apical surface implies that the nuclear pressure relative to the surroundings is nearly zero (see Eq. 5). In the monolayer, the apical cortical surface is also flat, predicting in nearly zero cytoplasmic pressure. But for the cell in the well, the cortex is negatively curved resulting in a negative cytoplasmic pressure and a positive lamina tension. Scale bars are 10 microns.
3.3 Nuclear shapes in cells spread on patterned rectangles and lines
Similar to the flat nuclei in flat (spread) cells, elongated nuclear shapes are observed in elongated cells, Versaeval et al. (Versaevel et al., 2012) found that nuclear shapes were increasing elongated in cells cultured on rectangles with increasing aspect ratios. To test whether such non-axisymmetric 3D nuclear shapes can be predicted from the cell geometry and the excess nuclear surface area alone, we computed the 3D shapes numerically by minimizing the area of a 3D triangular surface meshes representing the cell cortex and nuclear surface for a given cellular adhesion footprint, under the constraints of constant cell volume, nuclear volume, and nuclear surface area (see Methods). As shown in Figure 7, the computed nuclear shapes closely mirror those reported in (Versaevel et al., 2012), assuming an excess area of ∼50%. However, the nuclear volumes required to calculate nuclear sizes consistent with the images and reported aspect ratios were roughly two times larger than the volumes reported in (Versaevel et al., 2012), which were calculated assuming ellipsoid nuclear shapes. This difference is likely due to the fact that the ellipsoid approximation significantly underestimates the volume in the z-direction for a nucleus that is lies nearly flat on the apical and basal surfaces. Like the nuclear shapes in (Versaevel et al., 2012), the nuclei are predicted to be much flatter vertically than horizontally, with oval x-y profiles with aspect ratios that mirror the cellular aspect ratios. Importantly, these shapes are again explained purely from the geometric constraints irrespective of the magnitude of the cellular forces, and do not require invoking an elastic force balance like that proposed in (Versaevel et al., 2012).
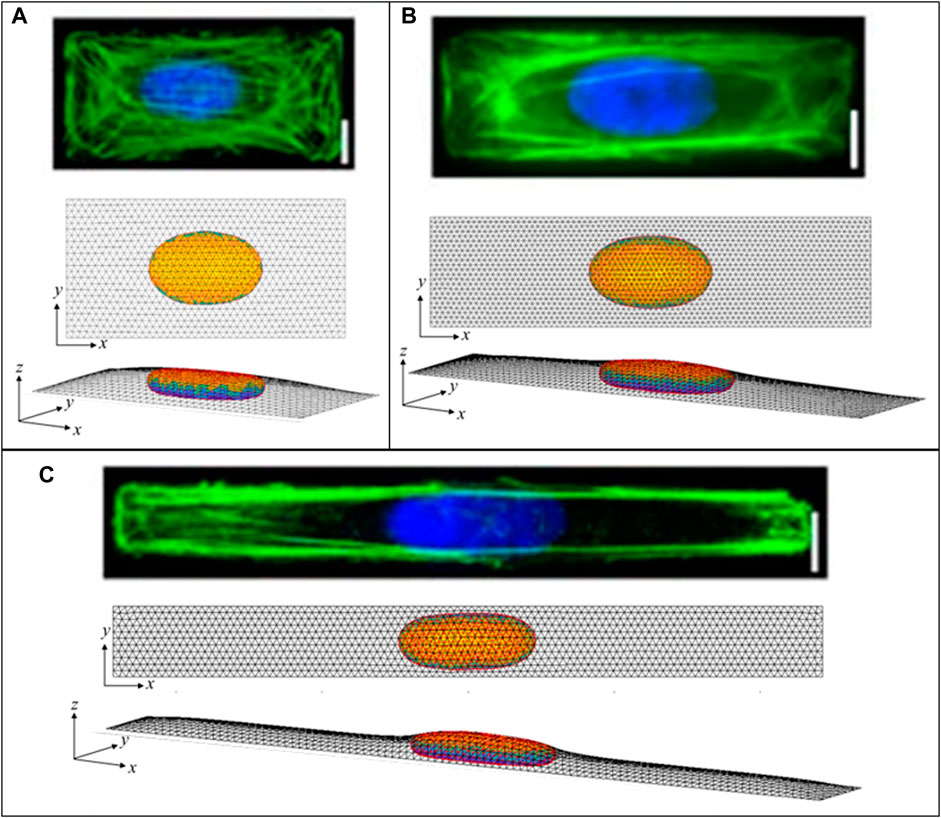
FIGURE 7. Calculated 3D cell and nuclear shapes compared to data of primary human umbilical vein endothelial cells spread on patterned 1600-μm2 rectangles of varying aspect ratio, as reported by Versaeval et al. Nat Comm 2012 (Versaevel et al., 2012). Calculated x-z nuclear profiles and nuclear heights closely agree with the experimental nuclear shapes, with similarly increasing nuclear lengths with aspect ratios of (A) 2:1, (B) 4:1, and (C) 10:1. Scale bars are 10 microns.
3.4 Nuclear shapes with deep indentations
Lastly, we test the ability of the geometric model to explain the overall nuclear shapes when the nucleus develops deep nuclear invaginations, as we have recently reported in nuclei impinging against microposts (Katiyar et al., 2022). In these experiments, nuclei in migrating cells contact the microposts, creating invaginations into the nuclear lamina (Figure 8), similar to the deformation of a liquid drop with surface tension. Here we calculated remarkably similar nuclear shapes by translating a 1-micron diameter micropost toward the nuclear center while recursively calculating the deformed equilibrium nuclear shape. We did not otherwise model the interaction between the micropost and cell, consistent with the experimental observation that the micropost was fully engulfed in the cytoplasm (Katiyar et al., 2022). The calculated nuclear shapes for
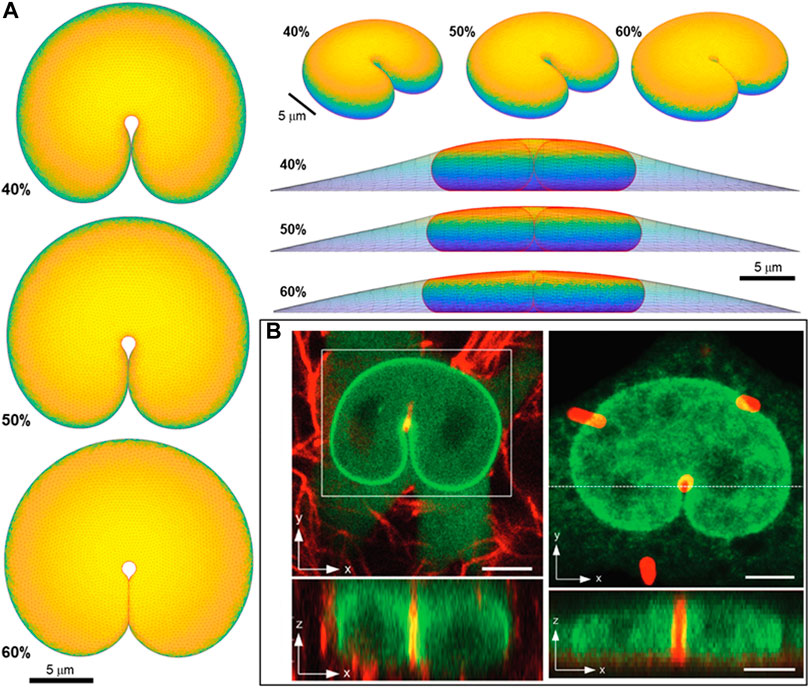
FIGURE 8. Predicted 3D shape from geometric model for nucleus deformed by a 1-um diameter micropost compared to 3D imaging in Katiyar et al. Adv Sci 2022 (Katiyar et al., 2022). (A) Calculated shapes from three different viewing angles (top, elevated, and side with cell shape also shown) are for nuclear volume, V = 900 μm3, cell volume, Vcell = 3.4V, and three different fractional excess areas. 40%, 50%, and 60%, (B) Experimental shapes for nuclei indented by (i) collagen fiber and (ii) one micron micropost (in red). Green is GFP-lamin (scale bar is 5 microns).
4 Discussion
An oval or circular nucleus with a smooth, curved contour is a ubiquitous, striking feature of a cultured eukaryotic cell. Yet, an explanation for its smooth appearance has remained elusive. In contrast to our geometric explanation, deformed non-spherical nuclear shapes have been widely assumed to result from a balance of cytoskeletal forces on the elastically deformed nucleus (reviewed in (Dickinson et al., 2022) and (Lele et al., 2018)), with the resting state of the nucleus assumed to be an undeformed sphere. Our results contradict this notion, showing that geometric considerations alone can parsimoniously explain a wide range of nuclear shapes observed in different experimental contexts, independent of the magnitude of cytoskeletal forces. The nuclear shape calculations require no parameters other than the (excess) nuclear surface area and the cell and nuclear volumes. Before the limiting shapes are reached, excess lamina surface area is predicted to allow the nucleus to undergo dynamic shape deformations at constant surface area and constant volume. These deformations can occur because they do not require areal expansion of the lamina or compression of the nuclear volume. This principle explains why the shape changes of the nucleus conform to cellular shape changes during cell spreading (Li et al., 2015) and cell crawling (Tocco et al., 2018; Dickinson et al., 2022), before reaching the limiting shapes modeled here. In these dynamic situations, cytoskeletal forces and cytoskeletal linkages to the nucleus involved in transmitting viscous or viscoelastic stresses to the nucleus are expected to be important in driving the nucleus to the limiting shapes. That is, the pathway and time required to reach the limiting shapes likely depends on the nature, magnitude, and transmission of the cytoskeletal forces, while the ultimate limiting shape is geometrically determined for a given cell shape. For example, disruption of the LINC complex, which connects the cytoskeleton to the nucleus, slows nuclear flattening during cell spreading but does not affect the ultimate limiting shape (Li et al., 2015).
It is surprising that the model can so effectively capture nuclear shapes in various cell geometries with so few parameters despite several simplifying assumptions. The assumption of surfaces of constant mean curvature implicitly assumes that the nuclear pressure
The key model assumption that the lamina has excess surface area is clearly evident in the folds, wrinkles, and surface undulations seen in 3D images of rounded nuclei, falsifying the notion that the resting state of the lamina is spherical (Figure 1). As the bi-layered nuclear envelope is attached to the lamina via the LINC complex (Alam et al., 2014), it must likewise have excess area that allows large deformations without coinciding with the lamina deformation, as observed for nuclei deformed by microposts (Katiyar et al., 2022). Moreover, our previous work has shown that removal of cytoskeletal forces does not cause relaxation of the nucleus to a spherical morphology, implying nuclear deformations in spread cells are irreversible (Tocco et al., 2018). Consistent with these findings, elastic forces in the nuclear interior have been found to rapidly dissipate on the time scale of seconds and that the nuclear contents behave as a viscous fluid on this time scale (Erdel et al., 2015; Keizer et al., 2022). From literature estimates of the area dilation modulus (∼390 nN/μm (Dahl et al., 2004)), the nuclear bulk modulus (∼5 nN/μm2 (Caille et al., 2002)), and the cortical tension (∼0.5 nN/μm (Janshoff, 2021)), the areal extension of the lamina and changes in volume due to compression in the flattened nucleus during spreading are expected to be less than 1%, based on pressures and tensions calculated from Eq. 5. Even if some nuclear compression or areal expansion were to occur when the lamina becomes smoothed and tensed, this would not weigh against the key conclusions that shape is primarily limited by the geometric constraints of lamina area and nuclear volume, and that the excess area permits a wide range of shapes at constant volume and lamina area before the limiting shape is reached. The modeling approach can easily accommodate nuclear compressibility and lamina-areal expansion by incorporating a bulk modulus and area modulus, as we have done previously in Li et al. (Li et al., 2015).
Because the calculated nuclear shapes are unique, limiting geometric shapes constrained by constant lamina surface area and constant nuclear volume, any resistance to bending of the nuclear lamina and/or the nuclear envelope is not relevant for predicting the shapes. If bending stiffness of the lamina is large enough, it could, in principle, affect the calculated pressures and tensions. The surface bending energy per unit area can be calculated as
Our results predict that nuclear pressure and lamina tension should arise in cell geometries that fully unfold the lamina excess area (which is the case for most mammalian cells in culture). This emphasizes the key mechanical role that the nuclear lamina plays in imparting tension to the nuclear surface. The lamina can protect the nucleus from extreme deformations, while otherwise permitting mechanical compliance due to its excess area. For example, nuclear pressure and the resulting lamina tension explain the source and magnitude of forces exerted on microposts which indent nuclei (Katiyar et al., 2022) in migrating cells (c.f. Figure 8). They also explain how nuclei pass by the obstacles unimpeded. In contrast, cells without lamin A/C appeared to lack surface tension, resulting in the entanglement of highly deformed nuclei on the obstacles. Similarly, nuclei in lamin A/C-null cells flatten more than in wildtype spread cells (Li et al., 2015), again implying that the constant-surface area constraint on nuclear shapes requires lamin A/C.
The prediction of tension in the lamina upon unfolding is also consistent with the observation that mechanosensitive yes-associated protein (YAP) import to the nucleus correlates with nuclear unwrinkling in cells in 2D culture (Cosgrove et al., 2021), and that nuclei rupture during stretching of the lamina during cell migration through confining spaces (Hatch and Hetzer, 2016). As YAP translocation regulates gene expression, while deformation and rupture can promote DNA damage and tumorigenesis, the mechanical state of the nuclear lamina predicted by the model is likely to be important in both healthy and diseased cells. Abnormal nuclear morphologies in cultured diseased cells (such as tumor cells or progeric cells) may also be in part due to changes in nuclear pressure and tension in the lamina, which is a possibility worth exploring in the future.
In summary, the simple geometric principle invoking excess surface area explains how large nuclear deformations seen in various cell geometries do not require that the nucleus be subjected to a large force. Rather, limiting deformed nuclear shapes are geometrically determined and not mechanically determined. We anticipate that future application of this principle will yield further fundamental insights into the relationships between force, nuclear deformation, and cell function in healthy and diseased tissues.
5 Methods
5.1 Geometric prediction of cell and nuclear shapes in axisymmetric spread cells
Here we derive the equations describing the general shape, surface area, and volume of an axisymmetric surface of constant mean curvature. Next, the equations are used for the various cell surfaces to predict the axisymmetric cell shape and nuclear shape. Let
where s is distance along the arc-length. Accounting for the curvatures along the arc-length and the orthogonal azimuthal direction, the mean curvature of the axisymmetric surface is
Upon changing variables to R and z, Eq 7 can be written,
Rearranging and integrating with respect to z yields
where C is a constant, thus
To integrate Eq. 10, it can be rewritten by replacing parameters
where
Note that the original parameters C and H can be recovered from
Now, a new variable
where
such that
(both sign possibilities in Eq. 11 are now accounted for by allowing positive and negative values of
this change in variable simplifies Eq. 6 to be:
Note that
where and
The negative sign in Eq. 20 is used when
Finally, the enclosed volume between
The above results will now be applied to cortical, nuclear, and joint surfaces, while accounting for the boundary conditions, constraints, and the junction between them at point
where
with parameter
where, for curvature
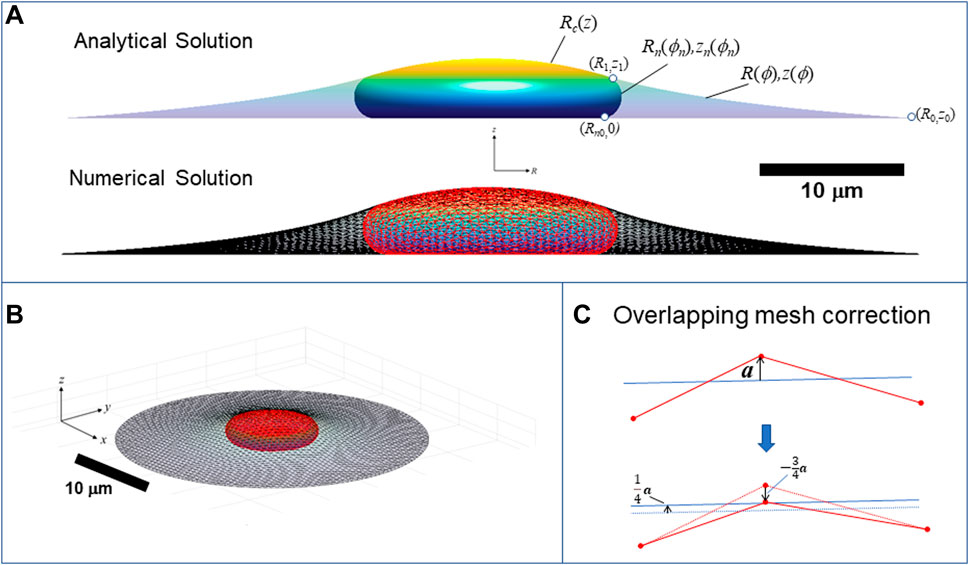
FIGURE 9. Calculation of three-dimensional cell and nuclear shapes. (A) Analytical axisymmetric surfaces of constant mean curvature for the cortical surface interface with the surroundings, (R,z), nucleus-cytoplasm interface containing the nuclear lamina, (Rn,zn), and joint nucleus-cortical interface with the surroundings, Rc(z). Surfaces are matched at point (R1,z1), and Rn is the radius to which the nucleus presses against the substratum. The calculation shown here is for V = 900 μm3, Vcell = 3.4V, ε = 0.45, and spread radius of R0 = 30 μm (z0 = 0), (B) 3D numerical calculation for the same conditions obtained minimizing the surface areas and simultaneously optimizing the triangular mesh by maintaining a centroidal Voronoi tessellation using the algorithm in (Pan et al., 2012). Nuclear and cortical surfaces were solved simultaneously for the for the given adhesion footprint under the constraints of constant nuclear surface area, nuclear volume, and cell volume. The method is validated by close agreement with the exact analytical solution for an axisymmetric spread cell. (B) Elevated perspective of the same 3D cell from (A). (C) Illustration of algorithm for preventing the crossing of meshes. When a vertex point (shown as red dot on projected triangle edges) crosses an opposing mesh triangle surface (indicated by blue line), with distance vector from the nearest triangle surface
Finally, the joint cortex-lamina surface capping the cell,
The volume and surface area of a spherical cap of height are
The parameters
thus
Also,
At this point, the cortex and nuclear profiles can be calculated for given values of parameters
Here, Eqs 21, 22 are used to calculate
5.2 Calculation of cell and nuclear shape in 3D geometries
Unlike the axisymmetric case, three dimensional geometries do not generally permit analytical solutions of cell and nuclear shapes. Instead, surfaces of constant mean curvature for the cell and nucleus were calculated using an optimization algorithm to minimize the surface areas under the constraints of constant cell and nuclear volume for a given cell geometry. Surfaces of constant mean curvature with constraints were generated using the approach of Pan et al. (Pan et al., 2012) which minimizes surface area of a triangular mesh
where the integrals are over the area of the Voronoi cells surrounding each of the vertices. Accounting for the volume and area constraints,
The area and volume stiffness parameters,
In the optimization algorithm, opposing mesh surfaces were prevented from overlapping by correcting displacements of vertices which cross the triangle faces of the opposing mesh surface, while simultaneously displacing the vertices of the opposing triangle in the opposite direction (Figure 9C). If a is the vector orthogonal from the surface to the uncorrected overlapping position of the vertex point, then the vertex position correction is
Data availability statement
The original contributions presented in the study are included in the article, further inquiries can be directed to the corresponding author.
Author contributions
RD and TL developed the concepts and ideas for this study. RD derived the model equations, performed the calculations, prepared the Figures, and wrote the first draft of the manuscript. TL wrote sections of the manuscript. All authors contributed to the article and approved the submitted version.
Funding
This work was supported by NIH U01 CA225566 (TL and RD), and a CPRIT established investigator award Grant No. RR200043 (TL).
Acknowledgments
We thank Christina Dubell for collecting confocal images of the nucleus and cell in some of the figures.
Conflict of interest
The authors declare that the research was conducted in the absence of any commercial or financial relationships that could be construed as a potential conflict of interest.
Publisher’s note
All claims expressed in this article are solely those of the authors and do not necessarily represent those of their affiliated organizations, or those of the publisher, the editors and the reviewers. Any product that may be evaluated in this article, or claim that may be made by its manufacturer, is not guaranteed or endorsed by the publisher.
References
Agrawal, A., and Lele, T. P. (2020). Geometry of the nuclear envelope determines its flexural stiffness. Mol. Biol. Cell 31, 1815–1821. doi:10.1091/mbc.E20-02-0163
Alam, S., Lovett, D. B., Dickinson, R. B., Roux, K. J., and Lele, T. P. (2014). Nuclear forces and cell mechanosensing. Prog. Mol. Biol. Transl. Sci. 126, 205–215. doi:10.1016/B978-0-12-394624-9.00008-7
Caille, N., Thoumine, O., Tardy, Y., and Meister, J. J. (2002). Contribution of the nucleus to the mechanical properties of endothelial cells. J. Biomech. 35, 177–187. doi:10.1016/s0021-9290(01)00201-9
Chen, N. Y., Yang, Y., Weston, T. A., Belling, J. N., Heizer, P., Tu, Y., et al. (2019). An absence of lamin B1 in migrating neurons causes nuclear membrane ruptures and cell death. Proc. Natl. Acad. Sci. U. S. A. 116, 25870–25879. doi:10.1073/pnas.1917225116
Cosgrove, B. D., Loebel, C., Driscoll, T. P., Tsinman, T. K., Dai, E. N., Heo, S. J., et al. (2021). Nuclear envelope wrinkling predicts mesenchymal progenitor cell mechano-response in 2D and 3D microenvironments. Biomaterials 270, 120662. doi:10.1016/j.biomaterials.2021.120662
Dahl, K. N., Engler, A. J., Pajerowski, J. D., and Discher, D. E. (2005). Power-law rheology of isolated nuclei with deformation mapping of nuclear substructures. Biophys. J. 89, 2855–2864. doi:10.1529/biophysj.105.062554
Dahl, K. N., Kahn, S. M., Wilson, K. L., and Discher, D. E. (2004). The nuclear envelope lamina network has elasticity and a compressibility limit suggestive of a molecular shock absorber. J. Cell Sci. 117, 4779–4786. doi:10.1242/jcs.01357
Denais, C. M., Gilbert, R. M., Isermann, P., McGregor, A. L., te Lindert, M., Weigelin, B., et al. (2016). Nuclear envelope rupture and repair during cancer cell migration. Science 352, 353–358. doi:10.1126/science.aad7297
Dickinson, R. B., Katiyar, A., Dubell, C. R., and Lele, T. P. (2022). Viscous shaping of the compliant cell nucleus. Apl. Bioeng. 6, 010901. doi:10.1063/5.0071652
Dupont, S., Morsut, L., Aragona, M., Enzo, E., Giulitti, S., Cordenonsi, M., et al. (2011). Role of YAP/TAZ in mechanotransduction. Nature 474, 179–183. doi:10.1038/nature10137
Elosegui-Artola, A., Andreu, I., Beedle, A. E. M., Lezamiz, A., Uroz, M., Kosmalska, A. J., et al. (2017). Force triggers YAP nuclear Entry by regulating Transport across nuclear pores. Cell 171, 1397–1410. doi:10.1016/j.cell.2017.10.008
Erdel, F., Baum, M., and Rippe, K. (2015). The viscoelastic properties of chromatin and the nucleoplasm revealed by scale-dependent protein mobility. J. Phys. Condens Matter 27, 064115. doi:10.1088/0953-8984/27/6/064115
Friedl, P., Wolf, K., and Lammerding, J. (2011). Nuclear mechanics during cell migration. Curr. Opin. Cell Biol. 23, 55–64. doi:10.1016/j.ceb.2010.10.015
Guilak, F., Tedrow, J. R., and Burgkart, R. (2000). Viscoelastic properties of the cell nucleus. Biochem. Biophys. Res. Commun. 269, 781–786. doi:10.1006/bbrc.2000.2360
Harada, T., Swift, J., Irianto, J., Shin, J. W., Spinler, K. R., Athirasala, A., et al. (2014). Nuclear lamin stiffness is a barrier to 3D migration, but softness can limit survival. J. Cell Biol. 204, 669–682. doi:10.1083/jcb.201308029
Hatch, E. M., and Hetzer, M. W. (2016). Nuclear envelope rupture is induced by actin-based nucleus confinement. J. Cell Biol. 215, 27–36. doi:10.1083/jcb.201603053
Helfrich, W. (1973). Elastic properties of lipid bilayers: Theory and possible experiments. Z Naturforsch C 28, 693–703. doi:10.1515/znc-1973-11-1209
Ivanovska, I., Swift, J., Harada, T., Pajerowski, J. D., and Discher, D. E. (2010). Physical plasticity of the nucleus and its manipulation. Methods Cell Biol. 98, 207–220. doi:10.1016/S0091-679X(10)98009-6
Jana, A., Tran, A., Gill, A., Kiepas, A., Kapania, R. K., Konstantopoulos, K., et al. (2022). Sculpting rupture-Free nuclear shapes in fibrous environments. Adv. Sci. (Weinh) 9, e2203011. doi:10.1002/advs.202203011
Janshoff, A. (2021). Viscoelastic properties of epithelial cells. Biochem. Soc. Trans. 49, 2687–2695. doi:10.1042/BST20210476
Kalukula, Y., Stephens, A. D., Lammerding, J., and Gabriele, S. (2022). Mechanics and functional consequences of nuclear deformations. Nat. Rev. Mol. Cell Biol. 23, 583–602. doi:10.1038/s41580-022-00480-z
Katiyar, A., Antani, J. D., McKee, B. P., Gupta, R., Lele, P. P., and Lele, T. P. (2021). A method for direct imaging of x-z cross-sections of fluorescent samples. J. Microsc. 281, 224–230. doi:10.1111/jmi.12965
Katiyar, A., Tocco, V. J., Li, Y., Aggarwal, V., Tamashunas, A. C., Dickinson, R. B., et al. (2019). Nuclear size changes caused by local motion of cell boundaries unfold the nuclear lamina and dilate chromatin and intranuclear bodies. Soft Matter 15, 9310–9317. doi:10.1039/c9sm01666j
Katiyar, A., Zhang, J., Antani, J. D., Yu, Y., Scott, K. L., Lele, P. P., et al. (2022). The nucleus bypasses obstacles by deforming like a drop with surface tension mediated by lamin A/C. Adv. Sci. (Weinh) 9, e2201248. doi:10.1002/advs.202201248
Keizer, V. I. P., Grosse-Holz, S., Woringer, M., Zambon, L., Aizel, K., Bongaerts, M., et al. (2022). Live-cell micromanipulation of a genomic locus reveals interphase chromatin mechanics. Science 377, 489–495. doi:10.1126/science.abi9810
Lele, T. P., Dickinson, R. B., and Gundersen, G. G. (2018). Mechanical principles of nuclear shaping and positioning. J. Cell Biol. 217, 3330–3342. doi:10.1083/jcb.201804052
Li, Y., Lovett, D., Zhang, Q., Neelam, S., Kuchibhotla, R. A., Zhu, R., et al. (2015). Moving cell boundaries drive nuclear shaping during cell spreading. Biophysical J. 109, 670–686. doi:10.1016/j.bpj.2015.07.006
Lomakin, A. J., Cattin, C. J., Cuvelier, D., Alraies, Z., Molina, M., Nader, G. P. F., et al. (2020). The nucleus acts as a ruler tailoring cell responses to spatial constraints. Science 370, eaba2894. doi:10.1126/science.aba2894
Lorber, D., Rotkopf, R., and Volk, T. (2020). A minimal constraint device for imaging nuclei in live Drosophila contractile larval muscles reveals novel nuclear mechanical dynamics. Lab. Chip 20, 2100–2112. doi:10.1039/d0lc00214c
Nader, G. P. F., Aguera-Gonzalez, S., Routet, F., Gratia, M., Maurin, M., Cancila, V., et al. (2021). Compromised nuclear envelope integrity drives TREX1-dependent DNA damage and tumor cell invasion. Cell 184, 5230–5246 e22. doi:10.1016/j.cell.2021.08.035
Neelam, S., Chancellor, T. J., Li, Y., Nickerson, J. A., Roux, K. J., Dickinson, R. B., et al. (2015). Direct force probe reveals the mechanics of nuclear homeostasis in the mammalian cell. Proc. Natl. Acad. Sci. U. S. A. 112, 5720–5725. doi:10.1073/pnas.1502111112
Neelam, S., Hayes, P. R., Zhang, Q., Dickinson, R. B., and Lele, T. P. (2016). Vertical uniformity of cells and nuclei in epithelial monolayers. Sci. Rep. 6, 19689. doi:10.1038/srep19689
Pajerowski, J. D., Dahl, K. N., Zhong, F. L., Sammak, P. J., and Discher, D. E. (2007). Physical plasticity of the nucleus in stem cell differentiation. Proc. Natl. Acad. Sci. 104, 15619–15624. doi:10.1073/pnas.0702576104
Pan, H., Choi, Y.-K., Liu, Y., Hu, W., Du, Q., Polthier, K., et al. (2012). Constant mean curvature surfaces. ACM Trans. Graph. 31, 85.
Persson, P.-O., and Strang, G. (2004). A simple mesh generator in MATLAB. SIAM Rev. 46 (2), 329–345. doi:10.1137/s0036144503429121
Plateau, J. (1873). Statique expérimentale et théorique des liquides soumis aux seulesforces moléculaires. Gauthier-Villars.
Rowat, A. C., Jaalouk, D. E., Zwerger, M., Ung, W. L., Eydelnant, I. A., Olins, D. E., et al. (2013). Nuclear envelope composition determines the ability of neutrophil-type cells to passage through micron-scale constrictions. J. Biol. Chem. 288, 8610–8618. doi:10.1074/jbc.M112.441535
Shin, J. W., Spinler, K. R., Swift, J., Chasis, J. A., Mohandas, N., and Discher, D. E. (2013). Lamins regulate cell trafficking and lineage maturation of adult human hematopoietic cells. Proc. Natl. Acad. Sci. 110, 18892–18897. doi:10.1073/pnas.1304996110
Singh, I., and Lele, T. P. (2022). Nuclear morphological abnormalities in cancer – a search for unifying mechanisms. Heidelberg, Germany: Springer.
Smith, E. R., Meng, Y., Moore, R., Tse, J. D., Xu, A. G., and Xu, X. X. (2017). Nuclear envelope structural proteins facilitate nuclear shape changes accompanying embryonic differentiation and fidelity of gene expression. BMC Cell Biol. 18, 8. doi:10.1186/s12860-017-0125-0
Stephens, A. D., Banigan, E. J., Adam, S. A., Goldman, R. D., and Marko, J. F. (2017). Chromatin and lamin A determine two different mechanical response regimes of the cell nucleus. Mol. Biol. Cell 28, 1984–1996. doi:10.1091/mbc.E16-09-0653
Swift, J., Ivanovska, I. L., Buxboim, A., Harada, T., Dingal, P. C., Pinter, J., et al. (2013). Nuclear lamin-A scales with tissue stiffness and enhances matrix-directed differentiation. Science 341, 1240104. doi:10.1126/science.1240104
Thiam, H. R., Vargas, P., Carpi, N., Crespo, C. L., Raab, M., Terriac, E., et al. (2016). Perinuclear Arp2/3-driven actin polymerization enables nuclear deformation to facilitate cell migration through complex environments. Nat. Commun. 7, 10997. doi:10.1038/ncomms10997
Tocco, V. J., Li, Y., Christopher, K. G., Matthews, J. H., Aggarwal, V., Paschall, L., et al. (2018). The nucleus is irreversibly shaped by motion of cell boundaries in cancer and non-cancer cells. J. Cell Physiol. 233, 1446–1454. doi:10.1002/jcp.26031
Vaziri, A., Lee, H., and Mofrad, M. (2006). Deformation of the cell nucleus under indentation: Mechanics and mechanisms. J. Mater. Res. 21, 2126–2135. doi:10.1557/jmr.2006.0262
Vaziri, A., and Mofrad, M. R. (2007). Mechanics and deformation of the nucleus in micropipette aspiration experiment. J. Biomech. 40, 2053–2062. doi:10.1016/j.jbiomech.2006.09.023
Versaevel, M., Grevesse, T., and Gabriele, S. (2012). Spatial coordination between cell and nuclear shape within micropatterned endothelial cells. Nat. Commun. 3, 671. doi:10.1038/ncomms1668
Vortmeyer-Krause, M., Lindert, M. t., Riet, J. t., Boekhorst, V. t., Marke, R., Perera, R., et al. (2020). Lamin B2 follows lamin A/C- mediated nuclear mechanics and cancer cell invasion efficacy. bioRxiv, 028969.
Wintner, O., Hirsch-Attas, N., Schlossberg, M., Brofman, F., Friedman, R., Kupervaser, M., et al. (2020). A unified linear viscoelastic model of the cell nucleus defines the mechanical contributions of lamins and chromatin. Adv. Sci. (Weinh) 7, 1901222. doi:10.1002/advs.201901222
Wolf, K., Te Lindert, M., Krause, M., Alexander, S., Te Riet, J., Willis, A. L., et al. (2013). Physical limits of cell migration: Control by ECM space and nuclear deformation and tuning by proteolysis and traction force. J. Cell Biol. 201, 1069–1084. doi:10.1083/jcb.201210152
Wu, Y. K., Umeshima, H., Kurisu, J., and Kengaku, M. (2018). Nesprins and opposing microtubule motors generate a point force that drives directional nuclear motion in migrating neurons. Development 145, dev158782. doi:10.1242/dev.158782
Zhang, Q., Tamashunas, A. C., Agrawal, A., Torbati, M., Katiyar, A., Dickinson, R. B., et al. (2019). Local, transient tensile stress on the nuclear membrane causes membrane rupture. Mol. Biol. Cell 30, 899–906. doi:10.1091/mbc.E18-09-0604
Zuela-Sopilniak, N., Bar-Sela, D., Charar, C., Wintner, O., Gruenbaum, Y., and Buxboim, A. (2020). Measuring nucleus mechanics within a living multicellular organism: Physical decoupling and attenuated recovery rate are physiological protective mechanisms of the cell nucleus under high mechanical load. Mol. Biol. Cell 31, 1943–1950. doi:10.1091/mbc.E20-01-0085
Keywords: nuclear shape, nuclear morphology and function, mechanotranduction, cell shape, cell cortex, nuclear lamina
Citation: Dickinson RB and Lele TP (2023) Nuclear shapes are geometrically determined by the excess surface area of the nuclear lamina. Front. Cell Dev. Biol. 11:1058727. doi: 10.3389/fcell.2023.1058727
Received: 30 September 2022; Accepted: 30 May 2023;
Published: 15 June 2023.
Edited by:
Srimonta Gayen, Indian Institute of Science (IISc), IndiaReviewed by:
Chris Toseland, The University of Sheffield, United KingdomThomas Cremer, Ludwig Maximilian University of Munich, Germany
Copyright © 2023 Dickinson and Lele. This is an open-access article distributed under the terms of the Creative Commons Attribution License (CC BY). The use, distribution or reproduction in other forums is permitted, provided the original author(s) and the copyright owner(s) are credited and that the original publication in this journal is cited, in accordance with accepted academic practice. No use, distribution or reproduction is permitted which does not comply with these terms.
*Correspondence: Richard B. Dickinson, ZGlja2luc29AdWZsLmVkdQ==