Abstract
In vitro models allow for the study of developmental processes outside of the embryo. To gain access to the cells mediating digit and joint development, we identified a unique property of undifferentiated mesenchyme isolated from the distal early autopod to autonomously re-assemble forming multiple autopod structures including: digits, interdigital tissues, joints, muscles and tendons. Single-cell transcriptomic analysis of these developing structures revealed distinct cell clusters that express canonical markers of distal limb development including: Col2a1, Col10a1, and Sp7 (phalanx formation), Thbs2 and Col1a1 (perichondrium), Gdf5, Wnt5a, and Jun (joint interzone), Aldh1a2 and Msx1 (interdigital tissues), Myod1 (muscle progenitors), Prg4 (articular perichondrium/articular cartilage), and Scx and Tnmd (tenocytes/tendons). Analysis of the gene expression patterns for these signature genes indicates that developmental timing and tissue-specific localization were also recapitulated in a manner similar to the initiation and maturation of the developing murine autopod. Finally, the in vitro digit system also recapitulates congenital malformations associated with genetic mutations as in vitro cultures of Hoxa13 mutant mesenchyme produced defects present in Hoxa13 mutant autopods including digit fusions, reduced phalangeal segment numbers, and poor mesenchymal condensation. These findings demonstrate the robustness of the in vitro digit system to recapitulate digit and joint development. As an in vitro model of murine digit and joint development, this innovative system will provide access to the developing limb tissues facilitating studies to discern how digit and articular joint formation is initiated and how undifferentiated mesenchyme is patterned to establish individual digit morphologies. The in vitro digit system also provides a platform to rapidly evaluate treatments aimed at stimulating the repair or regeneration of mammalian digits impacted by congenital malformation, injury, or disease.
1 Introduction
Congenital malformations of the hand or foot affect approximately one to two children/1,000 births in the United States annually (Linder et al., 2009; Goldfarb et al., 2015; Goldfarb et al., 2017; Jain et al., 2020). Despite affecting >8,000 children/year, the cellular and molecular mechanisms involved in digit and joint formation are not well understood. A significant challenge to advance our understanding of these mechanisms is the inability to directly probe mammalian cell populations as they participate in the formation of digit/joint structures. To address this challenge, Solursh and colleagues developed the micromass assay, an in vitro approach that identified the capacity of cultured limb mesenchyme to recapitulate endochondral skeletal development (Ahrens et al., 1977; Solursh et al., 1978; Paulsen and Solursh, 1988; Daniels et al., 1996). While micromass assays have advanced our understanding of cellular and molecular processes mediating mesenchymal cell proliferation and condensation, apoptosis, and matrix mineralization necessary for endochondral skeletal development, this approach has not provided insight into how limb mesenchyme is instructed to form additional musculoskeletal components of the hand and foot (Oberlender and Tuan, 1994; Mello and Tuan, 1999; DeLise et al., 2000; Delise and Tuan, 2002; Daumer et al., 2004; Zhang et al., 2004; Mello and Tuan, 2006; Handschel et al., 2007; Pirosa et al., 2019).
To address this knowledge gap, we expanded our initial finding that cells expressing Hoxa13 are competent to form digit-like structures in vitro and examined the full developmental potential of distal limb bud mesenchyme (Stadler et al., 2001). Remarkably, when placed in culture, distal limb cells exhibit robust recapitulation of hand/foot development producing multiple musculoskeletal tissues/structures beyond the digit endochondral ossification including: interdigital tissues, joint interzones, tendons, fetal muscle, and perichondrium. Access provided to multiple mammalian hand/foot tissues as they develop in the in vitro digit in a dish system (DID) represents a significant breakthrough in our ability to probe and functionally characterize the molecular programs controlling mammalian limb development using high-resolution single-cell transcriptomics and hybridization chain reaction RNA fluorescence in situ hybridization (HCR RNA-FISH).
The DID system also appears competent to model congenital defects caused by loss of gene function, as digit structures formed using Hoxa13 homozygous mutant cells reproduce defects in mesenchymal condensation and digit formation reported in Hoxa13 mutant embryos (Fromental-Ramain et al., 1996; Stadler et al., 2001; Perez et al., 2010; Bastida et al., 2020). The combined assessment of control and mutant DID cultures provides a unique resource to model congenital malformations and to rapidly evaluate therapies aimed at correcting congenital malformations or to stimulate the regeneration of mammalian digits impacted by injury or disease.
Using three developmental time points, we present a comprehensive analysis of the DID system examining the transcriptomes present in >70,000 cells as they participate in the formation of hand/foot musculoskeletal tissues at single cell resolution. This analysis provides new insights into the heterogeneity of progenitor cell types present in undifferentiated distal limb mesenchyme as well as a confirmation that the DID system closely models single-cell transcriptomic studies of embryonic limbs including stage-, tissue-, and cell-type-specific expression of developmental genes (Desanlis et al., 2020; Kelly et al., 2020). Based on our transcriptomic analysis of DID cultures, we identify six distinct autopod developmental trajectories recapitulated by the DID system: endochondral cartilage and bone, perichondrium, interdigital tissues, joints, fetal muscle, and tendons. Finally, limb developmental gene expression patterns were also recapitulated by the tissues/structures forming in the DID system, providing additional confirmation that hand/foot development is modeled by this system.
2 Materials and methods
2.1 Mice
All mice were housed in a specific pathogen-free facility at the Portland Shriners Hospital. Embryos were obtained from timed matings of CD-1 mice (Charles River Labs), or from timed matings of Hoxa13GFP mice maintained on a C57BL/6 and CD-1 mixed genetic background as described (Stadler et al., 2001). Estimated embryonic gestational age was determined by timed matings using the detection of a vaginal plug to establish embryonic day (E) 0.5 as described (Mader et al., 2009). Genotyping of Hoxa13GFP embryos was accomplished using PCR and yolk-sac DNA as described (Stadler et al., 2001; Morgan et al., 2003).
2.2 Digits in a dish (DID) cultures
Staged limb buds (Wanek et al., 1989) from wildtype embryos at E11.5 were collected in 4°C Ca2+- and Mg2+-free phosphate-buffered saline (PBS; Gibco/BRL). Distal forelimb mesenchyme was micro-dissected using fine tungsten needles and scissors and a Leica MZ12 stereoscope. Dissected embryonic limb tissues were pooled into a 2 mL microcentrifuge tube and dissociated at 37°C for 13 minutes in Ca2+- and Mg2+-free PBS (Gibco/BRL) containing 0.1% trypsin and 0.1% collagenase (Type IV) as described (Owens and Solursh, 1982), with a vigorous flick of the microcentrifuge tube after the first 5 minutes. After the 13-min digestion, 1 mL of Dulbecco’s MEM media containing 10% FBS supplemented with non-essential amino acids, 50 U/mL penicillin and 25 μg/mL streptomycin was added to the digest with a wide bore pipette, followed by gentle pipetting 100 times with a sterile transfer pipette. The limb bud cell suspension was then passed through sterile 74 μm polyester mesh (Costar Netwells). The flow-through was centrifuged at a relative centrifugal force (RCF) of 180 g for 5 minutes in a sterile 2 mL microcentrifuge tube. The supernatant was removed and 1 mL of Dulbecco’s MEM media containing 10% FBS supplemented with non-essential amino acids, 50 U/mL penicillin and 25 μg/mL streptomycin was added to the pellet by gently trickling down the side of the 2 mL microcentrifuge tube. The tube was gently agitated to dissociate the cell pellet. The cell suspension was centrifuged for a second time at an RCF of 180 g for 5 minutes. The supernatant was removed, leaving 100 μL of supernatant in the tube which was used to dissociate the cell pellet. The cell suspension was counted on a hemocytometer and diluted to a final concentration of 2 × 10⁷cells/mL with Dulbecco’s MEM media containing 10% FBS supplemented with non-essential amino acids, 50 U/mL penicillin and 25 μg/mL streptomycin. Cell suspensions were inoculated onto 60 mm Falcon tissue culture dishes as described (Ahrens et al., 1977) and placed in a 37°C incubator with a 5% CO2 atmosphere for 1 h to allow for cell attachment. After 1 h, the dishes were gently filled with a max volume of media which was changed daily. Cultures were subsequently processed for either single cell RNA sequencing, HCR RNA-FISH, or immunohistochemistry (IHC) (Figure 1).
FIGURE 1
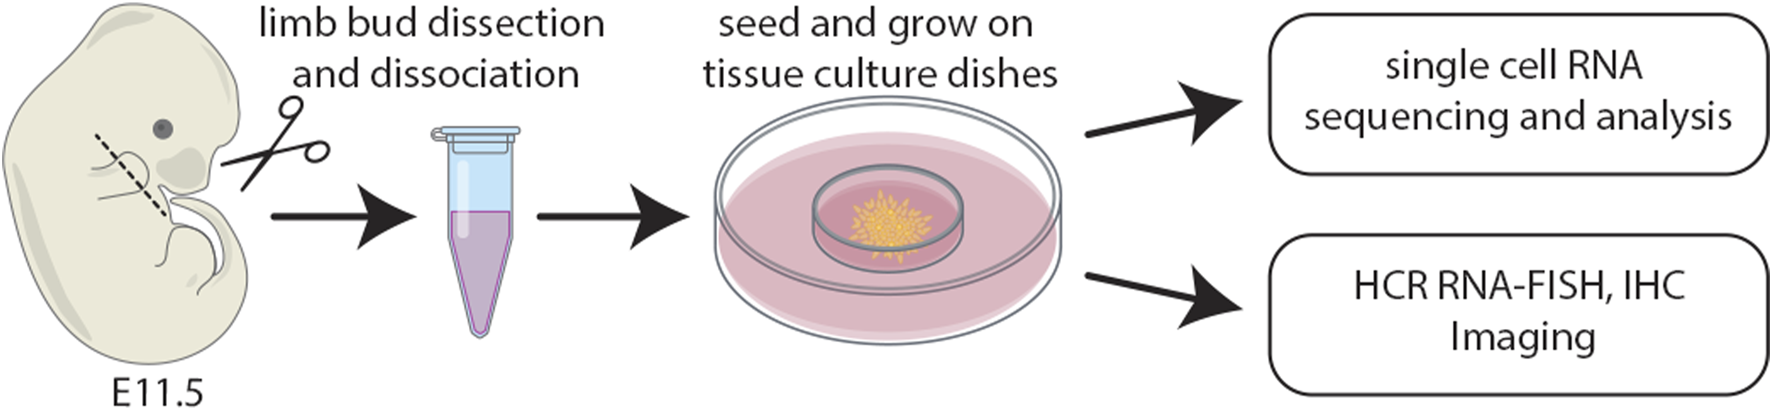
Schematic of the experimental design whereby distal limb mesenchyme was dissected, dissociated, and single cells captured. The distal most third of forelimb buds were micro-dissected and pooled from E11.5 mouse embryos. Cell suspensions were inoculated onto 60 mm tissue culture dishes and subsequently processed for either single cell RNA sequencing, HCR RNA-FISH, or IHC.
2.3 Single-cell isolation, capture, library construction, and sequencing
Two independent DID cultures were processed as separate replicates for scRNAseq analysis of Day 2, 7 and 10 time points following the cell dissociation and library preparation protocols as described by the manufacturer (10X Genomics). Dissociated cells were centrifuged at an RCF of 180 g for 5 minutes. Following centrifugation, the cells were washed in PBS containing 0.4% bovine serum albumin and strained through a 75 µm nylon mesh (Costar Netwells). After straining, cells were counted and adjusted to a concentration of 1,000 cells/μL for the single-cell RNAseq pipeline.
Single cells from each replicate were isolated using the 10x Genomics Chromium platform at the OHSU Integrated Genomics Laboratory. Replicate DID culture libraries were made with the 10x Genomics 3′Gene Expression, GEX V3.1 chromium kit. All libraries were sequenced at the OHSU Integrated Genomics Laboratory on the Illumina NovaSeq 6,000 sequencing system.
The following number of cells were used to produce the libraries for replicate scRNAseq analysis: Day 2, replicate A (11,518 cells, 68,572 average reads per cell), Day 2, replicate B (20,188 cells, 39,112 average reads per cell), Day 7, replicate A (16,784 cells, 58,369 average reads per cell), Day 7, replicate B (18,049 cells, 52,673 average reads per cell), Day 10, replicate A (12,313 cells, 77,728 average reads per cell), and Day 10, replicate B (12,363 cells, 73,518 average reads per cell). After quality control and filtering, 9,448, 16,485, 13,486, 12,346, 10,385, and 9,949 estimated number of high-quality cells remained in the samples, respectively (Supplementary Table S1) (Butler et al., 2018; Stuart et al., 2019). Unbiased cell clustering based on gene expression was performed on these remaining high-quality cells. (Butler et al., 2018; Stuart et al., 2019).
2.4 Single-cell clustering and differential expression analysis
The raw scRNAseq data was processed following the 10X Genomics pipeline with Cell Ranger (version 6.1.2) software to remove low-quality reads (Zheng et al., 2017). The remaining reads were aligned to the GRCm38 murine reference genome using STAR, and gene count matrices were generated as described (Du et al., 2020). Gene count matrices were imported into the R package Seurat (version 4.1.0) for all downstream analyses as described (Stuart et al., 2019). In Seurat, additional quality filtering was performed based on the percentage of mitochondrial reads, number of unique feature counts, number of molecules detected in each cell, and percentage of ribosomal reads. Expression matrices were normalized and stabilized for technical noise variance using the SCTransform function in Seurat as described (Hafemeister and Satija, 2019). Dimension numbers used for PCA reductions were selected based on the Seurat elbow plot. Clustree plots were used to help select the resolution parameter as described (Zappia and Oshlack, 2018). Clusters were determined using the FindNeighbors and FindClusters functions implemented in Seurat, which uses a graph-based clustering approach. Uniform Manifold Approximation and Projection (UMAP) was used for dimensionality reduction. Two independent replicates were analyzed for each time point. Integration of the two replicates was performed using the PrepSCTIntegration, FindIntegrationAnchors, and IntegrateData functions, with setting the features to integrate to include all genes. In the integrated data, we regressed out the difference between the cell cycle G2M and S phase scores during the SCTransform function step. The differential expression analysis was run using the FindAllMarkers function in Seurat using the Wilcoxon rank sum test with a minimum 0.25 log fold change between clusters (logfc.threshold = 0.25) and expressed in at least 25% of cells from the cluster (min.pct = 0.25). Cell-type-specific clusters were defined by the expression of signature factors for each cell type. Visualization of candidate gene expression was made using the VlnPlot, FeaturePlot and DotPlot functions in Seurat. Parameters for the individual libraries included the percentage of mitochondrial reads (%Mito), upper limit to the number of unique feature counts (FeatUp), lower limit to the number of unique feature counts (FeatLow), percentage of ribosomal reads (%Ribo), PCA dimensions (PCAdims), and resolution (Res). In addition, a lower limit to RNA read counts (UMI counts) was set to filter signals that were overcalled as cells by Cell Ranger (UMIcount). Parameters were set as the following for the individual libraries: Day 2, replicate A (%Mito = 25, FeatUp = 7,500, FeatLow = 200, %Ribo = 35, PCAdims = 35, Res = 0.7, UMIcount = 800). Day 2, replicate B (%Mito = 25, FeatUp = 7,500, FeatLow = 200, %Ribo = 35, PCAdims = 35, Res = 0.7, UMIcount = 1,000). Day 7, replicate A (%Mito = 30, FeatUp = 7,500, FeatLow = 200, %Ribo = 40, PCAdims = 35, Res = 0.5, UMIcount = 1,000). Day 7, replicate B (%Mito = 30, FeatUp = 7,500, FeatLow = 200, %Ribo = 40, PCAdims = 35, Res = 0.5, UMIcount = 1,000). Day 10, replicate A (%Mito = 40, FeatUp = 7,500, FeatLow = 200, %Ribo = 40, PCAdims = 35, Res = 0.7, UMIcount = 800). Day 10, replicate B (%Mito = 40, FeatUp = 7,500, FeatLow = 200, %Ribo = 35, PCAdims = 35, Res = 0.5, UMIcount = 800) (Supplementary Table S1).
2.5 FACS enrichment of Hoxa13GFP-expressing cells
Distal mesenchyme expressing Hoxa13GFP was collected from E11.5 heterozygous- and homozygous Hoxa13GFP mutant embryos as described (Stadler et al., 2001). The dissected mesenchyme was digested and enriched for the Hoxa13GFP-expressing cells by fluorescence activated cell sorting using a BD LSR-II (BD Biosciences) provided by the OHSU Flow Cytometry Shared Resource Facility. Heterozygous- or homozygous mutant FACS-enriched samples were used for seeding individual DID cultures as described (Stadler et al., 2001). Analysis of Hoxa13GFP-expressing cells contributing to in vitro digit formation was performed using a Zeiss LSM 700 confocal microscope. Image processing was done using Adobe Photoshop (Version 24.1.0).
2.6 Antibodies and immunohistochemistry
DID cultures were washed twice (5 minutes/wash) in PBS and fixed in 4% paraformaldehyde for 10 min at room temperature. After fixation, the samples were washed three times using room temperature PBS (5 minutes/wash) and incubated for 1 hour with PBSTMD (PBS, 2% powdered milk, 0.5% Triton X-100, 2% whole donkey serum). After 1 hour, fresh PBSTMD containing a 1:250 dilution of antibodies specific for Tenomodulin (TNMD) (Abcam: AB203676) or SOX9 (Novus Biologicals: AF3075-SP) was added to the samples which were incubated at 4°C overnight. The next day, primary antibody solutions were removed and the samples were washed three times (5 minutes/wash) in room temperature PBSTMD. After the final wash, the samples were incubated overnight at 4°C in PBSTMD containing a 1:400 dilution of a donkey anti-goat- or donkey anti-rabbit secondary antibody conjugated with Alexa 488 (Jackson ImmunoResearch Laboratories:705-545-003) or Alexa 647 (Jackson ImmunoResearch Laboratories: 711-605-152). The next day, samples were washed three times in PBS (5 minutes/wash), followed by staining with DAPI/PBS for 5 minutes (ThermoFisher: 62248). After DAPI staining, the samples were washed twice in room temperature PBS (5 minutes/wash). Samples were imaged for immunolocalization of SOX9 or TNMD using a Zeiss LSM 700 confocal microscope as described (Morgan et al., 2003). Image processing was done using Adobe Photoshop (Version 24.1.0).
2.7 Whole mount in situ hybridization analysis of Hoxa13 and tnmd expression
A 310 base-pair region corresponding to nucleotides 650–960 of the murine Hoxa13 cDNA sequence (NM_008264) was amplified from C57BL/6 genomic DNA by PCR using the following primers: A13_Exon1 F: 5′-TACCCGTGCGCCCGCAT-3′ and A13_Exon1′R: 5′-CCGTTCCAGCCGTTGGG-3’. This region was selected for Hoxa13 expression analysis due to its presence in wild-type- and Hoxa13GFP-mutant alleles. The amplified DNA region was cloned into a t-tailed vector containing RNA polymerase T3 and T7 promoters. Hoxa13 riboprobe synthesis, embryo preparation, riboprobe hybridization and colorimetric detection were performed as described (Manley and Capecchi, 1995). Embryos were photographed using a Leica MZFL12 stereoscope fitted with a Canon EOS 40D digital camera. Image processing was done using Adobe Photoshop (Version 24.1.0).
Whole-mount in situ hybridization analysis of Tnmd expression was performed as described (Shukunami et al., 2018). Briefly, embryos were fixed in 4% PFA/PBS overnight and dehydrated with methanol. After rehydration and proteinase K treatment, embryos were hybridized with DIG-labelled probes at 70°C overnight. After washing, the hybridized probes were detected by using alkaline phosphatase conjugated anti-DIG antibody (Roche) and BM purple (Roche).
2.8 Hybridization chain reaction RNA fluorescence in situ hybridization (HCR RNA-FISH)
We adapted the HCR RNA-FISH protocol for fixed frozen sections on slides for use with the DID cultures (Molecular Instruments). Gene-specific HCR probe sets, buffers, and amplification hairpins were purchased from Molecular Instruments (Los Angeles, CA) (Table 1). DID cultures used for HCR RNA-FISH were grown on 60 mm × 15 mm Center-Well Organ Culture Dishes (Corning: Falcon Ref 353037). Media was removed and rinsed twice with phosphate buffered saline (PBS) on ice. Samples were fixed for 15 minutes with fresh 4% paraformaldehyde in PBS (PFA/PBS) at 4°C and then rinsed twice with PBS for 5 minutes. After fixation, cultures were digested with proteinase K (7 μg/mL in PBS) for 10 minutes at 37°C. Digested cultures were rinsed twice with PBT (PBS +0.1% Tween 20) for 5 minutes, and re-fixed using 4% PFA/PBS for 5 minutes. The re-fixed samples were rinsed twice with PBT for 5 min. A prehybridization step using probe hybridization buffer (Molecular Instruments) heated to 37°C was added to the samples which were then incubated in a humidified chamber for 10 minutes inside a 37°C oven. After prehybridization, a comparable volume of hybridization buffer containing the gene-specific probes (0.4 pmol/100 µL hybridization buffer) was added to the samples as recommended by the manufacturer (Molecular Instruments). Samples were incubated overnight in humidified chamber in a 37°C oven. The next day, the probe solution was removed and the plates were washed with 75% probe wash buffer/25% 5X SSCT for 15 minutes at 37°C followed by a wash using 50% probe/50% 5X SSCT for 15 minutes, 25% probe wash buffer/75% 5X SSCT for 15 minutes, 100% 5X SSCT for 15 minutes, and then 100% 5X SSCT for 5 minutes at room temperature as recommended by the manufacturer (Molecular Instruments). Samples were covered with amplification buffer (Molecular Instruments) and placed in a humidified chamber for 30 minutes at room temperature. After pre-amplification, the buffer was removed and snap-cooled amplification hairpins (6 pmol/hairpin) were added to the samples as recommended by the manufacturer (Molecular Instruments). Samples were placed in humidified chambers wrapped with aluminum foil and incubated overnight in a dark drawer at room temperature. The following day, the hairpin/amplification solution was removed and the samples were washed two times for 30 minutes in 5X SSCT at room temperature followed by a single 5-min wash in 5X SSCT. Cultures were then stained for 5 minutes with a DAPI solution as described by the manufacturer (ThermoFisher: 62248). After DAPI staining, the cultures were rinsed twice with PBS and imaged in PBS with a Zeiss LSM-700 confocal microscope. Image processing was done using Adobe Photoshop (Version 24.1.0).
TABLE 1
| Gene | Accession number | Amplifier | Probe set size |
|---|---|---|---|
| Aldh1a2 | BC_075704.1 | B3 | 20 |
| Col2a1 | NM_031163.3 | B3 | 20 |
| Gdf5 | NM_008109.3 | B4 | 20 |
| Hoxa13 | NM_008264 | B2 | 12 |
| Myod1 | NM_010866.2 | B4 | 20 |
| Prg4 | NM_021400.3 | B4 | 20 |
| Thbs2 | NM_011581.3 | B5 | 20 |
HCR RNA-FISH probe sets. Below is the list of probes used for HCR RNA-FISH in this study, including the HCR amplifier paired with each probe and the probe set size.
3 Results
3.1 Development of the digits in a dish system
While high density micromass culture of limb bud mesenchyme typically develops into rounded endochondral nodules (Ahrens et al., 1977; Solursh et al., 1978; Carlson et al., 2015), cells disassociated from the distal limb bud exhibited a remarkable capacity to reassemble in vitro, producing digit-, joint-, and carpal/tarsal-like structures with a perichondrium (Figure 2). The autonomous reassembly of this cell population into digit- and carpal/tarsal-like structures indicates an expanded hand/foot developmental program is recapitulated by the DID system without the use of instructive extracellular matrices, tissue-engineering scaffolds, or exogenous growth factor applications, other than those provided by fetal bovine serum (Ahrens et al., 1977; Solursh et al., 1978; Ahrens et al., 1979; Stadler et al., 2001; Moutos et al., 2007; Huynh et al., 2018). Testing this hypothesis, we characterized the full developmental potential of distal limb mesenchyme in DID cultures using single-cell transcriptomics and HCR RNA-FISH (Figures 1, 2).
FIGURE 2
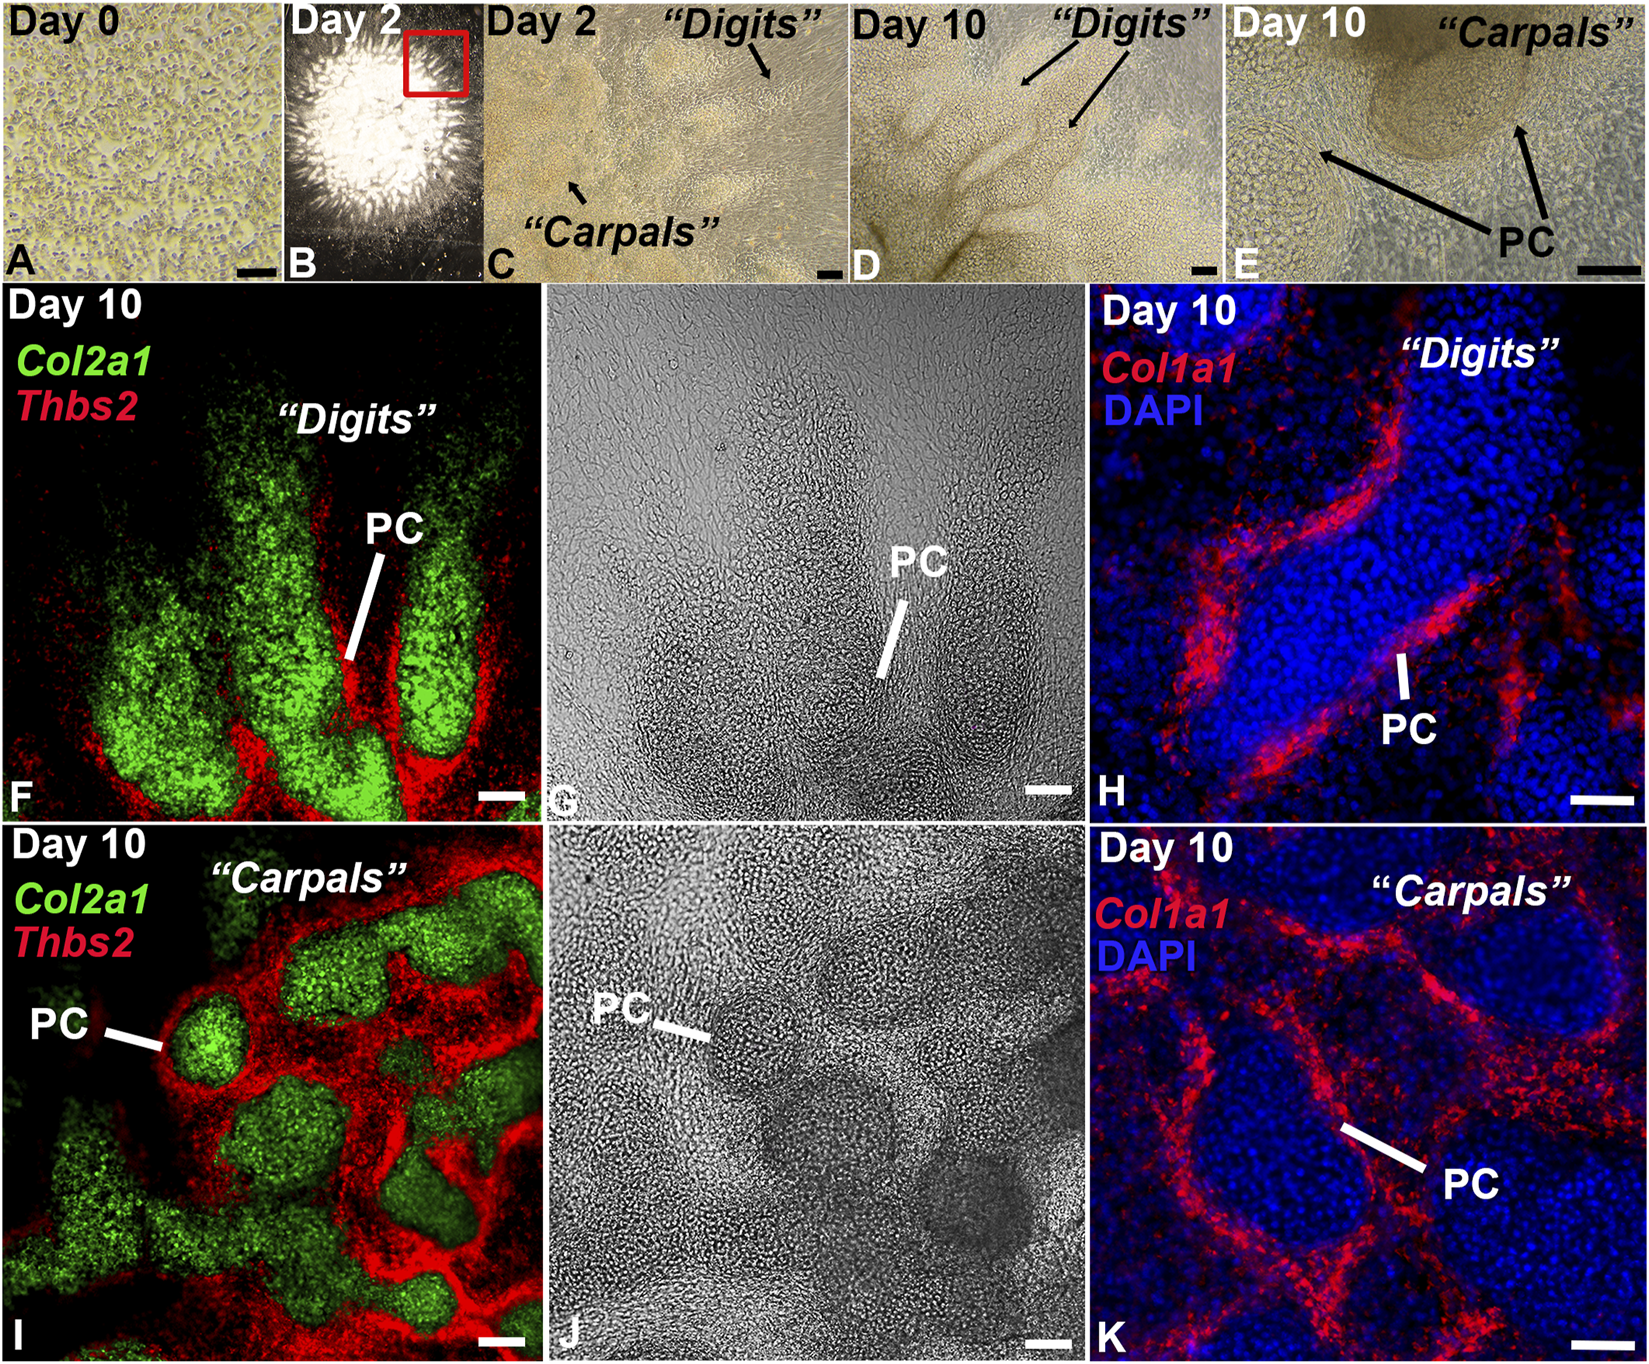
In vitro culture of distal limb mesenchyme recapitulates digit and carpal element formation. (A) Brightfield image of the disassociated E11.5 distal forelimb mesenchyme at Day 0. (B) Low magnification image of an entire DID culture at Day 2 showing re-assembly and development of the dissociated mesenchyme into digit-like projections. (C) Higher magnification image of the boxed region in panel (B). Arrows denote digit- and carpal-like elements. (D, E) Analysis of Day 10 DID cultures revealed well-formed digits and carpal elements producing a visible perichondrium (PC). (F–K) HCR RNA-FISH analysis of gene expression in Day 2 DIDs reveal robust expression of Col2a1 in the central condensations and Col1a1 and Thbs2 localizing to the tissue surrounding these structures, consistent with the formation of a perichondrium (PC). Bars = 50 µm.
3.2 Distal limb mesenchyme is comprised of heterogeneous cell types that mediate initial stages of autopod development in day 2 DID cultures
To better define the cell types and developmental programs mediating in vitro digit formation, we analyzed the transcriptomes present in DID cultures using single-cell RNA-seq (scRNAseq). Three time points were selected to define the cell-specific transcriptomes defining hand musculoskeletal development at single cell resolution using the 10X Genomics platform. A time point of two days after seeding the DID cultures (Day 2) was selected to capture transcriptomic events mediating early stages of digit initiation. A Day 7 time point was selected to capture the transitional transcriptomes mediating digit/joint specification, and a Day 10 time point was selected to detect the transcriptomes mediating the maturation of hand/foot musculoskeletal tissues and structures. Two independent samples were analyzed by scRNAseq at each time point to assess variability between DID cultures and to ensure reproducibility of the scRNAseq results.
Unbiased clustering of the integrated dataset from Day 2 scRNAseq replicates revealed 16 discrete cell populations represented by Clusters 0–15 (Figure 3; Supplementary Table S2). Cell type identity was determined using published cell-type-specific gene expression and cell annotation and ontology applications Panglao DB and ShinyGO 0.76.2 (Franzen et al., 2019; Ge et al., 2020). Cell types assigned to Cluster 8 were annotated as tenocytes based on their expression of Scx, Tnmd, and Col3a1 (Figure 3, Supplementary Table S2) (Shukunami et al., 2006; Shukunami et al., 2018; Qi et al., 2020). Cell types assigned to Cluster 5 were annotated as osteoblasts based on their expression of Cnn1, Igfbp7, and Spp1 (Figure 3, Supplementary Table S2) (Moore et al., 1991; Su et al., 2013; Wu et al., 2019; Lu et al., 2020). Chondrocytes were identified by their expression of Wwp2, Col9a1, Col2a1, Acan, and Matn4, Mia, Ostn, Snorc, and Matn1 and were assigned to Clusters 1, 7, 9, and 13 (Figure 3 and Supplementary Table S2) (Bi et al., 1999; Makihira et al., 1999; Czarny-Ratajczak et al., 2001; Moser et al., 2002; Rentsendorj et al., 2005; Domowicz et al., 2009; Groma et al., 2011; Heinonen et al., 2011; Yang et al., 2011). Cell types assigned to Clusters 10 and 12 were annotated as myocyte progenitors or myocytes based on their expression of Ttn, Myog, Myod1, Myf5, and Tnnt1 (Figure 3; Supplementary Table S2) (Tajbakhsh et al., 1996; Beauchamp et al., 2000; Linke and Kruger, 2010; Wood et al., 2013; Ganassi et al., 2018; Li et al., 2021; Yagi et al., 2021). Cell types assigned to Cluster 6 were annotated as joint interzone cells based on their expression of Ebf1, Jun, Hoxd13, and Gdf5 (Figure 3, Supplementary Table S2) (Storm and Kingsley, 1999; Kan and Tabin, 2013; Huang et al., 2016; Shwartz et al., 2016; Capellini et al., 2017; El-Magd et al., 2021). Cell types assigned to Cluster 11 were annotated as interdigital mesenchyme based on their significant expression of several interdigital tissue markers including: Hoxa13, Hoxd13, Msx1, Wnt5a, and Aldh1a2 (Figure 3; Supplementary Figure S3).
FIGURE 3
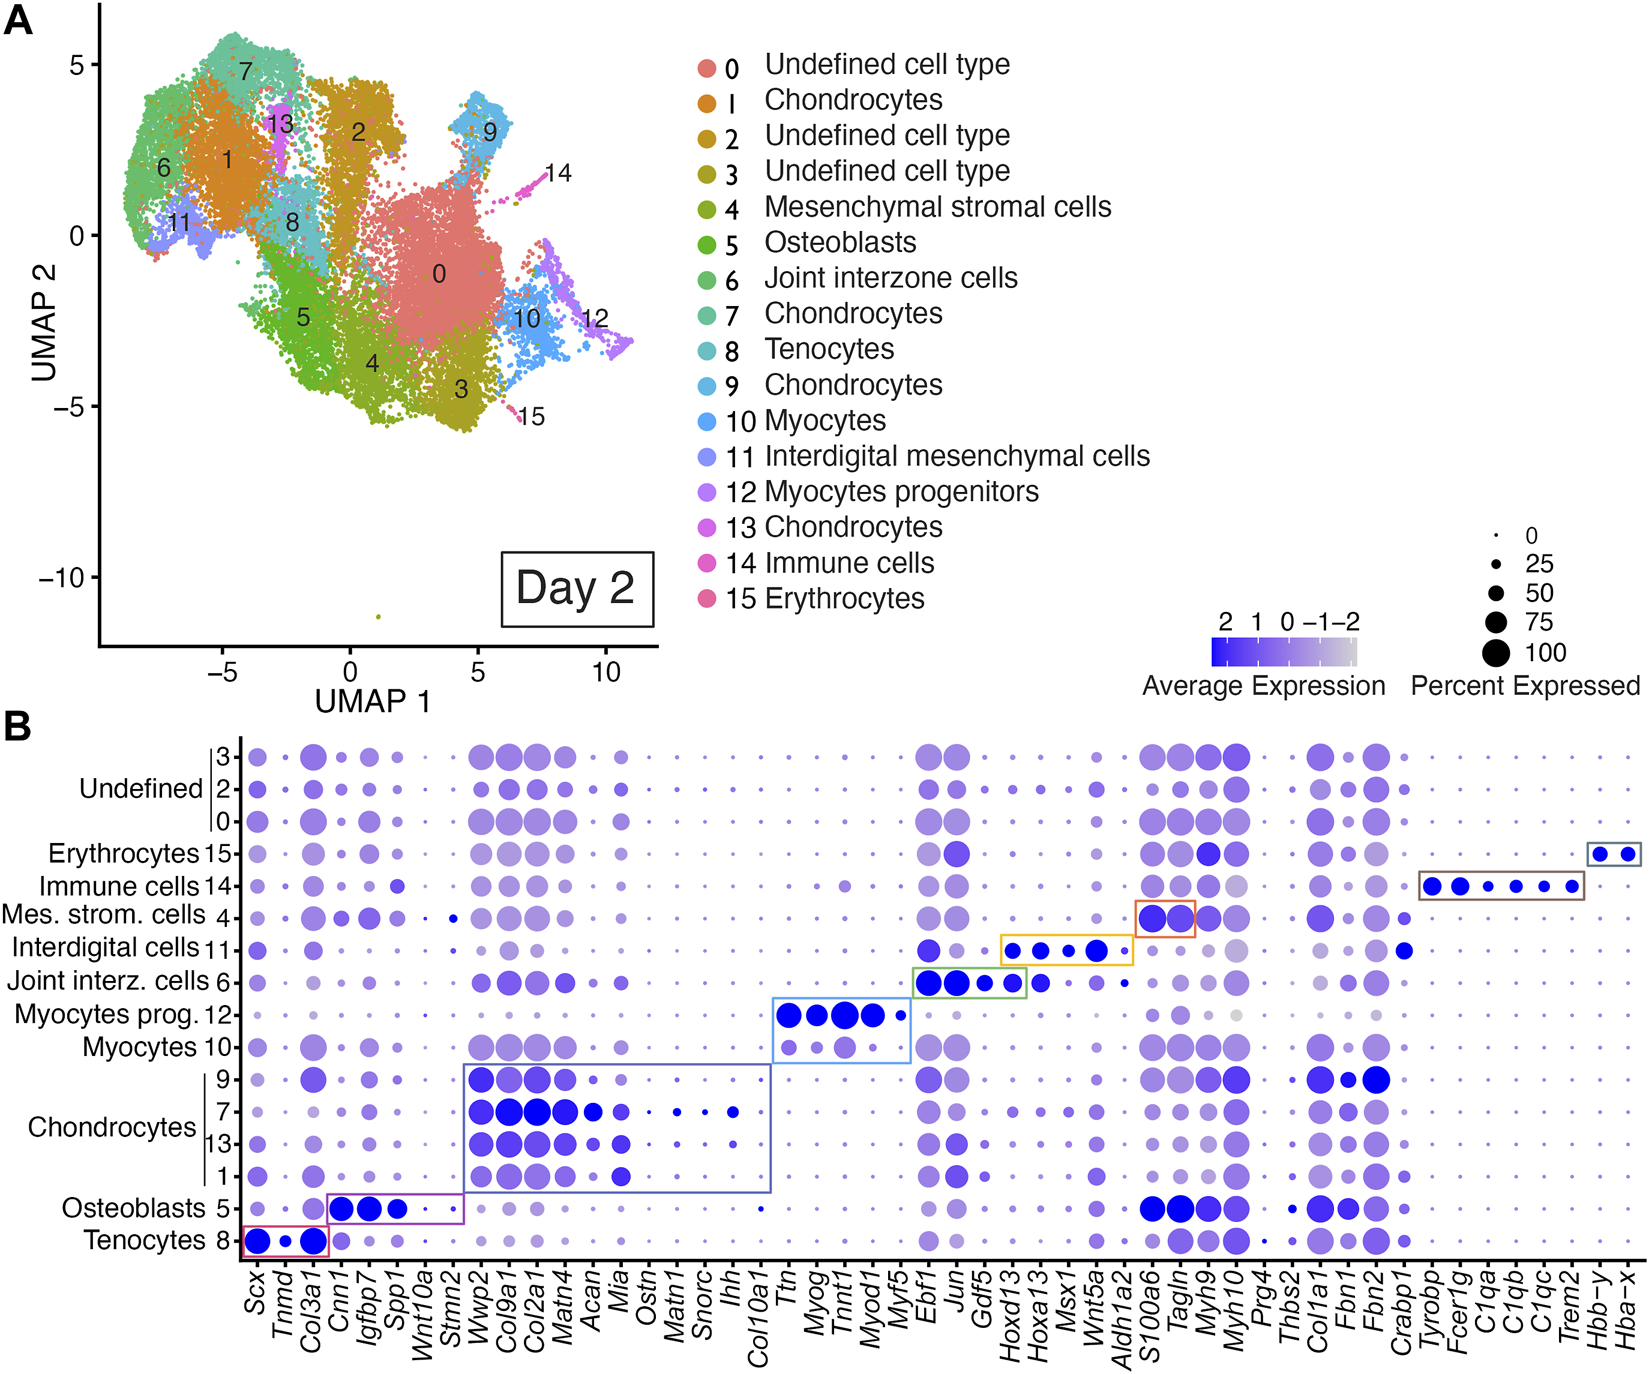
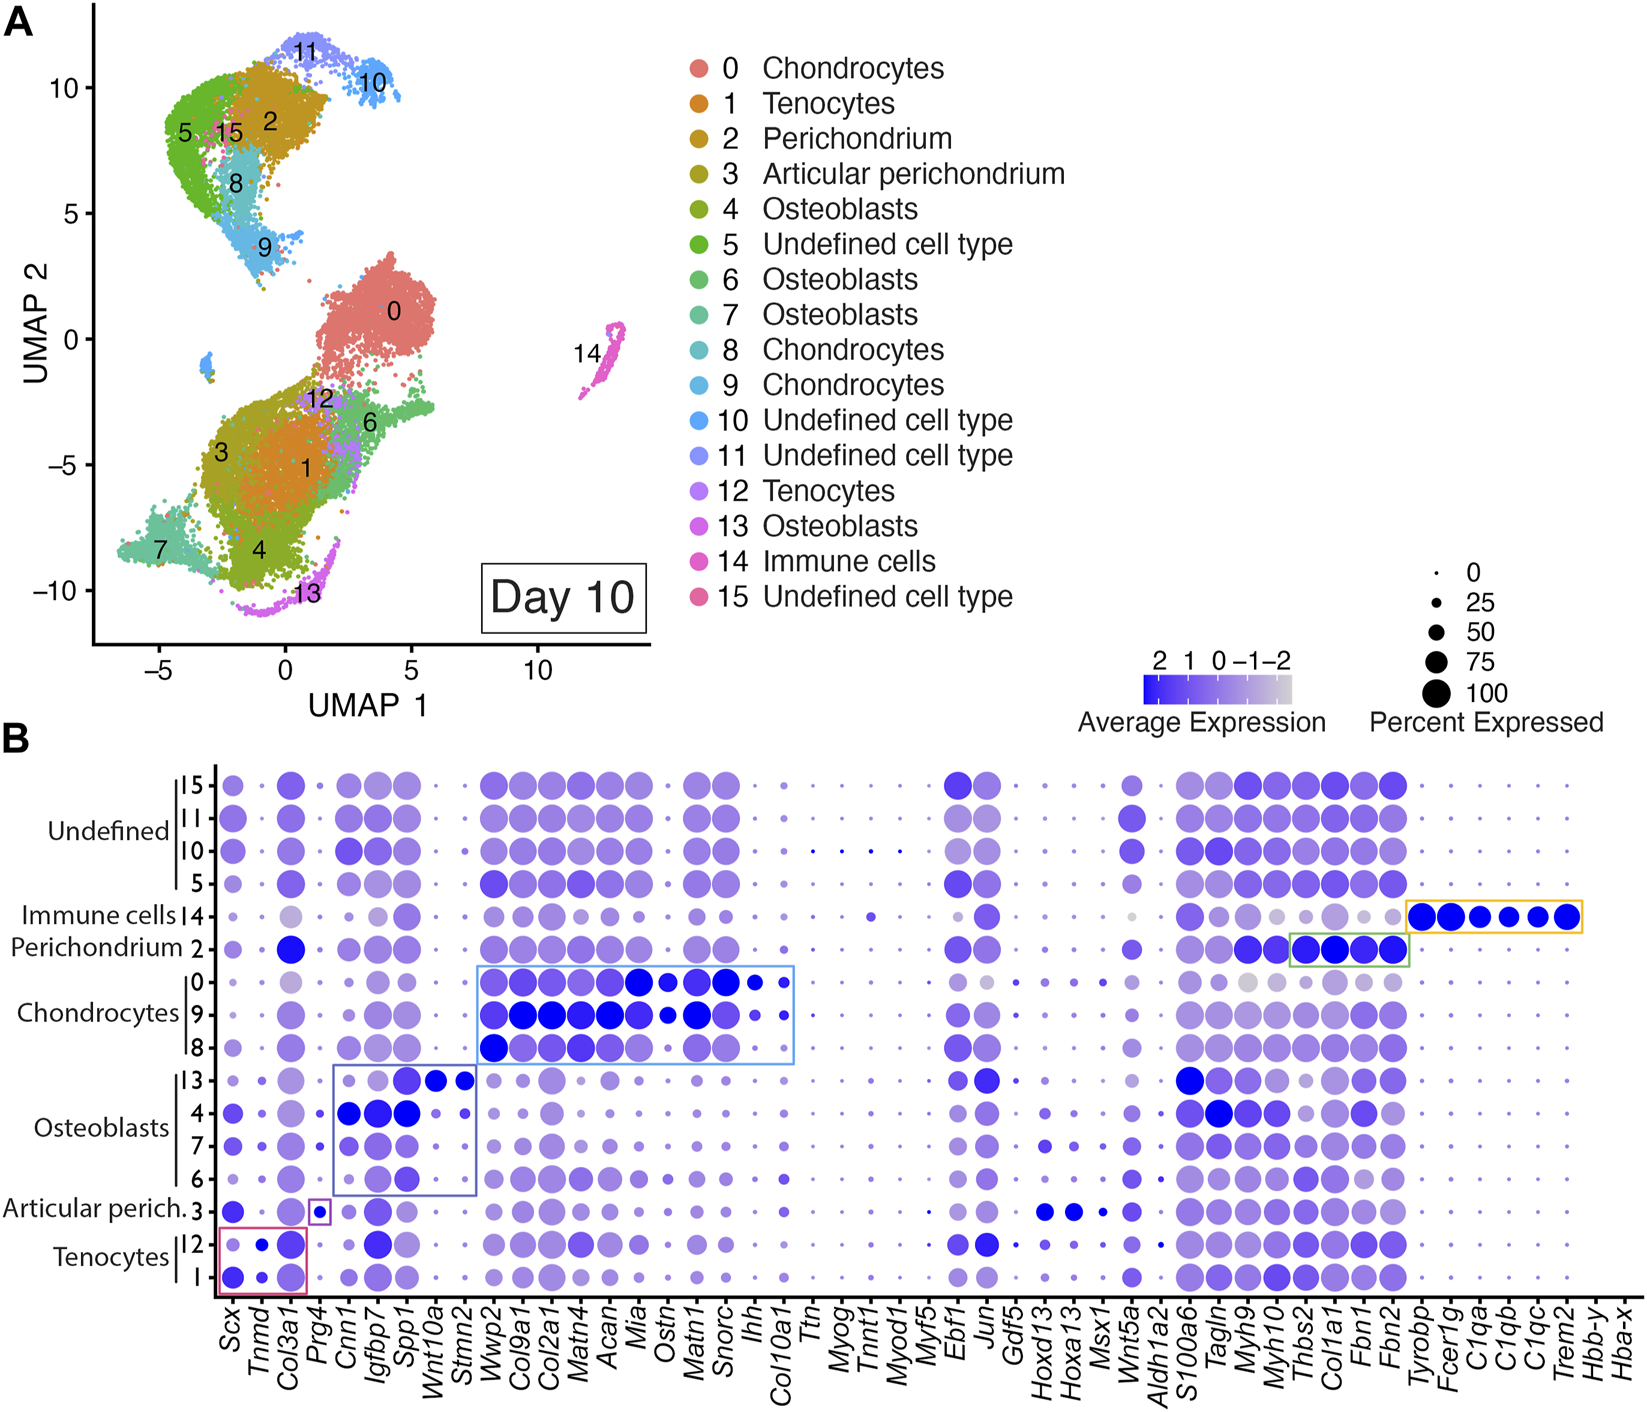
scRNAseq analysis of Day 2 in vitro cultures identifies multiple early autopod cell types. (A) UMAP (Uniform Manifold Approximation and Projection) plot of Day 2 culture scRNAseq results demonstrate 16 different clusters of identifiable cell populations. Individual cells are color coded based on cluster and marker gene annotation denoting tenocytes (Clusters 8), osteoblasts (Cluster 5), chondrocytes (Clusters 1, 7, 9, and 13), myocytes (Cluster 10), myocyte progenitors (Cluster 12), joint interzone cells (Cluster 6), interdigital mesenchymal cells (Cluster 11), mesenchymal stromal cells (Cluster 4), immune cells (Cluster 14), erythrocytes (Cluster 15), and undefined cell types (Clusters 0, 2, 3). (B) Dot plots highlighting expression profiles of selected marker genes per cell type used for cluster cell identification. Colored rectangles highlight the subset of markers used to identify tenocytes (red), osteoblasts (pink), chondrocytes (purple), myocytes/myocyte progenitors (blue), joint interzone (green), interdigital mesenchyme (orange), immune cell lineages (brown) and erythrocytes (gray). Dot diameter corresponds to the percentage of cells expressing the gene in each cluster. High-Low expression is denoted by Purple-Gray bar, respectively.
Cells assigned to Cluster 4 were annotated as mesenchymal stromal cells based on their expression of Tagln and S100a6 (Figure 3; Supplementary Table S2) (Marin-Llera and Chimal-Monroy, 2018; Luo et al., 2020). An immune cell cluster, Cluster 14, was also identified in the Day 2 cultures based on the expression of Tyrobp, Fcer1g, C1qa, C1qb, C1qc, and Trem2 (Figure 3; Supplementary Table S2) (Chen et al., 2021; Liang et al., 2021; Qiu et al., 2021; Dong et al., 2022). Cells assigned to Cluster 15 were annotated as erythrocytes based on their expression of Hbby-y and Hba-x (Figure 3; Supplementary Table S2) (Holdener-Kenny and Weaver, 1986; Alhashem et al., 2011; Chatterjee et al., 2016). Cells assigned to Clusters 0, 2, and 3 could not be annotated due to a lack of enrichment of informative markers (Figure 3; Supplementary Table S2).
A comparison of the Day 2 scRNAseq datasets indicated high reproducibility of digit developmental programs in independent DID cultures with cell-type-specific gene expression consistently reproduced between replicates for the 49-member gene list selected to capture six distinct autopod developmental trajectories including: digits and carpal elements, perichondrium, interdigital tissues, joints, fetal muscle, and tendons (Figure 3, Supplementary Figures S1, S2). The contribution of cells expressing cluster-specific genes was quite similar between replicate Day 2 DID libraries indicating a reproducible developmental program is produced by the DID system with the exception of Clusters 0, 3, 4, and 10 which exhibited a higher percentage of cells contributed from replicate B (Supplementary Figure S1).
3.3 Distinct autopod musculoskeletal tissues and structures are present in day 7 DID cultures
To determine whether distinct musculoskeletal tissues and structures are maturing in the DID system, we next analyzed the integrated scRNAseq datasets from Day 7 replicate libraries. Unbiased cell clustering based on gene expression was performed on the high-quality cells that remained after standard quality control and read filtering was performed in Seurat (Supplementary Table S1) as described (Butler et al., 2018; Stuart et al., 2019).
Integrated cell clustering analysis for the two Day 7 DID libraries revealed 19 discrete populations represented by Clusters 0–18 (Figure 4; Supplementary Table S2). Cells assigned to Cluster 9 were annotated as tenocytes based on their expression of Scx, Tnmd, and Col3a1 (Shukunami et al., 2006; Shukunami et al., 2018; Qi et al., 2020). Cells assigned to Clusters 5, 7, and 12 were annotated as osteoblasts based on their expression of Cnn1, Igfbp7, Spp1, Wnt10a, and Stmn2 (Figure 4; Supplementary Table S2) (Moore et al., 1991; Chiellini et al., 2008; Cawthorn et al., 2012; Su et al., 2013; Wu et al., 2019; Lu et al., 2020). Cells assigned to Clusters 0, 8, 10, 13, and 16 were annotated as chondrocytes based on their expression of multiple chondrocyte markers including: Wwp2, Col9a1, Col2a1, Matn4, Acan, Mia, Ostn, Matn1, Snorc, and Ihh (Figure 4; Supplementary Table S2) (Bi et al., 1999; Makihira et al., 1999; Czarny-Ratajczak et al., 2001; Kobayashi et al., 2002; Moser et al., 2002; Rentsendorj et al., 2005; Domowicz et al., 2009; Groma et al., 2011; Heinonen et al., 2011; Yang et al., 2011). Cells assigned to Cluster 14 were annotated as myocytes or myocyte progenitors based on their expression of Myod1, Ttn, Myf5, Myog, and Tnnt1 (Figure 4; Supplementary Table S2) (Bi et al., 1999; Makihira et al., 1999; Czarny-Ratajczak et al., 2001; Moser et al., 2002; Rentsendorj et al., 2005; Domowicz et al., 2009; Groma et al., 2011; Heinonen et al., 2011; Yang et al., 2011).
FIGURE 4
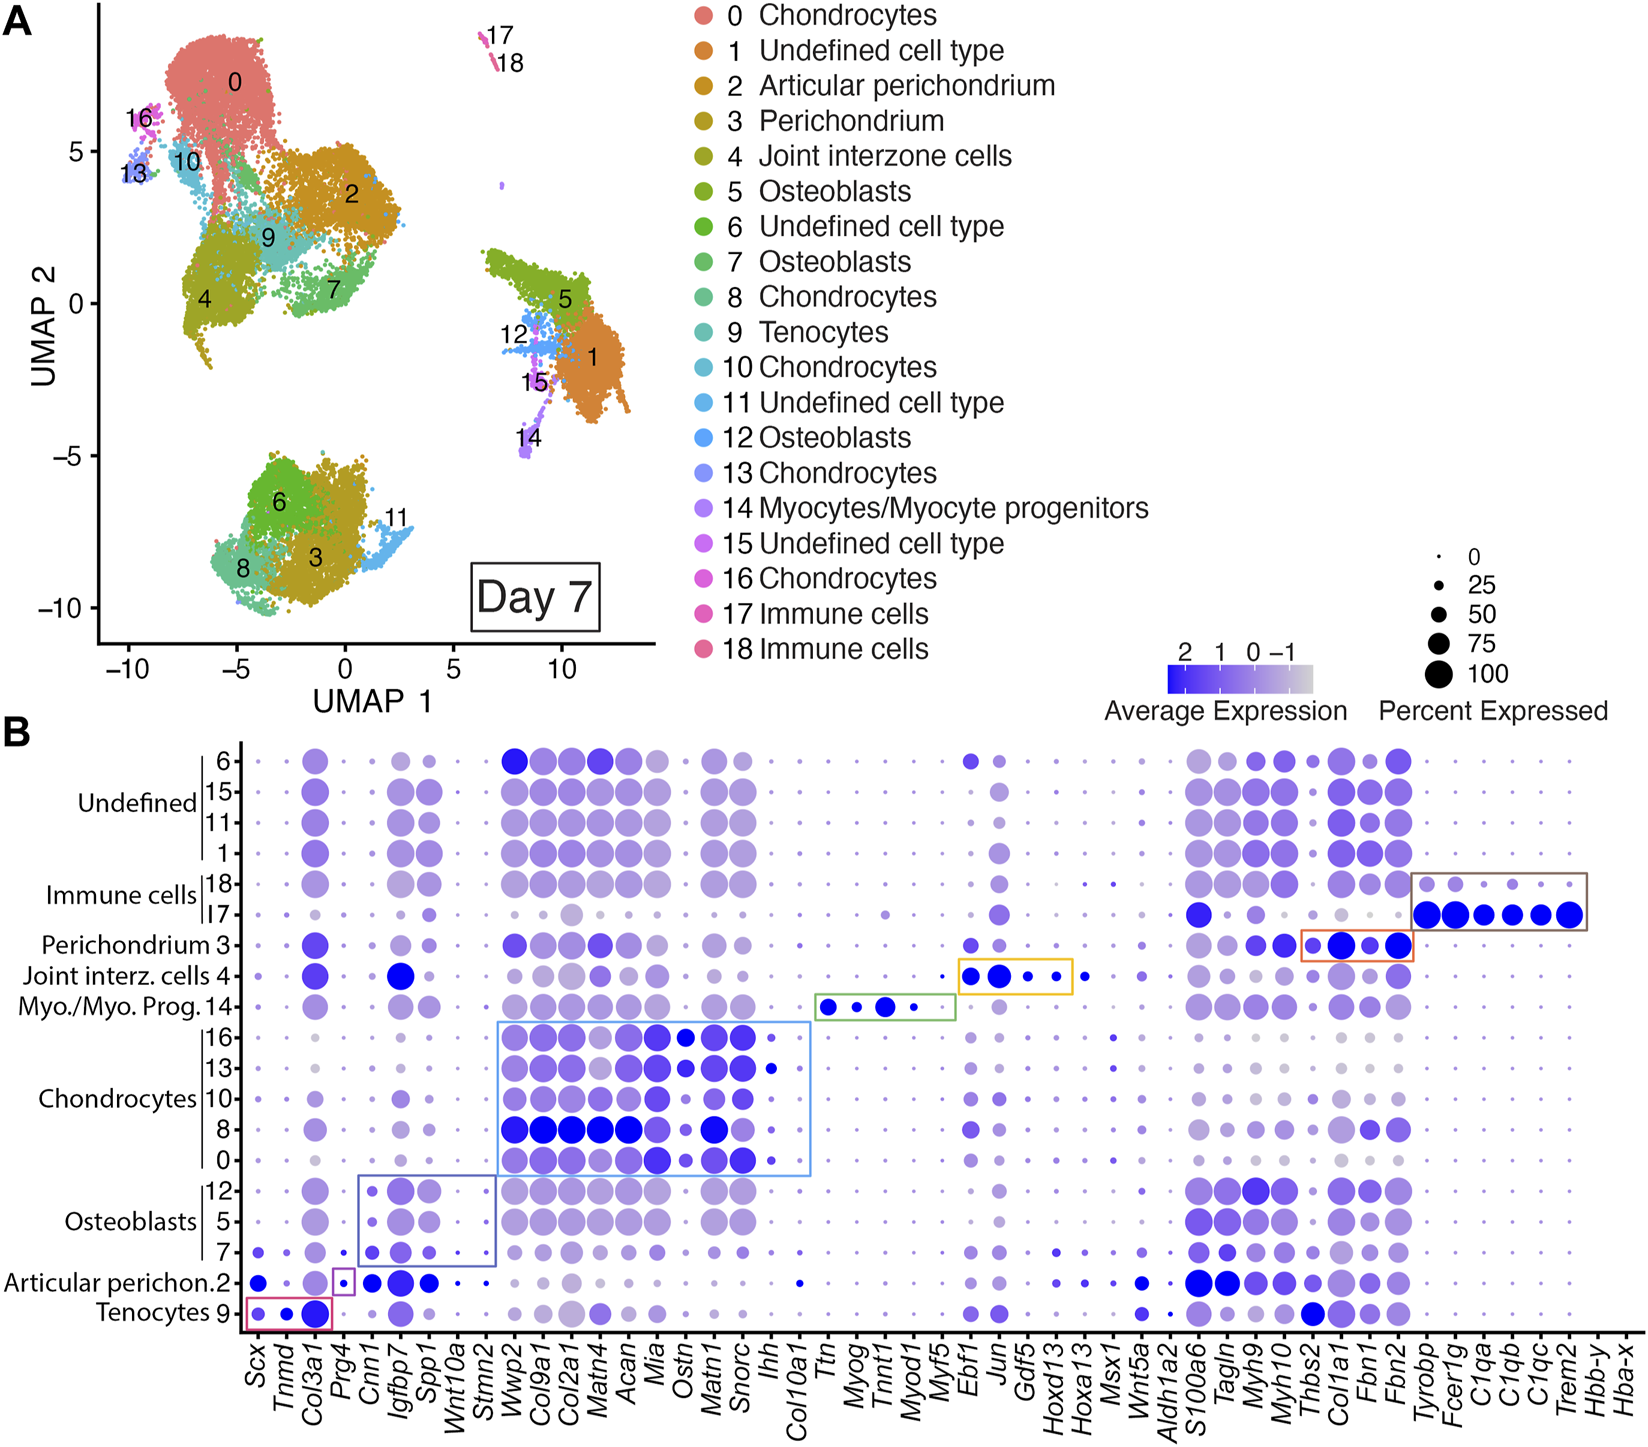
scRNAseq analysis of Day 7 in vitro cultures identifies multiple early autopod cell types. (A) UMAP (Uniform Manifold Approximation and Projection) plot of Day 7 culture scRNAseq results demonstrate 19 different clusters of identifiable cell populations. Individual cells are color coded based on cluster and marker gene annotation denoting tenocytes (Cluster 9), articular perichondrium (Cluster 2), osteoblasts (Clusters 5, 7 and 12), chondrocytes (Clusters 0, 8, 10, 13, and 16), myocytes/myocyte progenitors (Cluster 14), joint interzone cells (Cluster 4), perichondrium (Cluster 3), immune cell lineages (Clusters 17 and 18) and undefined cell types (Clusters 1, 6, 11, and 15). (B) Dot plots highlighting expression profiles of selected marker genes per cell type used for cluster cell identification. Colored rectangles highlight the subset of markers used to identify tenocytes (red), articular perichondrium (pink), osteoblasts (purple), chondrocytes (blue), myocytes/myocyte progenitors (green), joint interzone cells (yellow), perichondrium (orange), and immune cell lineages (brown). Dot diameter corresponds to the percentage of cells expressing the gene in each cluster. High-Low expression is denoted by Purple-Gray bar, respectively.
Cells assigned to Cluster 4 were annotated as joint interzone based on their co-expression of several joint interzone markers including: Jun, Gdf5, and Hoxd13 (Figure 4; Supplementary Table S2) (Storm and Kingsley, 1999; Kan and Tabin, 2013; Chen et al., 2016; Shwartz et al., 2016). Analysis of the Day 7 datasets revealed a novel cell type we annotated as perichondrium (Cluster 3) based on the expression of several perichondrial cell markers including: Thbs2, Col1a1, Fbn2, and Fbn1 (Figure 4; Supplementary Figure S3, and Supplementary Table S2) (Reinhardt et al., 1996; Kyriakides et al., 1998; Bandyopadhyay et al., 2008; Charbonneau et al., 2010). Similarly, the Day 7 datasets also identified an articular perichondrium cluster, Cluster 2, based on the expression of Prg4 (Figure 4; Supplementary Table S2) (Kozhemyakina et al., 2015; Zhang et al., 2021). Cells assigned to Clusters 17 and 18 were annotated as immune cell types based on their co-expression of Tyrobp, Fcer1g, C1qa, C1qb, C1qc, and Trem2 (Figure 4; Supplementary Table S2) (Chen et al., 2021; Liang et al., 2021; Qiu et al., 2021; Dong et al., 2022). Cells assigned to Clusters 1, 11, and 15 could not be annotated due to a lack of enrichment of informative markers in the Day 7 scRNAseq datasets (Figure 4; Supplementary Table S2).
A comparison of the Day 7 scRNAseq datasets confirmed high reproducibility of the digit developmental programs at this time point with a well-balanced contribution of cells expressing canonical markers of digit, perichondrium, interdigital tissues, joint interzone, fetal muscle, and tendons in each replicate (Figure 4, Supplementary Figures S1, S3). Cell-type-specific expression of genes was also reproduced in the Day 7 replicates including Prg4 in the articular perichondrium (Cluster 2), Scx, Col3a1, and Tnmd in tenocytes (Cluster 9), Jun, Ebf1, Gdf5, Hoxa13, Hoxd13 in joint interzone (Cluster 4), and Thbs2, Col1a1, Fbn1, and Fbn2 in perichondrium (Cluster 3) (Figure 4, Supplementary Figures S1, S3).
3.4 Musculoskeletal tissue maturation is recapitulated in day 10 DID cultures
Integrated cell clustering analysis of the two Day 10 DID libraries revealed 16 discrete populations represented by Clusters 0–15 (Figure 5 and Supplementary Table S2). Cells assigned to Clusters 1 and 12 were identified as tenocyte clusters based on their expression of Tnmd, Scx, and Col3a1 (Figure 5; Supplementary Table S2) (Shukunami et al., 2006; Shukunami et al., 2018; Qi et al., 2020). Cells assigned to Clusters 0, 8, and 9 exhibited significant enrichment of Wwp2, Col9a1, Col2a1, Acan, Matn1, Matn4, Mia, Ostn, Snorc, Col10a1, and Ihh, indicating a chondrocyte/growth plate chondrocyte lineage (Figure 5, Supplementary Table S2) (Apte et al., 1992; Bi et al., 1999; Czarny-Ratajczak et al., 2001; Moffatt et al., 2007; Heinonen et al., 2011; Yang et al., 2011; Schmid and Bosserhoff, 2014). Cells assigned to Clusters 4, 6, 7, and 13 were annotated as osteoblasts based on significant enrichment of Spp1, Wnt10a, Igfbp7, Cnn1, and Stmn2 (Figure 5, Supplementary Table S2) (Moore et al., 1991; Chiellini et al., 2008; Platt and El-Sohemy, 2009; Cawthorn et al., 2012; Su et al., 2013; Ozeki et al., 2016; Wu et al., 2019; Lu et al., 2020).
FIGURE 5
scRNAseq analysis of Day 10 in vitro cultures identifies multiple mature autopod cell types. (A) UMAP (Uniform Manifold Approximation and Projection) plot of Day 10 culture scRNAseq results demonstrate 16 different clusters of identifiable cell populations. Individual cells are color coded based on cluster and marker gene annotation denoting tenocytes (Clusters 1 and 12), articular perichondrium (Cluster 3), osteoblasts (Clusters 4, 6, 7, and 13), chondrocytes (Clusters 0, 8, and 9), articular perichondrium (Cluster 3), perichondrium (Cluster 2), immune cells (Cluster 14), and undefined cell type (Clusters 5, 10, 11, 15). (B) Dot plots highlighting expression profiles of selected marker genes per cell type used for cluster cell identification. Colored rectangles highlight the subset of markers used to identify tenocytes (red), articular perichondrium (pink), osteoblasts (purple), chondrocytes (blue), perichondrium (green), and immune cells (yellow). Dot diameter corresponds to the percentage of cells expressing the gene in each cluster. High-Low expression is denoted by Purple-Gray bar, respectively.
The presence of Prg4-expressing cells in Cluster 3 in Day 10 datasets indicates maturation of the digit and carpal-like structures as this marker is normally detected in postnatal articular tissues including articular perichondrium, articular cartilage and joint capsule (Kozhemyakina et al., 2015; Zhang et al., 2021). Based on this expression, Cluster 3 was annotated as articular perichondrium (Figure 5; Supplementary Table S2). Cells assigned to Cluster 2 in the Day 10 datasets were annotated as perichondrium based on the robust expression of Thbs2, Col1a1, Fbn1, and Fbn2 (Figure 5; Supplementary Table S2) (Claassen et al., 1995; Reinhardt et al., 1996; Kyriakides et al., 1998; Bandyopadhyay et al., 2008; Charbonneau et al., 2010). A comparison of Thbs2, Col1a1, Fbn1, and Fbn2 expression in Day 7 and Day 10 datasets revealed increased expression for every perichondrium marker at the Day 10 time point, indicating a progressive maturation of this tissue in the DID cultures (Figures 4, 5; Supplementary Table S2). Cells assigned to Cluster 14 were annotated as immune cells based on significant enrichment of Tyrobp, Fcer1g, C1qa, C1qb, C1qc, Trem2 (Figure 5; Supplementary Table S2) (Chen et al., 2021; Liang et al., 2021; Dong et al., 2022). Cells assigned to Clusters 5,10, 11, and 15 could not be annotated in the Day 10 datasets due to a lack of enrichment of informative markers (Figure 5; Supplementary Table S2).
Analysis of replicate Day 10 DID datasets also revealed high reproducibility of the digit developmental programs in independent DID cultures with cell-type-specific gene expression consistently represented between replicates for the 49-member developmental gene list used to annotate cells contributing to digits and carpal elements, digit and carpal perichondrium, interdigital tissues, joints, fetal muscle, and tendons (Figure 5, Supplementary Figures S1, S4). The contribution of cells assigned to individual clusters continued to be well-balanced between Day 10 replicate datasets (Supplementary Figure S1). Cell-type-specific expression of genes indicative of musculoskeletal tissue maturation was also reproduced in the Day 10 replicates including Prg4 in the articular perichondrium (Cluster 3), Col10a1 in hypertrophic chondrocytes (Clusters 0, 9), and Thbs2, Col1a1, Fbn1, and Fbn2 in perichondrium (Cluster 2) (Figure 5, Supplementary Figures S1, S4).
3.5 Recapitulation of Epha7 expression during DID culture mesenchymal condensation
We previously established a role for Epha7 as a mediator of limb mesenchymal condensation (Stadler et al., 2001). Based on this finding, we hypothesized that condensing mesenchyme present in Day 2 DID cultures (Figures 2, 7) would also express Epha7. Analysis of the scRNAseq datasets confirmed this hypothesis which detected Epha7 as a significantly expressed marker in Day 2 cultures for chondrocyte clusters (Clusters 1 and 13) (Figure 3, Supplementary Table S2). Elevated levels of Epha7 expression were also present in the tenocyte cluster (Cluster 8) in Day 2 cultures (Figure 3; Supplementary Figure S5).
3.6 DID cultures contain endothelial and angioblast progenitors
Analysis of endothelial marker expression in the Day 2, 7, and 10 scRNAseq datasets revealed significant differential expression of several endothelial progenitor markers including Cd34 (Day 10: Cluster 13), Kdr (Day 7: Cluster 17 and Day 10: Cluster 14), and Icam1 (Day 7: Clusters 9, 17; and Day 10: Cluster 12) (Supplementary Figure S6 and Supplementary Table S2) (Fadini et al., 2006; Sidney et al., 2014; Patel et al., 2016; Patel et al., 2017). Significant differential expression was also detected for Vcam1 in the DID cultures at Day 2 (Clusters 1 and 11), Day 7 (Clusters 9 and 17), and Day 10 (Clusters 1, 4, 12, and 13). Pecam1 (Cd31) and Tek (Tie2) were not significantly represented in any cluster cell type in the Day 2, 7, and 10 scRNAseq datasets, suggesting that maturation of limb bud vascular network has not occurred in the DID cultures (Supplementary Figure S6 and Supplementary Table S2) (Patel et al., 2016; Patel et al., 2017).
We next examined Vegfa which is expressed in early limb buds during mesenchymal condensation to stimulate the formation of the initial vascular network and later in maturing limbs in hypertrophic chondrocytes to direct perichondrial angiogenesis and vascularization of maturing limb skeletal tissues (Petersen et al., 2002; Zelzer et al., 2002; Eshkar-Oren et al., 2009; Takimoto et al., 2009). Analysis of the scRNAseq datasets revealed significant enrichment of Vegfa at Day 2 (Cluster 11), Day 7 (Clusters 4 and 8) and Day 10 (Clusters 6 and 9) (Supplementary Figure S7 and Supplementary Table S2). Significant enrichment of the hypertrophic chondrocyte marker, Col10a1, was also seen in Day 10 cultures in the same clusters (Clusters 6 and 9) as Vegfa (Supplementary Figure S7 and Supplementary Table S2). This result is consistent with the previously identified role for Vegfa in hypertrophic chondrocytes during skeletal tissue vascularization (Takimoto et al., 2009). Finally, the Vegfa receptor, Flt1, was also significantly expressed in Day 2 (Cluster 5) and Day 10 (Cluste 4) DID cultures (Supplementary Figure S7 and Supplementary Table S2).
3.7 Expression of dorsal-ventral and anterior-posterior limb markers in DID cultures
The dorsal limb bud marker, Wnt7a, had no significant enrichment in any cell clusters with low or undetectable levels present the Day 2, 7, and 10 cultures (Supplementary Figure S8, Supplementary Table S2) (Parr and McMahon, 1995). In contrast, significant differential expression of the dorsal mesenchymal marker, Lmx1b, was detected in Cluster 8 in the Day 2 scRNAseq dataset which was annotated as the tenocyte cell cluster (Figure 3; Supplementary Figure S8, Supplementary Table S2). This finding, in conjunction with the lack of Lmx1b enrichment in the Day 7 and 10 DID clusters, is consistent with previous studies that identified Lmx1b expression in dorsal limb tendons between E13.5 and E15.5 with little or no expression in E16.5 limbs, (Dreyer et al., 2004; Qiu et al., 2009). The ventralizing factor, En1, also exhibited no significant enrichment in any cell clusters at any time point with low expression being detected in a small number of cells in the Day 2, 7, and 10 datasets (Supplementary Figure S8, Supplementary Table S2) (Loomis et al., 1996).
Anterior-posterior marker expression was also less established in the DID cultures with a notable absence of Shh-expressing cells in the Day 2, 7 and 10 scRNAseq datasets (data not shown). This result was likely caused by the omission of the Shh-expressing region in the dissected E11.5 limb bud tissue used to establish the DID cultures or by DID cultures modeling normal developmental decreases in Shh expression which occurs in limb buds older than E11.5 (Scherz et al., 2004; McGlinn and Tabin, 2006; Zhu et al., 2008). In contrast, an anterior marker of limb bud development, Asb4, was significantly enriched in Clusters 1, 7, and 13 in the Day 2 cultures as well as in cell numbers below the significant marker threshold in Clusters 2, 5, 6, 8, and 11 (Figure 3, Supplementary Figure S9, and Supplementary Table S2) (Yokoyama et al., 2017).
3.8 Limb developmental gene expression patterns are recapitulated by the DID system
The morphologic and transcriptomic similarities between structures forming in vitro and in developing digits suggests autopod development is proceeding in the DID system (Figures 2–6, Supplementary Table S2). To test this hypothesis, we examined whether temporally- and spatially-restricted limb developmental gene expression patterns are recapitulated in DID-produced tissues and structures using HCR RNA-FISH and IHC (Choi et al., 2016). Analysis of Day 2 cultures revealed robust expression of Col2a1 in the digit-like structures similar to the expression pattern seen in E12.5 autopods (Figures 2, 6) (Metsaranta et al., 1995; Bruneau et al., 2001).
FIGURE 6
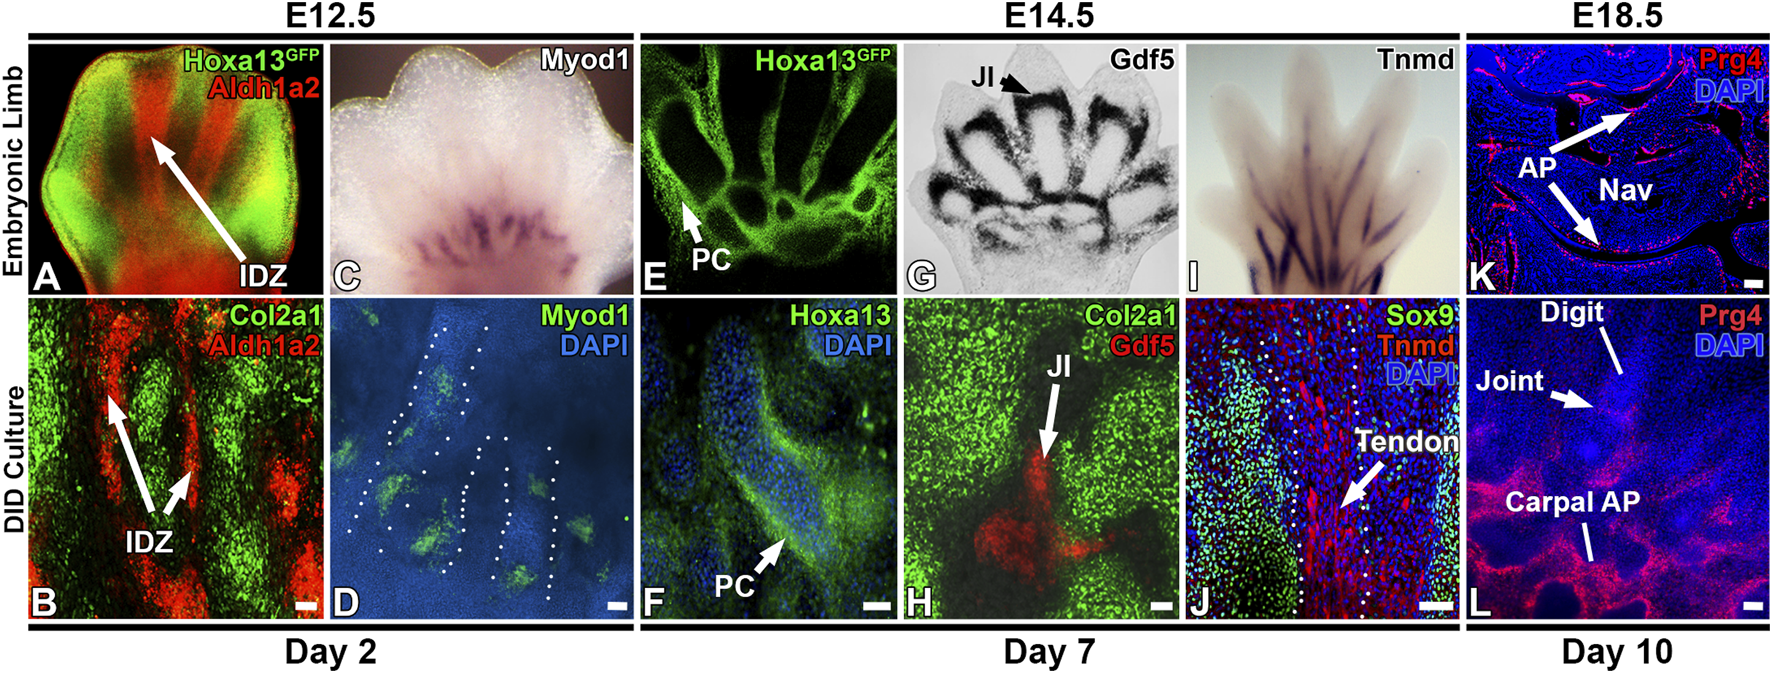
Recapitulation of digit/carpal element gene expression patterns by the DID system. (A,B) Day 2 cultures recapitulate digit and interdigital tissue development as detected by Col2a1 expression in the presumptive digit condensations and Aldh1a2 in the interdigital zones (arrows, IDZ). (C,D)Myod1 expression pattern at the digit base is recapitulated in Day 2 cultures. Dashed lines depict individual digits forming in the Day DID culture in panel (D). (E,F) Day 7 cultures recapitulate Hoxa13 expression patterns that localize to the periphery of digit condensations. (G) Developmental expression of Gdf5 in the E14.5 forelimb joint interzone (JI, arrowhead). (H) Day 7 DID cultures recapitulate Gdf5 expression localizing to presumptive joint interzones between digit structures (JI, arrow). (I) Maturing tendons robustly express Tnmd in E14.5 autopods. (J) IHC analysis of Sox9 and Tnmd expression in Day 10 DID cultures reveals robust Tnmd expression in maturing tendons (arrow) forming between the Sox9-expressing digit structures. (K)Prg4 is expressed in the articular perichondrium (AP, arrows) in E18.5 carpal skeletal elements. Nav = navicular element. Rad = radius. (L) Day 10 cultures recapitulate the formation of digit, joint, and carpal-like skeletal elements that express Prg4 in the articular perichondrium (AP) Bars = 50 µm.
Next, the detection of an interdigital cell cluster in the Day 2 scRNAseq analyses (Cluster 11, Figure 3), indicates digit development in the DID cultures includes the formation of interdigital zones, a key signaling tissue that mediates digit identity (Dahn and Fallon, 2000; Huang et al., 2016). To test this hypothesis, we examined the expression of Aldh1a2, which is robustly expressed in the interdigital tissues of E12.5 limbs (Figure 6A) (Shou et al., 2013). Analysis of Aldh1a2 expression in Day 2 cultures revealed a comparable pattern of expression that was restricted to the tissues between the digit-like structures, confirming the development of an interdigital zone by the DID system (Figure 6). Similarly, a myocyte progenitor cluster expressing Myod1 was also identified in the Day 2 DID cultures (Cluster 12, Figure 3), prompting the hypothesis that autopod muscle development was recapitulated by the DID system. Testing this hypothesis, we characterized the expression of Myod1 in Day 2 cultures which revealed an expression pattern similar to E12.5 limbs with Myod1-expressing cells localized to the base of the digit-like structures (Figure 6) (Hu et al., 2012; Wood et al., 2013).
The detection of Myod1-expressing tissues in Day 2 DID cultures indicates that myogenic progenitors are present in the E11.5 limbs bud tissues used to initiate the DID cultures (Figures 2, 6). While Myod1 expression has not been detected in the distal limb bud at E11.5, the progenitors that ultimately produce Myod1-expressing tissue in the limb bud are thought to be present as early as E9.5, as explant cultures using E9.5 limbs robustly produced Myod1-expressing tissues after several days of culture (Sassoon et al., 1989). This finding is consistent with our detection of Myod1-expressing tissue in Day 2 cultures which we would predict is derived from pre-existing myogenic progenitors in the dissected E11.5 limb tissues used to establish the DID cultures (Figures 3, 6, and Supplementary Table S2).
In Day 7 cultures, scRNAseq analysis identified enrichment of Jun, Gdf5, and Hoxd13 expression in Cluster 4, suggesting the formation of a joint interzone in these cultures (Figure 4) (Storm and Kingsley, 1999; Kan and Tabin, 2013; Huang et al., 2016; Capellini et al., 2017). Testing this hypothesis, we examined the expression of Gdf5 in Day 7 DID cultures which revealed robust expression between digit segments in a pattern similar to joint interzone regions present in E14.5 limbs, confirming the formation of joint interzones in the Day 7 DID cultures (Figure 6) (Storm and Kingsley, 1999; Capellini et al., 2017). Day 7 DID cultures also recapitulated the Hoxa13 expression pattern seen in E14.5 limbs where it localizes to the periphery of the digit-like structures (Figure 6) (Stadler et al., 2001; Villavicencio-Lorini et al., 2010; Shou et al., 2013). Characterization of Tnmd expression in Day 7 DID cultures revealed elongated tendon-like structures robustly expressing this mature tendon marker, recapitulating the expression seen in E14.5 autopods (Figure 6) (Shukunami et al., 2018).
Evaluation of Col1a1 and Thbs2 expression in Day 10 DID cultures revealed restricted expression to the flattened cell sheets surrounding the digit- and carpal-like structures, confirming the formation of a perichondrium (Figure 2). Finally, we assessed whether the digit-like tissues present in the Day 10 DID system also produce an articular perichondrium, a specialized tissue found at the epiphyses of late embryonic and postnatal skeletal elements that contributes to cells forming the articular cartilage and portions of the synovial joint capsule (Kozhemyakina et al., 2015; Zhang et al., 2021). A canonical marker of articular perichondrium, Prg4, was identified as robustly expressed by cells assigned to Cluster 3 in the Day 10 datasets, suggesting this tissue may be present in the Day 10 cultures (Figure 5; Supplementary Figure S4). Analysis of Prg4 expression in Day 10 cultures and E18.5 limbs confirmed localization of this marker to the articular perichondrium surrounding the developing carpal elements, and at the base of the developing digits, with faint expression also detected in a presumptive joint field (Figure 6). This expression pattern indicates that articular cartilage development is proceeding in the Day 10 DID cultures.
3.9 Recapitulation of Hoxa13 mutant limb defects in the DID system
Mutations in Hoxa13 profoundly affect distal limb development causing reduced mesenchymal condensation, loss of digit I, as well as fusion of hindlimb digits III and IV (Figure 7) (Fromental-Ramain et al., 1996; Stadler et al., 2001; Perez et al., 2010). Recognizing the capacity of the DID system to recapitulate distal limb development, we hypothesized that it could be used to model the Hoxa13 mutant limb phenotypes (Figure 7) (Fromental-Ramain et al., 1996; Stadler et al., 2001; Perez et al., 2010). To test this hypothesis, distal hindlimb mesenchyme expressing Hoxa13 was isolated from heterozygous and homozygous mutant embryos using fluorescence activated cell sorting (FACS) and the Hoxa13GFP allele as described (Stadler et al., 2001). DID culture of FACS-enriched Hoxa13GFP distal limb mesenchyme from heterozygous E11.5 embryos produced numerous cell condensations by Day 2 (n = 3/3) (Figure 7). By Day 6, heterozygous DID cultures exhibited robust formation of digit-like structures similar to those produced by wild type distal limb mesenchyme (n = 3/3) (Figures 2, 7). In contrast, homozygous mutant cells placed in DID culture exhibited a delay in condensation, producing loosely organized structures in Day 2 cultures (n = 4/4) (Figure 7). By Day 6, homozygous mutant DID cultures produced noticeably larger digit-like condensations resembling digit fusions seen in homozygous mutant hindlimbs (Figure 7) (n = 3/4). Taken together these results indicate that defects in mesenchymal condensation and digit fusions exhibited by Hoxa13 mutant mice are recapitulated by the DID system.
FIGURE 7
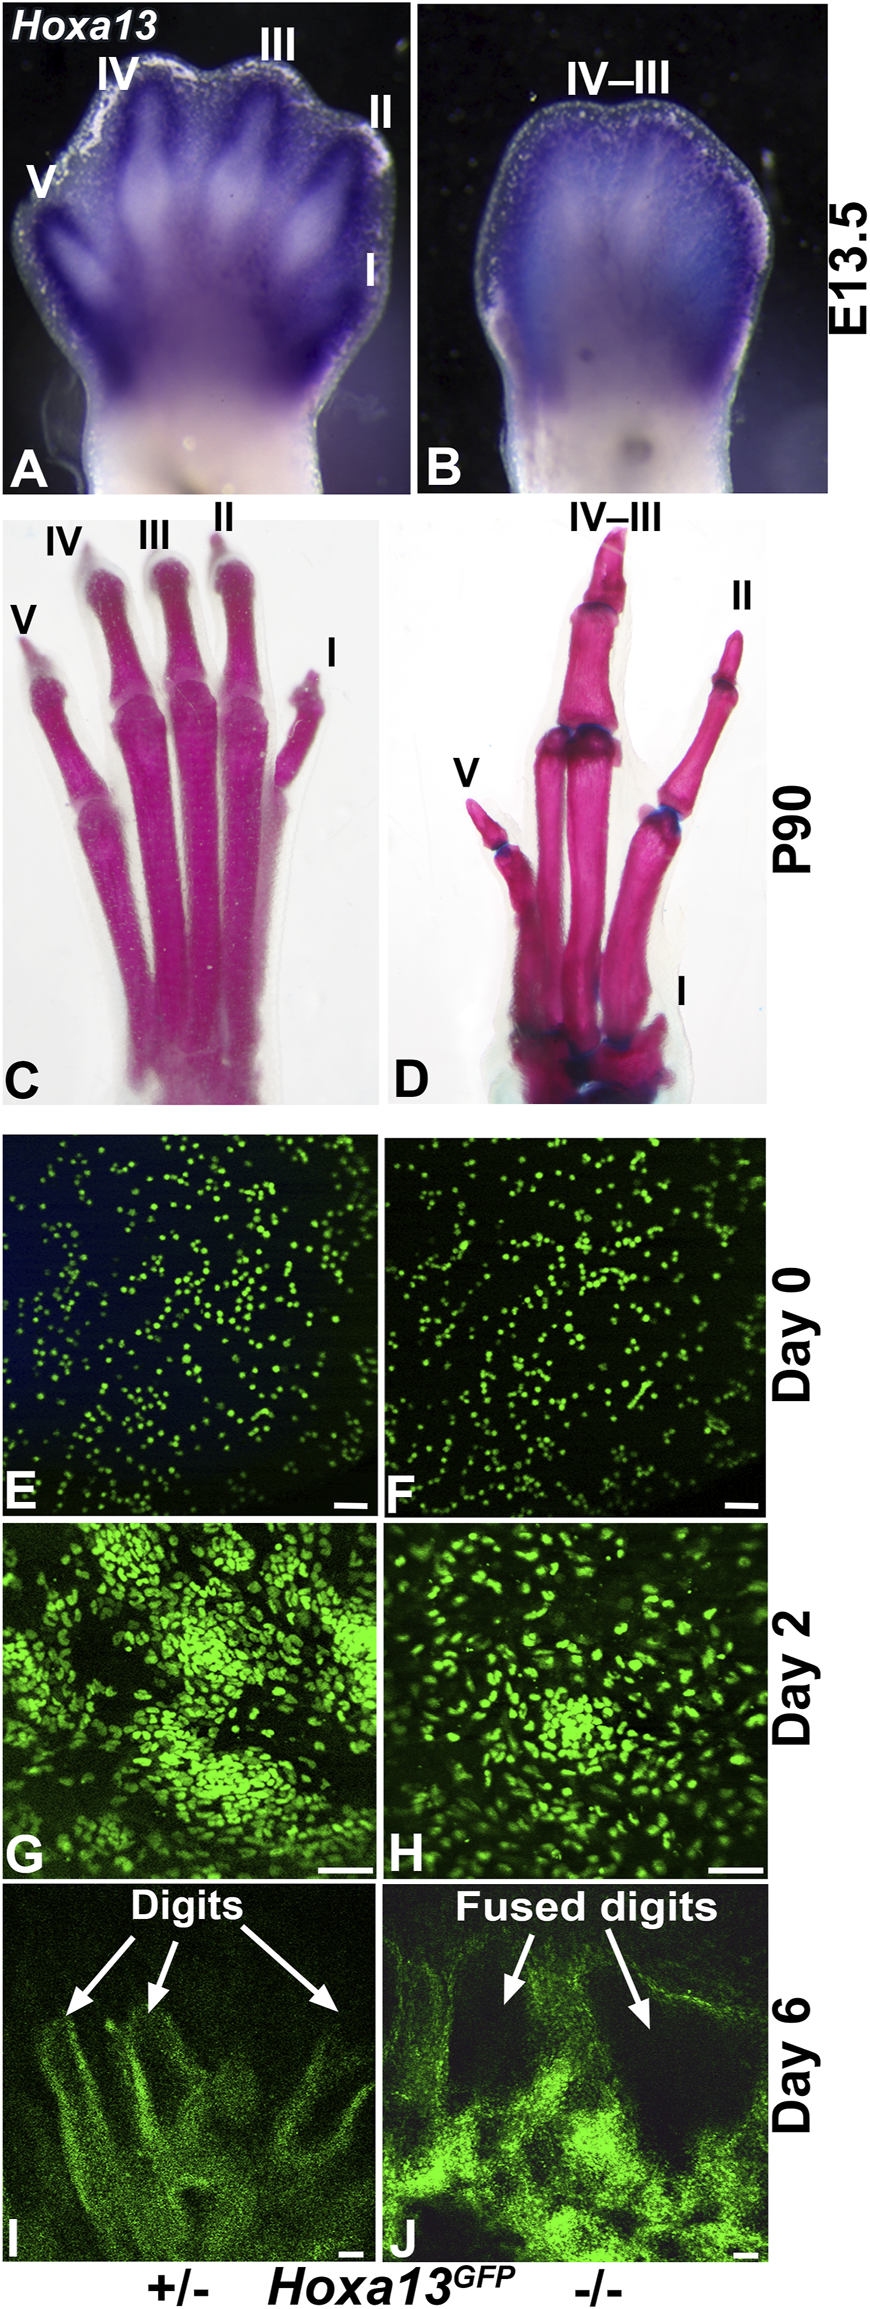
Recapitulation of the Hoxa13 mutant limb defects by the DID system. (A)Hoxa13 is robustly expressed in forelimb and hindlimb digits at E13.5 in Hoxa13 heterozygous mutant embryos. (B)Hoxa13GFP homozygous mutant embryos exhibit poor separation of the hindlimb digits by E13.5. (C, D) Comparison of postnatal day 90 (P90) littermate hindlimbs reveals normal development of digits in heterozygous Hoxa13GFP mice compared to homozygous mutants that exhibit loss of digit I, fusion of digit III-IV phalangeal elements, and brachydactyly and phalangeal element loss in digit V. Postnatal Hoxa13GFP limb defects. (E, G, I) DID culture of Hoxa13GFP heterozygous mutant distal limb mesenchyme reveals normal mesenchymal condensation at Day 2 (panel G) and production of multiple digit-like structures by Day 6. (F, H, J) DID culture of Hoxa13GFP homozygous mutant mesenchyme reveals delayed mesenchymal condensation at Day 2 (panel H) followed by the production of several fused digits (panel J). Bars = 50 µm for panels E–J.
4 Discussion
Analysis of DID cultures indicates robust development of distal limb tissues and structures including digits, joints, perichondrium, muscles, and tendons. An essential question for the applicability of the DID system to study distal limb development is whether it effectively models stage-specific molecular and cellular processes mediating digit and joint formation. Recognizing that undifferentiated distal limb mesenchyme from E11.5 embryos was used to inoculate the DID cultures (Day 0, Figure 2), we predicted that progressive autopod development would be evident if DID cultures exhibit patterns of gene expression similar to limbs older than E11.5.
Progressive autopod development was initially confirmed in Day 2 cultures which reproduced gene expression patterns for Aldh1a2 and Myod1 similar to E12.5 autopods (Figure 6) (Anderson et al., 2012; Shou et al., 2013). Assignment of an E12.5 equivalency to the Day 2 time point is also supported by recent scRNAseq studies of E12.5 limbs that identified the same cell lineages as detected in our Day 2 scRNAseq datasets which included cell types annotated as muscle lineages expressing Myod1 or as distal mesenchyme expressing Aldh1a2 and Hoxd13 (Figures 3, 6; Supplementary Figure S2, and Supplementary Table S2) (Desanlis et al., 2020).
Progressive development of the autopod tissues beyond E12.5 was also evident in the Day 7 DID cultures which exhibited tissues and gene expression patterns similar to E13.5–14.5 autopods including: localization of Hoxa13-expressing cells to developing digit perichondrium, formation of joint interzones that express Gdf5, and the formation of tendon-like structures expressing Tnmd (Figure 6) (Storm and Kingsley, 1999; Stadler et al., 2001; Shou et al., 2013; Shwartz et al., 2016; Shukunami et al., 2018). Gene expression patterns present in Day 10 cultures were also indicative of additional developmental progression of the autopod tissues which we estimated to be E18.5-Postnatal Day 0, based on the expression pattern of Prg4 in the carpal and digit articular perichondrium which is generally first detected early postnatal limbs (Kozhemyakina et al., 2015; Zhang et al., 2021).
Taken together, we conclude the DID system provides a progressive model of murine autopod development, recapitulating stage-specific formation of musculoskeletal tissues and structures. An important caveat to the DID system is that the progressive development of autopod tissues appears delayed by one (Day 2 cultures) to three days (Day 10 cultures) compared to the chronological age of the cells used to inoculate DID system. We attribute this heterochrony to the time required for dissociated E11.5 mesenchyme to reassemble and reinitiate an autopod developmental program in vitro.
4.1 New insights into models of proximal-distal limb development
In vertebrates, limb development proceeds sequentially, producing skeletal elements in a proximal to distal (P-D) manner, forming the humerus first, followed by ulna/radius, carpals, metacarpals, and finally phalangeal elements (Saunders, 1948; Summerbell et al., 1973; Tickle et al., 1975; Wolpert et al., 1975; Wolpert, 1990). While it is well-established that the apical ectodermal ridge (AER) and its production of FGFs regulate P-D limb bud outgrowth, additional studies are required to define the cellular and molecular mechanisms mediating P-D patterning and sequential development of limb skeletal elements (Saunders, 1948; Niswander et al., 1993; Cohn et al., 1995; Lewandoski et al., 2000; Dudley et al., 2002; Sun et al., 2002). To date, two models have emerged to explain how positional cell identity is established in the undifferentiated mesenchyme to facilitate P-D patterning of limb skeletal elements.
In the progress zone model, P-D specification of limb structures is determined by the time cells spend in the progress zone (PZ), an undifferentiated region of mesenchyme located in the distal limb bud (Summerbell et al., 1973; Summerbell and Wolpert, 1973). Cells spending the shortest amount of time in the PZ are specified to form proximal limb structures, whereas cells spending longer periods in the PZ form distal structures, with AER-derived FGFs functioning as the key mediator of cell specification (Summerbell and Wolpert, 1973; Tickle and Wolpert, 2002). By this model, the recapitulation of carpal and digit structures by DID cultures using PZ mesenchyme would indicate that distal structure specification is active in the DID system, requiring, at a minimum, continued expression of Fgf4 or Fgf8. Analysis of Fgf4 and Fgf8 expression in the Day 2 cultures revealed no cells actively expressing these genes (Supplementary Table S2). This result indicates that the recapitulation of distal limb development by the DID cultures may not follow the progress zone model.
One explanation for DID cultures producing distal structures in the absence of Fgf4 and Fgf8 expression is the presence of FGFs in fetal calf serum used in the DID culture media. In this scenario, FGF-mediated specification of distal limb structures would be facilitated if cells used in the Day 2 DID cultures express FGF receptors. This possibility is supported by the Day 2 scRNAseq analysis that identified expression of Fgfr1, Fgfr2, and Fgfr3 in cells annotated as chondrocytes in Clusters 1, 7, 9, and 13 (Figure 3 and Supplementary Table S2). However, while the bovine genome contains Fgf4 and Fgf8 orthologs, these proteins are not generally included as the endocrine FGFs present in fetal calf serum, reducing the possibility that serum-supplied FGF4 or FGF8 mediates distal limb specification to support a progress zone model of distal limb development in DID cultures (Itoh, 2010; Itoh et al., 2015; Itoh et al., 2016).
A second model suggests that P-D patterning is specified early in the distal limb mesenchyme, allowing structures to differentiate sequentially as the limb grows out under the influence of the AER (Dudley et al., 2002; Sun et al., 2002). A critical feature of the early specification model is that lineage-restricted cell compartments should be present in the distal mesenchyme. By this model, the preferential recapitulation of carpal and digit development by DID cultures should be reflected by the presence of distally-restricted cell populations.
Lineage tracing in the developing limbs has confirmed the presence of restricted cellular compartments establishing the dorsal-ventral axis (Arques et al., 2007). However, similar analyses of the P-D axis revealed a mixture of Hoxa11- and Hoxa13-expressing cells in the distal limb (Sato et al., 2007). Based on the detection of the proximal zeugopod marker, Hoxa11, in a cell mixture with Hoxa13 in the distal autopod prompted the conclusion that the early specification model may not be a well-suited mechanism for autopod patterning.
This conclusion may be premature as more recent studies have identified distally-restricted Hoxa11 antisense long non-coding RNAs functioning as primary mediators of tetrapod digit development (Kherdjemil et al., 2016; Leite-Castro et al., 2016). Analysis of the Day 2 scRNAseq datasets identified Hoxa11- and Hoxa13-expressing cells in Cluster 6 along with expression of the Hoxa11 antisense gene, Hoxa11os, supporting the premise that early specification of distal limb structures includes expression of Hoxa11 and its antisense long non-coding RNAs (Supplementary Table S2).
For DID cultures to further elucidate whether progress zone- or early specification models mediate P-D patterning of limb mesenchyme, we anticipate several future experiments. Notably, it will be essential to assess P-D patterning in DID cultures using defined growth media. By this approach, we can discern whether distal patterning of DID cultures reflects active specification of progress zone cells by exogenous FGF signaling. Next, to discern the mechanisms mediating P-D patterning in the early specification model, it will be essential to identify the role of cell surface proteins in the establishment of cell positional identity. In this context, DID cultures could be used to interrogate individual and combinatorial cell surface protein functions mediating sorting and compartmentalization of proximally- and distally-fated cell lineages.
4.2 DID cultures as autopod organoids
A major question regarding the DID cultures is whether they represent an autopod organoid? Traditionally, organoids were defined as tissues or structures that develop in vitro from stem cells or tissue progenitors using cell sorting and spatially-restricted lineage commitment to self-organize into an organ-like structure (Lancaster and Knoblich, 2014). By this definition, the DID cultures could be considered an autopod organoid as the cells dissociated from the distal mesenchyme self-assemble and organize into spatially-restricted lineages that differentiate into discrete musculoskeletal structures including digits, carpal elements, joints, muscles, perichondrium, and tendon. This designation is supported by the scRNAseq analysis of the DID cultures which detected tenocyte, myocyte, stromal, and chondrocyte progenitor populations (Figures 3–5; Supplementary Table S2).
More recently, organoids have been redefined as three-dimensional structures grown in vitro from stem cells that self-organize through cell sorting and spatially-restricted lineage commitment to produce organ-specific cell types (Clevers, 2016). Using these revised criteria, the DID system should not be considered an organoid, as a stem cell population was not used or identified as the facilitating cell type mediating robust recapitulation of hand/foot development in the DID cultures.
4.3 Do immune cell populations in the DID cultures contain osteoclasts?
Cells annotated in the DID cultures as immune cells (Figures 3–5) may also include osteoclasts, a specialized musculoskeletal cell type often thought of as the immune component of the endochondral bone (Sato et al., 2006; Schaffler et al., 2014). The progressive development of digit and carpal elements in the DID cultures support this possibility, as osteoclasts function to remodel bone to facilitate developmental growth (Sato et al., 2006; Schaffler et al., 2014; Yahara et al., 2020; Yahara et al., 2022). Interestingly, the same canonical factors used to annotate the immune cell lineages in the DID scRNAseq datasets (Figures 3–5) are also used to distinguish osteoclasts including: Tyrobp, Trem2, and C1qa, C1qb, and C1qc, supporting the possibility that a portion of the immune cell types present in the DID cultures may be osteoclasts (Figures 3–5) (Sato et al., 2006; Teo et al., 2012; Xia et al., 2017; Chen et al., 2021; Liang et al., 2021; Dong et al., 2022). This conclusion is supported by the developmental origins of some osteoclast lineages, which are derived from yolk sac erythromyeloid progenitors present in the embryo prior to E10.5 (Lux et al., 2008; Yahara et al., 2020; Yahara et al., 2022).
4.4 DID cultures partially model limb vasculogenesis
A key step to producing a mature vascular network in the vertebrate limb is the initial formation of a rudimentary vascular plexus derived from cells emerging from the dorsal aorta (Seichert and Rychter, 1971; 1972). The absence of an aortic source for these cells in the DID cultures provides a likely reason for the lack of Pecam1 (Cd31) expression, as endothelial maturation requires the formation of a vascular plexus which is remodeled into a mature limb vascular network (Eshkar-Oren et al., 2009; Takimoto et al., 2009). It is interesting to speculate whether co-culture of dissociated limb bud mesenchyme with aortic tissues in DID cultures would facilitate the formation of the initial vascular plexus and a mature vascular network.
In maturing endochondral bones, vascular invasion is facilitated by the expression of Vegfa by hypertrophic chondrocytes which attracts endothelial and osteclast cell types from blood vessels proximal to the bone sheath (Takimoto et al., 2009; Kusumbe and Adams, 2014). Our detection of the hypertrophic chondrocyte marker, Col10a1, in the same clusters as Vegfa in Day 10 cultures (Clusters 6 and 9) suggests that the initial step to attract endothelial and osteoclastic cell types to the digit tissues occurs independent of vascular involvement and is modeled by the DID system (Supplementary Figures S6, S7, and Supplementary Table S2). As a vascular source is not present in the DID cultures, it is likely that endothelial cells detected by the scRNAseq analysis are derived from multiple sources including: Cd34+ mesenchymal stem cells, endothelial cells resident to the perichondrium, or from endothelial progenitors that migrate into the limb bud as early as E9.5 (Colnot et al., 2004; Tozer et al., 2007; Yvernogeau et al., 2012; Carbone et al., 2016; AbuSamra et al., 2017).
4.5 Modeling opportunities
A prominent feature of the DID system is its capacity to model congenital defects caused by the loss of Hoxa13 function (Figure 6). While many of the transcriptional targets of Hoxa13 have been identified in E11–12.5 limbs, the cellular mechanisms regulated by Hoxa13 to facilitate digit patterning remain poorly understood (Knosp et al., 2004; Knosp et al., 2007; Shou et al., 2013; Kherdjemil et al., 2016; Sheth et al., 2016; Bastida et al., 2020; Desanlis et al., 2020; Trofka et al., 2021). In this context, the modeling of congenital defects by the DID system provides a novel tool to identify cell-specific functions of target genes that regulate the formation and pattering of digit tissues.
As Hoxa13 was recently identified as a primary mediator of digit regeneration in urodeles (Takeuchi et al., 2022), it is interesting to speculate whether distal mesenchyme from regenerative species could be used in the DID system to rapidly identify and validate Hoxa13 regenerative target genes. Once identified, these regenerative factors could also be evaluated as therapeutics to improve digit regeneration in mammals, whose regenerative capacity is currently limited to the distal digit tip (Han et al., 2008; Dawson et al., 2018; Dolan et al., 2018; Yu et al., 2019; Johnson et al., 2020). Recent studies investigating the regenerative capacity of more proximal digit amputations in mice indicate that the remaining tissues are competent to regenerate bone and joint tissues when provided with sequential applications of BMP2 and BMP9 (Yu et al., 2019). In this context, in vitro digit amputations created in the DID system could be used to rapidly develop sequential and/or combinatorial treatments to stimulate the complete regeneration of digit tissues.
The formation of a perichondrium by DID skeletal elements provides an additional opportunity to examine how periosteal tissues participate in the repair and homeostasis of bone. Recent lineage tracing studies have identified a Dlx5-expressing cell population in the outer fetal perichondrium as a primary cell-of-origin for postnatal bone marrow stroma with an adipocyte biased state (Matsushita et al., 2022). Upon injury, adipocyte biased cells rapidly convert to a skeletal cell state to facilitate bone repair (Matsushita et al., 2022). These findings suggest that the DID system could be used to rapidly identify factors that increase Dlx5-expressing cell populations in the outer perichondrium, providing an approach to develop new treatments for non-union fractures.
In summary, our analysis of the DID cultures indicates robust recapitulation of murine autopod development. Access provided by the DID system to discrete cell populations as they form specialized tissues and structures of the hand and foot represents an important advancement in how studies can be designed to interrogate the cellular and molecular mechanisms mediating limb development. As the DID system can also reproduce congenital defects, it is anticipated that this system will facilitate the development of new therapies aimed at discerning the molecular pathology of specific malformations as well as providing a new tool to identify effective therapies to stimulate the repair/regeneration of hand/foot musculoskeletal tissues impacted by congenital malformation, injury or disease.
Statements
Data availability statement
The datasets presented in this study can be found in online repositories. The names of the repository/repositories and accession number(s) can be found below: Gene Expression Omnibus accession number GSE221883.
Ethics statement
The animal study was reviewed and approved by the OHSU Institutional Animal Care and Use Committee with an approved protocol # IS00001648 issued to HSS.
Author contributions
AF and HS designed the study. AF, HS, CS, and YY performed the bench experiments. AF performed the informatics analysis. AF and HS analysed and interpreted the results. HS and AF wrote and revised the manuscript. All authors had full access to the data and approved the final manuscript.
Funding
Support for these investigations was provided by grants from Shriners Childrens Research Program (Grant 85150 to HSS) and National Institutes of Health (R56AR074931 to HSS).
Acknowledgments
The authors wish to thank Dr. Suzanne Fei at the OHSU Informatics and Biostatistics Core for support with the analysis of the single-cell RNAseq data. We also wish to acknowledge Robert Searles, Amy Carlos, and Alex Klug at the OHSU Gene Profiling Shared Resource Facility and the OHSU Massively Parallel Sequencing Shared Resource Facility for support with the 10x Genomics Chromium platform library generation and sequencing. The authors also wish to thank Daphne Cooper, Nicole Bowman, and Daniel Hunter at 10x Genomics for technical support with the initial quality filtering of the single-cell data.
Conflict of interest
The authors declare that the research was conducted in the absence of any commercial or financial relationships that could be construed as a potential conflict of interest.
Publisher’s note
All claims expressed in this article are solely those of the authors and do not necessarily represent those of their affiliated organizations, or those of the publisher, the editors and the reviewers. Any product that may be evaluated in this article, or claim that may be made by its manufacturer, is not guaranteed or endorsed by the publisher.
Supplementary material
The Supplementary Material for this article can be found online at: https://www.frontiersin.org/articles/10.3389/fcell.2023.1135025/full#supplementary-material
References
1
AbuSamra D. B. Aleisa F. A. Al-Amoodi A. S. Jalal Ahmed H. M. Chin C. J. Abuelela A. F. et al (2017). Not just a marker: CD34 on human hematopoietic stem/progenitor cells dominates vascular selectin binding along with CD44. Blood Adv.1 (27), 2799–2816. 10.1182/bloodadvances.2017004317
2
Ahrens P. B. Solursh M. Reiter R. S. (1977). Stage-related capacity for limb chondrogenesis in cell culture. Dev. Biol.60 (1), 69–82. 10.1016/0012-1606(77)90110-5
3
Ahrens P. B. Solursh M. Reiter R. S. Singley C. T. (1979). Position-related capacity for differentiation of limb mesenchyme in cell culture. Dev. Biol.69 (2), 436–450. 10.1016/0012-1606(79)90303-8
4
Alhashem Y. N. Vinjamur D. S. Basu M. Klingmuller U. Gaensler K. M. Lloyd J. A. (2011). Transcription factors KLF1 and KLF2 positively regulate embryonic and fetal beta-globin genes through direct promoter binding. J. Biol. Chem.286 (28), 24819–24827. 10.1074/jbc.M111.247536
5
Anderson C. Williams V. C. Moyon B. Daubas P. Tajbakhsh S. Buckingham M. E. et al (2012). Sonic hedgehog acts cell-autonomously on muscle precursor cells to generate limb muscle diversity. Genes Dev.26 (18), 2103–2117. 10.1101/gad.187807.112
6
Apte S. S. Seldin M. F. Hayashi M. Olsen B. R. (1992). Cloning of the human and mouse type X collagen genes and mapping of the mouse type X collagen gene to chromosome 10. Eur. J. Biochem.206 (1), 217–224. 10.1111/j.1432-1033.1992.tb16919.x
7
Arques C. G. Doohan R. Sharpe J. Torres M. (2007). Cell tracing reveals a dorsoventral lineage restriction plane in the mouse limb bud mesenchyme. Development134 (20), 3713–3722. 10.1242/dev.02873
8
Bandyopadhyay A. Kubilus J. K. Crochiere M. L. Linsenmayer T. F. Tabin C. J. (2008). Identification of unique molecular subdomains in the perichondrium and periosteum and their role in regulating gene expression in the underlying chondrocytes. Dev. Biol.321 (1), 162–174. 10.1016/j.ydbio.2008.06.012
9
Bastida M. F. Perez-Gomez R. Trofka A. Zhu J. Rada-Iglesias A. Sheth R. et al (2020). The formation of the thumb requires direct modulation of Gli3 transcription by Hoxa13. Proc. Natl. Acad. Sci. U. S. A.117 (2), 1090–1096. 10.1073/pnas.1919470117
10
Beauchamp J. R. Heslop L. Yu D. S. Tajbakhsh S. Kelly R. G. Wernig A. et al (2000). Expression of CD34 and Myf5 defines the majority of quiescent adult skeletal muscle satellite cells. J. Cell Biol.151 (6), 1221–1234. 10.1083/jcb.151.6.1221
11
Bi W. Deng J. M. Zhang Z. Behringer R. R. de Crombrugghe B. (1999). Sox9 is required for cartilage formation. Nat. Genet.22 (1), 85–89. 10.1038/8792
12
Bruneau S. Johnson K. R. Yamamoto M. Kuroiwa A. Duboule D. (2001). The mouse Hoxd13(spdh) mutation, a polyalanine expansion similar to human type II synpolydactyly (SPD), disrupts the function but not the expression of other Hoxd genes. Dev. Biol.237 (2), 345–353. 10.1006/dbio.2001.0382
13
Butler A. Hoffman P. Smibert P. Papalexi E. Satija R. (2018). Integrating single-cell transcriptomic data across different conditions, technologies, and species. Nat. Biotechnol.36 (5), 411–420. 10.1038/nbt.4096
14
Capellini T. D. Chen H. Cao J. Doxey A. C. Kiapour A. M. Schoor M. et al (2017). Ancient selection for derived alleles at a GDF5 enhancer influencing human growth and osteoarthritis risk. Nat. Genet.49 (8), 1202–1210. 10.1038/ng.3911
15
Carbone A. Valente M. Annacontini L. Castellani S. Di Gioia S. Parisi D. et al (2016). Adipose-derived mesenchymal stromal (stem) cells differentiate to osteoblast and chondroblast lineages upon incubation with conditioned media from dental pulp stem cell-derived osteoblasts and auricle cartilage chondrocytes. J. Biol. Regul. Homeost. Agents30 (1), 111–122.
16
Carlson H. L. Quinn J. J. Yang Y. W. Thornburg C. K. Chang H. Y. Stadler H. S. (2015). LncRNA-HIT functions as an epigenetic regulator of chondrogenesis through its recruitment of p100/CBP complexes. PLoS Genet.11 (12), e1005680. 10.1371/journal.pgen.1005680
17
Cawthorn W. P. Bree A. J. Yao Y. Du B. Hemati N. Martinez-Santibanez G. et al (2012). Wnt6, Wnt10a and Wnt10b inhibit adipogenesis and stimulate osteoblastogenesis through a beta-catenin-dependent mechanism. Bone50 (2), 477–489. 10.1016/j.bone.2011.08.010
18
Chang B. Liu X. (2022). Osteon: Structure, turnover, and regeneration. Tissue Eng. Part B Rev.28 (2), 261–278. 10.1089/ten.TEB.2020.0322
19
Charbonneau N. L. Jordan C. D. Keene D. R. Lee-Arteaga S. Dietz H. C. Rifkin D. B. et al (2010). Microfibril structure masks fibrillin-2 in postnatal tissues. J. Biol. Chem.285 (26), 20242–20251. 10.1074/jbc.M109.087031
20
Chatterjee S. Bhardwaj N. Saxena R. K. (2016). Identification of stages of erythroid differentiation in bone marrow and erythrocyte subpopulations in blood circulation that are preferentially lost in autoimmune hemolytic anemia in mouse. PLoS One11 (11), e0166878. 10.1371/journal.pone.0166878
21
Chen H. Capellini T. D. Schoor M. Mortlock D. P. Reddi A. H. Kingsley D. M. (2016). Heads, shoulders, elbows, knees, and toes: Modular Gdf5 enhancers control different joints in the vertebrate skeleton. PLoS Genet.12 (11), e1006454. 10.1371/journal.pgen.1006454
22
Chen L. H. Liu J. F. Lu Y. He X. Y. Zhang C. Zhou H. H. (2021). Complement C1q (C1qA, C1qB, and C1qC) may Be a potential prognostic factor and an index of tumor microenvironment remodeling in osteosarcoma. Front. Oncol.11, 642144. 10.3389/fonc.2021.642144
23
Chiellini C. Grenningloh G. Cochet O. Scheideler M. Trajanoski Z. Ailhaud G. et al (2008). Stathmin-like 2, a developmentally-associated neuronal marker, is expressed and modulated during osteogenesis of human mesenchymal stem cells. Biochem. Biophys. Res. Commun.374 (1), 64–68. 10.1016/j.bbrc.2008.06.121
24
Choi H. M. Calvert C. R. Husain N. Huss D. Barsi J. C. Deverman B. E. et al (2016). Mapping a multiplexed zoo of mRNA expression. Development143 (19), 3632–3637. 10.1242/dev.140137
25
Claassen H. Kampen W. U. Kirsch T. (1995). Localization of type I and II collagen during development of human first rib cartilage. Anat. Embryol. Berl.192 (4), 329–334. 10.1007/BF00710102
26
Clevers H. (2016). Modeling development and disease with organoids. Cell165 (7), 1586–1597. 10.1016/j.cell.2016.05.082
27
Cohn M. J. Izpisua-Belmonte J. C. Abud H. Heath J. K. Tickle C. (1995). Fibroblast growth factors induce additional limb development from the flank of chick embryos. Cell80 (5), 739–746. 10.1016/0092-8674(95)90352-6
28
Colnot C. Lu C. Hu D. Helms J. A. (2004). Distinguishing the contributions of the perichondrium, cartilage, and vascular endothelium to skeletal development. Dev. Biol.269 (1), 55–69. 10.1016/j.ydbio.2004.01.011
29
Czarny-Ratajczak M. Lohiniva J. Rogala P. Kozlowski K. Perala M. Carter L. et al (2001). A mutation in COL9A1 causes multiple epiphyseal dysplasia: Further evidence for locus heterogeneity. Am. J. Hum. Genet.69 (5), 969–980. 10.1086/324023
30
Dahn R. D. Fallon J. F. (2000). Interdigital regulation of digit identity and homeotic transformation by modulated BMP signaling. Science289 (5478), 438–441. 10.1126/science.289.5478.438
31
Daniels K. Reiter R. Solursh M. (1996). Micromass cultures of limb and other mesenchyme. Methods Cell Biol.51, 237–247. 10.1016/s0091-679x(08)60631-7
32
Daumer K. M. Tufan A. C. Tuan R. S. (2004). Long-term in vitro analysis of limb cartilage development: Involvement of Wnt signaling. J. Cell Biochem.93 (3), 526–541. 10.1002/jcb.20190
33
Dawson L. A. Schanes P. P. Kim P. Imholt F. M. Qureshi O. Dolan C. P. et al (2018). Blastema formation and periosteal ossification in the regenerating adult mouse digit. Wound Repair Regen.26 (3), 263–273. 10.1111/wrr.12666
34
DeLise A. M. Stringa E. Woodward W. A. Mello M. A. Tuan R. S. (2000). Embryonic limb mesenchyme micromass culture as an in vitro model for chondrogenesis and cartilage maturation. Methods Mol. Biol.137, 359–375. 10.1385/1-59259-066-7:359
35
Delise A. M. Tuan R. S. (2002). Analysis of N-cadherin function in limb mesenchymal chondrogenesis in vitro. Dev. Dyn.225 (2), 195–204. 10.1002/dvdy.10151
36
Desanlis I. Paul R. Kmita M. (2020). Transcriptional trajectories in mouse limb buds reveal the transition from anterior-posterior to proximal-distal patterning at early limb bud stage. J. Dev. Biol.8 (4), 31. 10.3390/jdb8040031
37
Dolan C. P. Dawson L. A. Muneoka K. (2018). Digit tip regeneration: Merging regeneration biology with regenerative medicine. Stem Cells Transl. Med.7 (3), 262–270. 10.1002/sctm.17-0236
38
Domowicz M. S. Cortes M. Henry J. G. Schwartz N. B. (2009). Aggrecan modulation of growth plate morphogenesis. Dev. Biol.329 (2), 242–257. 10.1016/j.ydbio.2009.02.024
39
Dong K. Chen W. Pan X. Wang H. Sun Y. Qian C. et al (2022). FCER1G positively relates to macrophage infiltration in clear cell renal cell carcinoma and contributes to unfavorable prognosis by regulating tumor immunity. BMC Cancer22 (1), 140. 10.1186/s12885-022-09251-7
40
Dreyer S. D. Naruse T. Morello R. Zabel B. Winterpacht A. Johnson R. L. et al (2004). Lmx1b expression during joint and tendon formation: Localization and evaluation of potential downstream targets. Gene Expr. Patterns4 (4), 397–405. 10.1016/j.modgep.2004.01.006
41
Du Y. Huang Q. Arisdakessian C. Garmire L. X. (2020). Evaluation of STAR and kallisto on single cell RNA-seq data alignment. G3 (Bethesda)10 (5), 1775–1783. 10.1534/g3.120.401160
42
Dudley A. T. Ros M. A. Tabin C. J. (2002). A re-examination of proximodistal patterning during vertebrate limb development. Nature418 (6897), 539–544. 10.1038/nature00945
43
Edgar R. Domrachev M. Lash A. E. (2002). Gene expression Omnibus: NCBI gene expression and hybridization array data repository. Nucleic Acids Res.30 (1), 207–210. 10.1093/nar/30.1.207
44
El-Magd M. A. Abdelfattah-Hassan A. Elsisy R. A. Hawsawi Y. M. Oyouni A. A. Al-Amer O. M. et al (2021). Expression and function of Ebf1 gene during chondrogenesis in chick embryo limb buds. Gene803, 145895. 10.1016/j.gene.2021.145895
45
Eshkar-Oren I. Viukov S. V. Salameh S. Krief S. Oh C. D. Akiyama H. et al (2009). The forming limb skeleton serves as a signaling center for limb vasculature patterning via regulation of Vegf. Development136 (8), 1263–1272. 10.1242/dev.034199
46
Fadini G. P. Coracina A. Baesso I. Agostini C. Tiengo A. Avogaro A. et al (2006). Peripheral blood CD34+KDR+ endothelial progenitor cells are determinants of subclinical atherosclerosis in a middle-aged general population. Stroke37 (9), 2277–2282. 10.1161/01.STR.0000236064.19293.79
47
Franzen O. Gan L. M. Bjorkegren J. L. M. (2019). PanglaoDB: A web server for exploration of mouse and human single-cell RNA sequencing data. Database (Oxford)2019, baz046. 10.1093/database/baz046
48
Fromental-Ramain C. Warot X. Messadecq N. LeMeur M. Dolle P. Chambon P. (1996). Hoxa-13 and Hoxd-13 play a crucial role in the patterning of the limb autopod. Development122 (10), 2997–3011. 10.1242/dev.122.10.2997
49
Ganassi M. Badodi S. Ortuste Quiroga H. P. Zammit P. S. Hinits Y. Hughes S. M. (2018). Myogenin promotes myocyte fusion to balance fibre number and size. Nat. Commun.9 (1), 4232. 10.1038/s41467-018-06583-6
50
Ge S. X. Jung D. Yao R. (2020). ShinyGO: A graphical gene-set enrichment tool for animals and plants. Bioinformatics36 (8), 2628–2629. 10.1093/bioinformatics/btz931
51
Goldfarb C. A. Shaw N. Steffen J. A. Wall L. B. (2017). The prevalence of congenital hand and upper extremity anomalies based upon the New York congenital malformations registry. J. Pediatr. Orthop.37 (2), 144–148. 10.1097/BPO.0000000000000748
52
Goldfarb C. A. Wall L. B. Bohn D. C. Moen P. Van Heest A. E. (2015). Epidemiology of congenital upper limb anomalies in a midwest United States population: An assessment using the oberg, manske, and tonkin classification. J. Hand Surg. Am.40 (1), 127–132. 10.1016/j.jhsa.2014.10.038
53
Groma G. Grskovic I. Schael S. Ehlen H. W. Wagener R. Fosang A. et al (2011). Matrilin-4 is processed by ADAMTS-5 in late Golgi vesicles present in growth plate chondrocytes of defined differentiation state. Matrix Biol.30 (4), 275–280. 10.1016/j.matbio.2011.04.002
54
Hafemeister C. Satija R. (2019). Normalization and variance stabilization of single-cell RNA-seq data using regularized negative binomial regression. Genome Biol.20 (1), 296. 10.1186/s13059-019-1874-1
55
Han M. Yang X. Lee J. Allan C. H. Muneoka K. (2008). Development and regeneration of the neonatal digit tip in mice. Dev. Biol.315 (1), 125–135. 10.1016/j.ydbio.2007.12.025
56
Handschel J. G. Depprich R. A. Kubler N. R. Wiesmann H. P. Ommerborn M. Meyer U. (2007). Prospects of micromass culture technology in tissue engineering. Head. Face Med.3, 4. 10.1186/1746-160X-3-4
57
Heinonen J. Taipaleenmaki H. Roering P. Takatalo M. Harkness L. Sandholm J. et al (2011). Snorc is a novel cartilage specific small membrane proteoglycan expressed in differentiating and articular chondrocytes. Osteoarthr. Cartil.19 (8), 1026–1035. 10.1016/j.joca.2011.04.016
58
Holdener-Kenny B. Weaver S. (1986). A naturally occurring deletion in the mouse Hbbs beta-globin gene cluster. Proc. Natl. Acad. Sci. U. S. A.83 (12), 4374–4378. 10.1073/pnas.83.12.4374
59
Hu J. K. McGlinn E. Harfe B. D. Kardon G. Tabin C. J. (2012). Autonomous and nonautonomous roles of Hedgehog signaling in regulating limb muscle formation. Genes Dev.26 (18), 2088–2102. 10.1101/gad.187385.112
60
Huang B. L. Trofka A. Furusawa A. Norrie J. L. Rabinowitz A. H. Vokes S. A. et al (2016). An interdigit signalling centre instructs coordinate phalanx-joint formation governed by 5'Hoxd-Gli3 antagonism. Nat. Commun.7, 12903. 10.1038/ncomms12903
61
Huynh N. P. T. Brunger J. M. Gloss C. C. Moutos F. T. Gersbach C. A. Guilak F. (2018). Genetic engineering of mesenchymal stem cells for differential matrix deposition on 3D woven scaffolds. Tissue Eng. Part A24 (19-20), 1531–1544. 10.1089/ten.TEA.2017.0510
62
Itoh N. (2010). Hormone-like (endocrine) fgfs: Their evolutionary history and roles in development, metabolism, and disease. Cell Tissue Res.342 (1), 1–11. 10.1007/s00441-010-1024-2
63
Itoh N. Nakayama Y. Konishi M. (2016). Roles of FGFs as paracrine or endocrine signals in liver development, Health, and disease. Front. Cell Dev. Biol.4, 30. 10.3389/fcell.2016.00030
64
Itoh N. Ohta H. Konishi M. (2015). Endocrine FGFs: Evolution, physiology, pathophysiology, and pharmacotherapy. Front. Endocrinol. (Lausanne)6, 154. 10.3389/fendo.2015.00154
65
Jain A. Hermiz S. Suliman A. Herrera F. A. (2020). Hand surgery referral pattern preferences among primary Care physicians in academic centers in the southeastern United States. Ann. Plast. Surg.85 (6), 622–625. 10.1097/SAP.0000000000002549
66
Johnson G. L. Masias E. J. Lehoczky J. A. (2020). Cellular heterogeneity and lineage restriction during mouse digit tip regeneration at single-cell resolution. Dev. Cell52 (4), 525–540. 10.1016/j.devcel.2020.01.026
67
Kan A. Tabin C. J. (2013). c-Jun is required for the specification of joint cell fates. Genes Dev.27 (5), 514–524. 10.1101/gad.209239.112
68
Kelly N. H. Huynh N. P. T. Guilak F. (2020). Single cell RNA-sequencing reveals cellular heterogeneity and trajectories of lineage specification during murine embryonic limb development. Matrix Biol.89, 1–10. 10.1016/j.matbio.2019.12.004
69
Kherdjemil Y. Lalonde R. L. Sheth R. Dumouchel A. de Martino G. Pineault K. M. et al (2016). Evolution of Hoxa11 regulation in vertebrates is linked to the pentadactyl state. Nature539 (7627), 89–92. 10.1038/nature19813
70
Knosp W. M. Saneyoshi C. Shou S. Bachinger H. P. Stadler H. S. (2007). Elucidation, quantitative refinement, and in vivo utilization of the HOXA13 DNA binding site. J. Biol. Chem.282 (9), 6843–6853. 10.1074/jbc.M610775200
71
Knosp W. M. Scott V. Bachinger H. P. Stadler H. S. (2004). HOXA13 regulates the expression of bone morphogenetic proteins 2 and 7 to control distal limb morphogenesis. Development131 (18), 4581–4592. 10.1242/dev.01327
72
Kobayashi T. Chung U. I. Schipani E. Starbuck M. Karsenty G. Katagiri T. et al (2002). PTHrP and Indian hedgehog control differentiation of growth plate chondrocytes at multiple steps. Development129 (12), 2977–2986. 10.1242/dev.129.12.2977
73
Kozhemyakina E. Zhang M. Ionescu A. Ayturk U. M. Ono N. Kobayashi A. et al (2015). Identification of a Prg4-expressing articular cartilage progenitor cell population in mice. Arthritis Rheumatol.67 (5), 1261–1273. 10.1002/art.39030
74
Kusumbe A. P. Adams R. H. (2014). Osteoclast progenitors promote bone vascularization and osteogenesis. Nat. Med.20 (11), 1238–1240. 10.1038/nm.3747
75
Kyriakides T. R. Zhu Y. H. Yang Z. Bornstein P. (1998). The distribution of the matricellular protein thrombospondin 2 in tissues of embryonic and adult mice. J. Histochem Cytochem46 (9), 1007–1015. 10.1177/002215549804600904
76
Lancaster M. A. Knoblich J. A. (2014). Organogenesis in a dish: Modeling development and disease using organoid technologies. Science345 (6194), 1247125. 10.1126/science.1247125
77
Leite-Castro J. Beviano V. Rodrigues P. N. Freitas R. (2016). HoxA genes and the fin-to-limb transition in vertebrates. J. Dev. Biol.4 (1), 10. 10.3390/jdb4010010
78
Lewandoski M. Sun X. Martin G. R. (2000). Fgf8 signalling from the AER is essential for normal limb development. Nat. Genet.26 (4), 460–463. 10.1038/82609
79
Li A. Su X. Tian Y. Song G. Zan L. Wang H. (2021). Effect of actin alpha cardiac muscle 1 on the proliferation and differentiation of bovine myoblasts and preadipocytes. Anim. (Basel)11 (12), 3468. 10.3390/ani11123468
80
Liang T. Chen J. Xu G. Zhang Z. Xue J. Zeng H. et al (2021). TYROBP, TLR4 and ITGAM regulated macrophages polarization and immune checkpoints expression in osteosarcoma. Sci. Rep.11 (1), 19315. 10.1038/s41598-021-98637-x
81
Linder J. M. Pincus D. J. Panthaki Z. Thaller S. R. (2009). Congenital anomalies of the hand: An overview. J. Craniofac Surg.20 (4), 999–1004. 10.1097/SCS.0b013e3181ae21f9
82
Linke W. A. Kruger M. (2010). The giant protein titin as an integrator of myocyte signaling pathways. Physiol. (Bethesda)25 (3), 186–198. 10.1152/physiol.00005.2010
83
Loomis C. A. Harris E. Michaud J. Wurst W. Hanks M. Joyner A. L. (1996). The mouse Engrailed-1 gene and ventral limb patterning. Nature382 (6589), 360–363. 10.1038/382360a0
84
Lu Z. Chiu J. Lee L. R. Schindeler A. Jackson M. Ramaswamy Y. et al (2020). Reprogramming of human fibroblasts into osteoblasts by insulin-like growth factor-binding protein 7. Stem Cells Transl. Med.9 (3), 403–415. 10.1002/sctm.19-0281
85
Luo T. Liu Q. Tan A. Duan L. Jia Y. Nong L. et al (2020). Mesenchymal stem cell-secreted exosome promotes chemoresistance in breast cancer via enhancing miR-21-5p-mediated S100A6 expression. Mol. Ther. Oncolytics19, 283–293. 10.1016/j.omto.2020.10.008
86
Lux C. T. Yoshimoto M. McGrath K. Conway S. J. Palis J. Yoder M. C. (2008). All primitive and definitive hematopoietic progenitor cells emerging before E10 in the mouse embryo are products of the yolk sac. Blood111 (7), 3435–3438. 10.1182/blood-2007-08-107086
87
Mader S. L. Libal N. L. Pritchett-Corning K. Yang R. Murphy S. J. (2009). Refining timed pregnancies in two strains of genetically engineered mice. Lab. Anim. (NY)38 (9), 305–310. 10.1038/laban0909-305
88
Makihira S. Yan W. Ohno S. Kawamoto T. Fujimoto K. Okimura A. et al (1999). Enhancement of cell adhesion and spreading by a cartilage-specific noncollagenous protein, cartilage matrix protein (CMP/Matrilin-1), via integrin alpha1beta1. J. Biol. Chem.274 (16), 11417–11423. 10.1074/jbc.274.16.11417
89
Manley N. R. Capecchi M. R. (1995). The role of Hoxa-3 in mouse thymus and thyroid development. Development121 (7), 1989–2003. 10.1242/dev.121.7.1989
90
Marin-Llera J. C. Chimal-Monroy J. (2018). A small population of resident limb bud mesenchymal cells express few MSC-associated markers, but the expression of these markers is increased immediately after cell culture. Cell Biol. Int.42 (5), 570–579. 10.1002/cbin.10933
91
Matsushita Y. Chu A. K. Y. Tsutsumi-Arai C. Orikasa S. Nagata M. Wong S. Y. et al (2022). The fate of early perichondrial cells in developing bones. Nat. Commun.13 (1), 7319. 10.1038/s41467-022-34804-6
92
McGlinn E. Tabin C. J. (2006). Mechanistic insight into how Shh patterns the vertebrate limb. Curr. Opin. Genet. Dev.16 (4), 426–432. 10.1016/j.gde.2006.06.013
93
Mello M. A. Tuan R. S. (2006). Effects of TGF-beta1 and triiodothyronine on cartilage maturation: In vitro analysis using long-term high-density micromass cultures of chick embryonic limb mesenchymal cells. J. Orthop. Res.24 (11), 2095–2105. 10.1002/jor.20233
94
Mello M. A. Tuan R. S. (1999). High density micromass cultures of embryonic limb bud mesenchymal cells: An in vitro model of endochondral skeletal development. Vitro Cell Dev Biol Anim35 (5), 262–269. 10.1007/s11626-999-0070-0
95
Metsaranta M. Garofalo S. Smith C. Niederreither K. de Crombrugghe B. Vuorio E. (1995). Developmental expression of a type II collagen/beta-galactosidase fusion gene in transgenic mice. Dev. Dyn.204 (2), 202–210. 10.1002/aja.1002040211
96
Moffatt P. Thomas G. Sellin K. Bessette M. C. Lafreniere F. Akhouayri O. et al (2007). Osteocrin is a specific ligand of the natriuretic Peptide clearance receptor that modulates bone growth. J. Biol. Chem.282 (50), 36454–36462. 10.1074/jbc.M708596200
97
Moore M. A. Gotoh Y. Rafidi K. Gerstenfeld L. C. (1991). Characterization of a cDNA for chicken osteopontin: Expression during bone development, osteoblast differentiation, and tissue distribution. Biochemistry30 (9), 2501–2508. 10.1021/bi00223a029
98
Morgan E. A. Nguyen S. B. Scott V. Stadler H. S. (2003). Loss of Bmp7 and Fgf8 signaling in Hoxa13-mutant mice causes hypospadia. Development130 (14), 3095–3109. 10.1242/dev.00530
99
Moser M. Bosserhoff A. K. Hunziker E. B. Sandell L. Fassler R. Buettner R. (2002). Ultrastructural cartilage abnormalities in MIA/CD-RAP-deficient mice. Mol. Cell Biol.22 (5), 1438–1445. 10.1128/MCB.22.5.1438-1445.2002
100
Moutos F. T. Freed L. E. Guilak F. (2007). A biomimetic three-dimensional woven composite scaffold for functional tissue engineering of cartilage. Nat. Mater6 (2), 162–167. 10.1038/nmat1822
101
Niswander L. Tickle C. Vogel A. Booth I. Martin G. R. (1993). FGF-4 replaces the apical ectodermal ridge and directs outgrowth and patterning of the limb. Cell75 (3), 579–587. 10.1016/0092-8674(93)90391-3
102
Oberlender S. A. Tuan R. S. (1994). Spatiotemporal profile of N-cadherin expression in the developing limb mesenchyme. Cell Adhes. Commun.2 (6), 521–537. 10.3109/15419069409014216
103
Owens E. M. Solursh M. (1982). Cell-cell interaction by mouse limb cells during in vitro chondrogenesis: Analysis of the brachypod mutation. Dev. Biol.91 (2), 376–388. 10.1016/0012-1606(82)90043-4
104
Ozeki N. Mogi M. Hase N. Hiyama T. Yamaguchi H. Kawai R. et al (2016). Polyphosphate-induced matrix metalloproteinase-13 is required for osteoblast-like cell differentiation in human adipose tissue derived mesenchymal stem cells. Biosci. Trends10 (5), 365–371. 10.5582/bst.2016.01153
105
Parr B. A. McMahon A. P. (1995). Dorsalizing signal Wnt-7a required for normal polarity of D-V and A-P axes of mouse limb. Nature374 (6520), 350–353. 10.1038/374350a0
106
Patel J. Donovan P. Khosrotehrani K. (2016). Concise review: Functional definition of endothelial progenitor cells: A molecular perspective. Stem Cells Transl. Med.5 (10), 1302–1306. 10.5966/sctm.2016-0066
107
Patel J. Seppanen E. J. Rodero M. P. Wong H. Y. Donovan P. Neufeld Z. et al (2017). Functional definition of progenitors versus mature endothelial cells reveals key SoxF-dependent differentiation process. Circulation135 (8), 786–805. 10.1161/CIRCULATIONAHA.116.024754
108
Paulsen D. F. Solursh M. (1988). Microtiter micromass cultures of limb-bud mesenchymal cells. Vitro Cell Dev Biol24 (2), 138–147. 10.1007/BF02623891
109
Perez W. D. Weller C. R. Shou S. Stadler H. S. (2010). Survival of Hoxa13 homozygous mutants reveals a novel role in digit patterning and appendicular skeletal development. Dev. Dyn.239 (2), 446–457. 10.1002/dvdy.22183
110
Petersen W. Tsokos M. Pufe T. (2002). Expression of VEGF121 and VEGF165 in hypertrophic chondrocytes of the human growth plate and epiphyseal cartilage. J. Anat.201 (2), 153–157. 10.1046/j.1469-7580.2002.00085.x
111
Pirosa A. Clark K. L. Tan J. Yu S. Yang Y. Tuan R. S. et al (2019). Modeling appendicular skeletal cartilage development with modified high-density micromass cultures of adult human bone marrow-derived mesenchymal progenitor cells. Stem Cell Res. Ther.10 (1), 388. 10.1186/s13287-019-1505-5
112
Platt I. D. El-Sohemy A. (2009). Regulation of osteoblast and adipocyte differentiation from human mesenchymal stem cells by conjugated linoleic acid. J. Nutr. Biochem.20 (12), 956–964. 10.1016/j.jnutbio.2008.08.008
113
Qi J. Liu Q. Reisdorf R. L. Boroumand S. Behfar A. Moran S. L. et al (2020). Characterization of a purified exosome product and its effects on canine flexor tenocyte biology. J. Orthop. Res.38 (8), 1845–1855. 10.1002/jor.24587
114
Qiu H. Shao Z. Wen X. Jiang J. Ma Q. Wang Y. et al (2021). TREM2: Keeping pace with immune checkpoint inhibitors in cancer immunotherapy. Front. Immunol.12, 716710. 10.3389/fimmu.2021.716710
115
Qiu Q. Chen H. Johnson R. L. (2009). Lmx1b-expressing cells in the mouse limb bud define a dorsal mesenchymal lineage compartment. Genesis47 (4), 224–233. 10.1002/dvg.20430
116
Reinhardt D. P. Sasaki T. Dzamba B. J. Keene D. R. Chu M. L. Gohring W. et al (1996). Fibrillin-1 and fibulin-2 interact and are colocalized in some tissues. J. Biol. Chem.271 (32), 19489–19496. 10.1074/jbc.271.32.19489
117
Rentsendorj O. Nagy A. Sinko I. Daraba A. Barta E. Kiss I. (2005). Highly conserved proximal promoter element harbouring paired Sox9-binding sites contributes to the tissue- and developmental stage-specific activity of the matrilin-1 gene. Biochem. J.389 (3), 705–716. 10.1042/BJ20050214
118
Roldan J. F. Del Rincon I. Escalante A. (2006). Loss of cortical bone from the metacarpal diaphysis in patients with rheumatoid arthritis: Independent effects of systemic inflammation and glucocorticoids. J. Rheumatol.33 (3), 508–516.
119
Sassoon D. Lyons G. Wright W. E. Lin V. Lassar A. Weintraub H. et al (1989). Expression of two myogenic regulatory factors myogenin and MyoD1 during mouse embryogenesis. Nature341 (6240), 303–307. 10.1038/341303a0
120
Sato K. Koizumi Y. Takahashi M. Kuroiwa A. Tamura K. (2007). Specification of cell fate along the proximal-distal axis in the developing chick limb bud. Development134 (7), 1397–1406. 10.1242/dev.02822
121
Sato K. Suematsu A. Nakashima T. Takemoto-Kimura S. Aoki K. Morishita Y. et al (2006). Regulation of osteoclast differentiation and function by the CaMK-CREB pathway. Nat. Med.12 (12), 1410–1416. 10.1038/nm1515
122
Saunders J. W. Jr (1948). The proximo-distal sequence of origin of the parts of the chick wing and the role of the ectoderm. J. Exp. Zool.108 (3), 363–403. 10.1002/jez.1401080304
123
Schaffler M. B. Cheung W. Y. Majeska R. Kennedy O. (2014). Osteocytes: Master orchestrators of bone. Calcif. Tissue Int.94 (1), 5–24. 10.1007/s00223-013-9790-y
124
Scherz P. J. Harfe B. D. McMahon A. P. Tabin C. J. (2004). The limb bud Shh-Fgf feedback loop is terminated by expansion of former ZPA cells. Science305 (5682), 396–399. 10.1126/science.1096966
125
Schmid R. Bosserhoff A. K. (2014). Redundancy in regulation of chondrogenesis in MIA/CD-RAP-deficient mice. Mech. Dev.131, 24–34. 10.1016/j.mod.2013.11.001
126
Seichert V. Rychter Z. (1972). Vascularization of developing anterior lamb of the chick embryo. II. Differentiation of vascular bed and its significance for the location of morphogenetic processes inside the limb bud. Folia Morphol. (Praha)20 (4), 352–361.
127
Seichert V. Rychter Z. (1971). Vascularization of the developing anterior limb of the chick embryo. I. Sinus marginalis, its development, fate and importance. Folia Morphol. (Praha)19 (4), 367–377.
128
Sheth R. Barozzi I. Langlais D. Osterwalder M. Nemec S. Carlson H. L. et al (2016). Distal limb patterning requires modulation of cis-regulatory activities by HOX13. Cell Rep.17 (11), 2913–2926. 10.1016/j.celrep.2016.11.039
129
Shou S. Carlson H. L. Perez W. D. Stadler H. S. (2013). HOXA13 regulates Aldh1a2 expression in the autopod to facilitate interdigital programmed cell death. Dev. Dyn.242 (6), 687–698. 10.1002/dvdy.23966
130
Shukunami C. Takimoto A. Nishizaki Y. Yoshimoto Y. Tanaka S. Miura S. et al (2018). Scleraxis is a transcriptional activator that regulates the expression of Tenomodulin, a marker of mature tenocytes and ligamentocytes. Sci. Rep.8 (1), 3155. 10.1038/s41598-018-21194-3
131
Shukunami C. Takimoto A. Oro M. Hiraki Y. (2006). Scleraxis positively regulates the expression of tenomodulin, a differentiation marker of tenocytes. Dev. Biol.298 (1), 234–247. 10.1016/j.ydbio.2006.06.036
132
Shwartz Y. Viukov S. Krief S. Zelzer E. (2016). Joint development involves a continuous influx of gdf5-positive cells. Cell Rep.15 (12), 2577–2587. 10.1016/j.celrep.2016.05.055
133
Sidney L. E. Branch M. J. Dunphy S. E. Dua H. S. Hopkinson A. (2014). Concise review: Evidence for CD34 as a common marker for diverse progenitors. Stem Cells32 (6), 1380–1389. 10.1002/stem.1661
134
Solursh M. Ahrens P. B. Reiter R. S. (1978). A tissue culture analysis of the steps in limb chondrogenesis. Vitro14 (1), 51–61. 10.1007/bf02618173
135
Stadler H. S. Higgins K. M. Capecchi M. R. (2001). Loss of Eph-receptor expression correlates with loss of cell adhesion and chondrogenic capacity in Hoxa13 mutant limbs. Development128 (21), 4177–4188. 10.1242/dev.128.21.4177
136
Storm E. E. Kingsley D. M. (1999). GDF5 coordinates bone and joint formation during digit development. Dev. Biol.209 (1), 11–27. 10.1006/dbio.1999.9241
137
Stuart T. Butler A. Hoffman P. Hafemeister C. Papalexi E. Mauck W. M. 3rd et al (2019). Comprehensive integration of single-cell data. Cell177 (7), 1888–1902. 10.1016/j.cell.2019.05.031
138
Su N. Chen M. Chen S. Li C. Xie Y. Zhu Y. et al (2013). Overexpression of H1 calponin in osteoblast lineage cells leads to a decrease in bone mass by disrupting osteoblast function and promoting osteoclast formation. J. Bone Min. Res.28 (3), 660–671. 10.1002/jbmr.1778
139
Summerbell D. Lewis J. H. Wolpert L. (1973). Positional information in chick limb morphogenesis. Nature244 (5417), 492–496. 10.1038/244492a0
140
Summerbell D. Wolpert L. (1973). Precision of development in chick limb morphogenesis. Nature244 (5413), 228–230. 10.1038/244228a0
141
Sun X. Mariani F. V. Martin G. R. (2002). Functions of FGF signalling from the apical ectodermal ridge in limb development. Nature418 (6897), 501–508. 10.1038/nature00902
142
Tajbakhsh S. Rocancourt D. Buckingham M. (1996). Muscle progenitor cells failing to respond to positional cues adopt non-myogenic fates in myf-5 null mice. Nature384 (6606), 266–270. 10.1038/384266a0
143
Takeuchi T. Matsubara H. Minamitani F. Satoh Y. Tozawa S. Moriyama T. et al (2022). Newt Hoxa13 has an essential and predominant role in digit formation during development and regeneration. Development149 (5). 10.1242/dev.200282
144
Takimoto A. Nishizaki Y. Hiraki Y. Shukunami C. (2009). Differential actions of VEGF-A isoforms on perichondrial angiogenesis during endochondral bone formation. Dev. Biol.332 (2), 196–211. 10.1016/j.ydbio.2009.05.552
145
Teo B. H. Bobryshev Y. V. Teh B. K. Wong S. H. Lu J. (2012). Complement C1q production by osteoclasts and its regulation of osteoclast development. Biochem. J.447 (2), 229–237. 10.1042/BJ20120888
146
Tickle C. Summerbell D. Wolpert L. (1975). Positional signalling and specification of digits in chick limb morphogenesis. Nature254 (5497), 199–202. 10.1038/254199a0
147
Tickle C. Wolpert L. (2002). The progress zone – alive or dead?Nat. Cell Biol.4 (9), E216–E217. 10.1038/ncb0902-e216
148
Tozer S. Bonnin M. A. Relaix F. Di Savino S. Garcia-Villalba P. Coumailleau P. et al (2007). Involvement of vessels and PDGFB in muscle splitting during chick limb development. Development134 (14), 2579–2591. 10.1242/dev.02867
149
Trofka A. Huang B. L. Zhu J. Heinz W. F. Magidson V. Shibata Y. et al (2021). Genetic basis for an evolutionary shift from ancestral preaxial to postaxial limb polarity in non-urodele vertebrates. Curr. Biol.31 (22), 4923–4934.e5. 10.1016/j.cub.2021.09.010
150
Villavicencio-Lorini P. Kuss P. Friedrich J. Haupt J. Farooq M. Turkmen S. et al (2010). Homeobox genes d11-d13 and a13 control mouse autopod cortical bone and joint formation. J. Clin. Invest120 (6), 1994–2004. 10.1172/JCI41554
151
Wanek N. Muneoka K. Holler-Dinsmore G. Burton R. Bryant S. V. (1989). A staging system for mouse limb development. J. Exp. Zool.249 (1), 41–49. 10.1002/jez.1402490109
152
Wolpert L. (1990). Signals in limb development: STOP, GO, STAY and POSITION. J. Cell Sci. Suppl.13, 199–208. 10.1242/jcs.1990.supplement_13.18
153
Wolpert L. Lewis J. Summerbell D. (1975). Morphogenesis of the vertebrate limb. Ciba Found. Symp.0 (29), 95–130. 10.1002/9780470720110.ch6
154
Wood W. M. Etemad S. Yamamoto M. Goldhamer D. J. (2013). MyoD-expressing progenitors are essential for skeletal myogenesis and satellite cell development. Dev. Biol.384 (1), 114–127. 10.1016/j.ydbio.2013.09.012
155
Wu L. Wei Q. Lv Y. Xue J. Zhang B. Sun Q. et al (2019). Wnt/β-Catenin pathway is involved in cadmium-induced inhibition of osteoblast differentiation of bone marrow mesenchymal stem cells. Int. J. Mol. Sci.20 (6), 1519. 10.3390/ijms20061519
156
Xia B. Li Y. Zhou J. Tian B. Feng L. (2017). Identification of potential pathogenic genes associated with osteoporosis. Bone Jt. Res.6 (12), 640–648. 10.1302/2046-3758.612.BJR-2017-0102.R1
157
Yagi M. Ji F. Charlton J. Cristea S. Messemer K. Horwitz N. et al (2021). Dissecting dual roles of MyoD during lineage conversion to mature myocytes and myogenic stem cells. Genes Dev.35 (17-18), 1209–1228. 10.1101/gad.348678.121
158
Yahara Y. Barrientos T. Tang Y. J. Puviindran V. Nadesan P. Zhang H. et al (2020). Erythromyeloid progenitors give rise to a population of osteoclasts that contribute to bone homeostasis and repair. Nat. Cell Biol.22 (1), 49–59. 10.1038/s41556-019-0437-8
159
Yahara Y. Nguyen T. Ishikawa K. Kamei K. Alman B. A. (2022). The origins and roles of osteoclasts in bone development, homeostasis and repair. Development149 (8), dev199908. 10.1242/dev.199908
160
Yang J. Qin S. Yi C. Ma G. Zhu H. Zhou W. et al (2011). MiR-140 is co-expressed with Wwp2-C transcript and activated by Sox9 to target Sp1 in maintaining the chondrocyte proliferation. FEBS Lett.585 (19), 2992–2997. 10.1016/j.febslet.2011.08.013
161
Yokoyama S. Furukawa S. Kitada S. Mori M. Saito T. Kawakami K. et al (2017). Analysis of transcription factors expressed at the anterior mouse limb bud. PLoS One12 (5), e0175673. 10.1371/journal.pone.0175673
162
Yu L. Dawson L. A. Yan M. Zimmel K. Lin Y. L. Dolan C. P. et al (2019). BMP9 stimulates joint regeneration at digit amputation wounds in mice. Nat. Commun.10 (1), 424. 10.1038/s41467-018-08278-4
163
Yvernogeau L. Auda-Boucher G. Fontaine-Perus J. (2012). Limb bud colonization by somite-derived angioblasts is a crucial step for myoblast emigration. Development139 (2), 277–287. 10.1242/dev.067678
164
Zappia L. Oshlack A. (2018). Clustering trees: A visualization for evaluating clusterings at multiple resolutions. Gigascience7 (7), giy083. 10.1093/gigascience/giy083
165
Zelzer E. McLean W. Ng Y. S. Fukai N. Reginato A. M. Lovejoy S. et al (2002). Skeletal defects in VEGF(120/120) mice reveal multiple roles for VEGF in skeletogenesis. Development129 (8), 1893–1904. 10.1242/dev.129.8.1893
166
Zhang C. H. Gao Y. Jadhav U. Hung H. H. Holton K. M. Grodzinsky A. J. et al (2021). Creb5 establishes the competence for Prg4 expression in articular cartilage. Commun. Biol.4 (1), 332. 10.1038/s42003-021-01857-0
167
Zhang X. Ziran N. Goater J. J. Schwarz E. M. Puzas J. E. Rosier R. N. et al (2004). Primary murine limb bud mesenchymal cells in long-term culture complete chondrocyte differentiation: TGF-beta delays hypertrophy and PGE2 inhibits terminal differentiation. Bone34 (5), 809–817. 10.1016/j.bone.2003.12.026
168
Zheng G. X. Terry J. M. Belgrader P. Ryvkin P. Bent Z. W. Wilson R. et al (2017). Massively parallel digital transcriptional profiling of single cells. Nat. Commun.8, 14049. 10.1038/ncomms14049
169
Zhu J. Nakamura E. Nguyen M. T. Bao X. Akiyama H. Mackem S. (2008). Uncoupling Sonic hedgehog control of pattern and expansion of the developing limb bud. Dev. Cell14 (4), 624–632. 10.1016/j.devcel.2008.01.008
Summary
Keywords
in vitro , autopod development, joint development, single cell RNA sequencing, HOXA13
Citation
Fuiten AM, Yoshimoto Y, Shukunami C and Stadler HS (2023) Digits in a dish: An in vitro system to assess the molecular genetics of hand/foot development at single-cell resolution. Front. Cell Dev. Biol. 11:1135025. doi: 10.3389/fcell.2023.1135025
Received
31 December 2022
Accepted
21 February 2023
Published
13 March 2023
Volume
11 - 2023
Edited by
Jessica Lehoczky, Brigham and Women’s Hospital, Harvard Medical School, United States
Reviewed by
Jeff Innis, Michigan Medicine, University of Michigan, United States
Yasuhiko Kawakami, University of Minnesota Twin Cities, United States
Updates
Copyright
© 2023 Fuiten, Yoshimoto, Shukunami and Stadler.
This is an open-access article distributed under the terms of the Creative Commons Attribution License (CC BY). The use, distribution or reproduction in other forums is permitted, provided the original author(s) and the copyright owner(s) are credited and that the original publication in this journal is cited, in accordance with accepted academic practice. No use, distribution or reproduction is permitted which does not comply with these terms.
*Correspondence: H. Scott Stadler, stadlers@ohsu.edu
This article was submitted to Morphogenesis and Patterning, a section of the journal Frontiers in Cell and Developmental Biology
Disclaimer
All claims expressed in this article are solely those of the authors and do not necessarily represent those of their affiliated organizations, or those of the publisher, the editors and the reviewers. Any product that may be evaluated in this article or claim that may be made by its manufacturer is not guaranteed or endorsed by the publisher.