 Jinshu Xu1†
 Xianxiao Zhou
 Ting Zhang
 Pin-Xian Xu
- 1Department of Genetics and Genomic Sciences, Icahn School of Medicine at Mount Sinai, New York, NY, United States
- 2Mount Sinai Center for Transformative Disease Modeling, Icahn School of Medicine at Mount Sinai, New York, NY, United States
- 3Department of Pharmacological Sciences, Icahn School of Medicine at Mount Sinai, New York, NY, United States
- 4Department of Cell, Developmental and Regenerative Biology, Icahn School of Medicine at Mount Sinai, New York, NY, United States
Kidney formation and nephrogenesis are controlled by precise spatiotemporal gene expression programs, which are coordinately regulated by cell-cycle, cell type-specific transcription factors and epigenetic/chromatin regulators. However, the roles of epigenetic/chromatin regulators in kidney development and disease remain poorly understood. In this study, we investigated the impact of deleting the chromatin remodeling factor Smarca4 (Brg1), a human Wilms tumor-associated gene, in Wnt4-expressing cells. Smarca4 deficiency led to severe tubular defects and a shortened medulla. Through unbiased single-cell RNA sequencing analyses, we identified multiple types of Wnt4Cre-labeled interstitial cells, along with nephron-related cells. Smarca4 deficiency increased interstitial cells but markedly reduced tubular cells, resulting in cells with mixed identity and elevated expression of cell-cycle regulators and genes associated with extracellular matrix and epithelial-to-mesenchymal transition/fibrosis. We found that Smarca4 loss induced a significant upregulation of the oncogene Pttg1 and hyperproliferation of Wnt4Cre-labeled cells. These changes in the cellular state could hinder the cellular transition into characteristic tubular structures, eventually leading to fibrosis. In conclusion, our findings shed light on novel cell types and genes associated with Wnt4Cre-labeled cells and highlight the critical role of Smarca4 in regulating tubular cell differentiation and the expression of the cancer-causing gene Pttg1 in the kidney. These findings may provide valuable insights into potential therapeutic strategies for renal cell carcinoma resulting from SMARCA4 deficiency.
Introduction
Kidney failure is a devastating health condition and ranks among the top causes of death worldwide. In the United States, more than 37 million adults (15%) are living with chronic kidney disease (CKD), a condition that can progress to kidney failure, currently affecting nearly 786,000 people (www.cdc.gov/kidneydisease). Therefore, it is critical to gain a comprehensive understanding of the disease mechanisms at various levels of regulation, including gene mutation, epigenetic and microRNA regulation. In most kidney diseases, the nephrons − the structures responsible for filtering waste from the blood to producing concentrated urine − lose their filtering capacity. The nephron is a segmented structure consisting of a glomerulus, proximal tube (PT), the Henle’s loop (HL), distal tubule (DT), and the connecting tubule (CNT), which fuses with the collecting duct (CD) system. Each segment has specialized functions in glucose and solute transport, acid-base balance, and water homeostasis. Therefore, correct segmentation of the nephron is crucial for proper kidney function, and any disruption in this process can lead to disease.
Nephrons develop from Six2+ multipotent mesenchymal nephron progenitor cells (NPCs) that differentiate into pretubular aggregates (PTAs) upon induction by ureteric bud (UB) (Park et al., 2012). The PTAs then undergo epithelization to form renal vesicles (RVs), which further develop into comma-shaped bodies (CSBs) and S-shaped bodies (SSBs) through a series of invaginations and elongations in the kidney cortical region. While new nephrons are continuously generated, older ones migrate towards the medulla as their HL elongates. Recent studies have emphasized the critical role of cell-cell signaling from the surrounding mesenchymal interstitium in nephrogenesis (Schedl and Hastie, 2000; Li et al., 2014; Wilson and Little, 2021). It is worth noting that each nephron is composed of over 20 different cell types (Al-Awqati and Oliver, 2002), and the kidney contains multiple distinct interstitial cells (Li et al., 2014; Wilson and Little, 2021). Despite recent advances in large-scale sequencing studies (Adam et al., 2017; Lindstrom et al., 2018; Combes et al., 2019; Hochane et al., 2019), our current understanding of how these different cell types are established and maintained in the kidney remains limited.
Proper cell development is determined by gene expression programs, which are coordinately regulated by cell-cycle regulators, lineage-specific transcription factors (TFs), and chromatin regulators. Previous studies have identified several TFs with regionalized expression in the RV/SSB that are critical for nephron segmentation (El-Dahr et al., 2008; Georgas et al., 2009; Little and McMahon, 2012), but the roles of epigenetic/chromatin regulators in kidney development and disease remain poorly understood. Chromatin remodelers regulate chromatin structure in an ATP-dependent manner to facilitate TF binding and interact with TFs to regulate transcription in an ATP-independent manner (Trotter and Archer, 2008). The SWI/SNF (BAF) chromatin remodeling complexes are involved in virtually every stage of cell proliferation and differentiation, stem cells, and cancer (Ho and Crabtree, 2010; Hargreaves and Crabtree, 2011). SMARCA4 (BRG1) is the central ATPase of BAF complexes and has been identified as a major tumor suppressor (Davoli et al., 2013; Hodges et al., 2016). Somatic mutations in SMARCA4 are associated with childhood cancers (Howe et al., 2006; Turnbull et al., 2012; Fu et al., 2017; Jia et al., 2017), including Wilms tumors (4.5% prevalence) (Rakheja et al., 2014). We recently characterized the role of Smarca4 in Six2+ NPCs and demonstrated that it interacts with Eya1 and Six2 to maintain the progenitors (Li et al., 2021). Since Smarca4 is also expressed in PTAs, RVs and SSBs (Basta et al., 2020; Li et al., 2021), this prompted us to examine its potential roles in nephron tubulogenesis by specifically deleting Smarca4 from PTA-RV-SSB stage using the Wnt4Cre (Wnt4GFPCre) line (Mugford et al., 2009; Chung et al., 2017). Wnt4 is one of the earliest genes marking the differentiation of nephron precursors from the PTA stage (Stark et al., 1994; Mugford et al., 2009; Shan et al., 2010) and is also expressed in collecting duct-associated stroma (Itaranta et al., 2006; Shan et al., 2010; England et al., 2020). Although Wnt4Cre mice have previously been used by multiple groups for gene knockout (KO), the molecular characterization of Wnt4Cre-labeled cells remains unexplored.
Here, we report that Smarca4 KO in Wnt4-expressing (Wnt4+) cells led to defective segmentation and elongation of nephron tubules, resulting in a shortened medulla. Through a combination of clustering, transcriptomic trajectories, and pseudotime analysis, we defined the distinctive composition of Wnt4Cre-labeled cells and uncovered changes in cellular state/identity induced by Smarca4 KO. Our analyses demonstrated that in Smarca4-deficient kidneys, the expression of the oncogene Pttg1 was significantly upregulated in Wnt4Cre-labeled cells, which proliferated excessively and displayed elevated expression of cell cycle regulators and genes involved in extracellular matrix (ECM) and epithelial-to-mesenchymal transition (EMT)/fibrosis. Together, our study has uncovered novel cell types and genes associated with Wnt4Cre-labeled cells. We have identified the crucial role of Smarca4 in regulating tubular cell differentiation and the expression of the cancer-causing gene Pttg1 in the kidney. These findings may shed new light on therapeutic strategies for renal cell carcinoma resulting from SWI/SNF complex deficiency.
Materials and methods
Mice
Smarca4fl (MMRRC stock number 036548-UNC) (Sumi-Ichinose et al., 1997) and Wnt4tm3(EGFP/cre)Amc (Wnt4Cre) (Mugford et al., 2009) and R26-tdTomato (Madisen et al., 2010) mice were maintained on a 129/Sv and C57BL/6J mixed background. Mice were bred using timed mating, and noon on the day of vaginal plug detection was considered as E0.5. All animal experiments were performed in accordance with animal care guidelines, and the protocol was approved by the IACUC of the Icahn School of Medicine at Mount Sinai (#06-822).
Histology, in situ hybridization (ISH) and immunostaining
Histologic examinations were performed as described previously (Xu et al., 2014). Dissected kidneys were fixed in 4% paraformaldehyde (PFA), embedded in paraffin, and cut into 6–8 μm sections. Whole-mount or section ISH and immunostaining were performed according to standard procedures. For section ISH, kidneys isolated at specific stages were fixed overnight in 4% PFA at 4°C and cryopreserved in 30% sucrose. Tissues were frozen in OCT (Tissue Tek) and sectioned at 9 μm. Antisense and sense RNA probes were generated using T7 or T3 RNA polymerase according to standard procedures.
Lectins and primary antibodies
Lectin: PHA-L (Phaseolus vulgaris leucoagglutinin lectin) and LTL (Lotus Tetragonolobus lectin) (FL-1111-2 and FL-1321-2, Vector Laboratories). Primary antibodies: anti-Smarca4/Brg1 (ab110641, Abcam), -Wt1 (sc192, Santa Cruz Biotechnology); -THP (Santa Cruz, sc-271022), -NCC (EMD Millipore, AB3553), –phosphohistone-H3 (EMD Millipore, 06-570), -Tnnt2 (ab209813, Abcam), -aSMA (clone 1A4 and A5228, Sigma), -Ncam (sc-1507, Santa Cruz), -Vimentin (ab92547, Abcam), -Pttg1 (HPA045034, Atlas antibodies), -Tyrobp (MBS7127061, MyBiosource), -Foxd1 (MBS9204091, MyBiosource), and -Dlk1 (ab210471, Abcam).
Single-cell preparation and FACS isolation of single tdTomato+ cells
For single-cell isolation, kidneys from R26-tdTomato, Wnt4Cre/+;R26-tdTomato or Wnt4Cre/+;Smarca4fl/fl;R26-tdTomato embryos at E18.5 were collected and then minced into 1–3 mm cubes, followed by dissociation in PBS containing 1 mg/mL Dispase and 0.7 mg/mL collagenase IV for 20 min at 37°C with pipetting up and down samples every 5 min. Then, the digested tissues were filtered with a 40-μm nylon cell strain (BD Falcon). The filtered cell suspension was centrifuged at 200 g for 5 min. After removal of the supernatant, the cell pellets were washed with PBS twice to remove fragments and then resuspended in PBS containing 1 mM EDTA. To identify and isolate tdTomato+ cells, single-cell suspensions of tdTomato− cells from R26-tdTomato was subjected to fluorescence-activated cell sorting (FACS) to establish gates and regions that can distinguish tdTomato− from tdTomato+ populations, and subsequently sort and collect tdTomato+ cells. We collected control and mutant tdTomato+ cells from three embryos (6 kidneys) from 2 different litters respectively.
scRNA-seq library preparation
Individually barcoded scRNA-seq libraries were prepared using the Chromium Platform (10x Genomics) with the 3′ gene expression V3 kit, using an input of approximately 10,000 cells. Briefly, Gel-bead in emulsions (GEM) were generated on the sample chip in the Chromium controller. Barcoded cDNA was extracted from the GEMs by post-GEM RT-cleanup and amplified for 12 cycles. Amplified cDNA was fragmented and subjected to end repair, poly A-tailing, adapter ligation, and 10 ×–specific sample indexing following the manufacturer’s protocol. Libraries were quantified using Bioanalyzer (Agilent Technologies) and QuBit (Thermo Fisher Scientific) analysis. Libraries were sequenced in paired-end mode on a NovaSeq Instrument (Illumina) targeting a depth of 5 × 10⁴-1 × 10⁵ reads per cell. Sequencing data were aligned and quantified using the Cell Ranger Single-Cell Software Suite (version 3.0, 10 × Genomics) against the provided mm10 reference genome.
scRNA-seq data analysis
scRNA-seq raw data were processed using the 10X Genomics Cellranger v3 to obtain gene expression counts of each barcode for the mutant and control, respectively. Cell ranger QC was applied to the count matrices to remove non-cells. Filtered gene and barcode count matrices were used for scRNA-seq analysis with a custom R pipeline centered around the Seurat package v4.0.3 (Hao et al., 2021), in addition to other publicly available R packages (see below). To remove potential artifacts due to low-quality cells and lowly expressed genes, cells expressing less than 500 genes and genes detected in less than 5 cells were excluded from the analysis. Gene counts for each cell are normalized by dividing the total counts for that cell and multiplying a scale factor of 10,000. Natural-log transformation is then applied to the expression levels plus 1. Next, the top 5,000 most variable genes were identified using the variance stabilizing transformation method. To integrate the mutant and control samples, 5,000 anchor genes were identified between the two samples. After the integration, expression levels were centered and scaled by subtracting the average expression and dividing their standard deviations for each feature. Principal Component Analysis (PCA) dimensionality reduction was applied to the scaled data using the variable genes to calculate the top 30 principal components (PCs). To visualize the cells at a low dimensionality, non-linear dimensional reduction approaches UMAP (McInnes et al., 2018) and tSNE (van der Maaten and Hinton, 2008) were performed using the PCs as input. To cluster the cells, a shared nearest neighbor (SNN) graph (Jarvis and Patrick, 1973) was constructed by calculating the neighborhood overlap between each cell and its 20 nearest neighbors using the Jaccard index (Jaccard, 1912). A local moving algorithm (Waltman and van Eck, 2013) was then performed on the global SNN graph to optimize a modularity function to determine clusters at a resolution of 0.5. To study the detailed cell type characteristics at high resolutions, the cell subsets of tubule progenitors, proximal tubule and stroma were extracted from the global analysis and re-clustered at resolutions of 0.5, 0.25 and 0.4, respectively.
To identify conserved cell cluster markers, differentially expressed genes (DEGs) were identified between a cluster and the rest cells for mutant and control, respectively, using the Wilcoxon Rank Sum test. p-values were adjusted by the Benjamini-Hochberg (BH) procedure (Benjamini and Hochberg, 1995). A gene was identified as a potential conserved marker for a cluster if its adjusted p-values were less than 0.05 in both mutant and control. The potential markers were then ranked by average log fold change in mutant and control by descending order. The top 100 markers for each cluster were then manually compared with known kidney cell type markers from the previous kidney studies (Combes et al., 2019; Miao et al., 2021) and the PanglaoDB database (Franzen et al., 2019). Cell clusters were then annotated based on the maximum overlap of the cluster markers and cell type markers.
Heatmaps were plotted with the top 4–6 markers from each cell type. DEGs between mutant and control were identified for each cell type using the DESeq2 (Love et al., 2014). p-values were corrected using the BH procedure (Benjamini and Hochberg, 1995).
Gene set enrichment analysis (GSEA) and gene ontology (GO) enrichment analysis
GSEA was performed using ranked fold change values (mutant over control). The enrichment score was calculated according to the GSEA algorithm (Subramanian et al., 2005). GO enrichment analysis was performed using http://bioinformatics.sdstate.edu/idep (Ge et al., 2018).
Trajectory analysis
Trajectory analysis was performed on the control cells, mutant cells, and both mutant and control combined using the R package Monocle 3 v1.0.0 (Cao et al., 2019). For the global analysis, the nephron progenitor cells were set as the root cells. For the stroma subclusters, the CD-associated stroma, nephrogenic stromal progenitors or fibroblast cells were set as root cells. For the endothelial cells, endothelial subtype 2 was set as root.
Reverse transcription and real-time PCR (RT-qPCR)
FACS-purified TdTomato+ cells from Wnt4Cre/+ control and Smarca4cKO/cKO kidneys collected from E17.5 kidneys were used for total RNA extraction using Trizol Reagents (15596026, Invitrogen). 0.5–1 μg of total RNAs were treated with RNase-Free DNase I Set (79254, QIAGEN) and then used for reverse transcription using a SuperScript IV Reverse Transcriptase (18090010, Thermo Fisher Scientific) for first-Strand cDNA Synthesis. Real-time PCR was performed using iQ SYBR Green Master Mix (4309155, Applied Biosystems). Expression levels of each transcript were normalized using β-actin as an internal control. Each set of experiments was repeated three times, and the DDCT relative quantification method was used to evaluate quantitative variation.
Oligos used for qPCR: Pttg1-froward 5′-GCAGTGGGTGAAGTTGAACAC-3′ and Pttg1-reverse 5′-CAGTGGTTGACAAGTTACTGT-3'; β-actin-forward 5′-CATTGTTACCAACTGGGACGA-3′ and β-actin-reverse 5′-GAAGGTCTCAAACATGATCTG-3'.
Statistics
PH3+ cells were counted from sections with clear cortical UB, PTA and SSB and medullary structures. PH3+ cells were counted in cortical regions around 32 UBs, including peripheral nephrogenic stroma and ventral PTAs, as well as 32 SSBs per kidney and medullary area 20 × 0.01 mm2 per kidney, respectively, and 3 kidneys at E18.5 were counted. Values represent the average number of PH3+ cells (±standard deviations) per UB-PTA-SSB for the cortical or 0.01 mm2 for the medullary area (section thickness is 6 μm).
TUNEL+ cells from 10 sections with clear cortical and medullary structures per E18.5 kidney and 3 kidneys were counted from the medullary region extending into the deep cortical region, respectively. Values represent the average number of TUNEL+ cells (±standard deviations) per section (6 μm).
Two-tailed Student’s t-test was used for statistical analysis. A value was considered statistically significant if p < 0.05.
Spatial calibration
The area of the Dll1+ domain was measured on sections for spatial calibration using ImageJ software (NIH). The area of the Dll1+ domain from 18 SSBs (8 sections per kidney and 3 kidneys for each sample) was measured. Two-tailed Student’s t-test was used for statistical analysis.
Results
Smarca4 deletion in Wnt4-expressing cells leads to severe tubular defects and shortened medulla
To investigate whether Smarca4 expression in nephron primordia is required for tubulogenesis, we crossed Wnt4Cre/+ mice with Smarca4fl/fl to delete Smarca4 in Wnt4-expressing (Wnt4+) precursors, resulting in the conditional Smarca4 KO mice (Smarca4cKO). Immunostaining confirmed Smarca4 depletion in CSBs/SSBs of Smarca4cKO kidneys (Supplementary Figure S1A). The mutant kidneys at E18.5 were smaller, with a length approximately 24.9% ± 1.6% shorter than that of control littermates (Supplementary Figure S1B; n = 8 and p = 0.0225). Histological analysis revealed a significantly shortened medullary region with reduced epithelial tubules and increased interstitium (Figure 1A). Quantification of glomerular numbers showed that the number of glomeruli in Smarca4cKO was 58.4% ± 1.5% of that in Wnt4Cre/+ littermates.
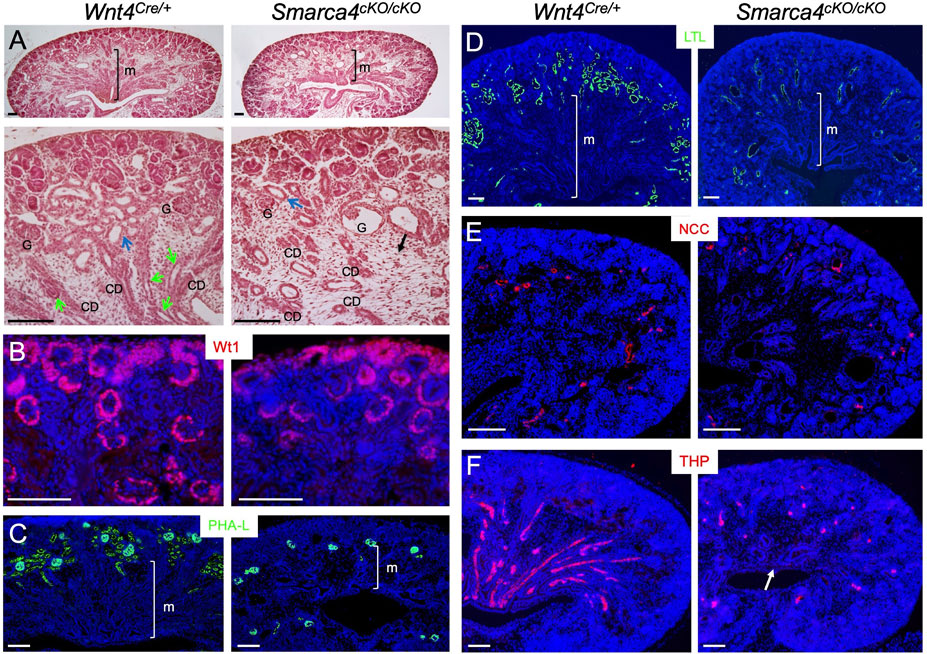
FIGURE 1. Conditional deletion of Smarca4 in Wnt4-expressing cells leads to abnormal nephron tubule formation. (A) H&E-stained mouse kidneys at E18.5 in Wnt4Cre/+ and Smarca4cKO/cKO littermates. The lower panels are a higher magnification of the upper panels. Green arrows indicate Henle’s loop, and blue arrows indicate nephron tubules. The black arrow indicates interstitial mesenchyme in the mutant. Most glomeruli (G) appear normal, but some are cystic. (B) Immunostaining for Wt1 (nephron progenitor, PTA/RV and podocyte). (C,D) Lectin staining with PHA-L (proximal tubule and podocyte) and LTL (proximal renal tubule). (E,F) Immunostaining for NCC (distal renal tubule) and THP (Henle’s loop) in control and mutant kidneys at E18.0. Arrow pints to the reduction of THP+ structures in the medullary region of the mutant kidney. abb.: CD, collecting duct; G, glomerulus; M, medullary region. Scale bars: 100 μm.
Next, we stained kidney sections with antibodies or lectins to label different tubular segments. Wt1 defines podocyte identity by activating other TFs (Dong et al., 2015). As shown by anti-Wt1 immunostaining (Figure 1B), it is expressed in the podocyte primordium of the proximal RV/SSB and in developing podocytes. In Smarca4cKO kidneys, Wt1 expression in these structures was preserved. The mutant podocytes were also marked by lectin PHA-L (Figure 1C). Remarkably, however, PHA-L-marked PTs in the cortex were markedly reduced (Figure 1C). Similarly, lectin LTL-labeled PTs, especially the proximal convoluted tubules (PCT), were significantly decreased (Figure 1D). While both distal convoluted tubules (DCT) marked by NCC (NaCl cotransporter) (Figure 1E) and HLs labeled with THP (Figure 1F) were detectable, the THP+ HLs were found in similar locations as the PTs or DCTs and failed to reach the innermost region of the kidney. These results indicate that Smarca4 is essential for proper tubulogenesis.
Single-cell sequencing identifies previously unknown cell populations linked to Wnt4Cre-labeled cells
Since the knowledge of Wnt4+ cells and the different cell types they may differentiate into is sparse, we set out to comprehensively define the cellular state of Wnt4Cre-labeled cells and further investigate the requirement of Smarca4 during nephron differentiation at a single-cell resolution. We performed scRNA-seq analysis on FACS-purified fresh tdTomato+ cells from control or Smarca4cKO kidneys at ∼ E18.0-18.5 (harvested 7 a.m.) (Supplementary Figure S2A). After removing low-quality cells, we obtained transcriptomes from 5,579 control and 6,299 Smarca4cKO cells, respectively. Unsupervised analysis identified 11 major cell types (Supplementary Figure S2B, C), which can be divided into 24 distinct cell clusters (CS) (Figures 2A, B). All cell types largely overlapped between the control and mutant.
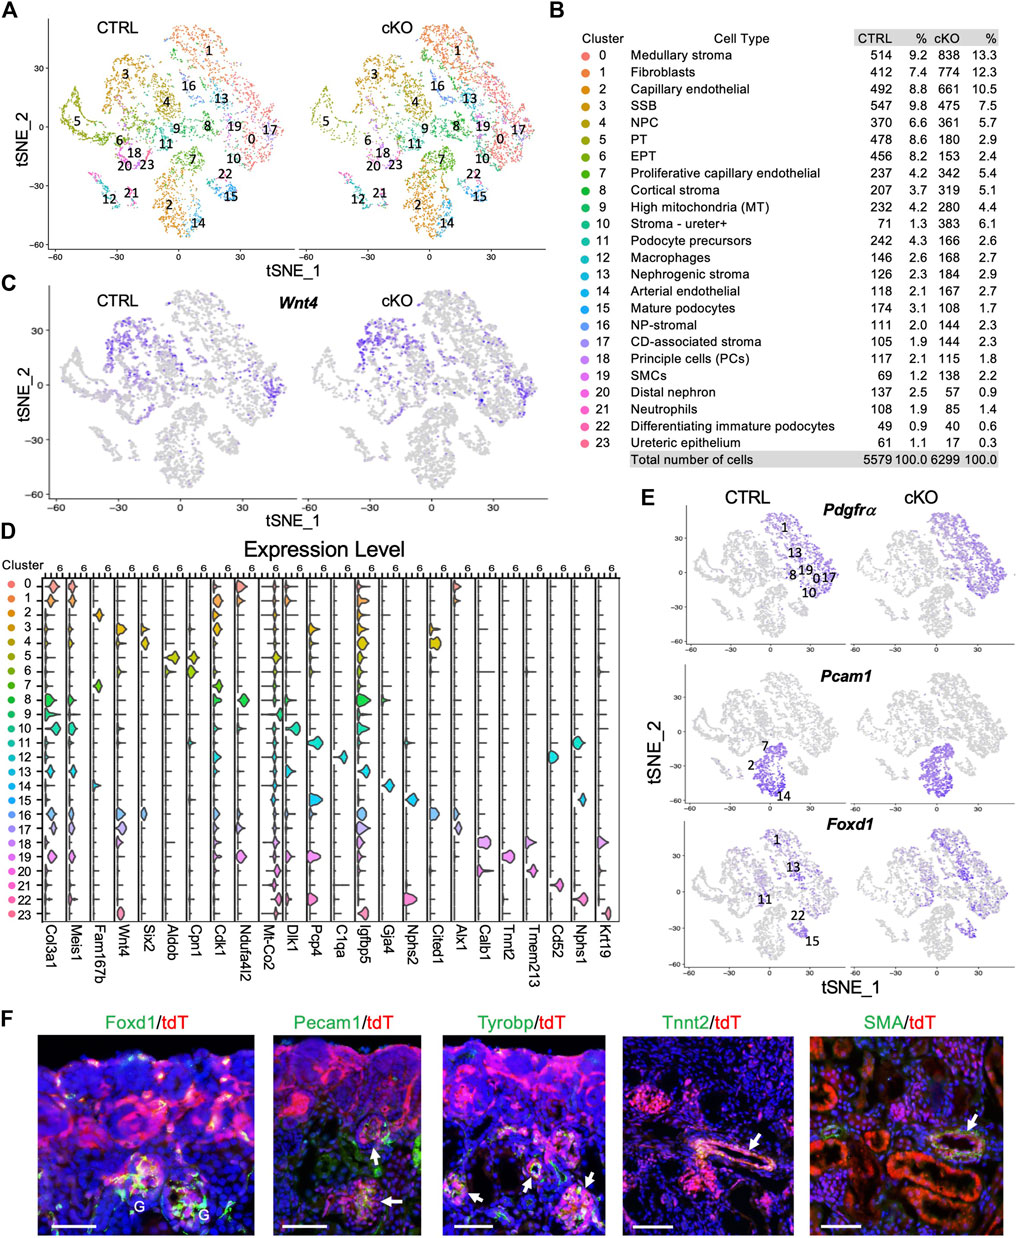
FIGURE 2. scRNA-seq delineates distinct types of cells derived from Wnt4-expressing cells and the effects of Smarca4 deficiency in these cells. (A) Unsupervised clustering demonstrates 24 distinct cell types shown in a tSNE plot of Wnt4Cre-labled cells of control and Smarca4cKO/cKO. (B) Percentages of assigned cell types are summarized in the right panel. NP, nephron progenitor; SSB, S-shaped body; NPC, nephron progenitor cell; PT, proximal tubule; EPT, early PT, SMCs, smooth muscle cells; CD-associated stroma, collecting duct-associated stroma; (C) tSNE plots showing restricted Wnt4 expression. (D) Violin plot showing the expression levels of representative marker genes across the 24 main clusters. The y-axis shows the long-scale normalized read count. (E) tSNE plots showing Pdgfrα in stroma cells, Pecam1 expression in endothelial cells and Foxd1 expression in stroma of nephrogenic, cortical and podocytes. (F) Immunostaining for Foxd1, Pecam1, Tyrobp, Tnnt2 and SMA showing colocalization with tdTomato+ cells in Wnt4Cre/+;R26-tdTomato kidneys (arrows). Scale bar: 60 μm.
Next, we conducted differentially expressed gene (DEG) analysis between each cluster and the rest of the clusters in the control to further characterize Wnt4Cre-labeled kidney cell types and determine the key marker genes for each cell type (full lists of cluster markers are provided in Supplementary File S1). SSB (CS3) and CD-associated stroma (CS17) exhibited high levels of Wnt4 expression (Figures 2C, D), in agreement with previous ISH findings (England et al., 2020). Consistent with a previous report indicating the re-entry of Wnt4+ PTA cells into the NPCs (Lawlor et al., 2019), we identified Six2+Cited1+ NPCs (CS4) (Figure 2D; Supplementary Figure S2D). Clusters corresponding to major nephron segments (CS5,6,20) and podocytes (podocyte precursors CS11–high levels of Pcp4, mature podocytes CS15–high levels of Nphs1/Nphs2, and immature podocytes CS22–high levels of Nphs1 but low Nphs2) (Supplementary Figure S2D) were identified. Notably, a large proportion of Wnt4Cre-labled cells were stromal cells (Col3a1/Pdgfrα, Figures 2D, E) and Pecam1+ endothelial cells (ECs) (Figure 2E). The ECs could be separated into capillary (CS2– Rgcc+Fabp4+Fabp5+ but low Cdk1, Supplementary Figure S2E), proliferative capillary (CS7–Rgcc+Fabp4+Fabp5+ but high Cdk1, Supplementary Figure S2E), and arterial (CS14–Gja4+) (Figure 2D; Supplementary Figure S2E; Supplementary File S1). We also identified a small population of SMCs (CS19–Tnnt2+, Figure 2D), 2 types of immune cells (Tyrobp+, Supplementary Figure S2E)—macrophages (CS12–C1qa+) and neutrophils (CS21–Cd52+) (Figure 2D), principal cells (CS18 –Calb1+) and a small population of ureteric epithelial cells (CS23–Krt19+Igfbp5+) (Figure 2D). We noticed higher mitochondrial levels in cluster 9 (Figure 2D), we, therefore, excluded this cluster for further analysis.
Wnt4 is expressed in stromal cells around the ureteric tree in the medullary regions (England et al., 2020) and plays a critical role in the SMC fate commitment in the medullary stroma (Itaranta et al., 2006). These Wnt4+ cells were thought to be a transient stromal cell population because previous studies did not detect Wnt4Cre-labeled SMCs, endothelia or macrophages/neutrophils by expression studies with cell type-specific markers on kidney sections (Shan et al., 2010). However, our deep sequencing analysis clarified the presence of these cell populations as well as cortical stroma and nephrogenic stroma (Figures 2B, E). To validate these genomic findings, we visualized the expression of Foxd1, Pecam1, Tyrobp, and Tnnt2/SMA (smooth muscle actin) by immunostaining and observed that tdTomato+ cells overlapped with Foxd1+ nephrogenic/cortical stromal cells and podocytes, Tnnt2+/SMA+ SMCs, Pecam1+ ECs, and Tyrobp+ immune cells (Figure 2F). Thus, this analysis revealed the heterogeneity of Wnt4Cre-labeled cells in the mouse kidney, including previously unknown cell types.
Effects of Smarca4 deficiency on Wnt4Cre-labeled cells: changes in cellular state and developmental trajectory
To determine the effect of Smarca4 loss on Wnt4Cre-labeled cells, we compared datasets between the control and Smarca4cKO. Although all cell types overlapped between the control and mutant, we observed a significant reduction in the number of podocytes and tubular cells in the mutant (Supplementary Figure S2C). This finding aligns with the results from the phenotypic analyses (Figure 1). Conversely, the mutant exhibited an increase in the proportion of ECs, SMCs and stromal cells (Supplementary Figure S2C). The DEG analysis conducted between the control and mutant groups (Supplementary File S2) revealed a widespread upregulation of the housekeeping ribosome gene Rps18 (Gm10260), the actin-binding protein Tpm3-rs7, and the nucleosome Hist1h2ap (Supplementary Figure S3A). These genes are tightly associated with cell proliferation and growth in high-protein synthesis-demanding cells (Kusnadi et al., 2015; Gaviraghi et al., 2019; Ferreira et al., 2020) and are frequently dysregulated in highly proliferative cancer cells (Catez et al., 2019; Gaviraghi et al., 2019; Ferreira et al., 2020). Therefore, the upregulation of these genes likely indicates changes in the cellular state caused by Smarca4 deficiency.
To further investigate the changes in the cellular state in the mutant, we employed pseudotime ordering analysis (Haghverdi et al., 2016) to evaluate cellular developmental trajectories. Consistent with the upregulation of Rps18 (Gm10260), Tpm3-rs7, and Hist1h2ap, this analysis indicated an overall increase in proliferative progenitors in the mutant. For example, three EC clusters shared a common progenitor residing in the proliferating capillary progenitors, but Smarca4cKO produced more proliferative progenitors (Supplementary Figure S2F). The analysis of nephron tubule differentiation revealed that the mutant produced more precursors that continued along the nephron differentiation path, and the differentiation status of podocytes appeared different from control cells (Supplementary Figure S3B). These findings further suggest that Smarca4 deficiency alters the cellular state and fate (e.g., cell proliferation and differentiation). Together, these results provide important insights into the impact of Smarca4 on the developmental trajectory of Wnt4Cre-labeled cells, which could have implications for kidney development and disease.
Identification of Wnt4Cre-labeled stromal cell populations and enhanced Pttg1 expression in Smarca4cKO
Our findings reveal that Wnt4Cre-labeled cells comprise multiple distinct stromal populations that are enriched in Smarca4cKO kidneys. However, the origin and regulatory networks that control the development of distinct stromal cells in the kidney are poorly defined. Therefore, we extracted stromal populations along with SMCs and subclustered them into 9 subpopulations (Figure 3A; Supplementary File S3). Heatmap analysis of the top 4 marker genes (Supplementary Figure S4A) revealed differences between ureteric stromal cells in control and Smarca4cKO kidneys, with a subpopulation in the mutant lacking the expression of Mfap5 (Figure 3B) and Tbx18 (Supplementary Figure S4B) but expressing Wnt4 (Figure 4A). These cells also expressed Dlk1 (Figure 3B; Supplementary Figure S4A), Col3a (Figure 3B), and Itm2a (Supplementary Figures S4A, B), as well as all other top DEGs expressed in Mfap5+Tbx18+ ureteric stroma cells (Supplementary File S3).
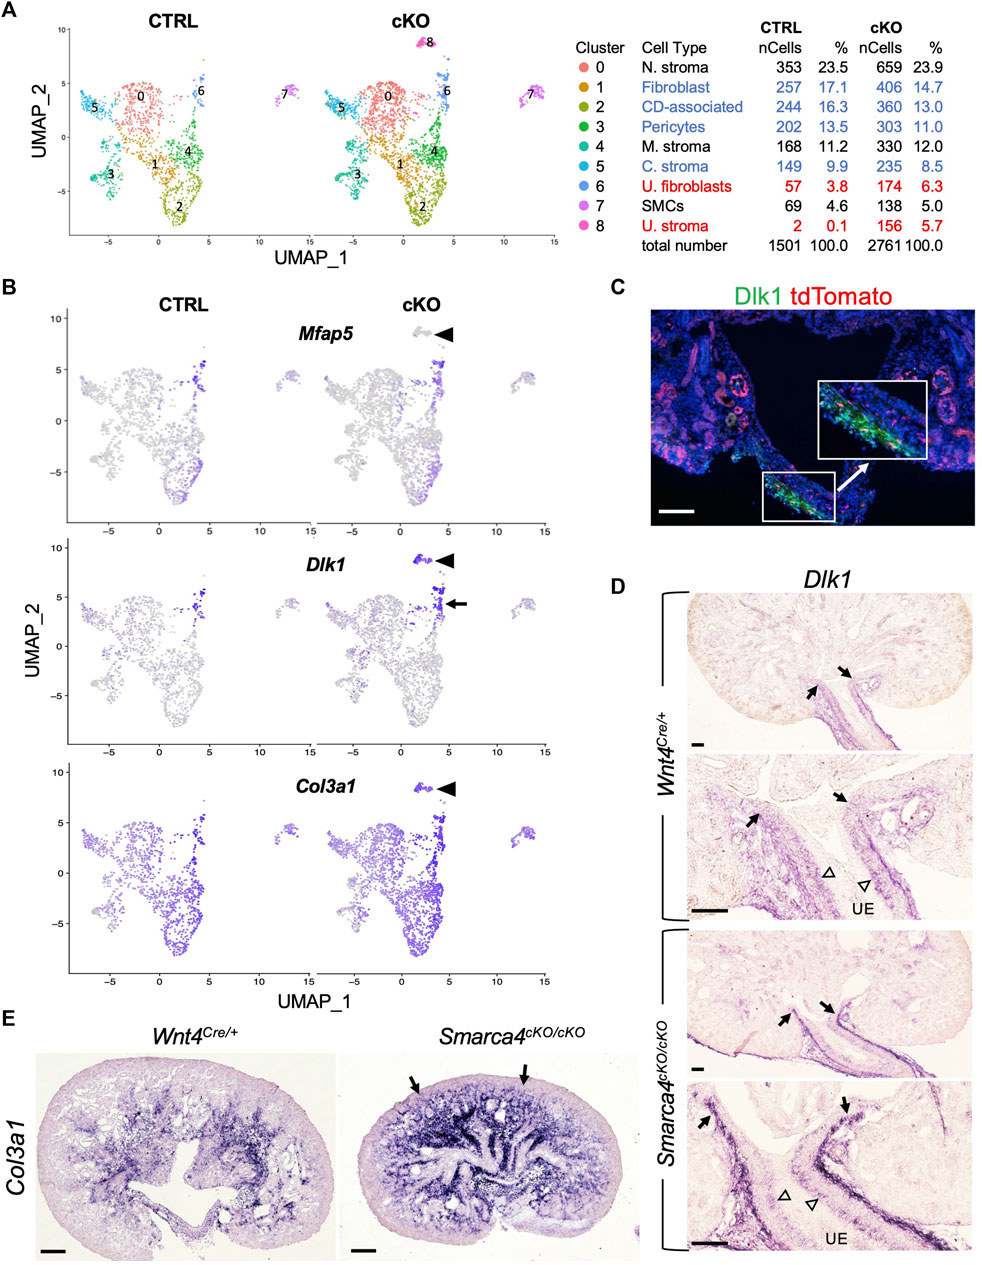
FIGURE 3. scRNA-seq analysis reveals distinct types of stromal cells derived from Wnt4-expressing cells and upregulation of Dlk1 and Col3a1 in Smarca4cKO/cKO. (A) The UMAP plot of Wnt4Cre-labeled stromal populations and SMCs of control and Smarca4cKO/cKO. Percentages of assigned cell types are summarized in the right panel. Colored fonts indicate representative clusters of increased (red) or decreased (blue) cell numbers in the mutant. (B) The UMAP showing Mfap5, Dlk1 and Col3a1 expression. Arrowheads point to a ureteric stoma population (Mfap5-) that emerged only in the mutant. Arrow indicates the upregulation of Dlk1 in the mutant. (C) Immunostaining for Dlk1 (green) on kidney section of Wnt4Cre/+;tdTomato. Boxed area is also shown in higher magnification (arrow). (D) ISH on kidney sections showing Dlk1 expression in ureteral stroma in the outer layer (arrows) and some in the inner layer (open arrowheads) adjacent to the ureteric epithelium (UE) in the ureteropelvic kidney region and upregulation in the outer mesenchymal layer. (E) ISH on kidney sections at E17.5 showing upregulation of Col3a1 in Smarca4cKO. Arrows indicate the extension of Col3a1 expression to the cortical nephron primordium areas. Scale bars: 100 μm in (C,D) and 200 μm in (E).
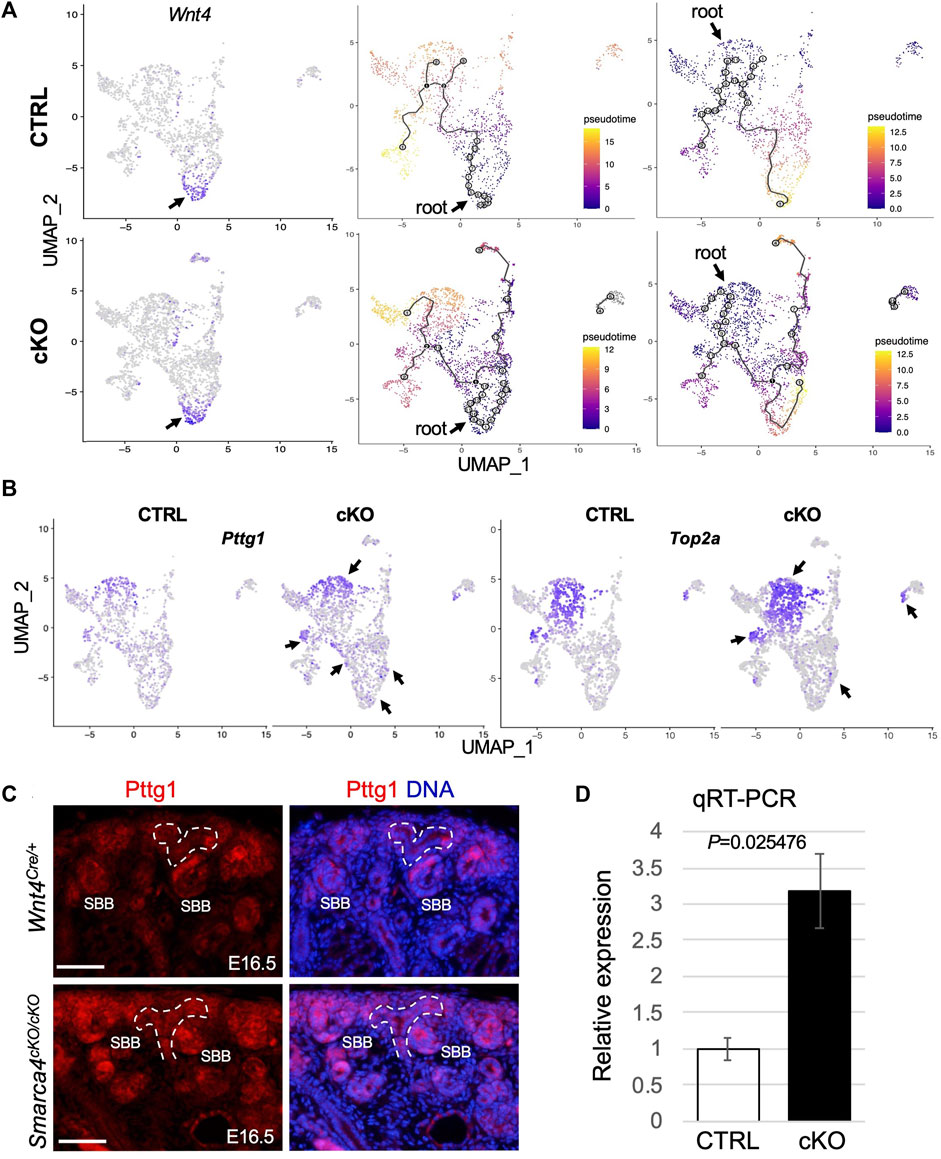
FIGURE 4. Smarca4 KO leads to alterations in the developmental trajectories of stromal cells and increased Pttg1 expression. (A) UMAP showing strong Wnt4 expression in CD-associated stroma (arrows) and in some nephric and ureteric stromal cells and stromal cell differentiation trajectory from Wnt4-expressing CD-associated stromal progenitors towards cortical and ureteric stroma (middle panels) or from nephrogenic stromal progenitors towards other stroma cells (right panels). Cells are colored by pseudotime. The circles with numbers denote special points within the graph. Each leaf, denoted by light gray circles, corresponds to a different outcome (i.e., cell fate) of the trajectory. Black circles indicate branch nodes where cells can travel to one of several outcomes. The numbers within the circles are provided for reference purposes only. Note the lack of black circles in the control using nephrogenic stroma as the root. (B) UMAP representation of increased Pttg1 and Top2a transcription in stromal cells in Smarca4cKO/cKO (arrows). (C) Immunofluorescence staining for Pttg1 showing increased levels of Pttg1 in Smarca4cKO/cKO kidneys at E16.5. Arrows point to a tubular structure in the mutant. Branching ureteric buds are outlined by dashed lines. Abb.: SBB, S-shaped body. Scale bar: 50 μm. (D) Quantitative RT-PCR of FACS-purified tdTomato+ cells from control and Smarca4cKO kidneys. qPCR was performed in triplicate and repeated three times.
To confirm this finding, we conducted immunostaining for Dlk1 and observed its expression in the stroma at the ureteropelvic junction and in the ureter, which co-localized with tdTomato+ cells (Figure 3C). Furthermore, we performed ISH and found that Dlk1 transcripts were weakly expressed in the ureteric stroma at the ureteropelvic region, but were substantially upregulated in the outer layer in the mutant (Figure 3D). We also observed some Dlk1 expression in the inner stromal cells, which was not significantly increased in the mutant (open arrowheads, Figure 3D). Based on previous lineage tracing studies, the outer adventitial cells and the inner lamina propria fibroblasts adjacent to the ureteric epithelium derive from Tbx18+ precursors (Bohnenpoll et al., 2017). Therefore, some Tbx18+ cells in the Dlk1+Mfap5+ subgroup may represent precursors or intermediate cells, while the Dlk1high outer layer of the ureteric stroma in the mutant may be mixed with some Dlk1+Mfap5- cells. As Mfap5+ cells (Figure 3B) were negative for Wnt4 (Figure 4A), increased Wnt4 signaling in some ureteric stromal cells may lead to changes in the expression of specific genes, such as the downregulation or inhibition of Mfap5 expression. We also confirmed increased Col3a1 transcripts in the mutant (Figure 3E), which is consistent with the upregulation of Col3a1 detected by scRNA-seq (Supplementary Figure S3A).
To gain insight into the lineage relationships of different Wnt4Cre-labeled stromal populations, we conducted pseudotime analyses. We selected Wnt4high CD-associated stromal cells (Figure 4A) as the “root” for our model in which Wnt4+ “progenitors” expand and produce a group of progenitors that differentiate into fibroblasts. These fibroblasts then give rise to precursors in the nephrogenic stroma, which further branches and differentiate into pericytes (Figure 4A). Interestingly, we found no direct lineage connection between the medullary stroma or ureteric fibroblasts and the CD-associated stromal cells, suggesting that these cells may originate from different progenitor cells. However, in Smarca4cKO, the CD-associated Wnt4high progenitors not only produce more cycling/proliferating cells but also generate fibroblasts that can differentiate into the mutant medullary and ureteric stroma. We observed similar linear relationships in a model where the nephrogenic stroma (Figure 4A) or fibroblasts (Supplementary Figure S4C) were chosen as the “root”. However, when using fibroblasts as the root, more cells showed gene expression changes along the trajectory (grey circles, Supplementary Figure S4C). In contrast, none of these models exhibited a direct linear relationship with the cortical stroma or smooth muscle cells (SMCs), indicating that these cell types likely originate from different progenitor cells. Overall, these analyses underscore the intricate development of Wnt4Cre-labeled stromal cells and reveal increased cell proliferation and altered developmental trajectories caused by Smarca4 deficiency.
After applying stringent cutoffs of adjusted p < 0.01 and fold-change >1.5, the DEG analysis identified only a few upregulated genes in Smarca4cKO. Of these genes, Pttg1 was globally upregulated, particularly in nephrogenic stromal cells, pericytes and some CD-associated stroma (Figure 4B; Supplementary File S4). Pttg1 plays a crucial role in sister chromatid segregation during mitosis, and its upregulation is associated with various types of tumors (Pei and Melmed, 1997; Itaranta et al., 2006; Chen et al., 2020). We also detected a similar upregulation of Top2a (Figure 4B), a proliferation marker associated with tumor grade and Ki67 index (Supplementary Figure S4B). Next, we used two independent methods to confirm the upregulation of Pttg1 in the mutant. First, we immunostained for Pttg1 at the earlier stages of E16.5-17.5 and found that the levels of Pttg1 were increased in the mutant kidneys at these stages, especially in the cortical and PTA-SSB regions (Figure 4C). Second, we performed reverse-transcription and real-time PCR (RT-qPCR) using RNA prepared from freshly FACS-purified tdTomato+ cells from E16.5 kidneys and found that Pttg1 expression levels in Smarca4cKO were ∼3.2-fold higher than in control cells (Figure 4D). Altogether, our findings demonstrate that Smarca4 deficiency induces Pttg1 upregulation in Wnt4Cre-labeled cells.
Smarca4 KO disrupts early patterning of SSBs
We next investigated whether Smarca4 loss resulted in changes in the expression of genes involved in early SSB segmentation and upregulation of Pttg1 in nephron precursor cells. The SSB is patterned into a proximal segment—Bowman’s capsule and visceral podocyte—derived from the proximal domain of the polarized RV, a distal RV-derived part that further subdivides into the future PT, HL, and DT segments followed by CNT fused with CD (Figure 5A). Subclustering analysis of nephron precursor cells (CS3, 4, 16) revealed 7 distinct populations: uncommitted NP, NP-stromal, committing NP, PTA-RV, proximal SSB for podocyte, intermediate SSB for PT, and intermediate-distal SSB for HL and DT (Figure 5B; Supplementary File S5).
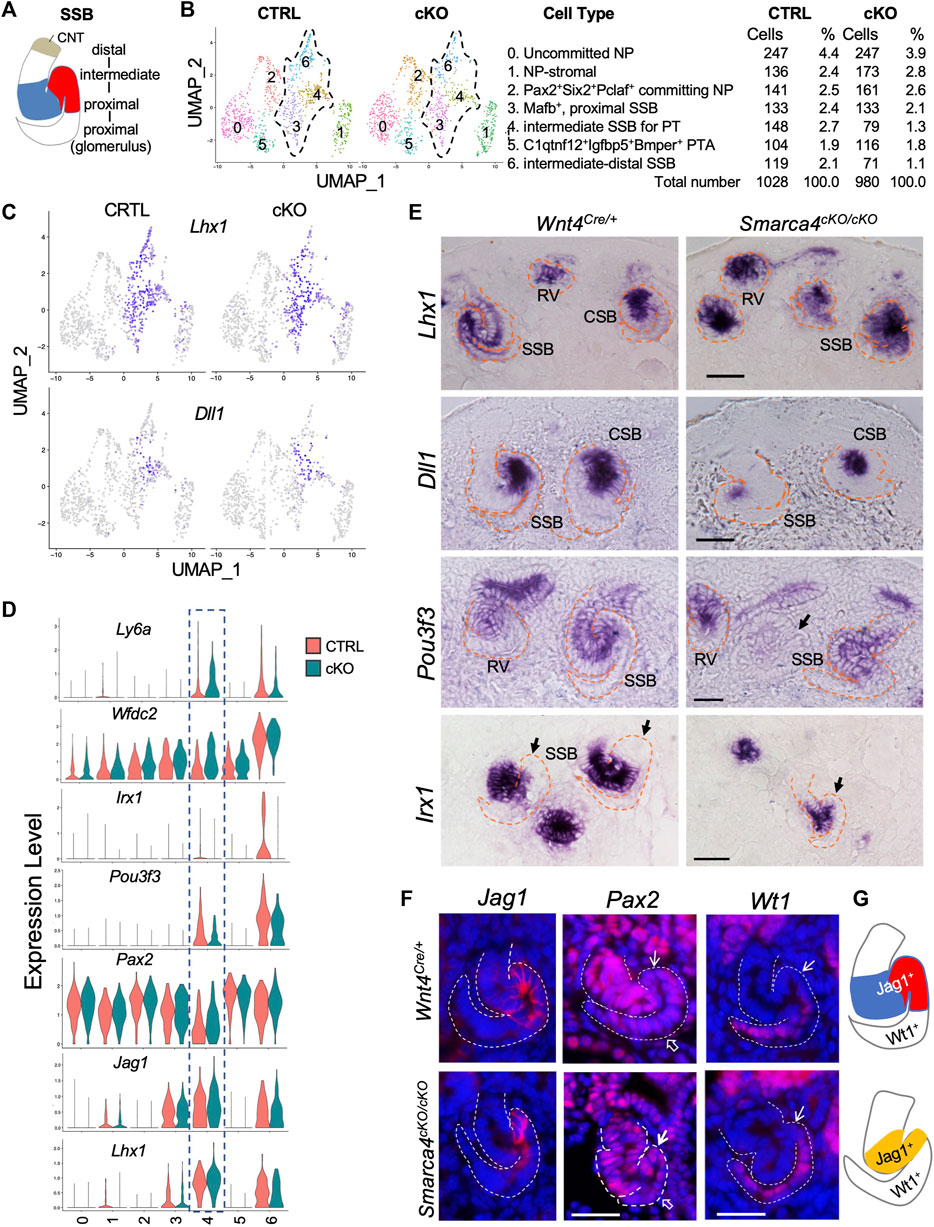
FIGURE 5. Early patterning of SSB was disrupted in Smarca4-deficient kidneys. (A) Schematic drawing of distinct nephron territories in SSB. CNT, connecting tubule segment. (B) UMAP plots showing 7 clusters of nephron precursors derived from Wnt4Cre-labeled cells in control and Smarca4cKO/cKO. Percentages of assigned cell types are summarized in the right panel. (C) UMAP plots showing Lhx1 and Dll1 expression in the SSB clusters. (D) Violin plots showing the levels of Lhx1, Jag1, Pax2, Pou3f3, Irx1, Wfdc2 and Ly6a expression in each cluster. Boxed SSB-PT cluster 4 showing increased Pax2, Wfdc2 and Ly6a in the mutant but no significant changes in the expression levels of Lhx1 and Jag1, while Pou3f3 and Irx1 expression levels were reduced in the mutant. (E) In situ hybridization for Lhx1, Dll1, Pou3f3, and Irx1 on kidney sections of E15.0 embryos (harvested around 5 p.m.). Note reduced Pou3f3 expression in some SSB in the mutant (arrow), and Irx1-negative proximal tubule primordium in control (arrows) and the absence of this region in the mutant (arrow). (F) Immunostaining for Jag1, Pax2, and Wt1 (podocyte) at E15.5. Arrows point to the PT territory and open arrows point to the podocyte regions. (G) Schematic summary of SSB Jag1+ domain in control and mutant. Abb.: CSB and SSB, comma- and S-shaped body; RV, renal vesicle. Scale bars: 30 μm.
We next analyzed changes in the expression of genes involved in early patterning of SSB, including Lhx1, Notch signaling, and other TFs, which was verified by ISH or immunostaining. Lhx1 is required for initial RV polarization and expressed in distal RV and intermediate-distal SSBs that form PT, HL and DT (Kobayashi et al., 2005) (Figures 5C–E). The Notch ligand Dll1 further specifies the Lhx1+ domain into the PT fate, as Dll1 hypomorphic mice have severely reduced nephron numbers with loss of PT (Cheng et al., 2007). Dll1 is expressed in the distal RV, and its expression persists in the middle region of the SSB where PT and HL are generated (Figures 5C, E). Jag1, another Notch ligand, is highly expressed in the intermediate SSB for PT and HL (Figures 5D, F). The DEG analysis did not detect significant changes in expression levels of these three genes (Figures 5C, D; Supplementary File S6). Consistent with this, no obvious changes in the expression levels of these genes were observed by ISH (Figure 5E) or immunostaining (Figure 5F), although Smarca4cKO kidneys at ∼ E15.0 were smaller (Supplementary Figure S5A), and Dll1-marked region (Figure 5E) or Jag1+ domain (Figures 5F, G) was reduced in size. We measured and calibrated the area of the Dll1+ domain and found that the Dll1-marked area was ∼53.22% ± 1.8% smaller than the control (n = 18, p = 0.02808). In contrast, Notch1 expression was downregulated in Smarca4cKO SSB-PT territory (Supplementary Figure S5B; Supplementary File S6), while Notch2 did not show significance changes (Supplementary Figure S5B; Supplementary File S6). Pax2 also showed segmented expression in the SSB, with lower expression levels in the future PT regions (Figures 5D, F). However, Pax2 expression levels in the mutant PT regions were higher than in the control (Figures 5D, F; Supplementary File S6). Notably, the HL/DT-specific genes, such as Wfdc2 and Ly6a were also upregulated in the mutant prospective PT region (Figure 5D).
Pou3f3 plays a crucial role in determining the fate of intermediate and distal nephrons (Nakai et al., 2003). It is expressed in the RV and broader regions covering the mid-distal SSB (Figure 5E, Supplementary Figure S5A). However, its expression was reduced in some mutant SSBs (arrow, Figure 5E), which is consistent with the findings from the scRNA-seq analysis (Figure 5D). We also investigated the expression of Irx genes, which are essential for the formation of the intermediate region of the nephron (Reggiani et al., 2007). Irx1 expression begins at the CSB stage and is confined to the intermediate region destined to become HL (Figures 5D, E). In Smarca4cKO kidneys, the number of Irx1-labeled nephron primordia was significantly decreased (Supplementary Figure S5A), and the SSBs had smaller Irx1+ regions and lacked a well-defined Irx1- future PT fate (arrows, Figure 5E). Additionally, the intensity of Irx1 and Irx2 signals appeared to be reduced in the mutant (Figure 5E; Supplementary Figure S5A). These findings align with the scRNA-seq analysis for Irx1 (Figure 5D; Supplementary File S6) and Irx2 (Supplementary File S6). Together, these results indicate that Smarca4 is necessary for establishing distinct nephron tubular regions during SSB segmentation and extension.
Smarca4 loss induces upregulation of Pttg1 and ECM-related genes in committing nephron precursors accompanied by hyperproliferation
Our analyses also indicated upregulation of Pttg1 (Figure 6A, Supplementary Figure S5C) and Top2a (Supplementary Figure S5C) in the mutant SSB. We also observed elevated expression of ECM markers Col3a1/Col1a1/Fn1 in the mutant (Figure 6A), indicating a potential progression towards fibrosis or EMT. These findings underscore the critical role of Smarca4 in regulating the expression of Pttg1 and the cellular state and fate of nephron precursors.
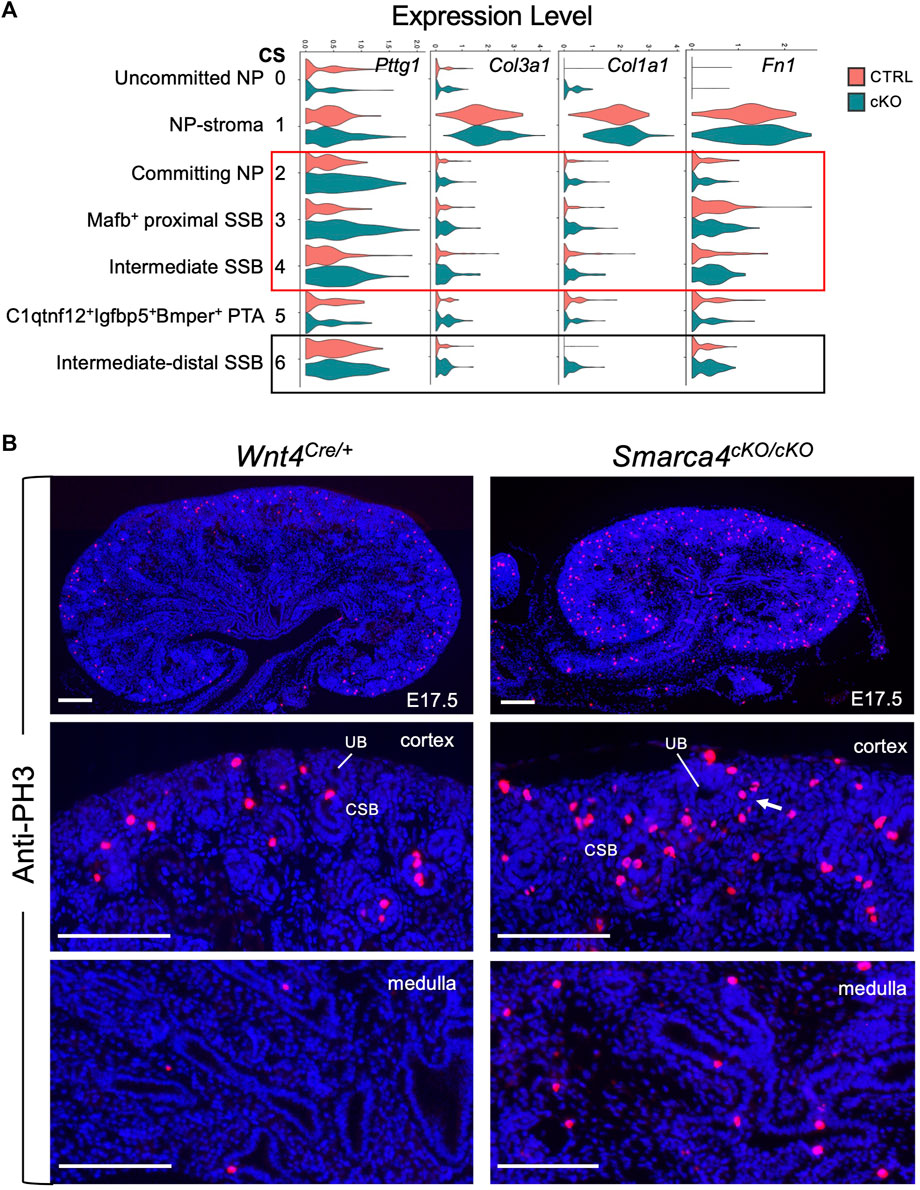
FIGURE 6. Smarca4 loss induces upregulation of Pttg1 and mesenchymal ECM genes in nephron precursor cells as well as increased proliferation. (A) Violin plots showing the levels of Pttg1, Col3a1, Clo1a1 and Fn1 expression in each cluster. Boxed areas indicate increased Pttg1 expression in the committing NP and SSB clusters and increased expression of Col3a1, Col1a1 and Fn1 in the SSB clusters. (B) Anti-PH3 immunostaining showing increased PH3+ cells in Smarca4cKO/cKO kidney. Arrow points to increased PH3+ cells in committing NP-PTA area. Quantification (see Methods) revealed that PH3+ cells in Smarca4cKO were 4.42 ± 0.23- or 7.5 ± 0.35-fold higher in cortex or medulla than controls. Abb.: CSB, comma-shaped body; UB, ureteric bud. Scale bar: 100 μm.
Since Pttg1 is a key regulator of sister chromatid segregation during mitosis and its increased PTTG1 expression is associated with hyperproliferation, we clarified whether Smarca4 loss also leads to increased proliferation. Immunostaining for anti-phospho-Histone H3 (PH3), a marker for M-phase cells, showed a significant increase in PH3+ cells in the cortex and medulla of Smarca4cKO kidneys compared to controls (Figure 6B, ∼4.42-fold in cortex and ∼7.5-fold in medulla). This result is consistent with the transcriptomic trajectories showing increased proliferating/cycling cells in the interstitial cells (Figures 4A, B; Supplementary Figure S2F) and nephron precursors (Supplementary Figure S3B) of Smarca4cKO kidneys. Given that PTTG1 as an oncogene known to promote cell division and contribute to the development of tumors and metastasis (Luo et al., 2013; Noll et al., 2015), the elevated levels of Pttg1 and increased cell proliferation rate in Smarca4cKO may lead to upregulation of ECM-related genes in the precursor cells and limit their ability to differentiate into proper tubular cells.
Smarca4 deficiency causes mixed cell identities, increased proliferation and ECM/EMT-associated gene expression in tubular cells
To further investigate the impact of Smarca4 deficiency on nephron differentiation, we re-clustered the nephron tubule populations (CS5,6,20) and identified two progenitor-tubule intermediate populations (IM1, IM2) and seven distinct nephron tubule populations, including EPT, PCT, PST (proximal straight tubule), DCT and CNT, as well as ascending and descending HL (AHL and DHL) (Figure 7A; Supplementary File S7). Since the proportion of EPT cells was more reduced than the PCT and PST, we analyzed the transcriptome for this cluster and identified 337 upregulated and 22 downregulated genes, with many kidney disease-associated genes among the top downregulated genes (Supplementary Figure S6A; Supplementary File S8). GO analysis revealed that genes involved in metabolic processes, cell-cycle/proliferation, cellular component organization, and negative regulation of cellular process and integrin signaling pathway were upregulated (Supplementary Figure S6B).
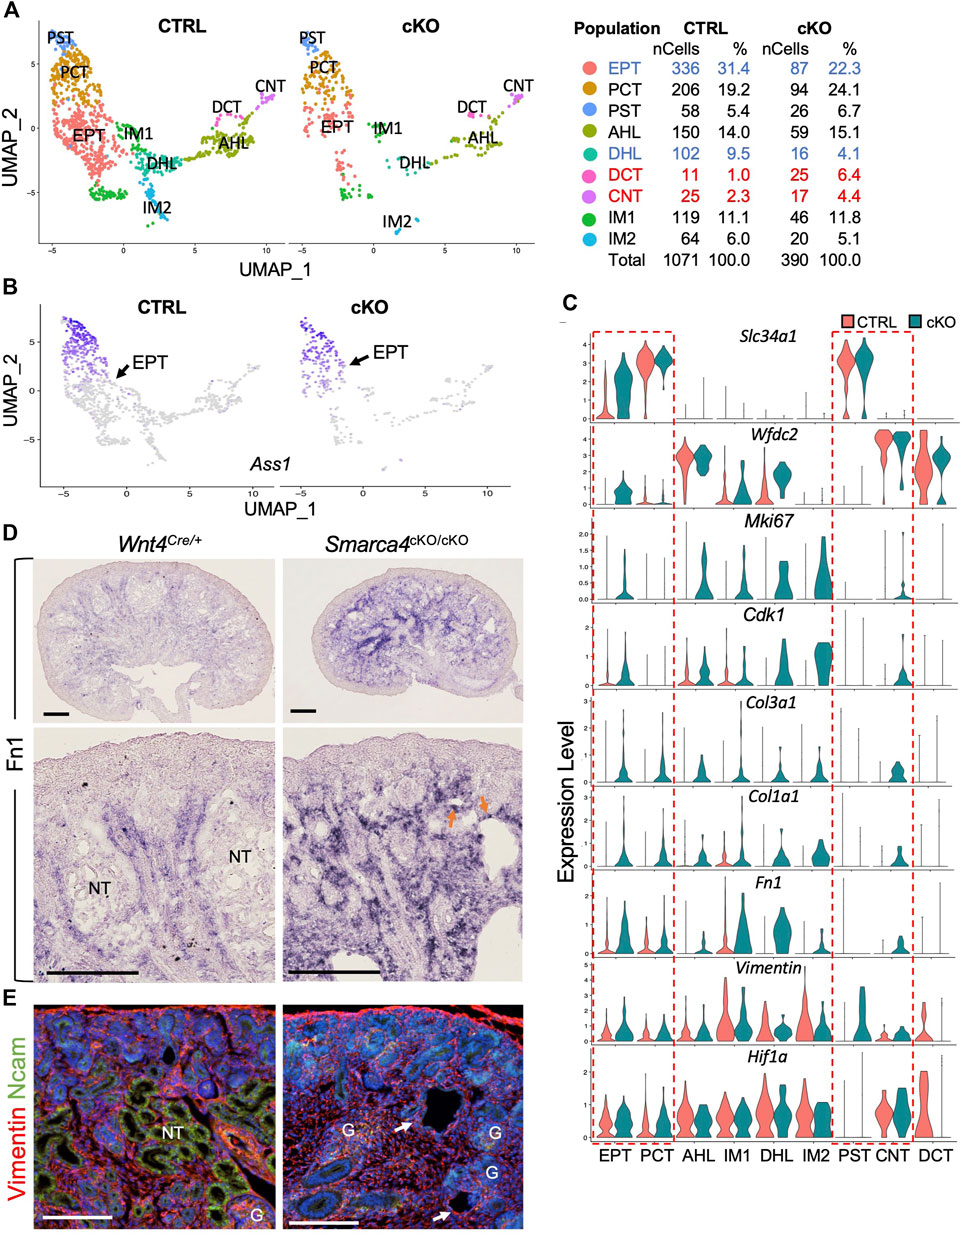
FIGURE 7. The expression of ECM and EMT markers are upregulated in nephron tubule cells in Smarca4cKO. (A) UMAP plot showing 9 major types of nephron tubule cells derived from Wnt4Cre-labeled cells. Percentages of assigned cell types are summarized in the right panel. Colored fonts indicate representative clusters of decreased (blue) or increased (red) cell numbers in the mutant. (B) UMAP plot showing the upregulation of Ass1 expression in the EPT cells (arrows) in Smarca4cKO. (C) Violin plots showing the expression of Slc34a1, Wfdc2, Mki67, Cdk1, Col3a1, Col1a1, Fn1, Vimentin and Hif1a in control and Smarca4cKO cell clusters. Boxes outlined in the dashed redline indicate increased expression of Slc34a1 and Wfdc2 in the mutant EPT and other genes in the mutant EPT, PCT, PST, and CNT. (D) In situ hybridization on kidney sections at E17.5 showing upregulation and extension of Fn1 into the cortical region of the mutant kidneys. Arrows indicate Fn1-expressing cells in nephron tubular structures. (E) Immunostaining for Vimentin (red) and Ncam (green) showing increased Vimentin+ cells and the absence of Ncam+ epithelial tubules (arrows) in the mutant kidney. Abb.: G, glomerulus; NT, nephron tubule. Scale bar: 300 μm [top panels in (D)] and 100 μm [bottom panels in (D) and panels in (E)].
We found that certain markers for mature PT cells, including Ass1, Aldob, and Slc34a1, were strongly upregulated in EPT-related cells of Smarca4-deficient kidneys. In contrast to control cells, which showed a temporal progression of maturation from EPT to PCT and PST cells based on the upregulation of these genes (Figures 7B, C), Smarca4cKO kidneys failed to generate discernible cellular heterogeneity with clearly demarcated populations of EPT and differentiated PT due to elevated expression of these genes in EPT cells (Figures 7B, C). Moreover, the HL/DT-specific genes such as Wfdc2 (Figure 7C) and Ly6a (Supplementary Figure S6A) were also strongly upregulated in Smarca4cKO EPT, IM1 and DHL cells, along with many cell-cycle regulators, including Ki67, Cdk1 (Figure 7C), Cdk2, Tab1, Pclaf, Igfbp5, Lmo1, and Smc1b (Supplementary Figure S6C; Supplementary File S8), reflecting higher proliferation rates as seen by anti-PH3 immunostaining (Figure 6B). Upregulation of Wnt4 was also observed in the mutant IM1 cluster (Supplementary Figure S6C).
In contrast to the upregulation of Pttg1 in the mutant precursor cells (Figure 6), its expression levels appeared unchanged in these more differentiated tubular cells (Supplementary Figure S6C). However, the expression of ECM genes such as mesenchymal collagens Col3a1 and Col1a1 (Figure 7C) as well as EMT markers found in tumorigenic EMT (Latil et al., 2017) or renal fibrosis, including EMT-associated cytoskeleton Vimentin, Fn1 (Figure 7C) and Sparc (Supplementary Figure S6C), were significantly increased in Smarca4cKO tubular cells. Notably, the hypoxia-inducible TF Hif1a, a key regulator for renal fibrosis under various conditions (Liu et al., 2017) was also upregulated in the EPT, PCT and CNT (Figure 7C). Similar to the upregulation of Col3a1 in the cortical region of Smarca4cKO kidneys (Figure 3E), ISH also revealed increased Fn1 transcripts in the cortical areas and tubular structures (Figure 7D). Co-immunostaining for Vimentin and Ncam (neural cell adhesion molecule) confirmed that Smarca4cKO kidneys lacked Ncam-labeled epithelial tubules but had Vimentin+ cells in the tubular structures (Figure 7E), indicating the presence of fibrotic cells and induction of genes related to fibrosis. Taken together, these results suggest that although some tubular differentiation genes are expressed in Smarca4-deficient kidneys, the mutant tubular cells lose their tubular characteristics due to the induction of cell-cycle regulators and non-tubular ECM/EMT-related genes, leading to cell fibrosis and loss of expression of many nephron tubular-specific genes (Supplementary Figure S6A).
Discussion
Wnt4 is one of the earliest genes that mark nephron differentiation, and the Wnt4Cre mice have previously been used to delete genes in nephron differentiation. Previous studies have shown that Wnt4 is expressed in the medullary interstitium (Itaranta et al., 2006; England et al., 2020) and that the Wnt4 signaling is necessary for controlling the fate of SMCs in the kidney, as Wnt4-deficient kidneys lack differentiated SMCs (Itaranta et al., 2006). However, how Wnt4-expressing cells contribute to renal interstitial development is not fully understood. Here, we used unbiased scRNA-seq analysis to classify the composition and interstitial subtypes from Wnt4Cre-labeled cells. Our analyses identified a total of 34 clusters: 2 types of immune, 3 types of endothelial and 8 types of stromal cells, SMCs, PCs, UE, 3 types of podocytes, and 15 nephron-related populations. We uncovered previously unknown cell types that had so far not been linked to Wnt4Cre-labeled cells in the interstitium. Our developmental trajectory analysis revealed that Wnt4-expressing CD-associated stromal precursors differentiate into fibroblasts, and then fibroblast progenitors produce some progenitors in the nephrogenic stroma that proliferate and differentiate into pericytes. However, cortical, medullary, ureteric stroma or SMCs appear to be derived from different progenitors. Thus, some transiently amplifying Wnt4-expressing progenitors in the interstitium may give rise to precursors to the cortex, medulla, or ureteral stroma, as well as to SMCs. Such precursors or a proportion of them may also express Foxd1, which is capable of generating multiple stromal tissues in the kidney. This speculation is consistent with previous observations that Wnt4-expressing stromal cells in the medullary region are Foxd1-labeled (England et al., 2020) and that Foxd1-expressing cortical stroma progenitors are multipotent and are able to give rise to stromal tissues of the interstitium throughout kidney organogenesis (Kobayashi et al., 2014). Nevertheless, these possibilities must be clarified and confirmed using lineage-tracing analysis of Wnt4CreER.
Cell growth, lineage commitment, differentiation, and genome stability are controlled by the spatiotemporal regulation of genes that are assembled into chromatin. Chromatin remodeling proteins alter local chromatin structure and facilitate recruitment of essential factors required for transcription.
SMARCA4, the central ATPase subunit of numerous chromatin-modifying enzymatic complexes, uses the energy derived from ATP-hydrolysis to disrupt the chromatin architecture of target promoters. It has been implicated in the activation and repression of gene expression through the modulation of chromatin in various tissues and physiological conditions. SMARCA4 can also act as a transcriptional coregulator and interact with tissue- or cell type-specific TFs to regulate gene expression. During development, we found that Smarca4 is widely expressed in the developing kidney and it interacts with nephron progenitor-specific TFs Eya1 and Six1 to maintain the NPCs (Li et al., 2021). To investigate the role of the SWI/SNF chromatin-remodeling complexes in regulating the differentiation of Wnt4-expressing cells, we deleted Smarca4 using Wnt4Cre and compared the sequencing datasets between control and Smarca4cKO cells at single-cell resolution. Our scRNA-seq data also revealed Smarca4 expression in all Wnt4Cre-labeled cell clusters (Supplementary Figure S6D). The difference between the control and Smarca4cKO is that the mutant has increased interstitium but decreased nephron tubule cells, which are unable to maintain tubule-specific characteristics due to elevated proliferative capacity and misexpression of non-tubular genes, including ECM/EMT-related genes. Our findings provide substantial insights into the major role played by Smarca4 in the cellular proliferation and differentiation of Wnt4+ cells in the kidney. However, future work is crucial to elucidate the specific impact of Smarca4 loss on chromatin accessibility in different types of Wnt4Cre-labeled cells in the kidney. Furthermore, it will be essential to identify the cell type-specific TFs with which Smarca4 interacts to regulate the cell fate and differentiation of Wnt4Cre-labeled cells.
The BAF complexes are the most frequently mutated chromatin regulatory complexes found in cancers (Hodges et al., 2016). These mutations contribute to various malignancies due to dysregulated cell-cycle control (Kadoch et al., 2013; Shain and Pollack, 2013; Gupta et al., 2020). SMARCA4 mutations are also associated with Wilms tumors (Rakheja et al., 2014; Treger et al., 2019), a type of renal cancers that accounts for nearly 90% of renal tumors in children and 7% of all childhood cancers (Breslow et al., 1993). Recent studies have shown that SMARCA4 mutations lead to increased expression of the proto-oncogene MYC (Hodges et al., 2018) and the prelicensing protein CDC6 (Gupta et al., 2020). In this study, of particular interest, we found that the deletion of Smarca4 induced Pttg1 oncogene upregulation. Pttg1 is involved in cell-cycle progression, transactivation of other oncogenes such as MYC (Pei, 2001), and DNA repair (Vlotides et al., 2007). It is overexpressed in all types of human cancers (Zhang et al., 1999; McCabe et al., 2003; Vlotides et al., 2007), and its increased levels in cancer cells has been shown to cause mis-segregation of chromosomes and facilitate genome instability (Yu et al., 2003). We found that Pttg1 expression was elevated in the stromal precursors (Figure 4) and the nephron committing and SBB precursors, which are associated with increased proliferation capacity (Figure 6). Although the levels of Pttg1 expression appeared to be unchanged in more differentiated tubular cells (Supplementary Figure S6C), these cells also showed elevated proliferation capacity (Figure 7C; Supplementary Figure S6C). Thus, we speculate that the elevated levels of Pttg1 in the precursor cells may lead genome instability, resulting in accelerated cell division and induction of ECM/EMT-related genes in the precursor cells. Once the cellular state of these Wnt4+ precursors has changed, they will continue to divide rapidly and express ECM/EMT-related genes along with some nephron differentiation genes, a process that does not directly require Pttg1 activity. These precursors fail to transition to a characteristic epithelial tubular state but undergo fibrosis, as evidenced by the lack of expression of many tubular-specific genes and the induction of ECM/EMT markers (Figure 7; Supplementary Figure S6), including the TF Hif1a. During EMT in cells that need to develop a migratory cellular program, transcription must be reactivated to allow for cellular transition. Consistent with this, we observed a global increase in ribosomal transcription in Smarca4cKO cells (Supplementary Figure S3A), which is likely necessary for cellular state changes or EMT. The lack of nephron tubular growth and elongation into the medullary region in Smarca4cKO may lead to the shortening of the medulla.
In summary, our transcriptome analyses of FACS-sorted Wnt4Cre-labled tdTomato+ cells support previous observations of Wnt4 expression in medullary stroma cells and its requirement for SMC differentiation. While our results support the previous hypothesis that there may be transiently amplifying Wnt4-expressing progenitors in the interstitium that can give rise to multiple precursors, lineage tracing analysis using Wnt4CreER at different developmental stages is needed to confirm this possibility. Overall, our findings highlight the critical role of Smarca4 in kidney development and the regulation of Pttg1 expression, providing new insights into the mechanisms underlying nephron tubule formation and renal disease, including Wilms tumor. The upregulation of the oncogene Pttg1 in Smarca4-deficient kidneys may shed new light on therapeutic strategies for renal cell carcinoma resulting from SWI/SNF complex deficiency.
Data availability statement
scRNA-seq datasets were deposited at the NCBI GEO (https://www.ncbi.nim.nih.gov/geo/) with the accession number GSE200301. All data reported in this paper will be shared by the corresponding author upon request. Any additional information required to reanalyze the data reported in this paper is available upon request.
Ethics statement
The animal study was approved by the IACUC of the Icahn School of Medicine at Mount Sinai. The study was conducted in accordance with the local legislation and institutional requirements.
Author contributions
Research studies were designed by JX, XZ, and P-XX. Methodology was developed by JX, TZ, and XZ. Experiments were conducted by JX and TZ. Data were acquired and analyzed by JX, XZ, TZ, and P-XX. All authors contributed to the article and approved the submitted version.
Funding
This work was supported by NIH grant RO1 DK064640 (to P-XX).
Acknowledgments
The authors are grateful to Dr. Joo-Seop Park at the Cincinnati Children’s Hospital Medical Center for kindly transferring the Wnt4Cre/+ mice and to the Icahn School of Medicine’s Flow Cytometry Core Facility for their help in cell sorting, and the Single-cell and Spatial Technologies Team at the Center for Advanced Genomics Technology for their help with scRNA-seq.
Conflict of interest
The authors declare that the research was conducted in the absence of any commercial or financial relationships that could be construed as a potential conflict of interest.
Publisher’s note
All claims expressed in this article are solely those of the authors and do not necessarily represent those of their affiliated organizations, or those of the publisher, the editors and the reviewers. Any product that may be evaluated in this article, or claim that may be made by its manufacturer, is not guaranteed or endorsed by the publisher.
Supplementary material
The Supplementary Material for this article can be found online at: https://www.frontiersin.org/articles/10.3389/fcell.2023.1233317/full#supplementary-material
References
Adam, M., Potter, A. S., and Potter, S. S. (2017). Psychrophilic proteases dramatically reduce single-cell RNA-seq artifacts: A molecular atlas of kidney development. Development 144 (19), 3625–3632. doi:10.1242/dev.151142
Al-Awqati, Q., and Oliver, J. A. (2002). Stem cells in the kidney. Kidney Int. 61 (2), 387–395. doi:10.1046/j.1523-1755.2002.00164.x
Basta, J. M., Singh, A. P., Robbins, L., Stout, L., Pherson, M., and Rauchman, M. (2020). The core SWI/SNF catalytic subunit Brg1 regulates nephron progenitor cell proliferation and differentiation. Dev. Biol. 464 (2), 176–187. doi:10.1016/j.ydbio.2020.05.008
Benjamini, Y., and Hochberg, Y. (1995). Controlling the false discovery rate - a practical and powerful approach to multiple testing. J. R. Stat. Soc. Ser. B-Methodological 57 (1), 289–300. doi:10.1111/j.2517-6161.1995.tb02031.x
Bohnenpoll, T., Feraric, S., Nattkemper, M., Weiss, A. C., Rudat, C., Meuser, M., et al. (2017). Diversification of cell lineages in ureter development. J. Am. Soc. Nephrol. 28 (6), 1792–1801. doi:10.1681/ASN.2016080849
Breslow, N., Olshan, A., Beckwith, J. B., and Green, D. M. (1993). Epidemiology of Wilms tumor. Med. Pediatr. Oncol. 21 (3), 172–181. doi:10.1002/mpo.2950210305
Cao, J., Spielmann, M., Qiu, X., Huang, X., Ibrahim, D. M., Hill, A. J., et al. (2019). The single-cell transcriptional landscape of mammalian organogenesis. Nature 566 (7745), 496–502. doi:10.1038/s41586-019-0969-x
Catez, F., Dalla Venezia, N., Marcel, V., Zorbas, C., Lafontaine, D. L. J., and Diaz, J. J. (2019). Ribosome biogenesis: an emerging druggable pathway for cancer therapeutics. Biochem. Pharmacol. 159, 74–81. doi:10.1016/j.bcp.2018.11.014
Chen, S. W., Zhou, H. F., Zhang, H. J., He, R. Q., Huang, Z. G., Dang, Y. W., et al. (2020). The clinical significance and potential molecular mechanism of PTTG1 in esophageal squamous cell carcinoma. Front. Genet. 11, 583085. doi:10.3389/fgene.2020.583085
Cheng, H. T., Kim, M., Valerius, M. T., Surendran, K., Schuster-Gossler, K., Gossler, A., et al. (2007). Notch2, but not Notch1, is required for proximal fate acquisition in the mammalian nephron. Development 134 (4), 801–811. doi:10.1242/dev.02773
Chung, E., Deacon, P., and Park, J. S. (2017). Notch is required for the formation of all nephron segments and primes nephron progenitors for differentiation. Development 144 (24), 4530–4539. doi:10.1242/dev.156661
Combes, A. N., Phipson, B., Lawlor, K. T., Dorison, A., Patrick, R., Zappia, L., et al. (2019). Single cell analysis of the developing mouse kidney provides deeper insight into marker gene expression and ligand-receptor crosstalk. Development 146 (12), dev178673. doi:10.1242/dev.178673
Davoli, T., Xu, A. W., Mengwasser, K. E., Sack, L. M., Yoon, J. C., Park, P. J., et al. (2013). Cumulative haploinsufficiency and triplosensitivity drive aneuploidy patterns and shape the cancer genome. Cell 155 (4), 948–962. doi:10.1016/j.cell.2013.10.011
Dong, L., Pietsch, S., and Englert, C. (2015). Towards an understanding of kidney diseases associated with WT1 mutations. Kidney Int. 88 (4), 684–690. doi:10.1038/ki.2015.198
El-Dahr, S. S., Aboudehen, K., and Saifudeen, Z. (2008). Transcriptional control of terminal nephron differentiation. Am. J. Physiol. Ren. Physiol. 294 (6), F1273–F1278. doi:10.1152/ajprenal.00562.2007
England, A. R., Chaney, C. P., Das, A., Patel, M., Malewska, A., Armendariz, D., et al. (2020). Identification and characterization of cellular heterogeneity within the developing renal interstitium. Development 147 (15), dev190108. doi:10.1242/dev.190108
Ferreira, R., Schneekloth, J. S., Panov, K. I., Hannan, K. M., and Hannan, R. D. (2020). Targeting the RNA polymerase I transcription for cancer therapy comes of age. Cells 9 (2), 266. doi:10.3390/cells9020266
Franzen, O., Gan, L. M., and Bjorkegren, J. L. M. (2019). PanglaoDB: A web server for exploration of mouse and human single-cell RNA sequencing data. Database (Oxford) 2019, baz046. doi:10.1093/database/baz046
Fu, W., Zhu, J., Xiong, S. W., Jia, W., Zhao, Z., Zhu, S. B., et al. (2017). BARD1 gene polymorphisms confer nephroblastoma susceptibility. EBioMedicine 16, 101–105. doi:10.1016/j.ebiom.2017.01.038
Gaviraghi, M., Vivori, C., and Tonon, G. (2019). How cancer exploits ribosomal RNA biogenesis: A journey beyond the boundaries of rRNA transcription. Cells 8 (9), 1098. doi:10.3390/cells8091098
Ge, S. X., Son, E. W., and Yao, R. (2018). iDEP: an integrated web application for differential expression and pathway analysis of RNA-Seq data. BMC Bioinforma. 19 (1), 534. doi:10.1186/s12859-018-2486-6
Georgas, K., Rumballe, B., Valerius, M. T., Chiu, H. S., Thiagarajan, R. D., Lesieur, E., et al. (2009). Analysis of early nephron patterning reveals a role for distal RV proliferation in fusion to the ureteric tip via a cap mesenchyme-derived connecting segment. Dev. Biol. 332 (2), 273–286. doi:10.1016/j.ydbio.2009.05.578
Gupta, M., Concepcion, C. P., Fahey, C. G., Keshishian, H., Bhutkar, A., Brainson, C. F., et al. (2020). BRG1 loss predisposes lung cancers to replicative stress and ATR dependency. Cancer Res. 80 (18), 3841–3854. doi:10.1158/0008-5472.CAN-20-1744
Haghverdi, L., Buttner, M., Wolf, F. A., Buettner, F., and Theis, F. J. (2016). Diffusion pseudotime robustly reconstructs lineage branching. Nat. Methods 13 (10), 845–848. doi:10.1038/nmeth.3971
Hao, Y., Hao, S., Andersen-Nissen, E., Mauck, W. M., Zheng, S., Butler, A., et al. (2021). Integrated analysis of multimodal single-cell data. Cell 184 (13), 3573–3587.e29. doi:10.1016/j.cell.2021.04.048
Hargreaves, D. C., and Crabtree, G. R. (2011). ATP-Dependent chromatin remodeling: genetics, genomics and mechanisms. Cell Res. 21 (3), 396–420. doi:10.1038/cr.2011.32
Ho, L., and Crabtree, G. R. (2010). Chromatin remodelling during development. Nature 463 (7280), 474–484. doi:10.1038/nature08911
Hochane, M., van den Berg, P. R., Fan, X., Berenger-Currias, N., Adegeest, E., Bialecka, M., et al. (2019). Single-cell transcriptomics reveals gene expression dynamics of human fetal kidney development. PLoS Biol. 17 (2), e3000152. doi:10.1371/journal.pbio.3000152
Hodges, C., Kirkland, J. G., and Crabtree, G. R. (2016). The many roles of BAF (mSWI/SNF) and PBAF complexes in cancer. Cold Spring Harb. Perspect. Med. 6 (8), a026930. doi:10.1101/cshperspect.a026930
Hodges, H. C., Stanton, B. Z., Cermakova, K., Chang, C. Y., Miller, E. L., Kirkland, J. G., et al. (2018). Dominant-negative SMARCA4 mutants alter the accessibility landscape of tissue-unrestricted enhancers. Nat. Struct. Mol. Biol. 25 (1), 61–72. doi:10.1038/s41594-017-0007-3
Howe, H. L., Wu, X., Ries, L. A., Cokkinides, V., Ahmed, F., Jemal, A., et al. (2006). Annual report to the nation on the status of cancer, 1975-2003, featuring cancer among U.S. Hispanic/Latino populations. Cancer 107 (8), 1711–1742. doi:10.1002/cncr.22193
Itaranta, P., Chi, L., Seppanen, T., Niku, M., Tuukkanen, J., Peltoketo, H., et al. (2006). Wnt-4 signaling is involved in the control of smooth muscle cell fate via Bmp-4 in the medullary stroma of the developing kidney. Dev. Biol. 293 (2), 473–483. doi:10.1016/j.ydbio.2006.02.019
Jaccard, P. (1912). The distribution of the flora in the alpine zone. New Phytol. 11 (2), 37–50. doi:10.1111/j.1469-8137.1912.tb05611.x
Jarvis, R. A., and Patrick, E. A. (1973). Clustering using a similarity measure based on shared near neighbors. IEEE Trans. Comput. 22 (11), 1025–1034. doi:10.1109/T-C.1973.223640
Jia, W., Deng, Z., Zhu, J., Fu, W., Zhu, S., Zhang, L. Y., et al. (2017). Association between HACE1 gene polymorphisms and Wilms' tumor risk in a Chinese population. Cancer Investig. 35 (10), 633–638. doi:10.1080/07357907.2017.1405016
Kadoch, C., Hargreaves, D. C., Hodges, C., Elias, L., Ho, L., Ranish, J., et al. (2013). Proteomic and bioinformatic analysis of mammalian SWI/SNF complexes identifies extensive roles in human malignancy. Nat. Genet. 45 (6), 592–601. doi:10.1038/ng.2628
Kobayashi, A., Kwan, K. M., Carroll, T. J., McMahon, A. P., Mendelsohn, C. L., and Behringer, R. R. (2005). Distinct and sequential tissue-specific activities of the LIM-class homeobox gene Lim1 for tubular morphogenesis during kidney development. Development 132 (12), 2809–2823. doi:10.1242/dev.01858
Kobayashi, A., Mugford, J. W., Krautzberger, A. M., Naiman, N., Liao, J., and McMahon, A. P. (2014). Identification of a multipotent self-renewing stromal progenitor population during mammalian kidney organogenesis. Stem Cell Rep. 3 (4), 650–662. doi:10.1016/j.stemcr.2014.08.008
Kusnadi, E. P., Hannan, K. M., Hicks, R. J., Hannan, R. D., Pearson, R. B., and Kang, J. (2015). Regulation of rDNA transcription in response to growth factors, nutrients and energy. Gene 556 (1), 27–34. doi:10.1016/j.gene.2014.11.010
Latil, M., Nassar, D., Beck, B., Boumahdi, S., Wang, L., Brisebarre, A., et al. (2017). Cell-type-specific chromatin states differentially prime squamous cell carcinoma tumor-initiating cells for epithelial to mesenchymal transition. Cell Stem Cell 20 (2), 191–204. doi:10.1016/j.stem.2016.10.018
Lawlor, K. T., Zappia, L., Lefevre, J., Park, J. S., Hamilton, N. A., Oshlack, A., et al. (2019). Nephron progenitor commitment is a stochastic process influenced by cell migration. Elife 8, e41156. doi:10.7554/eLife.41156
Li, J., Xu, J., Jiang, H., Zhang, T., Ramakrishnan, A., Shen, L., et al. (2021). Chromatin remodelers interact with Eya1 and Six2 to target enhancers to control nephron progenitor cell maintenance. J. Am. Soc. Nephrol. 32 (11), 2815–2833. doi:10.1681/ASN.2021040525
Li, W., Hartwig, S., and Rosenblum, N. D. (2014). Developmental origins and functions of stromal cells in the normal and diseased mammalian kidney. Dev. Dyn. 243 (7), 853–863. doi:10.1002/dvdy.24134
Lindstrom, N. O., De Sena Brandine, G., Tran, T., Ransick, A., Suh, G., Guo, J., et al. (2018). Progressive recruitment of mesenchymal progenitors reveals a time-dependent process of cell fate acquisition in mouse and human nephrogenesis. Dev. Cell 45 (5), 651–660. doi:10.1016/j.devcel.2018.05.010
Little, M. H., and McMahon, A. P. (2012). Mammalian kidney development: principles, progress, and projections. Cold Spring Harb. Perspect. Biol. 4 (5), a008300. doi:10.1101/cshperspect.a008300
Liu, J., Wei, Q., Guo, C., Dong, G., Liu, Y., Tang, C., et al. (2017). Hypoxia, HIF, and associated signaling networks in chronic kidney disease. Int. J. Mol. Sci. 18 (5), 950. doi:10.3390/ijms18050950
Love, M. I., Huber, W., and Anders, S. (2014). Moderated estimation of fold change and dispersion for RNA-seq data with DESeq2. Genome Biol. 15 (12), 550. doi:10.1186/s13059-014-0550-8
Luo, Z., Li, B., Chen, J., Ma, Y., and Tao, H. (2013). Expression and the clinical significance of hPTTG1 in gastric cancer. Mol. Med. Rep. 7 (1), 43–46. doi:10.3892/mmr.2012.1161
Madisen, L., Zwingman, T. A., Sunkin, S. M., Oh, S. W., Zariwala, H. A., Gu, H., et al. (2010). A robust and high-throughput Cre reporting and characterization system for the whole mouse brain. Nat. Neurosci. 13 (1), 133–140. doi:10.1038/nn.2467
McCabe, C. J., Khaira, J. S., Boelaert, K., Heaney, A. P., Tannahill, L. A., Hussain, S., et al. (2003). Expression of pituitary tumour transforming gene (PTTG) and fibroblast growth factor-2 (FGF-2) in human pituitary adenomas: relationships to clinical tumour behaviour. Clin. Endocrinol. (Oxf) 58 (2), 141–150. doi:10.1046/j.1365-2265.2003.01598.x
McInnes, L., Healy, J., and Melville, J. (2018). Umap: uniform manifold approximation and projection for dimension reduction. Available at: https://arxiv.org/abs/1802.03426.
Miao, Z., Balzer, M. S., Ma, Z., Liu, H., Wu, J., Shrestha, R., et al. (2021). Single cell regulatory landscape of the mouse kidney highlights cellular differentiation programs and disease targets. Nat. Commun. 12 (1), 2277. doi:10.1038/s41467-021-22266-1
Mugford, J. W., Yu, J., Kobayashi, A., and McMahon, A. P. (2009). High-resolution gene expression analysis of the developing mouse kidney defines novel cellular compartments within the nephron progenitor population. Dev. Biol. 333 (2), 312–323. doi:10.1016/j.ydbio.2009.06.043
Nakai, S., Sugitani, Y., Sato, H., Ito, S., Miura, Y., Ogawa, M., et al. (2003). Crucial roles of Brn1 in distal tubule formation and function in mouse kidney. Development 130 (19), 4751–4759. doi:10.1242/dev.00666
Noll, J. E., Vandyke, K., Hewett, D. R., Mrozik, K. M., Bala, R. J., Williams, S. A., et al. (2015). PTTG1 expression is associated with hyperproliferative disease and poor prognosis in multiple myeloma. J. Hematol. Oncol. 8, 106. doi:10.1186/s13045-015-0209-2
Park, J. S., Ma, W., O'Brien, L. L., Chung, E., Guo, J. J., Cheng, J. G., et al. (2012). Six2 and Wnt regulate self-renewal and commitment of nephron progenitors through shared gene regulatory networks. Dev. Cell 23 (3), 637–651. doi:10.1016/j.devcel.2012.07.008
Pei, L. (2001). Identification of c-myc as a down-stream target for pituitary tumor-transforming gene. J. Biol. Chem. 276 (11), 8484–8491. doi:10.1074/jbc.M009654200
Pei, L., and Melmed, S. (1997). Isolation and characterization of a pituitary tumor-transforming gene (PTTG). Mol. Endocrinol. 11 (4), 433–441. doi:10.1210/mend.11.4.9911
Rakheja, D., Chen, K. S., Liu, Y., Shukla, A. A., Schmid, V., Chang, T. C., et al. (2014). Somatic mutations in DROSHA and DICER1 impair microRNA biogenesis through distinct mechanisms in Wilms tumours. Nat. Commun. 2, 4802. doi:10.1038/ncomms5802
Reggiani, L., Raciti, D., Airik, R., Kispert, A., and Brandli, A. W. (2007). The prepattern transcription factor Irx3 directs nephron segment identity. Genes Dev. 21 (18), 2358–2370. doi:10.1101/gad.450707
Schedl, A., and Hastie, N. D. (2000). Cross-talk in kidney development. Curr. Opin. Genet. Dev. 10 (5), 543–549. doi:10.1016/s0959-437x(00)00125-8
Shain, A. H., and Pollack, J. R. (2013). The spectrum of SWI/SNF mutations, ubiquitous in human cancers. PLoS One 8 (1), e55119. doi:10.1371/journal.pone.0055119
Shan, J., Jokela, T., Skovorodkin, I., and Vainio, S. (2010). Mapping of the fate of cell lineages generated from cells that express the Wnt4 gene by time-lapse during kidney development. Differentiation 79 (1), 57–64. doi:10.1016/j.diff.2009.08.006
Stark, K., Vainio, S., Vassileva, G., and McMahon, A. P. (1994). Epithelial transformation of metanephric mesenchyme in the developing kidney regulated by Wnt-4. Nature 372 (6507), 679–683. doi:10.1038/372679a0
Subramanian, A., Tamayo, P., Mootha, V. K., Mukherjee, S., Ebert, B. L., Gillette, M. A., et al. (2005). Gene set enrichment analysis: A knowledge-based approach for interpreting genome-wide expression profiles. Proc. Natl. Acad. Sci. U. S. A. 102 (43), 15545–15550. doi:10.1073/pnas.0506580102
Sumi-Ichinose, C., Ichinose, H., Metzger, D., and Chambon, P. (1997). SNF2beta-BRG1 is essential for the viability of F9 murine embryonal carcinoma cells. Mol. Cell Biol. 17 (10), 5976–5986. doi:10.1128/mcb.17.10.5976
Treger, T. D., Chowdhury, T., Pritchard-Jones, K., and Behjati, S. (2019). The genetic changes of Wilms tumour. Nat. Rev. Nephrol. 15 (4), 240–251. doi:10.1038/s41581-019-0112-0
Trotter, K. W., and Archer, T. K. (2008). The BRG1 transcriptional coregulator. Nucl. Recept Signal 6, e004. doi:10.1621/nrs.06004
Turnbull, C., Perdeaux, E. R., Pernet, D., Naranjo, A., Renwick, A., Seal, S., et al. (2012). A genome-wide association study identifies susceptibility loci for Wilms tumor. Nat. Genet. 44 (6), 681–684. doi:10.1038/ng.2251
van der Maaten, L. J. P., and Hinton, G. E. (2008). Visualizing high-dimensional data using t-SNE. J. Mach. Learn. Res. 9, 2579–2605.
Vlotides, G., Eigler, T., and Melmed, S. (2007). Pituitary tumor-transforming gene: physiology and implications for tumorigenesis. Endocr. Rev. 28 (2), 165–186. doi:10.1210/er.2006-0042
Waltman, L., and van Eck, N. J. (2013). A smart local moving algorithm for large-scale modularity-based community detection. Eur. Phys. J. B 86, 471. doi:10.1140/epjb/e2013-40829-0
Wilson, S. B., and Little, M. H. (2021). The origin and role of the renal stroma. Development 148 (19), dev199886. doi:10.1242/dev.199886
Xu, J., Wong, E. Y., Cheng, C., Li, J., Sharkar, M. T., Xu, C. Y., et al. (2014). Eya1 interacts with Six2 and Myc to regulate expansion of the nephron progenitor pool during nephrogenesis. Dev. Cell 31 (4), 434–447. doi:10.1016/j.devcel.2014.10.015
Yu, R., Lu, W. G., Chen, J. D., McCabe, C. J., and Melmed, S. (2003). Overexpressed pituitary tumor-transforming gene causes aneuploidy in live human cells. Endocrinology 144 (11), 4991–4998. doi:10.1210/en.2003-0305
Keywords: SWI/SNF chromatin remodeling complex, Smarca4/Brg1, Wnt4, nephron tubulogenesis, renal interstitium, Pttg1, fibrosis
Citation: Xu J, Zhou X, Zhang T, Zhang B and Xu P-X (2023) Smarca4 deficiency induces Pttg1 oncogene upregulation and hyperproliferation of tubular and interstitial cells during kidney development. Front. Cell Dev. Biol. 11:1233317. doi: 10.3389/fcell.2023.1233317
Received: 01 June 2023; Accepted: 17 August 2023;
Published: 04 September 2023.
Edited by:
Hongbing Liu, Tulane University, United StatesReviewed by:
Xiguang Xu, Virginia Tech, United StatesYas Furuta, Memorial Sloan Kettering Cancer Center, United States
Copyright © 2023 Xu, Zhou, Zhang, Zhang and Xu. This is an open-access article distributed under the terms of the Creative Commons Attribution License (CC BY). The use, distribution or reproduction in other forums is permitted, provided the original author(s) and the copyright owner(s) are credited and that the original publication in this journal is cited, in accordance with accepted academic practice. No use, distribution or reproduction is permitted which does not comply with these terms.
*Correspondence: Pin-Xian Xu, cGlueGlhbi54dUBtc3NtLmVkdQ==
†These authors have contributed equally to this work