 Giacomo Siano1,2†*
 Martina Varisco1†‡
 Marco Terrigno3
 Congwei Wang3Arianna Scarlatti1Vincenzo Iannone2
 Marco Groth4
 Marie-Christine Galas5
 Jeroen J. M. Hoozemans6
 Alessandro Cellerino1,7
 Antonino Cattaneo1*
 Cristina Di Primio2*
- 1Laboratory of Biology, BIO@SNS, Scuola Normale Superiore, Pisa, Italy
- 2Istituto di Neuroscienze, Consiglio Nazionale delle Ricerche, Pisa, Italy
- 3Roche Pharma Research and Early Development, Roche Innovation Center Basel, Basel, Switzerland
- 4CF Next-Generation Sequencing, Leibniz Institute on Ageing – Fritz Lipmann institute, Jena, Germany
- 5University of Lille, Institut national de la santé et de la recherche médicale, CHU-Lille, Centre national de la recherche scientifique, LilNCog-Lille Neuroscience & Cognition, Lille, France
- 6Department of Pathology, Amsterdam Neuroscience, Amsterdam University Medical Centers, Amsterdam, Netherlands
- 7Leibniz Institute on Ageing, Fritz Lipmann institute, Jena, Germany
Introduction: Recent research revealed that Tau plays critical roles in various neuronal functions. We previously demonstrated that destabilization and nuclear delocalization of Tau alter the expression of glutamatergic genes, mediating early neuronal damage.
Methods: In this study, we discovered that changes in Tau availability are linked to global alterations in gene expression that affect multiple neuronal pathways. Comparison with the human temporal region showed that the Tau-dependent modulation of gene expression closely resembles the intermediate stages of Alzheimer’s disease (AD) that precede the definitive pathological condition.
Results: Furthermore, we identified the chromatin remodeling pathway as being significantly affected by Tau in both our cellular model and AD brains, with reductions in heterochromatin markers. Our findings indicate that Tau is able to globally affect the neuronal transcriptome and that its subcellular unbalance changes gene expression in the intermediate stages of AD development. In addition, we found that the chromatin architecture is affected by Tau during the progression of AD.
Discussion: These results provide new insights into the molecular mechanisms underlying early stages of AD development and highlight the central role of Tau and the contribution of nuclear Tau in this process.
1 Introduction
The microtubule-associated protein Tau is a key factor in the maintenance of neuronal homeostasis and cytoskeletal stability (Guo et al., 2017). During the early stages of tauopathies, Tau exhibits specific characteristics: its expression levels increase, its soluble fraction expands, and it progressively forms oligomers and aggregates that result in neuronal damage and cell death (Kurbatskaya et al., 2016; Wang and Mandelkow, 2016; Han et al., 2017). While aggregates have traditionally been considered the primary cause of neurodegeneration; recent discoveries regarding Tau nuclear functions suggest a broader and more intricate role in neuronal homeostasis changes (Sotiropoulos et al., 2017; Siano et al., 2021). Previous observations hint that Tau has a connection with transcription regulation (Mansuroglu et al., 2016; Rousseaux et al., 2016; Benhelli-Mokrani et al., 2018; Guo et al., 2018; Sun et al., 2018; Rico et al., 2021). Recent studies reported that the progression of AD in the prefrontal cortex is the result of a multi-scale disruption of genome organization. This evidence indicates that the chromatin landscapes are dynamically altered, causing the deregulation of transcriptomic pathways, resulting in cell-type specific dysfunction. (Dileep et al., 2023; Gazestani et al., 2023; Xiong et al., 2023). A connection between Tau and chromatin structure has been previously described since Tau directly interacts with TRIM28, a key protein involved in histone modifications. Indeed, we recently demonstrated that Tau causes the delocalization of the chromatin remodeler HDAC1, an event associated with the reduction of heterochromatin (Lagger et al., 2002; Siano et al., 2023), suggesting a possible mechanism mediating the Tau-dependent epigenetic and transcriptional alteration. Notably, Tau interacts with chromatin, playing a crucial role in genomic stability by safeguarding DNA from damage and maintaining nucleolar organization under stress conditions (Sjöberg et al., 2006; Rossi et al., 2008; Violet et al., 2014; Mansuroglu et al., 2016; Maina et al., 2018; Colnaghi et al., 2020). Additionally, Tau is implicated in transposon activation, a process closely linked to Alzheimer’s disease (AD) (Guo et al., 2018; Sun et al., 2018). Our recent study revealed that nuclear Tau alters the expression of glutamatergic genes, resulting in toxic hyperexcitability during the early stages of AD. Intriguingly, aggregation of Tau prevents this mechanism, reducing glutamatergic deregulation (Siano et al., 2020b).
In this study, we demonstrate that Tau’s influence on the neuronal transcriptome includes reshaping the chromatin landscape during the early and intermediate stages of AD. Specifically, we show that Tau leads to widespread epigenetic alterations, including a progressive Tau-dependent loss of heterochromatin markers, both in a neuroblastoma SH-SY5Y cell line model and in human AD brain tissues. These findings indicate that Tau plays a pivotal role in the early transcriptional dysregulation seen in AD and reveal a previously underappreciated mechanism whereby Tau contributes to disease pathology through its impact on chromatin remodeling. This novel insight into Tau’s nuclear function adds a critical dimension to our understanding of AD progression, suggesting that Tau’s role in reshaping the transcriptional landscape may be a key driver of early AD pathology.
By employing a high-resolution transcriptomic approach, our findings highlight that the transcriptional changes mediated by Tau closely align with intermediate AD stages, suggesting that Tau-driven chromatin remodeling could be a major factor in the onset and exacerbation of AD. This study thus reveals a new and crucial function for Tau in the progression of AD, offering potential new avenues for therapeutic intervention.
2 Materials and methods
2.1 Cell culture, transfection and differentiation
SH-SY5Y neuroblastoma cells were maintained in DMEM/F12 (Gibco) supplemented with foetal bovine serum (FBS) and penicillin/streptomycin. For the transcriptomic experiments, 2 × 10⁵ cells were plated in p30 wells and transfected the day after seeding with Lipofectamine 2,000 according to the manufacturer’s instructions. The day after transfection, cells were differentiated by 10 µM retinoic acid (Sigma‒Aldrich) for 5 days, followed by 50 ng/mL BDNF (Alomone Labs) for 15 days in serum-free DMEM/F12 medium. After differentiation, cells were collected for Western blotting and RNA extraction. For Tau overexpression, the cDNA encoding Tau isoform D (383 aa) was cloned into the BglII site of pcDNA3.1, and an empty pcDNA3.1 vector was used as a control as previously described (Siano et al., 2019b).
2.2 Post-mortem brain samples
Fresh-frozen human post-mortem brain samples were collected at the pathology departments of VUmc (Amsterdam, Netherlands), with approval granted by VUmc for their use in this study. All samples were treated with informed consent and ethical considerations; that is, tissue was collected post-mortem from donors from whom full consent had been obtained during life to conduct a brain autopsy for research purposes and all methods were carried out in accordance with relevant guidelines and regulations. Tissues from both male and female donors were used in this study. There was no influence or association of sex on the findings reported.
2.3 Western blot analysis
For Western blot (WB) analysis, experiments were performed as previously described (Siano et al., 2020a). In brief, total protein extracts were prepared in lysis buffer supplemented with protease and phosphatase inhibitors (Roche). Proteins were quantified by bicinchoninic acid (BCA) assay (Thermo Fisher Scientific). Twenty micrograms of total proteins were loaded for each sample. The proteins were separated by SDS–PAGE and electroblotted onto Hybond-C-Extra (Amersham Biosciences) nitrocellulose membranes. The membranes were blocked with 5% skimmed milk powder in TBS and 0.1% Tween 20. The antibodies for WB were as follows: mouse anti-Tau (Tau13) 1:1,000 (Santa Cruz Biotechnology), rabbit anti-HP1α 1:500 (Abcam), rabbit anti-H3K9me3 1:500 (Abcam), rabbit anti-eIF1α 1:1,000 (Cell Signaling), rabbit anti phospho-eIF1α 1:1,000 (Cell Signaling), mouse anti-GAPDH 1:10,000 (Santa Cruz Biotechnology), HRP-conjugated anti-mouse 1:1,000 (Santa Cruz Biotechnology), and HRP-conjugated anti-rabbit 1:1,000 (Santa Cruz Biotechnology). Western blot quantification was performed using ImageJ software.
2.4 Immunofluorescence
For Immunofluorescence (IF) experiments in vitro, cells were fixed with ice-cold 100% methanol for 5 min. The cells were permeabilized (PBS, 0.1% Triton X-100), blocked (1% wt/vol BSA) and incubated with primary and secondary antibodies. The slides were mounted with VECTASHIELD mounting medium (Vector Laboratories). The antibodies for IF were as follows: mouse anti-Tau (Tau13) 1:500 (Santa Cruz Biotechnology), rabbit anti-HP1α 1:250 (Abcam), rabbit anti-H3K9me3 1:500 (Abcam), mouse anti-Tau AT8 1:250 (Invitrogen), anti-NeuN (Boster Biological Technology) 1: 300, anti-mouse Alexa Fluor 633, and anti-rabbit Alexa Fluor 488 (Life Technologies). Nuclear staining was performed by incubation for 15 min with DAPI. Images were acquired on a Zeiss Laser Scanning (LSM) 880 confocal microscope (Carl Zeiss, Jena, Germany) supplied with GaAsP (gallium:arsenide:phosphide) detectors. The samples were viewed with a 63X Apochromat oil immersion (1.4 NA) DIC objective. Whole-cell images were acquired with a z-stack series with 0.5 µm intervals and summed with the z-projection tool from Fiji. Chromatin marker fluorescence was analysed by Fiji software.
Freshly frozen brain tissue was sectioned at 10 μm using a cryostat (Thermo Fisher Scientific). The brain slices were fixed in ice-cold acetone for 5 min before being rinsed twice with PBS and twice with PBS-T and blocked in animal-free blocker for 30 min. The tissue sections were treated for 1 h at room temperature with primary antibodies diluted in blocking solution, rinsed three times with PBS-T, and then incubated with secondary antibodies for 1 h at room temperature. Following a PBS-T wash, the slices were incubated with PureBlu DAPI (Bio-Rad, Cat# 1351303) for 3 min before being mounted with ProLong Gold antifade mounting media (Thermo Fisher Scientific, Cat# P36934). Images were scanned using an Olympus SLIDEVIEW VS200 slide scanner.
ImageJ software was used to analyse immunofluorescence images. Image5D tool followed by Z Projection was employed for z-stack images. For HP1α and H3k9me3 fluorescence quantification, ROI of cellular nuclei has been drawn by ImageJ and mean fluorescence quantified in Tau positive cells or in Ctrl cells and corrected for the total fluorescence intensity. In AD brains, H3K9me3 fluorescence was measured in NeuN and AT8 positive cells after background subtraction and corrected for the total fluorescence intensity. In control BS1 and BS2 samples, AT8 signal was undetectable or very low. In AD samples from BS3 to BS6 we detected a significant and increasing AT8 signal. H3K9me3 fluorescence in NeuN/AT8-positive cells was compared to NeuN-positive cells in BS1/2 samples. An average of 55 cells were analysed for each brain sample. For imaging analysis, images have not been manipulated. For representative images in the text, Brightness and Contrast plugin was used homogeneously for the different experimental groups to clarify measured differences.
2.5 Statistical analysis
For WB and IF analyses, the non-parametric Kruskal–Wallis test was used. All results are shown as the mean ± standard error of the mean (SEM). For WB experiments, N ≥ 3 independent biological experiments were performed. For IF experiments on neuroblastoma cells: N ≥ 30; each biological replicate corresponded to one cell. For human brain sample analyses, N ≥ 4. Significance is indicated as * for p < 0.05, ** for p < 0.01, *** for p < 0.001 and **** for p < 0.0001.
2.6 RNA extraction and RNA-seq
Two experimental groups were compared: the control and TauWT overexpression groups. RNA was extracted with a NucleoSpin (Macherey-Nagel) RNA extraction kit according to the manufacturer’s instructions. Sequencing of RNA samples was performed using Illumina’s next-generation sequencing methodology (Bentley et al., 2008). In detail, total RNA was quantified and quality checked using Bioanalyzer 2,100 instrument in combination with RNA 6000 nano kit (both Agilent Technologies). Libraries were prepared from 800 ng of input material (total RNA) using NEBNext Ultra II Directional RNA Library Preparation Kit in combination with NEBNext Poly(A) mRNA Magnetic Isolation Module and NEBNext Multiplex Oligos for Illumina (Index Primers Set 1/2/3/4) following the manufacturer’s instructions (New England Biolabs). Quantification and quality check of libraries was done using an Bioanalyzer 2,100 instrument and DNA 7500 kit (Agilent Technologies). Libraries were pooled and sequenced in two lanes on a HiSeq 2,500. System runs in 51 cycle/single-end/high-throughput (SBS reagent v3) mode. Sequence information was converted to FASTQ format using bcl2fastq v1.8.4.
2.7 RNA sequencing data analysis
The reads were mapped onto the genome (Ensembl: GRCh38.92 (Zerbino et al., 2018)) with Tophat v2.1 (Langmead et al., 2009; Kim et al., 2013) using parameter--no-convert-bam--no-coverage-search -x 1 -g 1: on average, 80% of all reads were mapped univocally. The reads per gene were counted using featureCounts v1.5.0 (Liao et al., 2019). Read counts were introduced in the statistical environment R (v.3.4.1) for further processing. Read counts were normalized for reads per sample (RPM) and transcript length (RPKM) (Mortazavi et al., 2008). DEGs were defined by an FDR cut-off of <0.1 in the statistical tests of all 3 R packages, edgeR (Robinson et al., 2010), DESeq (Anders and Huber, 2010) and baySeq (Hardcastle and Kelly, 2010), and by an absolute log2FC > 0.5. The 300 most variant genes were selected for the PCA plot with the prcomp function in the R ‘stats’ package (R v4.1.3) after variance stabilization in DESeq2 v1.34.0 (Anders and Huber, 2010). The EnhancedVolcano package v1.12.0 was used for the volcano plot (Blighe et al., 2018). The dataset is available upon request (dataset reference number GSE239956).
GO analysis of the DEGs was performed by ORA with the GO Biological Process annotations from the GO. db package v3.14.0 (Carlson, 2019). ORA was performed by a right-sided hypergeometric test, and terms with BH-adjusted p values <0.05 were considered significant. WebGestalt was used to summarize GO entries with the affinity propagation method (Wang and Reddy, 2017). For KEGG pathway enrichment, pathways were retrieved using the KEGGREST package v1.34.0 (Tenebaum and Maintainer, 2023), and the Wilcoxon test was performed for each pathway on the merged set of up- and downregulated DEGs. Pathways with a P value <0.05 and number of genes >10 are reported in the table.
GSEA was performed on all the genes ranked by log2FC using the fgsea R package v1.31.0 (Korotkevich et al., 2023) on the msigdbr GO Biological Process database v7.5.1 (Dolgalev, 2022), with parameters minSize = 15 and maxSize = 500. The top 10 upregulated and top 10 downregulated pathways were displayed with the plotGseaTable function in fgsea (Korotkevich et al., 2023).
2.8 Gene expression comparison with the human dataset
For transcriptome meta-analysis, public transcriptomic datasets were sourced from the GEO platform hosted on NCBI (https://www.ncbi.nlm.nih.gov/geo/). The GSE84422 dataset (Wang et al., 2016), which includes data from 1,053 postmortem brain samples across 19 brain regions from a total of 125 patients dying at different AD stages, with 50–60 subjects per brain region, was used. The patients were clustered by AD severity into four groups, the normal (n = 110), posAD (n = 110), proAD (n = 83) and defAD (n = 163) groups, according to their clinical dementia rating (CDR), Braak NFT score, sum of NFT density across different brain regions, average neuritic plaque density and average Consortium to Establish a Registry for Alzheimer’s Disease (CERAD) score. The R packages GEOquery (Davis and Meltzer, 2007), Rcpp v1.0.12 (Eddelbuettel and François, 2011) and tidyselect v1.2.1 were used to import datasets and create subsets by diagnosis and sample type or brain region. To compare different platforms, platform-specific IDs were converted into Entrez Gene IDs using the corresponding R annotation databases from Bioconductor, available via bioMart v3.8 (Durinck et al., 2009). Multiple platform IDs matching the same gene were summarized in a single entry with gene expression as the mean of probe expression. Probes mapping on the same gene with a discordant logFC were excluded from the analysis to preserve more reliable data. Differential expression analysis of microarray data was performed with the R package limma v3.8 (Ritchie et al., 2015). An FDR-adjusted p value <0.1 was set as the cut-off for differential expression.
GO terms associated with genes were retrieved using the GO Biological Process annotations from the GO. db package v3.14.0 (Carlson, 2019). The direction and magnitude of the logFC of genes in selected transcription- and chromatin-related GO pathways were compared between SH-SY5Y and patients in dataset GSE84422 by Pearson correlation. All DEGs in the SH-SY5Y transcriptome were included in the analysis.
To assess the closest AD stage to the SH-SY5Y cell model, the logFC of each of the SH-SY5Y DEGs was compared to data of patients from GSE84422 at different AD stages and visualized with the ComplexHeatmap R package v 2.10.0 (Gu et al., 2016). The global logFC correlation of SH-SY5Y DEGs with AD stages was displayed by sample-wise correlation heatmap with ComplexHeatmap (Gu et al., 2016).
2.9 GO on common genes between tau-overexpressing SH-SY5y and hippocampus proAD transcriptome
GO was performed on genes differentially expressed in our transcriptomic data in Tau-overexpressing SH-SH5y (absolute log FC > 0.5 and FDR-adjusted p value <0.1) and with a log FC in the same direction in the hippocampus of proAD brains from GSE84422 (absolute log FC > 0.1). Upregulated and downregulated genes were analyzed separately for overrepresentation of Biological Process terms from the R package GO. db v3.14.0, using the hypergeometric test implemented in the hyperGTest function from the GOstats R package v2.60.0. Pathways with p-value <0.05 were deemed statistically significant. The enrichment and log10-transformed p-value of the significantly overrepresented pathways related to nuclear terms (transcription, chromatin, chromosome, histone, DNA) were displayed with ggplot2.
2.10 Overlap DEGs from the transcriptome of tau-overexpressing SH-SY5y with changes in chromatin marks in AD brains
Up-, downregulated and non-significant genes from transcriptomic data in Tau-overexpressing SH-SY5y cells were compared to the genes with changes in histone acetylation on H3K27, H3K9 and H3K122 in AD brains from published datasets: 1. Marzi et al., GEO accession number GSE102538 (H3K27ac) (Marzi et al., 2018); 2. Patel et al., accession numbers in supplementary tables (H3K27ac) (Patel et al., 2023);, 3. Nativio et al., GEO accession number GSE153875, GSE130746 (H3K27ac, H3K9ac, H3K122ac) (Nativio et al., 2020); 4. Klein et al., accession numbers in supplementary tables (H3K9ac) (Klein et al., 2019).
Significant overlaps were calculated by hypergeometric test for overrepresentation with the phyper R base function, with BH-adjusted p-value <0.05 as the significance threshold. The log10-transformed adjusted p-value of significant overlaps and their enrichment in the up- or downregulated set from our transcriptome with respect to the genome-wide baseline were displayed with ggplot2.
The number of downregulated and upregulated differential genes in our dataset that overlap with changes in acetylation in any dataset was displayed in an upset plot using the ComplexUpset R package v1.3.3. The ‘down’ category includes genes with significantly reduced acetylation in all the datasets reporting a change in gene acetylation, and the ‘up’ category includes genes with consistently increased acetylation. The ‘any’ set includes genes with discordant acetylation changes across datasets.
3 Results
3.1 Tau alters global gene expression in neuronal cellular model
During the progression of Alzheimer’s disease, the amounts of total and soluble Tau protein progressively increase even before significant hyperphosphorylation or aggregation, suggesting an early imbalance of Tau cellular levels (Kurbatskaya et al., 2016; Han et al., 2017). We previously observed that the increase in soluble Tau leads to its accumulation in the nucleus, which alters the expression of disease-related genes in the early stages (Siano et al., 2019a; Siano et al., 2019b; Siano et al., 2020b). Based on this evidence, we investigated whether Tau could directly modulate nuclear pathways, with a particular focus on the early stages.
We overexpressed Tau 0N4R, one of the most abundant Tau isoforms in the adult human brain, in differentiated neuroblastoma cells, a cellular model commonly used to study molecular mechanisms in tauopathies (Bell and Zempel, 2022; Siano et al., 2023). The global transcript expression was quantified by RNA sequencing (RNA-seq) (dataset reference number GSE239956). Principal component analysis (PCA) confirmed that the increased expression of Tau is the main factor contributing to variation in the global transcriptome profile (Figure 1A). RNA-seq data analysis revealed 3,235 differentially expressed genes (DEGs) between Tau-overexpressing and control cells (Figure 1B). Upon Tau overexpression, 1,680 DEGs were upregulated and 1,555 were downregulated (Figure 1B). KEGG analysis identified several pathways significantly overrepresented among the DEGs, and the most significant are listed in Table 1. Several terms were related to neuronal and synaptic pathways, confirming our previous observation that Tau modulates the expression of neuronal genes and might participate in triggering synaptic dysfunction occurring in early AD stages (Siano et al., 2019b). GSEA analysis showed pathways mainly related to immune response, signaling and protein homeostasis (Figure 1C), a result further supported by the GO analysis of upregulated and downregulated DEGs (Supplementary Figure S1, S2). Several overrepresented GSEA pathways were associated with nucleosome organization and chromatin remodeling, suggesting that altered levels of Tau protein could also affect these nuclear mechanisms. Of note, the overexpressed Tau is as soluble as the endogenous one, supporting that Tau levels, rather than its aggregation, are responsible for the observed effects (Supplementary Figure S3). In the transcriptome analysis, the protein homeostasis pathways significantly arise. We measured the levels of phospho-eIF2α after Tau overexpression as a well-known marker of response to ER stress and translational mechanisms (Clemens, 2001; Radford et al., 2015; Gerakis and Hetz, 2018; Shacham et al., 2021). We assessed the ratio between eIF2α-P and total eIF2α in our cellular model and we observed a significant increase after Tau overexpression confirming the reliability of the analysis and of the model (Figure 1D).
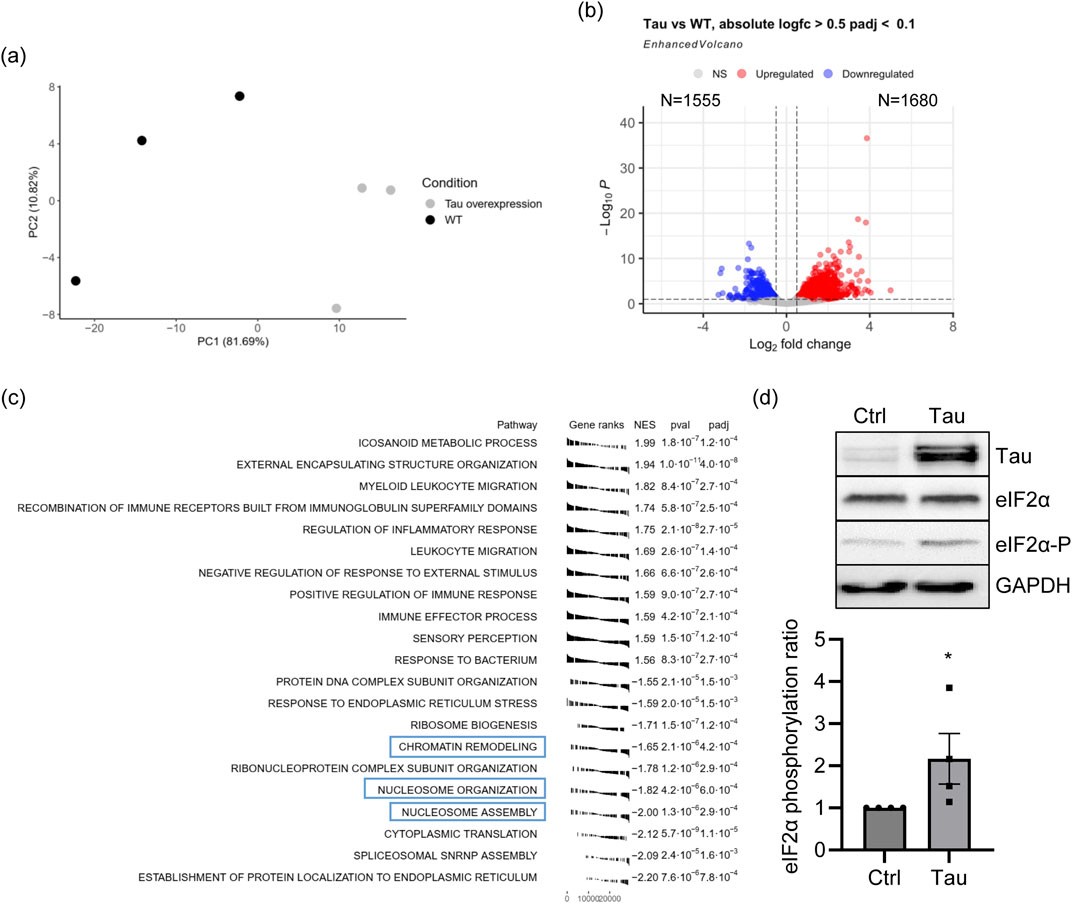
Figure 1. Tau overexpression in neuroblastoma cell lines leads to transcriptomic alterations. (A) PCA of proAD-mimic and control cells. (B) Volcano plot of DEGs. Red indicates upregulated genes, and blue indicates downregulated genes with |logFC| > 0.5 and FDR <0.1. Supplementary Table S1 for additional data (C) GSEA analysis (Biological Process) of the proAD-mimic transcriptome. (D) WB and relative quantification of differentiated SH-SY5Y cells overexpressing Tau (proAD-mimic; Tau) and control (Ctrl) cells. Tau, eIF2α and phosphorylated eIF2α (eIF2α-P) were measured with respect of the housekeeping GAPDH. The ratio between eIF2α-P and eIF2α has been reported in the graph. N = 4; *p < 0.05.
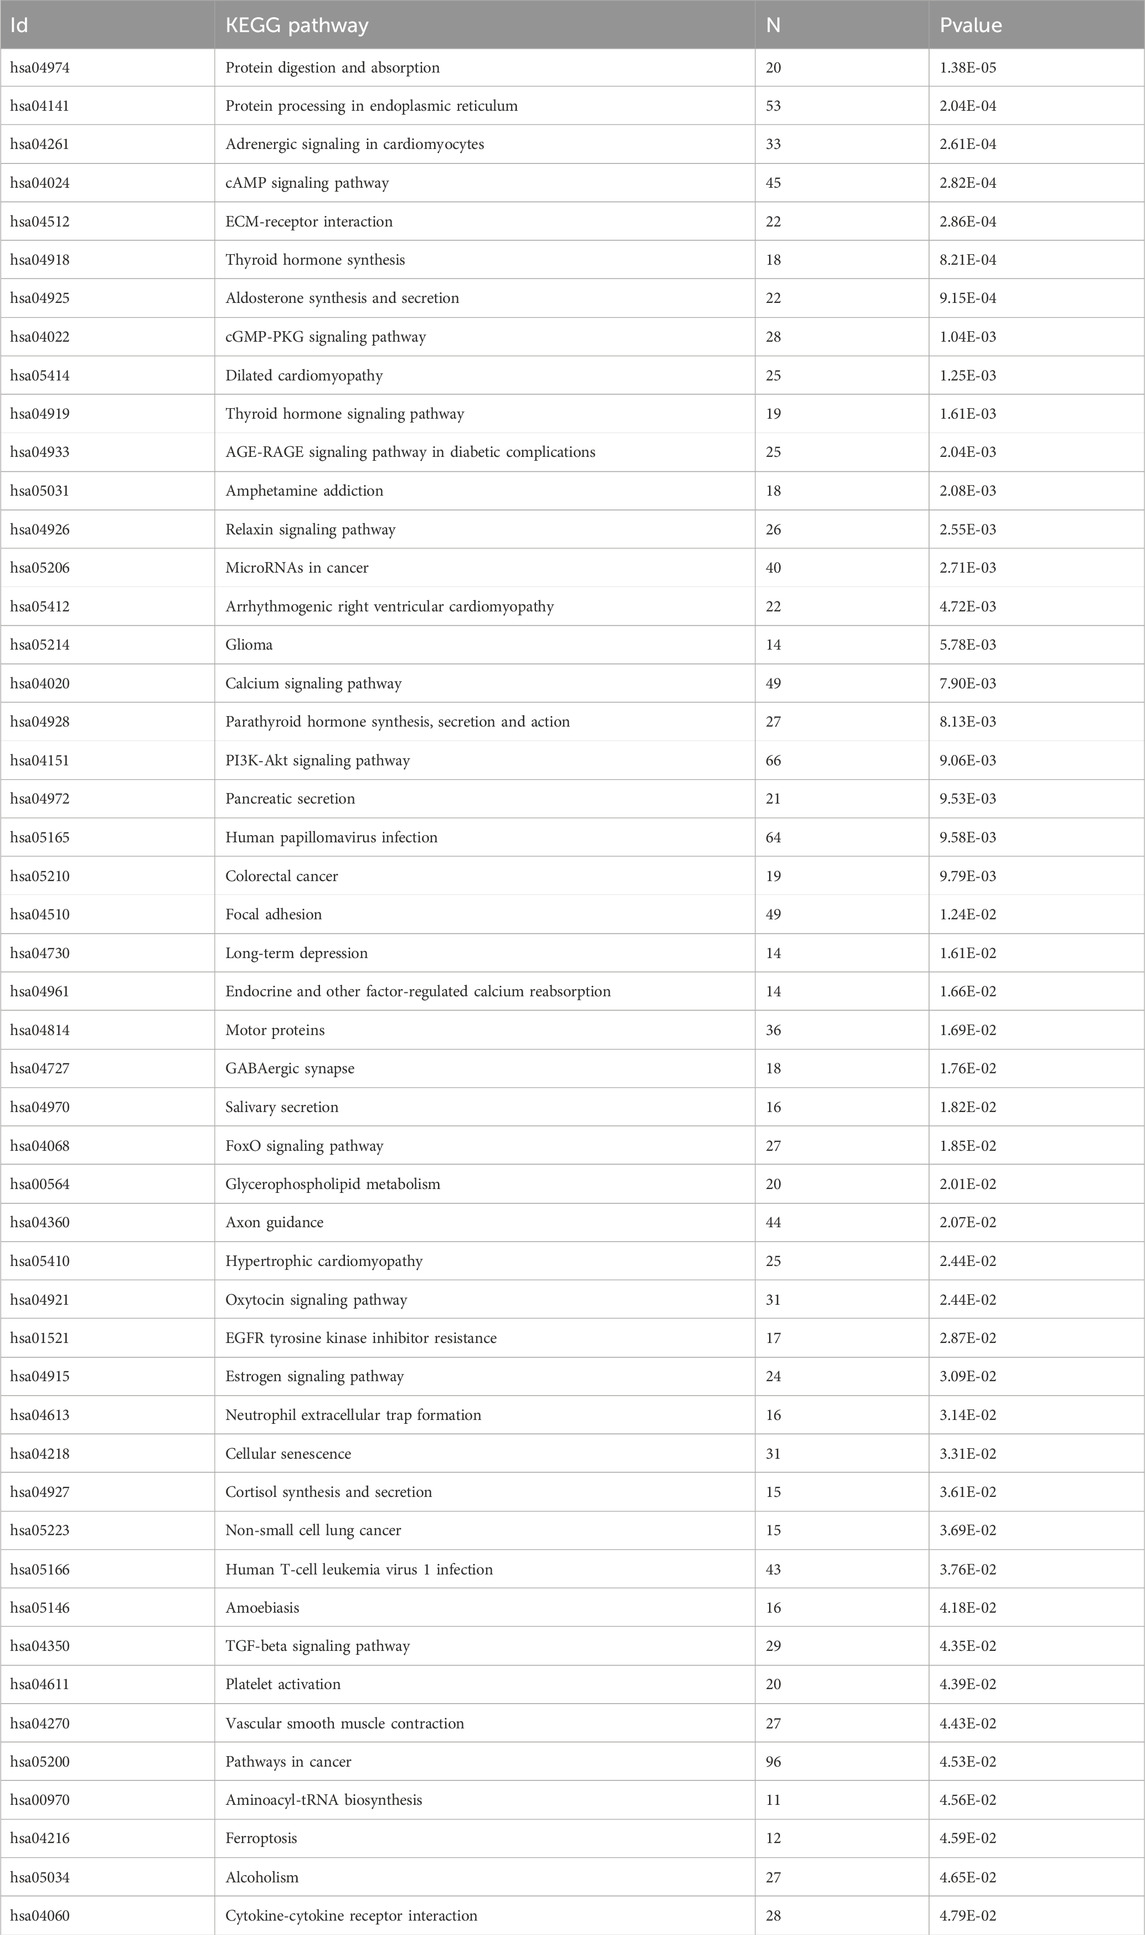
Table 1. Gene pathways altered by Tau. KEGG pathways of genes altered by Tau in neuroblastoma cell lines. Supplementary Table S2 for additional data.
3.2 Tau-dependent alteration of global gene expression in vitro resembles proAD conditions
To investigate whether Tau-dependent transcriptomic alteration replicates the dysregulation of genes in particular AD phases, we compared our RNA-seq data with the human brain transcriptome in various AD stages from a published dataset, GSE84422 (GPL97 platform). In this dataset AD brain samples are structured into 3 groups based on the integration of several diagnostic parameters (see Mat and Met): possible AD (posAD), probable AD (proAD) and definitive AD (defAD), representing early, intermediate, and late phases, respectively (Wang et al., 2016). The proAD condition significantly overlapped our dataset (Figure 2A). A correlation analysis with different AD stages in the temporal region revealed a positive correlation specifically between the cellular model and the proAD, while low or negative correlation with posAD and defAD respectively (Figure 2B). Hereinafter, the in vitro model of SH-SY5Y cells overexpressing Tau is referred to as proAD-mimic. By plotting the log fold changes (log2FCs) of proAD-mimic DEGs and posAD, proAD, and defAD, we found a positive correlation between our dataset and proAD, as expected, with approximately 75% of common genes displaying the same direction of regulation (R = 0.58 and p < 2.2e-16; Figure 2C). According to this analysis, the Tau-dependent gene alterations in the proAD-mimic represented a developing intermediate AD condition in the hippocampus. In addition, there was a negative correlation for posAD and no correlation for defAD (posAD: R = −0.3 and p < 0.00022; defAD: R = −0.086 and p value = 0.43; Figure 2D), with approximately 60%–65% common genes in the second and fourth quadrants. The heatmap representation of DEGs showed a higher sensitivity of the cellular model probably due to the differences in the techniques and in the cellular composition of the culture with respect to the multicellular composition of the brain. The heatmap restricted to upregulated and downregulated DEGS of the proAD-mimic, compared to posAD, proAD and defAD, indicates that the proAD dataset is the closest to the proAD-mimic, showing a comparable gene expression profile (Figure 2E). In addition, posAD and defAD present a comparable profile (Figure 2E), suggesting a bell-shaped trend of transcriptomic alteration during AD progression, as previously reported for synaptic pathways (Siano et al., 2020b; Amato et al., 2024).
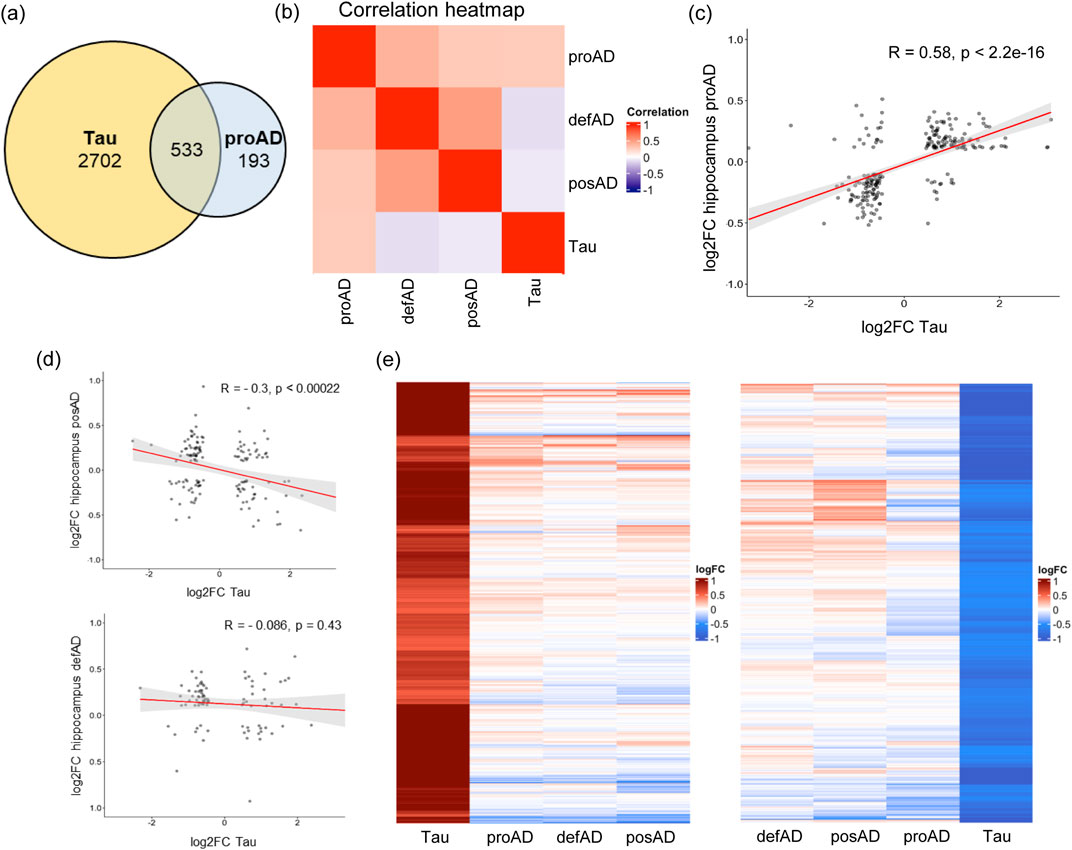
Figure 2. Tau-dependent transcriptome alteration correlates with the proAD stage in the human temporal region. (A) Common altered genes between proAD-mimic cells and proAD human brains. (B) Correlation heatmap of proAD-mimic model and AD brains stages. (C) Scatter plot representing the log2FCs of genes in proAD-mimic cells (x-axis) and proAD human brains (y-axis). (D) Scatter plot representing the log2FCs of genes in proAD-mimic cells (x-axis) and posAD or proAD human brains (y-axis). (E) Heatmap of upregulated and downregulated genes in proAD-mimic cells and posAD, proAD and defAD brains. Biological groups are ordered depending on their correlation profile proximity (proAD-mimic and proAD brain are always the closest profiles).
3.3 HP1α and H3K9me3 reduction occurs early in both cellular model and human brains
GSEA analyses revealed that the main nuclear pathway altered by Tau is associated with chromatin remodeling and nucleosome assembly (Figure 1C). Due to the relevance of these mechanisms in gene expression regulation and genome stability, we investigated their impact in the meta-analysis with AD brains at different stages. We performed GO analyses of the common DEGs between the proAD-mimic and the human proAD dataset and we observed that most of the identified pathways are associated with nucleotide metabolism, transcription and chromatin remodeling (Figure 3A). To understand how these pathways are modulated in disease progression, we retrieved the genes with GO annotation terms related to chromatin remodeling, transcriptional and epigenetic regulation (Transcription, Chromatin, Acetylation, Methylation, Histone) (Supplementary Table S4), and we calculated their correlation between proAD-mimic and AD brains. Pathways related to transcription and chromatin modifications were uncorrelated or anticorrelated in the posAD and defAD stages, while we found a positive correlation in proAD (Figure 3B). This result suggests a key role for Tau in this temporal window of pathology and shows that the increase in total and soluble Tau can lead to the alteration of transcription networks (Kurbatskaya et al., 2016; Han et al., 2017). To independently detect networks of co-expressed genes that may be altered in disease progression, we employed a longitudinal weighted gene coexpression network analysis (WGCNA) on temporal lobe samples from both AD and healthy individuals. This unbiased analysis revealed two distinct modules related to nuclear functions and dysregulated in AD brains: the Pink and the Darkgrey modules (Supplementary Figure S4; Supplementary Table S6, S7). The GO analysis of these modules highlighted functions such as DNA binding and transcription regulation. These findings support the results obtained from meta-analyses, suggesting that pathways associated with chromatin and gene expression may indeed be affected during disease progression.
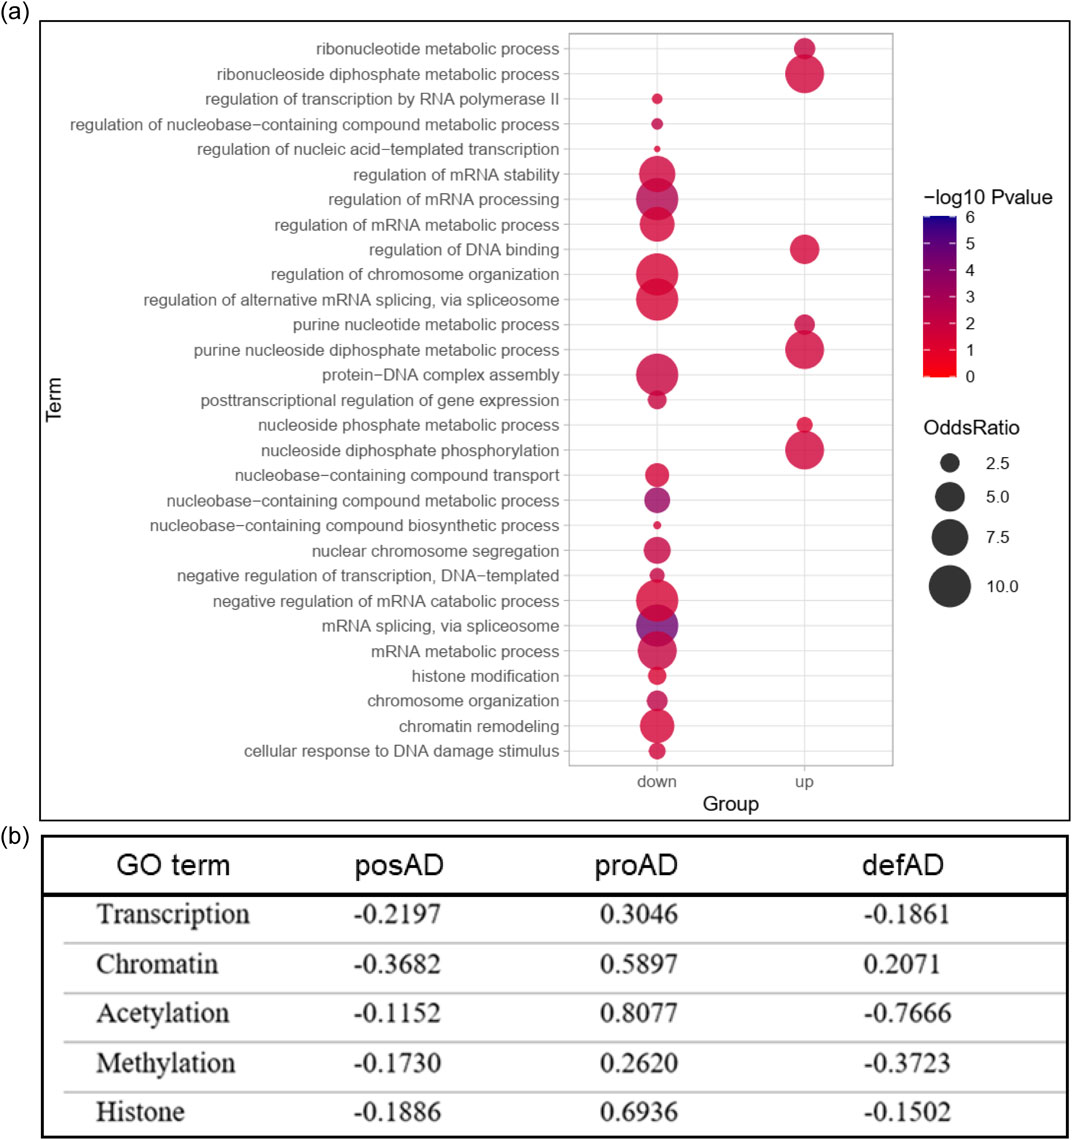
Figure 3. Chromatin remodeling pathways are altered by Tau. (A) GO analysis of proAD-mimic vs proAD common DEGs. (B) Correlation analysis of DEGs in chromatin remodeling pathways in posAD, proAD and defAD. Supplementary Table S4 for additional data.
Based on these data, we hypothesize that, in the early stages of the pathology, Tau might alter the expression of genes related to chromatin structure and organization, thus influencing genome stability and transcription. To elucidate chromatin remodeling deregulation, we detected the heterochromatin markers HP1α and H3K9me3, and we observed a significant reduction in the proAD-mimic compared to control cells by both immunoblotting (WB) (Figure 4A) and immunofluorescence (IF) (Figure 4B). These results indicate that increased Tau levels alter the amount of chromatin remodeling factors HP1α and H3K9me3, leading to a reduction in heterochromatin markers that mimics an early/intermediate AD condition. Of note, we observed that forcing the translocation of Tau (TauNLS) into the nuclear compartment still results in HP1α and H3K9me3 reduction and heterochromatin loss (Figure 4B).
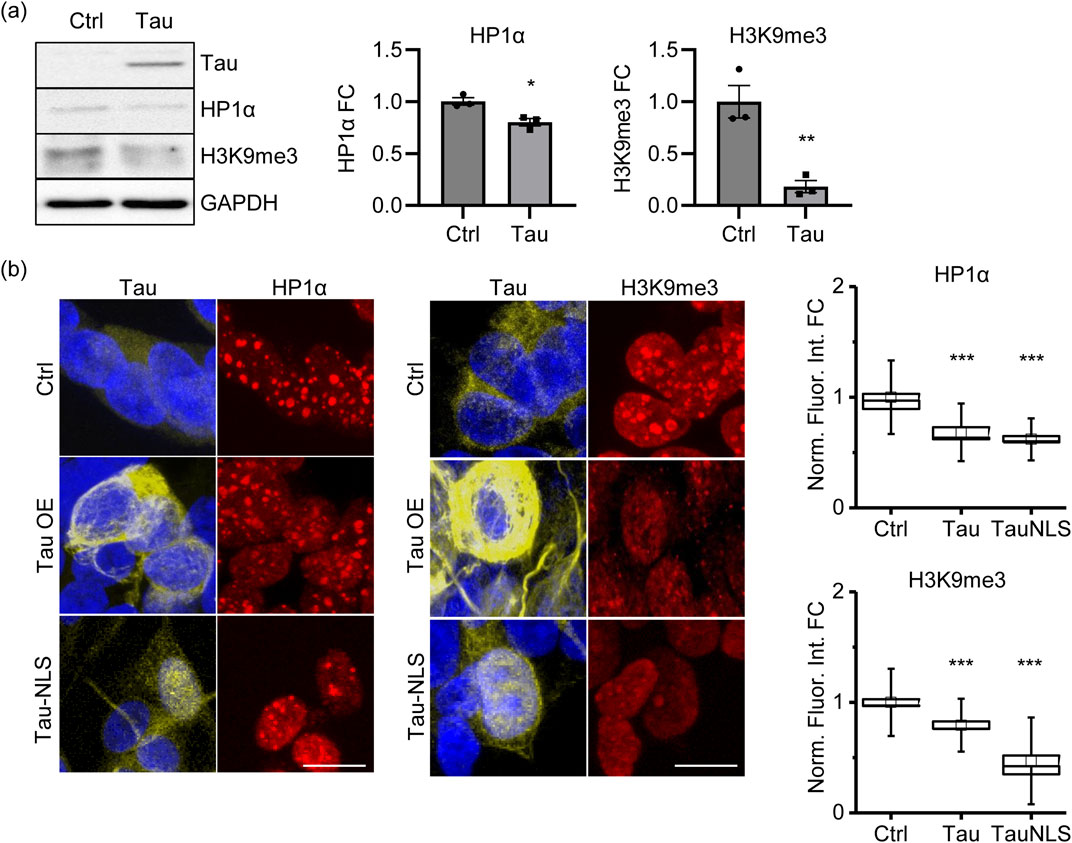
Figure 4. Tau induces a loss of heterochromatin markers. (A) WB of the heterochromatin markers HP1α and H3K9me3 in proAD-mimic (Tau) and control (Ctrl) cells. Relative quantification, bar plot of HP1α and H3K9me3 fold change in proAD-mimic (Tau) and control (Ctrl) cells. N = 3. (B) Immunofluorescence and relative quantification of HP1α and H3K9me3 in proAD-mimic and control cells. Red: HP1α/H3K9me3; yellow: Tau; blue: DAPI. (for HP1α analysis N = 60 in Ctrl cells; N = 30 in Tau overexpressing cells; N = 46 TauNLS) (for H3Kpme3 analysis N = 60 in Ctrl cells; N = 46 in Tau overexpressing cells; N = 68 TauNLS) Scale bar: 5 µm *p < 0.05; **p < 0.01.
To confirm these results, we analyzed the temporal lobes of control (BS1/2) and AD patients at early/intermediate pathological stages. By WB analysis, we observed a significant reduction in HP1α but not H3K9me3 levels (Figure 5A) at Braak stages 3 and 4 (BS3/4) compared to those in controls (BS1/2). In IF experiments, we labelled AD temporal lobes with the TauAT8 phospho-epitope as a marker of Tau pathology and NeuN as a marker of neuronal cells. At BS3 and BS4, we observed a sparse AT8 signal in a small percentage of NeuN+ cells. We analyzed the heterochromatin marker H3K9me3, and we observed that the total fluorescence was not altered as much as in the WB experiment. However, upon measuring the H3K9me3 signal in TauAT8-positive neurons, we observed a significantly weaker signal than that in healthy brains (Figure 5B). Of note, at late AD stages (BS5/6), the AT8 signal was detected in all tissues as expected, and the total H3K9me3 fluorescence was significantly reduced, further supporting our evidence regarding the Tau-dependent alteration of heterochromatin (Figures 5A,B). This finding further supports the interplay between pathological Tau and heterochromatin changes in stages that anticipate the defAD condition.
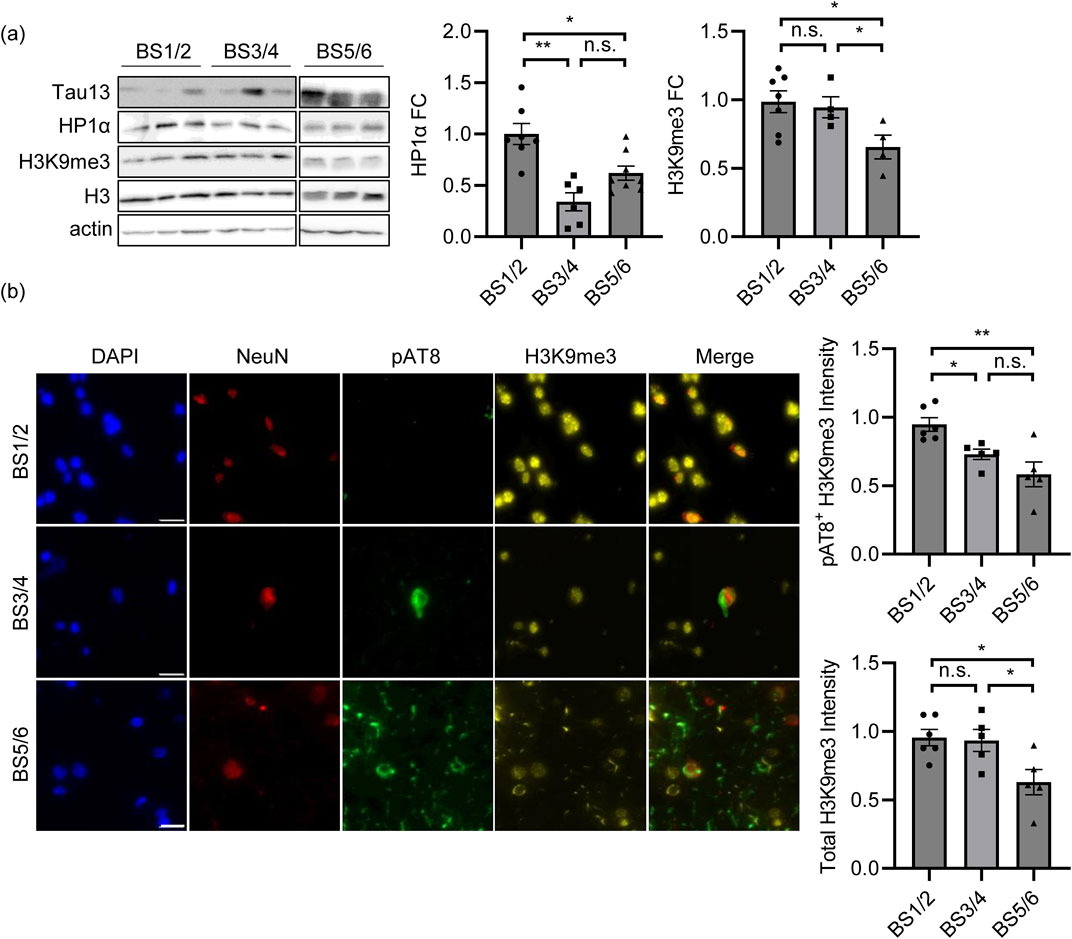
Figure 5. Heterochromatin changes are associated with Tau pathology in AD temporal lobes at intermediate stages. (A) WB of heterochromatin markers HP1α and H3K9me3 in human brain samples at BS1/2 (N = 7), BS3/4 (N = 6) and BS5/6 (N = 8) and relative quantification. Histone H3 and Actin are the housekeeping genes. HP1α and H3K9me3 fold change is reported in the graphs. H3K9me3 has been normalized on total H3 histone. (B) Immunofluorescence and relative quantification of H3K9me3 in human brain samples at BS1/2 (N = 6), BS3/4 (N = 5) and BS5/6 (N = 5). Red: NeuN; yellow: H3K9me3; green: pAT8; blue: DAPI. Scale bar: 20 µm *p < 0.05; **p < 0.01.
3.4 Tau-dependent transcriptomic profile is associated with chromatin architecture markers in AD
To assess whether transcriptomic changes induced by Tau overexpression in the proAD-mimic model are associated to alterations in the chromatin state also observed in AD brains, we compared our DEGs to genes with changes in histone acetylation in AD patients. We gathered ChIP-seq data on the acetylation marks H3K27ac, H3K9ac and H3K122ac, associated to active enhancers and transcription, from four independent datasets of post-mortem AD brains (Marzi et al., 2018; Klein et al., 2019; Nativio et al., 2020; Patel et al., 2023). The datasets span different brain regions (entorhinal cortex, prefrontal cortex, lateral temporal lobe) from AD patients and matched controls, for a total of 764 donors, 457 of whom had AD.
We classified genes into three categories according to the change in acetylation across all datasets: ‘down’ if acetylation decreased in all datasets reporting a change (N = 637), ‘up’ if it increased (N = 563), and ‘any’ if the direction of change was inconsistent across datasets (N = 644). Among the downregulated DEGs, 58.3% were associated with acetylation changes in at least one dataset, and the majority (26.1%) showed a decrease in acetylation, consistent with reduced transcription (Figure 6A). Similarly, 55.8% of the upregulated DEGs had a change in acetylation in AD, mainly an increase (22.3%) (Figure 6B). Therefore, differential genes show changes in acetylation consistent with the change in transcription, suggesting that they could be correlated. A small proportion of genes (12.1% for down- and 13.8% for upregulated DEGs) displayed an opposite change in acetylation, potentially due to differences between the cell line model and the brain tissue, and to the early AD stage of the model versus the late AD stage of the patient-derived sample.
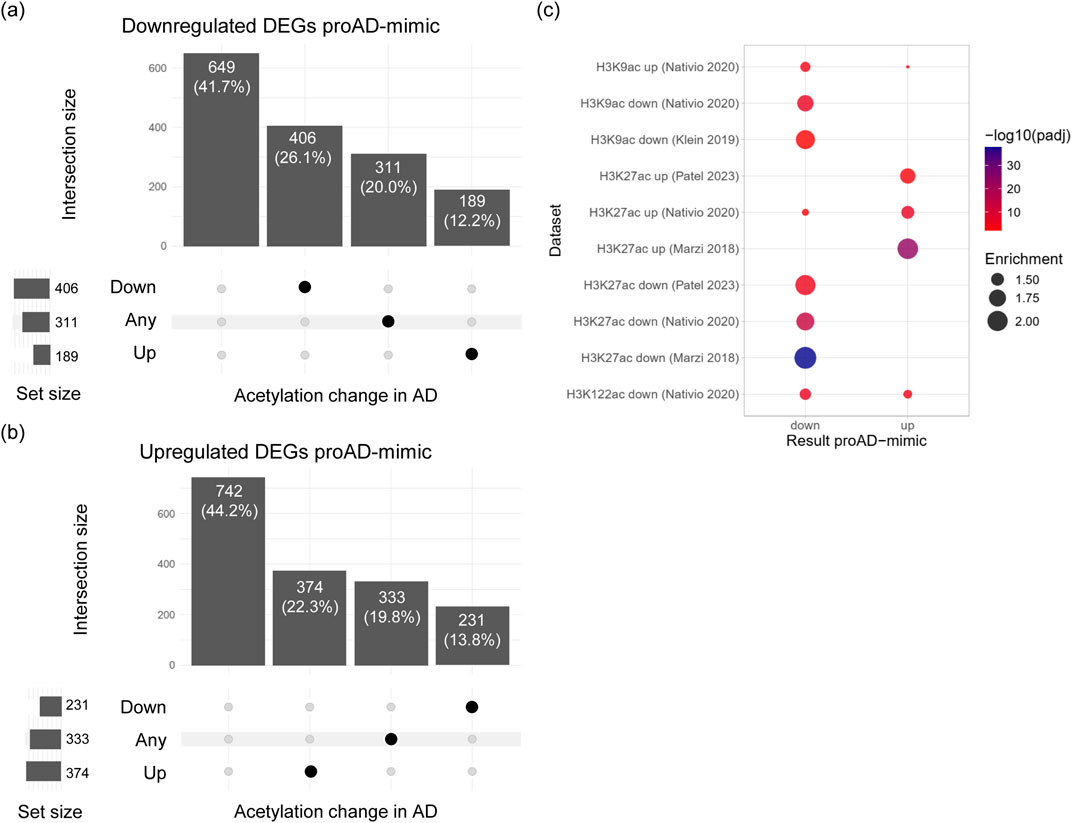
Figure 6. DEGs in the proAD-mimic transcriptome show changes in chromatin state in AD brains. (A) Upset plot displaying the overlap of downregulated DEGs in proAD-mimic condition with genes associated to changes in acetylation in AD. The overlap is reported as the number of genes in the exclusive intersection and their percentage over the total downregulated DEGs. (B) Upset plot showing the overlap of upregulated DEGs in proAD-mimic condition with genes associated to changes in acetylation in AD. The number of genes and their percentage over the upregulated DEGs are reported for each intersection. (C) Overrepresentation analysis of increased and decreased acetylation markers from different AD brain datasets in up- and downregulated DEGs from the proAD-mimic transcriptome. The point size is proportional to the enrichment, and the color to the BH-adjusted p value of the hypergeometric test.
To test if the proportion of genes with acetylation changes among the proAD-mimic DEGs is higher than expected by chance, we performed an overrepresentation analysis of the differentially acetylated genes from AD brain datasets in the proAD-mimic up- and downregulated DEGs (Figure 6C). Genes with reduced acetylation on H3K27, H3K122 and H3K9 were overrepresented among the downregulated proAD-mimic DEGs, while genes with increased acetylation were generally enriched in the upregulated DEGs, confirming the concordance between chromatin state and transcription. Increased H3K9ac from Nativio et al., 2020 was the only exception, probably due to differences between the cell line model and the brain tissue, to the early AD stage of the model versus the late AD stage of the human sample, and to the technical limitations. Overall, transcriptional changes in the proAD-mimic model are associated with alterations in the chromatin state in AD patients and display similar trends, suggesting that our model reflects epigenetic and transcriptional changes in the AD brain.
4 Discussion
In addition to the current literature’s emphasis on Tau and chromatin remodeling in late stages, our study introduces a novel finding: Tau is actively involved in transcriptomic alterations in the early stages of Alzheimer’s disease pathology. This discovery sheds light on the disease progression and provides valuable insights for potential therapeutic interventions. Indeed, we found that Tau-dependent loss of heterochromatin markers occurs before irreversible neuronal damage and the onset of definitive AD. Building upon our prior findings regarding the role of pathological Tau in glutamatergic gene expression alterations, we investigated the connection between Tau and global transcriptional changes during AD progression (Siano et al., 2019b; Siano et al., 2020b). The increased availability of Tau led to changes in synaptic genes and a broader transcriptomic rearrangement (Siano et al., 2021), consistent with findings in other models, supporting that Tau-dependent gene modulation is an intrinsic function of Tau (Elrod et al., 2019; Montalbano et al., 2021). The GO and GSEA analyses of the transcriptome in the cellular model identified terms related to synaptic functions, as expected (Siano et al., 2019b; Siano et al., 2020b). Additionally, we found terms that are relevant for neuronal physiology and pathology, such as protein metabolism and immune system, and less canonical pathways, such as RNA metabolism or extracellular matrix remodeling (Violet et al., 2014; Hernández-Ortega et al., 2016; Chauderlier et al., 2018; Ma et al., 2020). To functionally validate our analysis, we measured the phosphorylation of eIF2α and we observed a significant increase of this well-known marker of response to ER stress and translational mechanisms (Clemens, 2001; Radford et al., 2015; Gerakis and Hetz, 2018; Shacham et al., 2021). Remarkably the GSEA analysis highlights nuclear pathways specifically associated with chromatin remodeling, suggesting that Tau altered levels could affect this function.
We conducted a meta-analysis to explore Tau-dependent pathways in AD progression. We compared the transcriptome of the in vitro model with datasets from brains at three AD stages. Notably, we observed an overlap of differentially expressed genes (DEGs) with the proAD stage. This finding supports the hypothesis that gene expression changes induced by Tau reflect a pathological condition preceding late AD phases. Consequently, we designated our cellular model as ‘proAD-mimic.’
A gene-by-gene FC comparison indicated a positive correlation between the proAD-mimic and proAD brains, indicating that the transcriptomic modifications observed in patients might be also mediated by Tau pathology, as previously suggested (Siano et al., 2021). Indeed, in proAD conditions, the Tau protein is destabilized, oligomerized, and highly soluble (Alonso et al., 1997; Guo et al., 2017; Lowe et al., 2018). Furthermore, the total and soluble amounts of Tau are significantly elevated in intermediate stages, especially in frontal and temporal brain regions, suggesting that the increase in Tau level can impair neuronal homeostasis and drive the pathological changes observed in late phases (Kurbatskaya et al., 2016; Han et al., 2017). In this context, several functions are compromised, such as synaptic transmission and DNA repair, and our findings suggest that these pathways could be transcriptionally altered by Tau (Colnaghi et al., 2020; Siano et al., 2021). Notably, the meta-analysis identified the proAD mimic as a reliable model to resemble a developing intermediate stage (proAD) in vitro.
The specificity of the proAD-mimic was further strengthened by the comparison with posAD and defAD brains. The posAD and defAD transcriptomes were negatively correlated and not correlated with our dataset, respectively. The negative correlation with posAD might suggest early transcriptomic compensation to prevent Tau-dependent alterations and to maintain neuronal homeostasis. In contrast, the loss of correlation with the terminal stages could be the consequence of excessive transcriptomic and functional damage in proAD leading to global gene dysregulation. This evidence closely relates to our previous study on the human prefrontal cortex. We observed significant deregulation of synaptic genes mainly at Braak stages 3 and 4 (early or intermediate AD stage), and we hypothesized a causal link with destabilized and oligomerized Tau protein (Siano et al., 2020b). Our meta-analysis further confirmed that in early and intermediate pathological stages, there is a Tau-dependent transcriptomic alteration impinging on the synaptic pathways.
We previously demonstrated that the imbalance of Tau in the nucleus causes alterations in glutamatergic genes. Here, we found that Tau alters other neuronal pathways associated with stages preceding severe AD pathology that are characterized by higher Tau levels in turn (Kurbatskaya et al., 2016; Han et al., 2017). Remarkably, by GSEA analysis on the proAD-mimic, we observed nuclear pathways exclusively associated with chromatin remodeling. These data are further supported by the employment of WGCNA analysis on AD brain samples, an unbiased technique that shows, among several pathways, loss of co-regulation of terms associated with DNA binding and transcription regulation during AD progression. Due to the increasing interest in alternative functions of Tau and the still scarce literature about its nuclear role, we examined the chromatin and transcriptional pathways emerging from the meta-analysis. The GO analysis of common genes in proAD-mimic and AD brains dataset identified several terms related to transcription and chromatin remodeling. The correlation analysis of epigenetic terms showed a positive correlation with proAD, as expected, whereas a negative correlation and no regulation were observed in posAD and defAD stages, respectively. The Tau-dependent alteration of chromatin remodeling pathways associated with proAD supports an early modification of chromatin structures (Eissenberg and Elgin, 2014; Frost et al., 2014; El Hajjar et al., 2019; Napoletano et al., 2021). Of note, the negative correlation with posAD suggests a Tau-dependent mechanism leading to a homeostatic compensative balance. The reductions of heterochromatin markers, HP1α and H3K9me3, in the proAD-mimic indicated Tau as a major factor leading to the loss of heterochromatin. We confirmed this evidence in human temporal tissues. At early/intermediate stages, H3K9me3 signal is specifically reduced in neurons that exhibit hyperphosphorylation of Tau at AT8 epitope, commonly associated with Tau pathology (Neddens et al., 2018), according with our previous observations. However, HP1α showed a stronger and wider reduction than H3K9me3. It is conceivable that alteration of HP1α, a general marker of heterochromatin, could be more responsive to minor Tau perturbations or that other mechanisms might have contributed. These data imply that Tau can affect chromatin pathways and cause heterochromatin loss in intermediate AD stages, thus influencing transcriptional mechanisms. In this context, a few specific evidences show the involvement of nuclear Tau in mechanisms associated with gene expression, such as the interaction of Tau with: i) TRIM28, to preserve the genomic stability (Rousseaux et al., 2016); ii) KDM6B, to regulate the expression of glutamatergic genes (Wang et al., 2022); iii) histones, to confer genotoxic resistance (Rico et al., 2021). Furthermore, we previously reported a competitive relationship between Tau and HDAC1 in the nuclear compartment leading to the pathological alteration of synaptic genes expression (Siano et al., 2023). Here, we found that nuclear Tau participates in the modulation of chromatin architecture, suggesting that it might be involved in the early pathological signature in AD.
The early alterations of HP1α and H3K9me3 could affect chromatin structure, thus enhancing transcriptional deregulation with a positive feedback mechanism. It is noteworthy that our in vitro system is sensitive to the modulation of Tau leading to transcriptome alterations and chromatin reorganization in earlier steps of the disease, suggesting that Tau dysfunction might be hierarchically upstream via direct interaction with chromatin, chromatin remodelers, or transcription factors or indirectly via modification of cofactor function. Further analysis, such as ChIP-sequencing and Hi-C could identify genomic loci and mechanisms involved in this dysregulation. Here, we reported the meta-analysis comparing the proAD-mimic transcriptome with several ChIP-seq databases of chromatin markers in AD brains. Consistently, the up- and downregulated genes fall in open or closed chromatin regions, respectively. The changes in chromatin structure and the concomitant transcriptomic alteration might feed into a self-perpetuating mechanism, causing a progressive disruption of transcriptome homeostasis and neuronal functions, which drives neurodegeneration. Nevertheless, based on our findings related to protein homeostasis disruption, it remains possible that some of the transcriptional changes are influenced by translational pathways. In addition, it has been previously reported that different Tau isoforms are able to translocate in the nucleus with different efficiencies, providing further insights about the effect of nuclear Tau on transcriptional and chromatin remodeling alterations (Liu and Götz, 2013). Our data suggest that neuronal damage caused by pathological Tau occurs and must be prevented early by targeting cellular mechanisms associated with transcription regulation. Beside the value of developing an in vitro model to study Tau-dependent genome modulation, it would be interesting to investigate the impact and extent of Tau-driven pathology on other brain cell types such as astrocytes and microglia.
Data availability statement
The datasets presented in this study can be found in online repositories. The names of the repository/repositories and accession number(s) can be found at: https://www.ncbi.nlm.nih.gov/, GSE239956, https://www.ncbi.nlm.nih.gov/geo/query/acc.cgi?acc=GSE239956.
Ethics statement
The studies involving humans were approved by VU University Medical Center (Amsterdam, the Netherlands). The studies were conducted in accordance with the local legislation and institutional requirements. The human samples used in this study were acquired from gifted from another research group. Written informed consent for participation was not required from the participants or the participants’; legal guardians/next of kin in accordance with the national legislation and institutional requirements. Ethical approval was not required for the studies on animals in accordance with the local legislation and institutional requirements because only commercially available established cell lines were used.
Author contributions
GS: Conceptualization, Funding acquisition, Investigation, Methodology, Writing–original draft, Writing–review and editing, Formal Analysis. MV: Conceptualization, Formal Analysis, Investigation, Methodology, Writing–original draft, Writing–review and editing, Data curation, Software. MT: Formal Analysis, Investigation, Methodology, Writing–original draft. CW: Formal Analysis, Investigation, Methodology, Writing–original draft. AS: Writing–review and editing, Investigation. VI: Writing–review and editing, Investigation. MGr: Formal Analysis, Data curation, Writing–review and editing, Software. M-CG: Writing–review and editing. JH: Resources, Writing–review and editing. AlC: Conceptualization, Data curation, Formal Analysis, Methodology, Software, Writing–review and editing. AnC: Conceptualization, Funding acquisition, Supervision, Writing–original draft, Writing–review and editing. CD: Conceptualization, Funding acquisition, Supervision, Writing–original draft, Investigation, Methodology, Writing–review and editing, Formal Analysis.
Funding
The author(s) declare that financial support was received for the research, authorship, and/or publication of this article. This work was supported by: EU funding within the Next-Generation EU-MUR PNRR TUSCANY HEALTH Ecosystem (THE) (project no. ECS_00000017) spoke 8 to AC. and CDP.; the Roche postdoctoral fellowship program to CW and MT; Airalzh Airalzh-AGYR2023 to GS, PRIN2022 2022HRS4YB to CDP.
Acknowledgments
The authors are grateful to M. Calvello, V. Liverani and A. Viegi for technical support, the Next-Generation Sequencing facility and the Life Science Computing facility of the Leibniz Institute on Aging–Fritz Lipmann Institute-for RNA-seq and primary data analysis. We thank the Roche postdoctoral fellowship program for funding CW and MT.
Conflict of interest
The authors declare that the research was conducted in the absence of any commercial or financial relationships that could be construed as a potential conflict of interest.
The author(s) declared that they were an editorial board member of Frontiers, at the time of submission. This had no impact on the peer review process and the final decision.
Publisher’s note
All claims expressed in this article are solely those of the authors and do not necessarily represent those of their affiliated organizations, or those of the publisher, the editors and the reviewers. Any product that may be evaluated in this article, or claim that may be made by its manufacturer, is not guaranteed or endorsed by the publisher.
Supplementary material
The Supplementary Material for this article can be found online at: https://www.frontiersin.org/articles/10.3389/fcell.2024.1459573/full#supplementary-material
References
Alonso, A. D., Grundke-Iqbal, I., Barra, H. S., and Iqbal, K. (1997). Abnormal phosphorylation of tau and the mechanism of Alzheimer neurofibrillary degeneration: sequestration of microtubule-associated proteins 1 and 2 and the disassembly of microtubules by the abnormal tau. Proc. Natl. Acad. Sci. U. S. A. 94, 298–303. doi:10.1073/pnas.94.1.298
Amato, L. G., Vergani, A. A., Lassi, M., Fabbiani, C., Mazzeo, S., Burali, R., et al. (2024). Personalized modeling of Alzheimer’s disease progression estimates neurodegeneration severity from EEG recordings. Alzheimer’s Dement. 16, e12526. doi:10.1002/dad2.12526
Anders, S., and Huber, W. (2010). Differential expression analysis for sequence count data. Genome Biol. 11, R106. doi:10.1186/gb-2010-11-10-r106
Bell, M., and Zempel, H. (2022). SH-SY5Y-derived neurons: a human neuronal model system for investigating TAU sorting and neuronal subtype-specific TAU vulnerability. Rev. Neurosci. 33, 1–15. doi:10.1515/revneuro-2020-0152
Benhelli-Mokrani, H., Mansuroglu, Z., Chauderlier, A., Albaud, B., Gentien, D., Sommer, S., et al. (2018). Genome-wide identification of genic and intergenic neuronal DNA regions bound by Tau protein under physiological and stress conditions. Nucleic Acids Res. 1, 11405–11422. doi:10.1093/nar/gky929
Bentley, D. R., Balasubramanian, S., Swerdlow, H. P., Smith, G. P., Milton, J., Brown, C. G., et al. (2008). Accurate whole human genome sequencing using reversible terminator chemistry. Nature 456, 53–59. doi:10.1038/nature07517
Blighe, K., Rana, S., and Lewis, M. (2018). EnhancedVolcano: publication-ready volcano plots with enhanced colouring and labeling. Available at: https://github.com/kevinblighe/EnhancedVolcano.
Carlson, M. (2019). GO.db: a set of annotation maps describing the entire Gene Ontology. doi:10.18129/B9.bioc.GO.db
Chauderlier, A., Gilles, M., Spolcova, A., Caillierez, R., Chwastyniak, M., Kress, M., et al. (2018). Tau/DDX6 interaction increases microRNA activity. Biochim. Biophys. acta. Gene Regul. Mech. 1861, 762–772. doi:10.1016/j.bbagrm.2018.06.006
Clemens, M. J. (2001). Initiation factor eIF2 alpha phosphorylation in stress responses and apoptosis. Prog. Mol. Subcell. Biol. 27, 57–89. doi:10.1007/978-3-662-09889-9_3
Colnaghi, L., Rondelli, D., Muzi-Falconi, M., and Sertic, S. (2020). Tau and dna damage in neurodegeneration. Brain Sci. 10, 946. doi:10.3390/brainsci10120946
Davis, S., and Meltzer, P. S. (2007). GEOquery: a bridge between the gene expression omnibus (GEO) and BioConductor. Bioinformatics 23, 1846–1847. doi:10.1093/bioinformatics/btm254
Dileep, V., Boix, C. A., Mathys, H., Marco, A., Welch, G. M., Meharena, H. S., et al. (2023). Neuronal DNA double-strand breaks lead to genome structural variations and 3D genome disruption in neurodegeneration. Cell 186, 4404–4421.e20. doi:10.1016/j.cell.2023.08.038
Dolgalev, I. (2022). Msigdbr: MSigDB gene sets for multiple organisms in a tidy data format. Available at: https://igordot.github.io/msigdbr/.
Durinck, S., Spellman, P. T., Birney, E., and Huber, W. (2009). Mapping identifiers for the integration of genomic datasets with the R/Bioconductor package biomaRt. Nat. Protoc. 4, 1184–1191. doi:10.1038/nprot.2009.97
Eddelbuettel, D., and François, R. (2011). Rcpp: seamless R and C++ integration. J. Stat. Softw. 40. doi:10.18637/jss.v040.i08
Eissenberg, J. C., and Elgin, S. C. R. (2014). HP1a: a structural chromosomal protein regulating transcription. Trends Genet. 30, 103–110. doi:10.1016/j.tig.2014.01.002
El Hajjar, J., Chatoo, W., Hanna, R., Nkanza, P., Tétreault, N., Tse, Y. C., et al. (2019). Heterochromatic genome instability and neurodegeneration sharing similarities with Alzheimer’s disease in old Bmi1+/− mice. Sci. Rep. 9, 594. doi:10.1038/s41598-018-37444-3
Elrod, N. D., Jaworski, E. A., Ji, P., Wagner, E. J., and Routh, A. (2019). Development of Poly(A)-ClickSeq as a tool enabling simultaneous genome-wide poly(A)-site identification and differential expression analysis. Methods 155, 20–29. doi:10.1016/j.ymeth.2019.01.002
Frost, B., Hemberg, M., Lewis, J., and Feany, M. B. (2014). Tau promotes neurodegeneration through global chromatin relaxation. Nat. Neurosci. 17, 357–366. doi:10.1038/nn.3639
Gazestani, V., Kamath, T., Nadaf, N. M., Dougalis, A., Burris, S. J., Rooney, B., et al. (2023). Early Alzheimer’s disease pathology in human cortex involves transient cell states. Cell 186, 4438–4453.e23. doi:10.1016/j.cell.2023.08.005
Gerakis, Y., and Hetz, C. (2018). Emerging roles of ER stress in the etiology and pathogenesis of Alzheimer’s disease. FEBS J. 285, 995–1011. doi:10.1111/febs.14332
Gu, Z., Eils, R., and Schlesner, M. (2016). Complex heatmaps reveal patterns and correlations in multidimensional genomic data. Bioinformatics 32, 2847–2849. doi:10.1093/bioinformatics/btw313
Guo, C., Jeong, H. H., Hsieh, Y. C., Klein, H. U., Bennett, D. A., De Jager, P. L., et al. (2018). Tau activates transposable elements in Alzheimer’s disease. Cell Rep. 23, 2874–2880. doi:10.1016/j.celrep.2018.05.004
Guo, T., Noble, W., and Hanger, D. P. (2017). Roles of tau protein in health and disease. Acta Neuropathol. 133, 665–704. doi:10.1007/s00401-017-1707-9
Han, P., Serrano, G., Beach, T. G., Caselli, R. J., Yin, J., Zhuang, N., et al. (2017). A quantitative analysis of brain soluble tau and the tau secretion factor. J. Neuropathol. Exp. Neurol. 76, 44–51. doi:10.1093/jnen/nlw105
Hardcastle, T. J., and Kelly, K. A. (2010). baySeq: empirical Bayesian methods for identifying differential expression in sequence count data. BMC Bioinforma. 11, 422. doi:10.1186/1471-2105-11-422
Hernández-Ortega, K., Garcia-Esparcia, P., Gil, L., Lucas, J. J., and Ferrer, I. (2016). Altered machinery of protein synthesis in Alzheimer’s: from the nucleolus to the ribosome. Brain Pathol. 26, 593–605. doi:10.1111/bpa.12335
Kim, D., Pertea, G., Trapnell, C., Pimentel, H., Kelley, R., and Salzberg, S. L. (2013). TopHat2: accurate alignment of transcriptomes in the presence of insertions, deletions and gene fusions. Genome Biol. 14, R36. doi:10.1186/gb-2013-14-4-r36
Klein, H.-U., McCabe, C., Gjoneska, E., Sullivan, S. E., Kaskow, B. J., Tang, A., et al. (2019). Epigenome-wide study uncovers large-scale changes in histone acetylation driven by tau pathology in aging and Alzheimer’s human brains. Nat. Neurosci. 22, 37–46. doi:10.1038/s41593-018-0291-1
Korotkevich, G., Sukhov, V., and Sergushichev, A. (2023). Fgsea: fast gene set enrichment analysis. Available at: https://bioconductor.org/packages/fgsea.
Kurbatskaya, K., Phillips, E. C., Croft, C. L., Dentoni, G., Hughes, M. M., Wade, M. A., et al. (2016). Upregulation of calpain activity precedes tau phosphorylation and loss of synaptic proteins in Alzheimer’s disease brain. Acta Neuropathol. Commun. 4, 34. doi:10.1186/s40478-016-0299-2
Lagger, G., O’Carroll, D., Rembold, M., Khier, H., Tischler, J., Weitzer, G., et al. (2002). Essential function of histone deacetylase 1 in proliferation control and CDK inhibitor repression. EMBO J. 21, 2672–2681. doi:10.1093/emboj/21.11.2672
Langmead, B., Trapnell, C., Pop, M., and Salzberg, S. L. (2009). Ultrafast and memory-efficient alignment of short DNA sequences to the human genome. Genome Biol. 10, R25. doi:10.1186/gb-2009-10-3-r25
Liao, Y., Wang, J., Jaehnig, E. J., Shi, Z., and Zhang, B. (2019). WebGestalt 2019: gene set analysis toolkit with revamped UIs and APIs. Nucleic Acids Res. 47, W199–W205. doi:10.1093/nar/gkz401
Liu, C., and Götz, J. (2013). Profiling murine tau with 0N, 1N and 2N isoform-specific antibodies in brain and peripheral organs reveals distinct subcellular localization, with the 1N isoform being enriched in the nucleus. PLoS One 8, e84849. doi:10.1371/journal.pone.0084849
Lowe, V. J., Wiste, H. J., Senjem, M. L., Weigand, S. D., Therneau, T. M., Boeve, B. F., et al. (2018). Widespread brain tau and its association with ageing, Braak stage and Alzheimer’s dementia. Brain 141, 271–287. doi:10.1093/brain/awx320
Ma, J., Ma, C., Li, J., Sun, Y., Ye, F., Liu, K., et al. (2020). Extracellular matrix proteins involved in Alzheimer’s disease. Chem. – A Eur. J. 26, 12101–12110. doi:10.1002/chem.202000782
Maina, M. B., Bailey, L. J., Wagih, S., Biasetti, L., Pollack, S. J., Quinn, J. P., et al. (2018). The involvement of tau in nucleolar transcription and the stress response. Acta Neuropathol. Commun. 6, 70. doi:10.1186/s40478-018-0565-6
Mansuroglu, Z., Benhelli-Mokrani, H., Marcato, V., Sultan, A., Violet, M., Chauderlier, A., et al. (2016). Loss of Tau protein affects the structure, transcription and repair of neuronal pericentromeric heterochromatin. Sci. Rep. 6, 33047. doi:10.1038/srep33047
Marzi, S. J., Leung, S. K., Ribarska, T., Hannon, E., Smith, A. R., Pishva, E., et al. (2018). A histone acetylome-wide association study of Alzheimer’s disease identifies disease-associated H3K27ac differences in the entorhinal cortex. Nat. Neurosci. 21, 1618–1627. doi:10.1038/s41593-018-0253-7
Montalbano, M., Jaworski, E., Garcia, S., Ellsworth, A., McAllen, S., Routh, A., et al. (2021). Tau modulates mRNA transcription, alternative polyadenylation profiles of hnRNPs, chromatin remodeling and spliceosome complexes. Front. Mol. Neurosci. 14, 742790. doi:10.3389/fnmol.2021.742790
Mortazavi, A., Williams, B. A., McCue, K., Schaeffer, L., and Wold, B. (2008). Mapping and quantifying mammalian transcriptomes by RNA-Seq. Nat. Methods 5, 621–628. doi:10.1038/nmeth.1226
Napoletano, F., Ferrari Bravo, G., Voto, I. A. P., Santin, A., Celora, L., Campaner, E., et al. (2021). The prolyl-isomerase PIN1 is essential for nuclear Lamin-B structure and function and protects heterochromatin under mechanical stress. Cell Rep. 36, 109694. doi:10.1016/j.celrep.2021.109694
Nativio, R., Lan, Y., Donahue, G., Sidoli, S., Berson, A., Srinivasan, A. R., et al. (2020). An integrated multi-omics approach identifies epigenetic alterations associated with Alzheimer’s disease. Nat. Genet. 52, 1024–1035. doi:10.1038/s41588-020-0696-0
Neddens, J., Temmel, M., Flunkert, S., Kerschbaumer, B., Hoeller, C., Loeffler, T., et al. (2018). Phosphorylation of different tau sites during progression of Alzheimer’s disease. Acta Neuropathol. Commun. 6, 52. doi:10.1186/s40478-018-0557-6
Patel, P. J., Ren, Y., and Yan, Z. (2023). Epigenomic analysis of Alzheimer’s disease brains reveals diminished CTCF binding on genes involved in synaptic organization. Neurobiol. Dis. 184, 106192. doi:10.1016/j.nbd.2023.106192
Radford, H., Moreno, J. A., Verity, N., Halliday, M., and Mallucci, G. R. (2015). PERK inhibition prevents tau-mediated neurodegeneration in a mouse model of frontotemporal dementia. Acta Neuropathol. 130, 633–642. doi:10.1007/s00401-015-1487-z
Rico, T., Gilles, M., Chauderlier, A., Comptdaer, T., Magnez, R., Chwastyniak, M., et al. (2021). Tau stabilizes chromatin compaction. Front. Cell Dev. Biol. 9, 740550. doi:10.3389/fcell.2021.740550
Ritchie, M. E., Phipson, B., Wu, D., Hu, Y., Law, C. W., Shi, W., et al. (2015). Limma powers differential expression analyses for RNA-sequencing and microarray studies. Nucleic Acids Res. 43, e47. doi:10.1093/nar/gkv007
Robinson, M. D., McCarthy, D. J., and Smyth, G. K. (2010). edgeR: a Bioconductor package for differential expression analysis of digital gene expression data. Bioinformatics 26, 139–140. doi:10.1093/bioinformatics/btp616
Rossi, G., Dalprà, L., Crosti, F., Lissoni, S., Sciacca, F. L., Catania, M., et al. (2008). A new function of microtubule-associated protein tau: involvement in chromosome stability. Cell Cycle 7, 1788–1794. doi:10.4161/cc.7.12.6012
Rousseaux, M. W. C., de Haro, M., Lasagna-Reeves, C. A., de Maio, A., Park, J., Jafar-Nejad, P., et al. (2016). TRIM28 regulates the nuclear accumulation and toxicity of both alpha-synuclein and tau. Elife 5, e19809. doi:10.7554/eLife.19809
Shacham, T., Patel, C., and Lederkremer, G. Z. (2021). Perk pathway and neurodegenerative disease: to inhibit or to activate? Biomolecules 11, 354. doi:10.3390/biom11030354
Siano, G., Caiazza, M. C., Varisco, M., Calvello, M., Quercioli, V., Cattaneo, A., et al. (2019a). Modulation of tau subcellular localization as a tool to investigate the expression of disease-related genes. J. Vis. Exp. 2019. doi:10.3791/59988
Siano, G., Falcicchia, C., Origlia, N., Cattaneo, A., and Di Primio, C. (2021). Non-canonical roles of tau and their contribution to synaptic dysfunction. Int. J. Mol. Sci. 22, 10145. doi:10.3390/ijms221810145
Siano, G., Madaro, G., Caiazza, M. C., Allouch, A., Varisco, M., Mignanelli, M., et al. (2023). Tau-dependent HDAC1 nuclear reduction is associated with altered VGluT1 expression. Front. Cell Dev. Biol. 11, 1151223. doi:10.3389/fcell.2023.1151223
Siano, G., Micaelli, M., Scarlatti, A., Quercioli, V., Di Primio, C., and Cattaneo, A. (2020a). The Q336H MAPT mutation linked to pick’s disease leads to increased binding of tau to the microtubule network via altered conformational and phosphorylation effects. Front. Mol. Neurosci. 13, 569395. doi:10.3389/fnmol.2020.569395
Siano, G., Varisco, M., Caiazza, M. C., Quercioli, V., Mainardi, M., Ippolito, C., et al. (2019b). Tau modulates VGluT1 expression. J. Mol. Biol. 431, 873–884. doi:10.1016/j.jmb.2019.01.023
Siano, G., Varisco, M., Scarlatti, A., Caiazza, M. C., Dunville, K., Cremisi, F., et al. (2020b). Gene expression of disease-related genes in Alzheimer’s disease is impaired by tau aggregation. J. Mol. Biol. 432, 166675. doi:10.1016/j.jmb.2020.10.009
Sjöberg, M. K., Shestakova, E., Mansuroglu, Z., Maccioni, R. B., and Bonnefoy, E. (2006). Tau protein binds to pericentromeric DNA: a putative role for nuclear tau in nucleolar organization. J. Cell Sci. 119, 2025–2034. doi:10.1242/jcs.02907
Sotiropoulos, I., Galas, M.-C., Silva, J. M., Skoulakis, E., Wegmann, S., Maina, M. B., et al. (2017). Atypical, non-standard functions of the microtubule associated Tau protein. Acta Neuropathol. Commun. 5, 91. doi:10.1186/s40478-017-0489-6
Sun, W., Samimi, H., Gamez, M., Zare, H., and Frost, B. (2018). Pathogenic tau-induced piRNA depletion promotes neuronal death through transposable element dysregulation in neurodegenerative tauopathies. Nat. Neurosci. 21, 1038–1048. doi:10.1038/s41593-018-0194-1
Tenebaum, D., and Maintainer, B. (2023). KEGGREST: client-side REST access to the kyoto encyclopedia of genes and genomes (KEGG). doi:10.18129/B9.bioc.KEGGREST
Violet, M., Delattre, L., Tardivel, M., Sultan, A., Chauderlier, A., Caillierez, R., et al. (2014). A major role for Tau in neuronal DNA and RNA protection in vivo under physiological and hyperthermic conditions. Front. Cell. Neurosci. 8, 84–11. doi:10.3389/fncel.2014.00084
Wang, M., Roussos, P., McKenzie, A., Zhou, X., Kajiwara, Y., Brennand, K. J., et al. (2016). Integrative network analysis of nineteen brain regions identifies molecular signatures and networks underlying selective regional vulnerability to Alzheimer’s disease. Genome Med. 8, 104. doi:10.1186/s13073-016-0355-3
Wang, R., and Reddy, P. H. (2017). Role of glutamate and NMDA receptors in Alzheimer’s disease. J. Alzheimer’s Dis. 57, 1041–1048. doi:10.3233/JAD-160763
Wang, Y., Khandelwal, N., Liu, S., Zhou, M., Bao, L., Wang, J. E., et al. (2022). KDM6B cooperates with Tau and regulates synaptic plasticity and cognition via inducing VGLUT1/2. Mol. Psychiatry 27, 5213–5226. doi:10.1038/s41380-022-01750-0
Wang, Y., and Mandelkow, E. (2016). Tau in physiology and pathology. Nat. Rev. Neurosci. 17, 5–21. doi:10.1038/nrn.2015.1
Xiong, X., James, B. T., Boix, C. A., Park, Y. P., Galani, K., Victor, M. B., et al. (2023). Epigenomic dissection of Alzheimer’s disease pinpoints causal variants and reveals epigenome erosion. Cell 186, 4422–4437.e21. doi:10.1016/j.cell.2023.08.040
Keywords: tau, Alzheimer’s disease, gene expression, chromatin remodeling, epigenetic markers, AD cellular model
Citation: Siano G, Varisco M, Terrigno M, Wang C, Scarlatti A, Iannone V, Groth M, Galas M-C, Hoozemans JJM, Cellerino A, Cattaneo A and Di Primio C (2025) Tau mediates the reshaping of the transcriptional landscape toward intermediate Alzheimer’s disease stages. Front. Cell Dev. Biol. 12:1459573. doi: 10.3389/fcell.2024.1459573
Received: 04 July 2024; Accepted: 01 November 2024;
Published: 03 January 2025.
Edited by:
Efthimios M. C. Skoulakis, Alexander Fleming Biomedical Sciences Research Center, GreeceReviewed by:
Angela M. Mabb, Georgia State University, United StatesMauro Montalbano, University of Texas Medical Branch at Galveston, United States
Copyright © 2025 Siano, Varisco, Terrigno, Wang, Scarlatti, Iannone, Groth, Galas, Hoozemans, Cellerino, Cattaneo and Di Primio. This is an open-access article distributed under the terms of the Creative Commons Attribution License (CC BY). The use, distribution or reproduction in other forums is permitted, provided the original author(s) and the copyright owner(s) are credited and that the original publication in this journal is cited, in accordance with accepted academic practice. No use, distribution or reproduction is permitted which does not comply with these terms.
*Correspondence: Antonino Cattaneo, YW50b25pbm8uY2F0dGFuZW9Ac25zLml0; Cristina Di Primio, Y3Jpc3RpbmEuZGlwcmltaW9AY25yLml0; Giacomo Siano, Z2lhY29tby5zaWFub0BzbnMuaXQ=
†These authors have contributed equally to this work and share first authorship
‡Present address: Martina Varisco, European Molecular Biology Laboratory EMBL, Genome Biology Unit, Heidelberg, Germany