 Bo-Ra Kim
 Min-Seok Rha
 Hyung-Ju Cho
 Joo-Heon Yoon
 Chang-Hoon Kim
- 1The Airway Mucus Institute, Yonsei University College of Medicine Seoul, Seoul, Republic of Korea
- 2Department of Otorhinolaryngology, Yonsei University College of Medicine, Seoul, Republic of Korea
- 3Korea Mouse Sensory Phenotyping Center, Yonsei University College of Medicine, Seoul, Republic of Korea
- 4Human Microbiome Center, Yonsei University College of Medicine, Seoul, Republic of Korea
Introduction: Olfaction is important for the quality of life; however, in Kallmann syndrome (KS), defective development results in olfactory dysfunction. Notably, the mechanism underlying olfactory development, especially in the olfactory epithelium (OE), which detects olfactory signals, remains unclear. Mutations in PROK2, which encodes prokineticin-2, have been identified in approximately 9% of the KS patients with olfactory defects.
Methods: We examined olfactory function and analyzed the causes of olfactory dysfunction based on spatiotemporal development and gene expression changes in Prok2 knockout (KO) model mice with KS.
Results: The ability of the OE to detect olfactory signals was diminished in adult Prok2 KO mice. Maturation of olfactory sensory neurons (OSNs) in the OE and formation of glomeruli in the olfactory bulb (OB) in adult Prok2 KO mice were disrupted, thus causing olfactory dysfunction. Furthermore, molecular analysis of Prok2 KO mice during embryonic development revealed abnormal development of OB layers and diminished differentiation to mature OSNs in the OE at the later stage, which caused defects in the entire olfactory system. Remarkably, downstream signaling genes of Prok2, including intermediate filament genes and genes expressed in the putative OB, were found to mediate olfactory system organization.
Discussion: Overall, these findings reveal the role of Prok2 in olfactory system organization and elucidate how olfactory development defects translate to olfactory function.
1 Introduction
Mammals depend on their sense of smell to obtain essential nutrients, recognize danger, recall memories, and derive pleasure (Ghibaudo et al., 2024; Herz and Engen, 1996; Kadohisa, 2013; Lee et al., 2024; Parvin et al., 2024; Santos et al., 2004). Therefore, olfactory dysfunction is detrimental to health and survival as it can result in nutritional deficiencies, consumption of spoiled food, exposure to hazardous chemicals or fire, and inability to maintain positive emotions, which can lead to depression, anxiety, and social isolation.
Olfactory dysfunction may be a result of brain disorders, including brain tumors or traumatic brain injury (Li et al., 2023; Proskynitopoulos et al., 2016), structural abnormalities in the nasal cavity caused by inflammation (Gudis and Soler, 2016), neuronal degeneration caused by pathogenic infection or neurodegenerative diseases (Murphy, 2019; Tsukahara et al., 2023), and abnormal development in olfactory system due to genetic variations (Dodé and Rondard, 2013; Topan et al., 2021). In particular, developmental diseases caused by abnormal development lead to congenital olfactory disorders. Therefore, the genes that contribute to the organization of the olfactory system can be identified by studying the developmental disorders with olfactory dysfunction.
Kallmann syndrome (KS) is a developmental disease with hypogonadotropic hypogonadism and congenital olfactory dysfunction (Dodé and Rondard, 2013; Forni and Wray, 2015; Rugarli, 1999). KS mainly occurs as a result of the failure of gonadotropin-releasing hormone (GnRH) neurons to reach the brain in the early developmental stage, resulting in impaired formation of the reproductive axis and construction of olfactory bulb (OB) (Barraud et al., 2013; Schwanzel-Fukuda et al., 1994; Taroc et al., 2020a; b; Taroc et al., 2017; Watanabe et al., 2009). In addition, the mutation of anosomin-1 (Kal-1), Prok2, Prokr2, Fgf8, Fgfr1, Gli3, Isl1, Sox10, Fezf1, and Sema3a leads to complications in the migration of GnRH neurons, and most of these genes regulate the formation of the nasal forebrain junction (NFJ) (Dodé and Rondard, 2013; Taroc et al., 2020a; b; Watanabe et al., 2009). Among the mutant genes, Prok2 knockout (KO) exhibits the core features of KS, including OB hypoplasia, defective GnRH migration, and reproductive defects, with high similarity to patients with KS and higher survival rate than that of other KS mutant mouse models. Therefore, Prok2 KO can be considered a representative mouse model of KS.
Prokineticin 2 (Prok2) is a secretory protein that interacts with prokineticin receptor 2 (Prokr2) (Dodé and Rondard, 2013). Moreover, Prok2/Prokr2 signaling influences GnRH migration from the vomeronasal organ (VNO) to the OB and the migration of neuronal stem cells from the subventricular zone to the OB (Ng et al., 2005; Pitteloud et al., 2007; Wen et al., 2019). However, the defects present in the olfactory epithelium (OE), which detects olfactory stimuli, and the molecule that modulates the formation of the olfactory system during olfactory development remain unexplored. Therefore, to elucidate the causal mechanism of olfactory disorders, we studied the changes in the olfactory structure during embryonic development and identified the genes regulated by Prok2 using Prok2 KO mice as a KS disease model.
2 Materials and methods
2.1 Mice
The Prok2 KO mice used in this study were purchased from UC Davis (Davis, CA, United States). Homozygous KO mice were distinguished from littermate wild-type (WT) mice via genotyping with the sequences WT-F, WT-R, KO-F, and KO-R described in Supplementary Table S1. Most homozygous KO mice are mostly produced via in vitro fertilization involving the sperms and eggs of hemizygote KO mice because they cannot be obtained easily by natural mating. E11.5, 13.5, 14.5, or 18.5 embryos were acquired on day 11, 13, 14, or 18, respectively, after detecting the plug in female mice. Mice have been handled and maintained in strict accordance with the guidelines for the Care and Use of Laboratory Animals of Yonsei University College of Medicine. The research was performed under the Yonsei Medical Center Animal Research Guidelines (IACUC No. 2023-0184), which adhere to the standards articulated in the Association for Assessment and Accreditation of Laboratory Animal Care International (AAALAC) guidelines.
2.2 Manganese-enhanced magnetic resonance imaging (MEMRI)
MEMRI was performed on mice aged 16 weeks based on a previous study (Pautler and Koretsky, 2002). After the mice were initially anesthetized with 3% isoflurane, 20 μL of 10 mM MgCl2 was administered nasally. The anesthetized mice were maintained on 1.5%–2% isoflurane and imaged at 20 min after treatment with MgCl2 using a 9.4T Advanced imaging spectrometer (Bruker, Billerica, MA, United States) with a 4 cm microimaging gradient insert. The imaging parameters were as follows: TR = 2000.0 ms, TE = 22.0 ms, FOV = 1.28 × 1.28 × 0.64 cm, and matrix dimensions 128 × 128 × 64. The nominal resolution of each plane was 130 μm.
2.3 Olfactory behavior test
Olfactory behavior test was performed in this study based on the avoidance test described in previous papers (Cho et al., 2018; Kobayakawa et al., 2007). Mice were tracked and the time spent by each mouse in each zone were automatically measured by a smart video tracking system (Smart 3.0; SHarvard Apparatus©, Holliston, MA, United States). All procedures were conducted between 8 a.m. and 12 p.m., which was close to the dark cycle of the mice. Trimethylthiazoline (TMT, purchased from BioSRQ) diluted in water was used as the odorant. In the habituation step, mice were placed in the test cage for 10 min and transferred back to the home cage (i.e., the cage in which the mouse resides) for 5 min before the test. The test cage was divided into equal halves using a curtain. To perform the test, mice were laid in the zone containing 20 μL of 10% TMT or water in the test cage for 3 min. The avoidance time plotted in the graph was calculated by subtracting each time spent avoiding TMT from the sum of the time spent avoiding water. The red bar in the graph (Figure 1B) indicates the avoidance time in relation to water. The experimental results are presented as mean ± SD. Statistical analysis was performed using a t-test in GraphPad Prism 5.
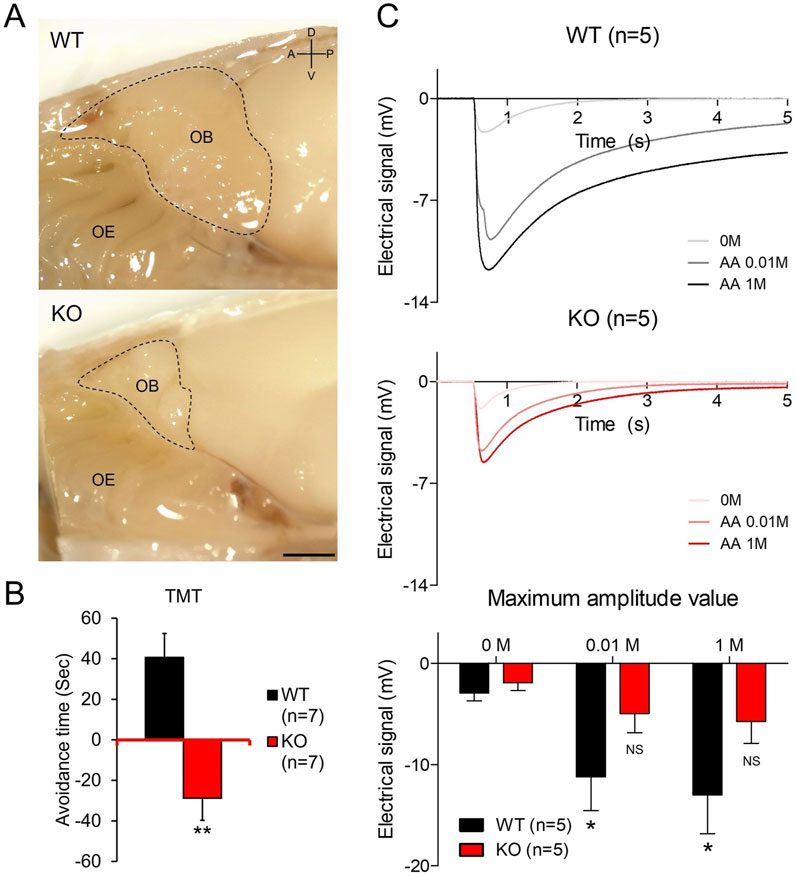
Figure 1. Olfactory bulb hypoplasia and olfactory dysfunction in Prok2 KO (A) A sagittal view of the olfactory bulb (OB) structure in WT and Prok2 KO mice. Each dashed line represents the OB size. D, dorsal; V, ventral; A, anterior; P, posterior. Scale bar, 1 cm. (B) Graph of the avoidance test. Differences in avoidance time were considered significant at p = 0.0010 in WT (n = 7) and Prok2 KO mice (n = 7). Data are presented as mean ± SD. (C) Graphs of time-dependent electrical signals in WT (n = 5) and Prok2 KO mice (n = 5) and the graph of dose-dependent electrical signals in WT (n = 5) and Prok2 KO mice (n = 5). In WT mice, the difference between the electrical signals at 0 M and at 0.01 M was significant at p = 0.0417, and that between electrical signals at 0 M and at 1 M was significant at p = 0.0327. In Prok2 KO mice, the difference between the electrical signals at 0 M and at 0.01 M was significant at p = 0.3505, and that between the electrical signals at 0 M and at 1 M was significant at p = 0.1301. Data are presented as mean ± SD. In all panels, n indicates biologically independent repeats. P values were determined using two-tailed unpaired Student’s t-test to compare two groups; *, p < 0.05; **, p < 0.01; ns, non-significant.
2.4 Electro-olfactogram (EOG)
EOG was obtained as described before (Cygnar et al., 2010). Olfactory tissue samples were prepared from the hemi-sectioned head of mice, and the OE in these samples were visualized in the sagittal view immediately after the mice were decapitated. Tissues were maintained in ex vivo conditions using humid and warm air in order to detect the electrical signal analogous to the live status. Next, 0.01 M and 1 M amyl acetate (Sigma, #W504009) were used as the odorant. A 5–10-μm pore size pipette was hardened using 0.05% agarose and filled with Ringer’s solution (135 mM NaCl, 5 mM KCl, 1 mM CaCl2, 1.5 mM MgCl2, and 10 mM HEPES, pH 7.4, sterilized via filtration). The point of the quarter region in the secondary turbinate of the OE was measured. The pipette was placed at the measured region after confirming that the voltage changed when the tissue came in contact with the pipette. Then, the voltage was recorded continuously. After 0.95 s, the OE were exposed to the stimuli vehicle, 0.01 M amyl acetate, or 1 M amyl acetate in that order. Recording was continued up to 10 s. The graphs were plotted, and statistical analysis was performed using GraphPad Prism 5. The maximum amplitude value in the graph (Figure 1C) was presented as the maximum of the continuous values and as mean ± SD.
2.5 Immunostaining
Slides were prepared by paraffin sectioning or cryosectioning. In the case of paraffin-sectioned slides, the following procedure was performed before blotting them with antibodies: deparaffinization, antigen retrieval with the solution (#IW-1100; IHC World, Ellicott City, MD, United States) in a steaming bowl (IW-1102; IHC World) for 40 min, incubation with hydrogen peroxide (#3059; Duksan, Korea) for 10 min to quench endogenous peroxidase, and washing with tris-buffered saline (TBS) thrice for 5 min each. In the case of cryosectioned slides, antigen retrieval for 10 min and washing with TBS was performed sequentially. After blocking with 5% bovine serum albumin for 1 h, slides were blotted with primary antibodies for 1 h at room temperature or overnight at 4°C. The primary antibodies used are described in Supplementary Table S2. The slides were washed and then blotted with fluorescent secondary antibodies (Thermo Fisher Scientific, Waltham, MA, United States) for 30 min at room temperature. The slides were washed again and mounted with the medium containing DAPI (#F6057; Sigma-Aldrich, St. Louis, MO, United States).
All experiments were conducted using at least three biological replicates from independent experiments.
2.6 Transmission electron microscopy (TEM)
Olfactory tissues were fixed with Karnovsky’s fixative (2% glutaraldehyde and 2% paraformaldehyde (PFA) in 0.1 M phosphate buffer, pH 7.4) for 1 day. Decalcification was performed using 10% EDTA for 2 weeks. After washing with 0.1 M phosphate buffer, tissues were fixed with 1% OsO4 in 0.1 M phosphate buffer for 2 h, dehydrated, and infiltrated with propylene oxide for 10 min. For making blocks, tissues were embedded with a Poly/Bed 812 kit (Polysciences, Warrington, PA, United States) and polymerized in an electron microscope oven (TD-700; DOSAKA, Japan) at 65°C for 12 h. Blocks were cut into 80 nm pieces and placed on copper grids. Then, the sections were doubly stained with 3% uranyl acetate for 30 min and 3% lead citrate for 7 min. Sections were observed using a microscope (JEM-1011; JEOL, Tokyo, Japan) equipped with a Megaview III CCD camera (Soft Imaging System, Germany) at an acceleration voltage of 80 kV. The graphs were drawn, and statistical analysis was performed using a t-test with GraphPad Prism 5.
2.7 In situ hybridization (ISH)
To create probes, the sequences of each target were amplified by PCR using IP pro-Taq (#CMT2022; LaboPass) and the forward and reverse primers with the T7R sequence. The primers used in this study are listed in Supplementary Table S1. Each tube containing a mixture of the PCR product, 20 U ribonuclease inhibitors (N2111; Promega, WI, United States), 1× DIG RNA labeling mix (#11 277 073 910; Roche, Switzerland), 1× T7 RAN polymerase buffer, 5 mM DTT, and 50 U T7 RNA polymerase (#2540A; Takara Bio Inc., Japan) was incubated for 3 h at 37°C. After freezing with 70% ethanol diluted with RNase-free water and 10 M LiCl for 2 h at −80°C or overnight at −20°C, the tube was centrifuged at 12,000 rpm for 10 min, the supernatant was removed, and the precipitate was dried. After elution with RNase-free water, the tube was treated with DNase I (#04 716 728 001; Roche) for 30 min at 37°C to remove residual DNA. After freezing, centrifuging, and drying, the precipitate was eluted in ISH solution (5× SSC, 50% deionized formamide, 50 μg/mL heparin, 50 μg/mL yeast t-RNA, 1 mM EDTA, 0.1% CHAPS, 2% casein sodium salt, and 20% Tween 20 diluted in DEPC; pH 7.5) at a concentration of 1 μg/mL. Probes were stored at −80°C or −20°C.
Slides for ISH were prepared only by cryosectioning. Before staining, slides were dried for 1 day to prevent the detachment of tissues from the slides. After washing the slides thrice with PBT (0.1% Tween 20, 1× PBS diluted in sterile distilled water) for 5 min each time, they were bleached with H2O2 solution (#S2023; Dako) for 5 min. The slides were washed and then incubated with 10 μg/mL proteinase K solution (#PF-1048-050-02; Biosesang, Korea) for 1–5 min according to the age of the tissue. These slides were washed again and fixed with 4% PFA for 10 min. Subsequently, they were washed once more and blotted with each pre-warmed probe in ISH solution for 1 day at 68°C. Next day, to stabilize the probes blotted, slides were incubated thrice with pre-warmed high-concentration SSC solution (50% ionized formamide, 6× SSC, and 1% SDS diluted in sterile distilled water) for 15 min at 68°C. Then, they were incubated thrice with pre-warmed low-concentration SSC solution (50% ionized formamide and 2.4× SSC diluted in sterile distilled water) for 15 min at 68°C. After washing the slides with TBST for 5 min at room temperature thrice, they were blocked with 5% inactivated FBS blocking solution for 1 day and then blotted with α-DIG antibody (#11 093 274 910; Roche) overnight at 4°C. Next day, after washing the slides thrice with TBST for 30 min each time, they were incubated thrice with NTMT solution for 10 min. Then, the slides were incubated with the mixture of 250 μg/mL NBT (#11 585 029 001; Roche) and 130 μg/mL BCIP (#11 383 221 001; Roche) for 1–2 days depending on their color. They were then incubated with 1 mM EDTA-diluted PBT for 30 min to stop the colorization reaction and mounted.
All experiments were conducted using at least four biological replicates from independent experiments in both coronal and sagittal directions.
2.8 RNA sequencing
After sampling the heads of WT (n = 3) and Prok2 KO (n = 3) mice at E14.5 with the nasal cavity and brain, including the OB, the samples were divided into each anterior or posterior region by cutting them vertically (in the coronal plane) at the initial level of the putative OB, which was defined based on its first appearance in the rostral-to-caudal series of sections. After tissues were homogenized in TRIzol reagent (#1559618, Invitrogen, Waltham, MA, United States), RNA was extracted via TRIzol and on-column DNase I treatment. cDNA library was prepared using TruSeq Stranded mRNA (Illumina, San Diego, United States) and sequenced using Illumina NovaSeq. Statistics were analyzed based on the fold change (fc), exactTest using edgeR, and hierarchical clustering. P-value was adjusted using Benjamini–Hochberg correction (bh.pval).
3 Results
3.1 Prok2 KO mice with OB hypoplasia and olfactory dysfunction were suitable as a mouse model of KS with olfactory disorders
Similar to the hypoplastic OB found in patients with KS (Bortolotto Felippe Trentin et al., 2023; Sarfati et al., 2010; Wakabayashi et al., 2021), the OB of Prok2 KO mice was smaller than that of WT mice when viewed in the medially dissected head (dashed line in Figure 1A). This OB hypoplasia of Prok2 KO mice was also shown in the axonal direction (Supplementary Figure S1). Although olfactory dysfunction in patients with KS has been studied (Bortolotto Felippe Trentin et al., 2023; Wakabayashi et al., 2021), the olfactory function of Prok2 KO mice has not been investigated yet. To determine the ability of Prok2 KO mice to detect and recognize olfactory signals, olfactory behavior test was conducted on these mice. We observed that the avoidance time against TMT in KO mice was lower than the avoidance time against water in KO mice (Figure 1B). The avoidance time against TMT in KO mice (−28.83 s ± 10.85) was significantly lower than that in WT mice (40.71 s ± 11.82). Thus, these results indicate that Prok2 KO mice have impaired olfactory cognition.
Olfactory cognition is the unified response of both central and peripheral olfactory systems. To identify whether the disruption of the olfactory cognition in Prok2 KO mice originated from the peripheral olfactory system, the electrical signal against odor stimuli in KO mice was measured by EOG. According to the results (Figure 1C), the electrical signal against 0.01 M (−11.21 mV ± 3.33) or 1 M (−13.00 mV ± 3.83) amyl acetate in WT mice was significantly higher than that against the vehicle (−2.93 mV ± 0.79). In contrast, the electrical signal against 0.01 M (−4.96 mV ± 1.89) or 1 M (−5.76 mV ± 2.14) amyl acetate in Prok2 KO mice was not significantly higher than that against the vehicle (−1.92 mV ± 0.78). Therefore, the dose-dependent response against odor stimuli in Prok2 KO mice reduced. Eventually, the reduced function of the peripheral olfactory system affected the disruption of olfactory cognition in Prok2 KO mice. Thus, our findings demonstrate that Prok2 KO mice have olfactory dysfunction similar to patients with KS.
3.2 Dysgenesis of olfactory structure in adult Prok2 KO mice
Abnormalities in the OB and olfactory function in Prok2 KO mice implicate dysgenesis in the olfactory system comprising both OB and OE. The radial structure of the glomeruli of the OB was normally formed in WT mice (Figure 2A). In contrast, a few glomeruli with interacting TH+ periglomerular neurons and OMP+ olfactory axons were formed in KO mice (Figure 2A). In the OE, the Sox2+ sustentacular layer was multilayered, OMP+ mature OSN layer was thinner, and OMP−Tuj1+ immature OSN layer in KO mice was thicker compared with that in WT mice (Figure 2B). The result showed that the overall cellular composition of KO mice was disrupted. At a higher magnification, ACIII+ or Tuj1+ olfactory cilia layer in KO mice was found to be thinner than that in WT mice (Figure 2C). Moreover, the number of olfactory knobs observed via TEM at the higher magnification in KO mice (43.74 n/mm ± 23.67) was significantly less than that in WT mice (280.57 n/mm ± 18.97) (yellow arrows in Figure 2D). Similarly, this relatively reduced the number of olfactory knobs in the OMP+ olfactory cilia layer was observed in KO mice (Figure 2C). Therefore, Prok2 mediated the formation of the glomerular layer (GL) in the OB, the composition of sustentacular cells and OSNs in the OE, the differentiation of immature OSNs into mature OSNs, and the development of the olfactory cilia layer and olfactory knob.
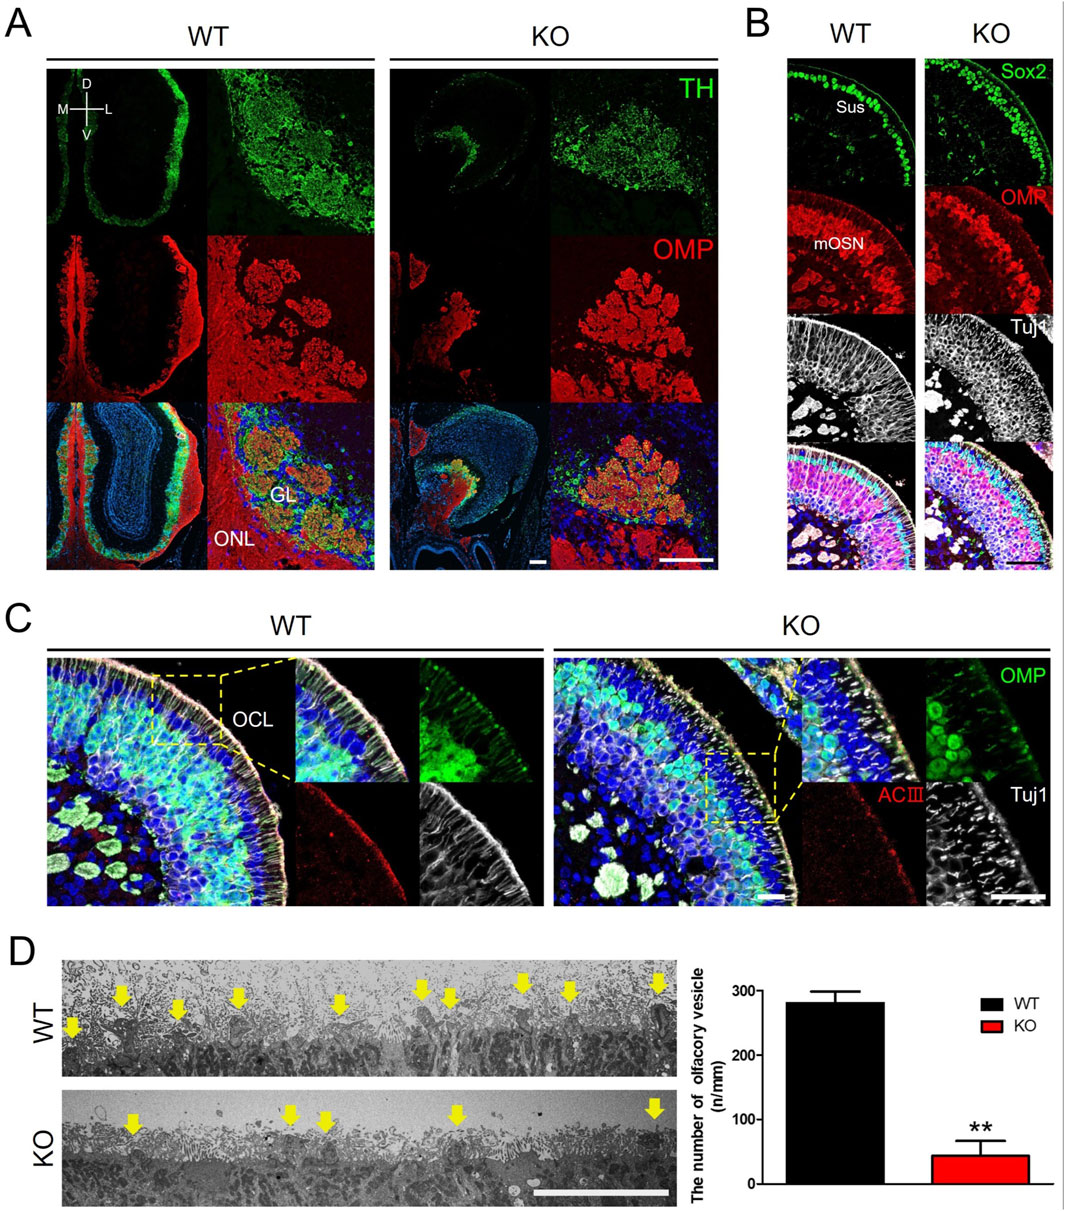
Figure 2. Dysgenesis of the olfactory bulb, olfactory epithelium, and olfactory cilia in adult Prok2 KO mice Immunostaining images, transmission electron microscopy (TEM) images, and a graph showing the number of olfactory knobs in WT and Prok2 KO mice at 16 weeks (A) Immunostaining of the olfactory bulb with α-TH (green) and α-OMP (red) antibodies. (B) Immunostaining of the olfactory epithelium with α-Sox2 (green), α-OMP (red), and α-Tuj1 (white) antibodies. (C) Immunostaining of the olfactory epithelium and olfactory cilia with α-OMP (green), α-ACIII (red), and α-Tuj1 (white) antibodies. Yellow dotted rectangles indicate the highly magnified portion (×40) of the images. (D) TEM image of the olfactory cilia (yellow arrows) and a graph of the number of olfactory vesicles. Differences between the number of olfactory knobs in WT (n = 3) and Prok2 KO mice (n = 3) were considered significant at p = 0.0015. Data are presented as mean ± SD. GL, glomerular layer; ONL, olfactory nerve layer; Sus, sustentacular cells; mOSN, mature olfactory sensory neuron; OCL, olfactory cilia layer; D, dorsal; V, ventral; M, medial; L, lateral. Scale bar, 200 μm in (A) and (B); 100 μm in (C); and 10 μm in (D). In all panels, n indicates biologically independent repeats. P values were determined using two-tailed unpaired Student’s t-test to compare two groups; *, p < 0.05; **, p < 0.01; ns, non-significant.
3.3 Expression of Prok2 and its receptor genes in the olfactory system from embryonic development to adulthood
Previous research has reported that Prok2 and Prokr2 are expressed in the migratory route of GnRH neurons from the VNO to the brain at the early embryonic stages, in the olfactory ventricle of putative OB at the embryonic stages, and in most interneurons after birth (Ng et al., 2005; Pitteloud et al., 2007; Wen et al., 2019; Zhang et al., 2007). However, it remains unclear whether Prokr1, another receptor gene of Prok2, was expressed in olfactory system and whether Prok2 and its receptor genes were expressed in the OE. To answer these questions, the expression of Prok2, Prokr2, and Prokr1 were surveyed at E11.5, E14.5, E18.5, and 16 weeks. Prokr1 was expressed in the OE and OB during embryonic development and in the OB alone at 16 weeks (Figure 3). This expression pattern is similar to that of Prok2. Nevertheless, Prokr1 was not expressed in the migratory route of GnRH neurons, whereas Prok2 and Prokr2 were expressed (arrows in Figure 3). The result indicated that Prok2/Prokr1 signaling is applied in the olfactory system, similar to Prok2/Prokr2 signaling. Besides, Prok2, Prokr2, and Prokr1 were all expressed in the OE during embryonic development. In contrast, these genes were not expressed in the OE at 16 weeks (Figure 3). These findings suggest that both Prok2/Prokr2 signaling and Prok2/Prokr1 signaling interacted in the OE and that only the former mediated the migration of GnRH neurons.
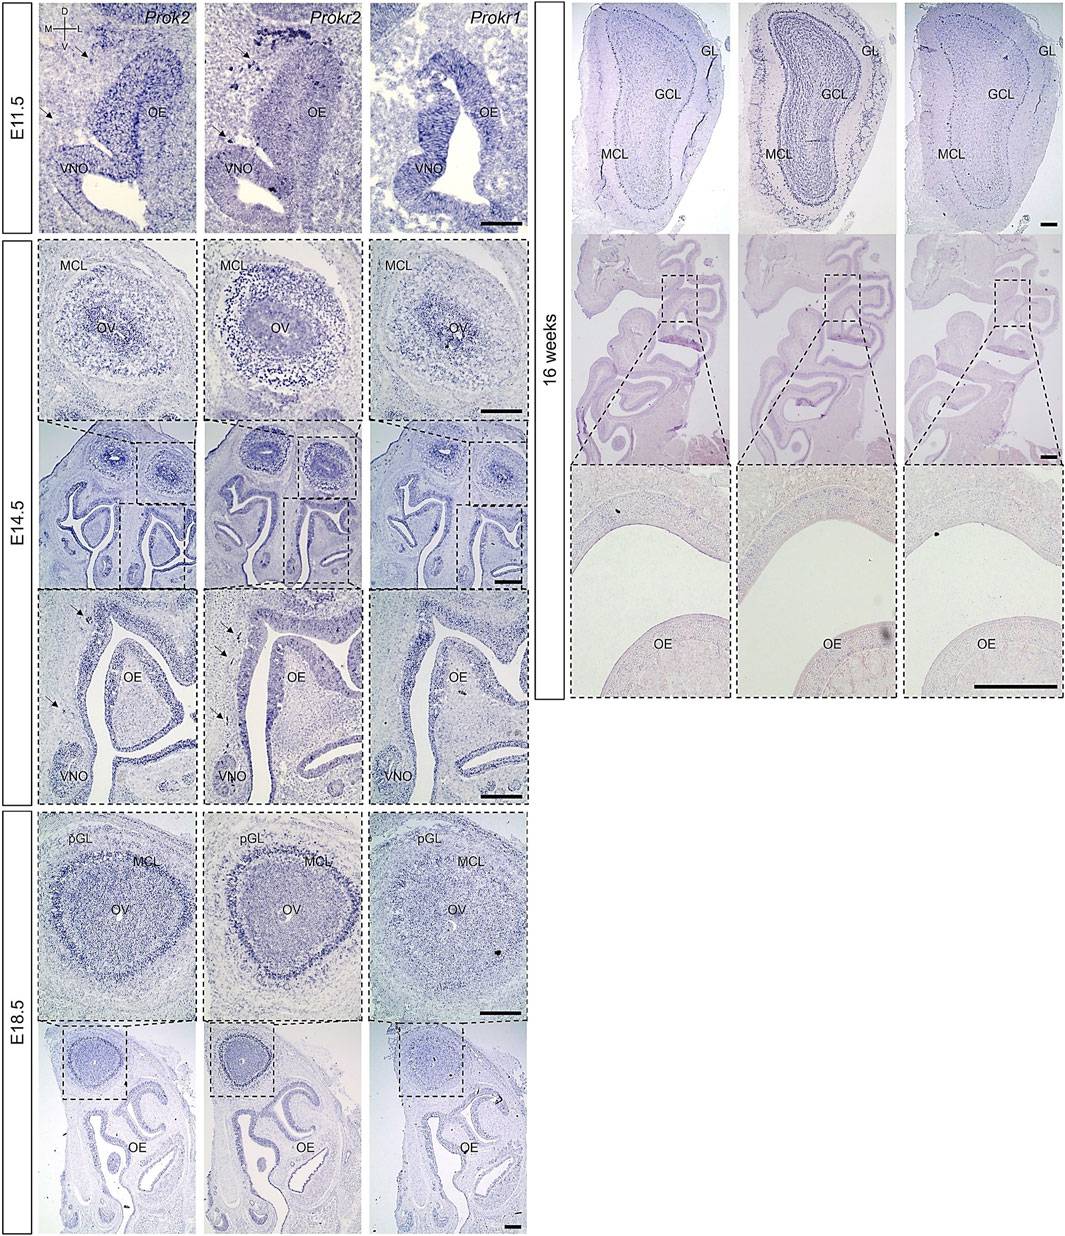
Figure 3. Expression of Prok2 an its receptors in the olfactory system Images of in situ hybridization in the olfactory system with Prok2, Prokr2, and Prokr1 probes at E11.5. E14.5, E18.5, and 16 weeks. Black arrows indicate the expression of each gene in the migration route of GnRH neurons, and black dotted rectangles indicate the highly magnified portion (×10, 10×, and 20×) of the images. OE, olfactory epithelium; VNO, vomeronasal organ; MCL, mitral cell layer; OV, olfactory ventricle; (p)GL, (putative) glomerular layer; GCL, granule cell layer; D, dorsal; V, ventral; M, medial; L, lateral. Scale bar, 200 μm.
In the OB, Prok2 was expressed in both the olfactory ventricle and other cells, including the mitral cell layer (MCL) at E14.5; in the olfactory ventricle, MCL, and putative GL at E18.5; and in the MCL, part of the GL, and part of the granule cell layer at 16 weeks (Figure 3). Although the expression of Prokr1 was similar to that of Prok2, it was weaker at E18.5 and at 16 weeks (Figure 3). Notably, unlike Prok2, Prokr2 was expressed at a higher level in other cells, including the MCL around the olfactory ventricle at E14.5, than in the olfactory ventricle; it was also broadly expressed in the GL and granule cell layer at 16 weeks (Figure 3). This result is consistent with those of previous studies wherein Prok2 was expressed at relatively higher levels in mature neurons and Prokr2 was expressed at relatively higher levels in immature neurons (Ng et al., 2005; Wen et al., 2019). Furthermore, the results indicated that both Prok2/Prokr2 signaling and Prok2/Prokr1 signaling played a role even in the OB.
3.4 Disrupted formation of the olfactory structure in Prok2 KO mice during embryonic development
Dysgenesis of the olfactory structure in adult Prok2 KO mice (Figure 2) and the expression of Prok2 and its receptor genes (Figure 3) implied that Prok2 plays a crucial role in the organization of olfactory structure during embryonic development. Accordingly, the histological changes in Prok2 KO mice were analyzed during embryonic development. During OB development in WT mice, Tuj1+ axons projected and penetrated the Laminin+ brain membrane at E11.5, the putative OB with Tuj1+ axons increased in size at E14.5, and Tuj1+ olfactory axons interacting and radially surrounding the OB expressed OMP, which is a marker for differentiation to mature OSNs, at E18.5 (Figure 4A). In contrast, Tuj1+ axons stalled in front of the Laminin+ brain membrane in KO mice were observed from E11.5 and Tuj1+ and/or OMP+ migratory mass in which olfactory axons accumulated increased in size depending on the developmental stages (Figure 4A). Despite the abnormal formation of the putative OB in KO mice, OMP+ olfactory axons were discriminated from Nrp2+ vomeronasal axons in Tuj1+ axons in the migratory route in KO mice at E18.5 (Figure 4B). This discrimination in KO mice was also observed in WT mice (Figure 4B). The results indicated that the GL in the OB was not constituted normally during embryonic development without Prok2 and that homotypic fasciculation and maturation of olfactory axons in the axon bundles proceeded normally regardless of OB dysgenesis. In addition, OMP+ olfactory axons were excluded from TH+ glomerular neurons and Reelin + mitral cells in the putative OB of KO mice, whereas most of these axons interacted with each other in the putative OB of WT mice (Figure 4C). Regarding the abnormal formation of GL in KO, few glomeruli in which OMP+ olfactory axons and TH+ glomerular neurons interacted with each other were constructed at 16 weeks, whereas OMP+ olfactory axons were excluded from the putative OB surrounding TH+ glomerular neurons at E18.5 (Supplementary Figure S2). This finding indicated that few glomeruli in adult Prok2 KO were formed after birth.
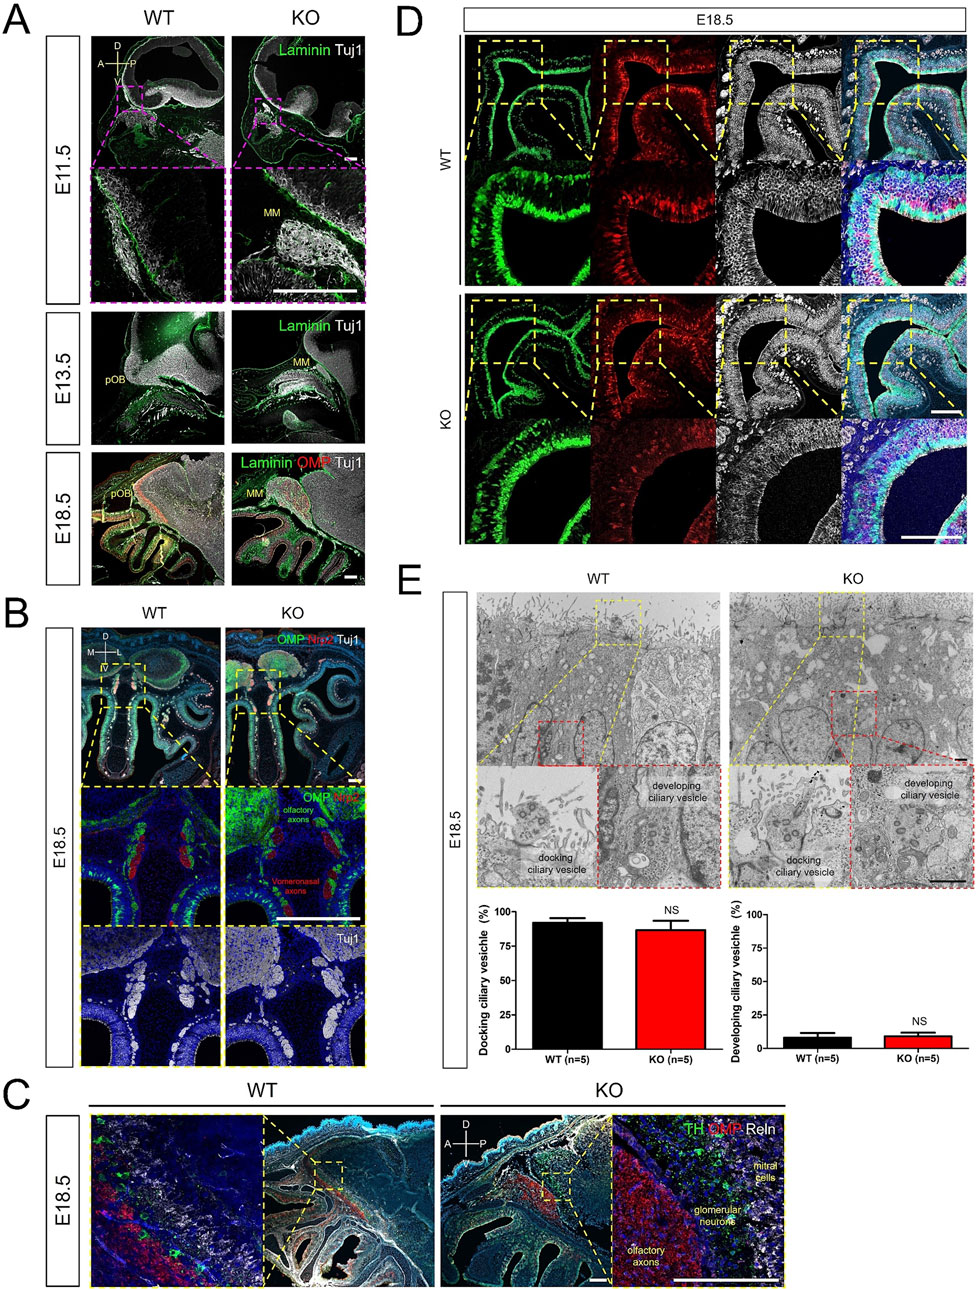
Figure 4. Disruption of olfactory development in Prok2 KO mouse embryo Images of immunostaining and transmission electron microscopy (TEM) from WT and Prok2 KO mice at E11.5, E14.5, and E18.5. (A) Immunostaining in the forebrain or pOB with α-Laminin (green), α-OMP (red), and α-Tuj1 (white) antibodies. Dotted magenta rectangles indicate the highly magnified portion (×20) of the images. (B) Immunostaining in the olfactory nerves and vomeronasal nerves with α-OMP (green), α-Nrp2 (red), and α-Tuj1 (white) antibodies. Dotted yellow rectangles indicate the highly magnified portion (×20) of the images. (C) Immunostaining in the pOB with α-TH (green), α-OMP (red), and α-Reln (white) antibodies. Dotted yellow rectangles indicate the highly magnified portion (×20) of the images. (D) Immunostaining in the olfactory epithelium (OE) with α-Sox2 (green), α-OMP (red), and α-Tuj1 (white) antibodies. Dotted yellow rectangles indicate the highly magnified portion (×20) of the images. (E) TEM image of olfactory vesicles and a graph of the number of olfactory vesicles. The difference in the number of docking olfactory vesicles between WT (n = 5) and Prok2 KO mice (n = 5) was significant at p = 0.2996, and that in the number of developing olfactory vesicles between WT (n = 5) and Prok2 KO mice (n = 5) was significant at p = 0.2904. Each dotted rectangle indicates the highly magnified portion (36k ×) of the images. Dotted yellow rectangles represent the docking ciliary vesicles, and dotted red rectangles indicate the developing ciliary vesicles. Data are presented as mean ± SD. MM, migratory mass; pOB, putative olfactory bulb; D, dorsal; V, ventral; A, anterior; P, posterior; M, medial; L, lateral. Scale bar of (A–D), 200 μm; scale bar of (E), 1 μm. In all panels, n indicates biologically independent repeats. P values were determined using the two-tailed unpaired Student’s t-test for comparisons of two groups; ns, non-significant.
Sox2+ sustentacular cells, Sox2+ basal cells, and Tuj1+OMP− immature OSNs in the OE of KO mice were similar to those in WT mice (Figure 4D). However, mature OSNs in KO mice were less than those in WT mice (Figure 4D). As depicted by Supplementary Figure S3, Omp expression was low at E16.5. In the olfactory knobs of WT mice, both docking ciliary vesicles (95.18% ± 2.01) which arise from the OE surface and developing ciliary vesicles (4.82% ± 2.01) located around the nuclei of sustentacular cells were observed at E18.5 (Figure 4E). The distribution of both docking ciliary vesicles (88.02% ± 5.65) and developing ciliary vesicles (8.41% ± 2.38) in KO mice was not significantly different from that in WT mice (Figure 4E). Prok2 adjusted only the differentiation to mature OSNs in the OE during embryonic development. Consequently, we inferred that Prok2 plays an important role in the organization of the olfactory structure during embryonic development.
3.5 Gene set including intermediate filament genes and genes expressed in the putative OB regulated by Prok2 during olfactory development
According to the results, fewer OMP+ mature OSNs in the OE of Prok2 KO mice before birth (Figure 4D) led to a reduced proportion of mature OSNs in adults (Figure 2B). Subsequently, reduced response against odor stimuli was observed in the OE (Figure 1C). To figure out what induced the decrease in differentiation to mature OSNs in the OE during embryonic development, the differential expression of genes under Prok2 deficiency was analyzed at E14.5 when Omp was first expressed in the OE. The olfactory tissue of WT or KO mice was divided into anterior or posterior regions. The anterior region included only the OE and the posterior region included both OE and putative OB and the other parts of the brain (Figure 5A). Therefore, the former provided information associated with only the OE and the latter provided information related to the sum of OE, OB, and the other parts of the brain. By sequencing the whole RNA genome in each region, genes with high expression level (higher value of average logCPM in each gene than that in Prok2) and significantly greater difference between WT and KO mice (|fc| > 2.0, and bh.pval <0.001) were analyzed. According to the result, keratin genes (Krt77, Krt71, Krt25) in the anterior region displayed significant differences between KO and WT mice (bh.pval = 7.43E-04, 7.25E-11, and 6.58E-13 for Krt77, Krt71, and Krt25, respectively, in Figures 5B,C). In the posterior region, intermediate filament genes (Prph, Nefl, Nefm), ion channel genes for glutamate (Gria2, Grin2b, Slc1a2), mitral-cell-marker genes (Tbr1, Reln), and other neuronal genes (Nrcam, Nts, Neurod6) had significant differences between KO and WT mice (bh.pval = 8.60E-06, 6.91.E−05, 7.31E-09, 1.02E-04, 2.38E-04, 9.31E-09, 1.75E-07, 4.32E-05, 8.22E-05, 7.25E-10, and 1.01E-06 for Prph, Nefl, Nefm, Gria2, Grin2b, Slc1a2, Tbr1, Reln, Nrcam, Nts, and Neurod6, respectively, in Figures 5B,C). Krt77, Prph, Nefl, and Nefm were downregulated in KO mice, whereas the remaining genes were upregulated compared to those in WT mice (Figures 5B,C).
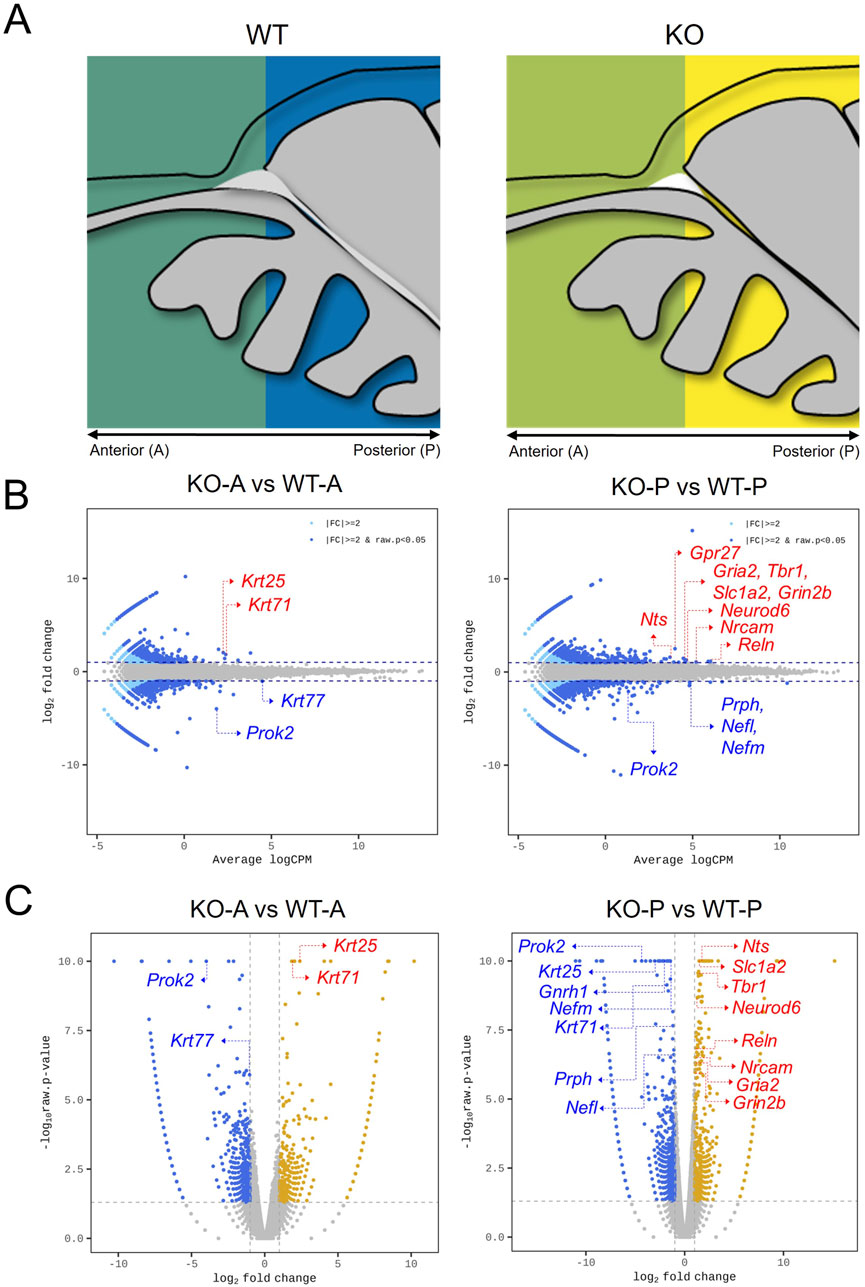
Figure 5. Differentially expressed genes in Prok2-deficient olfactory system at E14.5. Transcriptome sequencing of Prok2 KO mice. (A) The anterior and posterior regions of the olfactory tissue. pOB, putative olfactory bulb; OE, olfactory epithelium; D, dorsal; V, ventral; A, anterior; P, posterior. (B) Minus-average plot comparing KO (n = 3) and WT (n = 3) mice at each region. Each blue dot and blue arrow indicate the name of each gene. (C) Volcano plot comparing KO (n = 3) and WT (n = 3) mice at each region. Each blue dot and blue arrow indicate the name of each gene.
Similarly, the differentially expressed genes among Prok2-relevant genes, KS-relevant genes, OB-constituent genes, OE-constituent genes, and olfactory receptor genes were also analyzed. According to the results, Gnrh1 was significantly expressed at lower levels in KO mice than in WT mice at the posterior region, as expected (bh.pval = 3.32E-11 in Supplementary Table S3). Nrcam and Arx were significantly expressed among the genes at the posterior region (bh.pval = 8.22E-05 and 3.47E-04 for Nrcam and Arx, respectively, in Supplementary Table S3). However, OE-constituent genes were not significantly expressed at all regions between KO and WT mice (higher value of average logCPM in each gene than in Prok2, |fc| > 2.0, and bh.pval <0.001 in Supplementary Table S3). Although several genes for olfactory receptors have a higher value of fold change in KO mice than in WT mice, their expression was substantially lower than that of other genes (average logCPM < −2.0 in Supplementary Table S3). For this reason, it was not obvious that Prok2 affected the differential expression of both OE-constituent genes and olfactory receptor genes.
The heatmap of the genes expressed significantly at each region is described in Supplementary Figure S4. Differentially expressed genes were classified into 6 clusters without Prok2. Cluster 1 included genes for glutamate receptor (Gria2, Grin2b) and glutamate transporter (Slc1a2), genes expressed in mitral cells or interneurons in the putative OB (Tbr1, Reln, Neurog2, Neurod6, Arx), and adhesion molecule gene (Nrcam). Clusters 2 and 3 included intermediate filament genes (Prph, Nefm, Nefl) with Gnrh1. Cluster 4 included neuropeptide genes (Nts and Npy). Lastly, clusters 5 and 6 included keratin genes (Krt71, Krt25, Krt77). Thus, the results indicate that Prok2 mediated the development of the entire olfactory system by regulating the expression of several downstream genes at E14.5.
3.6 Downstream genes of Prok2 during the embryonic development modulated OB formation and affected differentiation into mature OSNs in the OE at later stages
To explore the role of Prok2-regulated downstream genes in organizing the olfactory structure during embryonic development, we examined the expression of downstream genes in the olfactory structure across different developmental stages. Initially, we investigated where the genes noted in Supplementary Figure S4 were expressed in the olfactory system of WT mice at E14.5 (Supplementary Figure S5). According to previous reports on Reln and Npy expression (Ragancokova et al., 2014; Rich et al., 2018), Reln was expressed in the MCL, Npy was expressed in both MCL and olfactory nerve layer (ONL), and Nts was expressed in the MCL similar to Reln (thick arrows and dashed line arrows in Supplementary Figure S5). Slc1a2, Gria2, and Grin2b were expressed in the brain with the putative OB (Supplementary Figure S5). Nefm and Nefl were expressed in both OE and putative OB, as well as in the migratory route of GnRH neurons (black arrows in Supplementary Figure S5). Nrcam was expressed in the NFJ and OB similar to Nefm and Nefl, but not in the OE (black arrows in Supplementary Figure S5). Krt77 was expressed in the OE, putative OB, epidermis, and whisker follicles, whereas Krt25 was expressed only in the epidermis and whisker follicles (Supplementary Figure S5). Additionally, Neurod6 and Krt77 were expressed in both OE and putative OB (Supplementary Figure S5). Based on the expression of each gene at E14.5, the multi-gene expression in the specific regions of the olfactory structure was explored at E11.5, E14.5, E18.5, and 16 weeks.
In the OE, Nefm, Nefl, Neurod6, and Krt77 were analyzed at E11.5, E14.5, E18.5, and 16 weeks together with Omp and Ascl. It was found that Omp expression became more dependent on the developmental stage in WT mice (Figure 6). However, Omp expression in KO mice was less than that in WT mice at E18.5 (black arrows in Figure 6). Nevertheless, other genes, including Ascl1, which is a marker of globose basal cells (GBCs), were expressed in KO mice similar to those in WT mice at E14.5 and E18.5 (Figure 6). This result suggested that Nefm, Nefl, Neurod6, and Krt77 expression did not affect the suppression in Omp expression during embryonic development. In contrast, considering the locations of Omp and Ascl1 (Figure 6) and the cellular composition mentioned above (Figure 2B) in KO mice at 16 weeks, Nefm and Nefl were expressed in mature OSNs, immature OSNs, and basal cells, whereas Neurod6 and Krt77 were expressed in both sustentacular cells and GBCs at 16 weeks (Figure 6). The findings indicate that cellular composition was disrupted after birth.
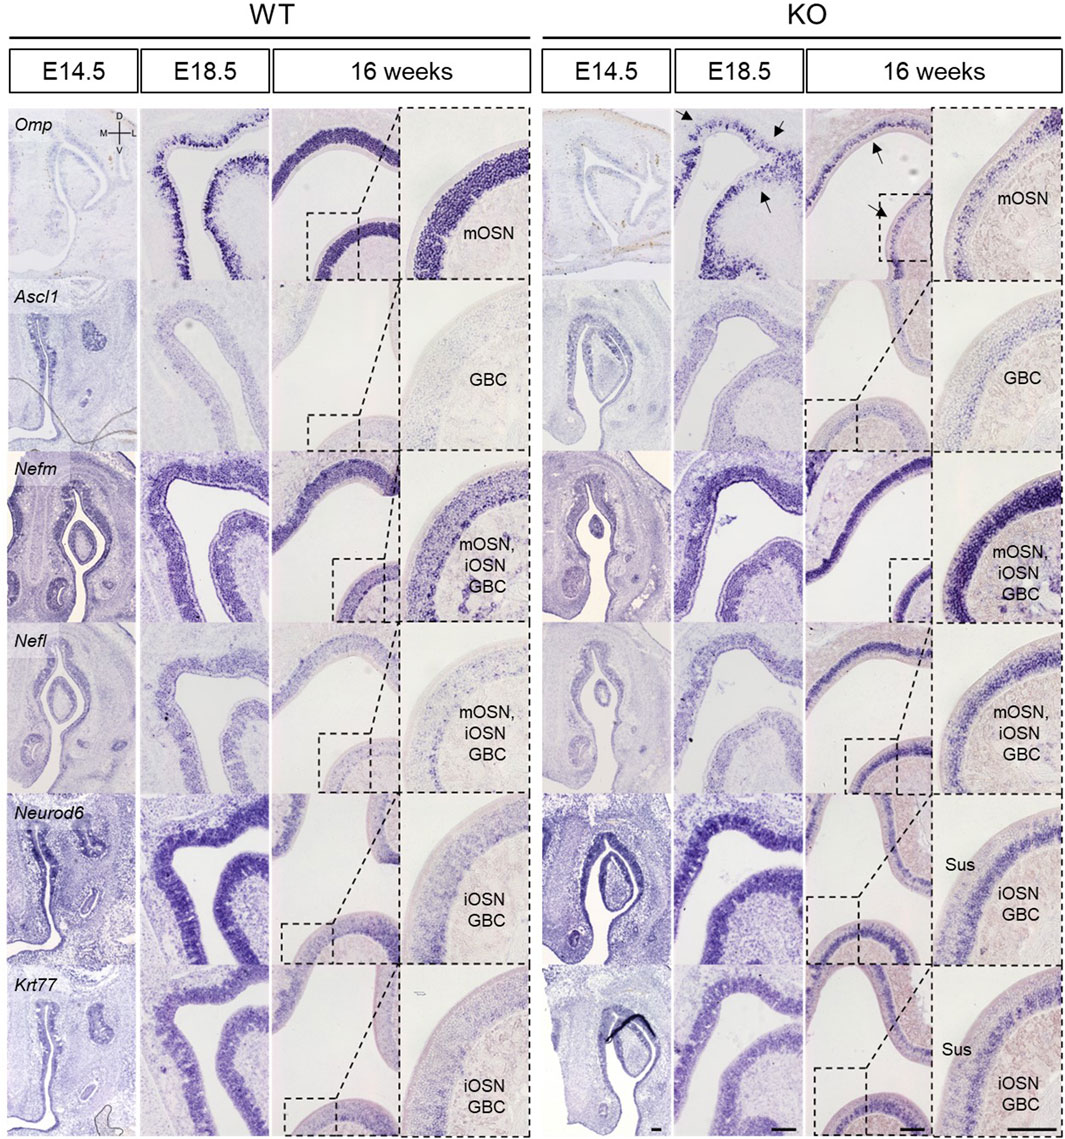
Figure 6. Abnormal development of the olfactory epithelium in Prok2 KO mice at E14.5, E18.5, and 16 weeks In situ hybridization images of the olfactory epithelium with probes for Omp, Ascl1, Nefm, Nefl, Neurod6, and Krt77 at E14.5, E18.5, and 16 weeks. Dotted black rectangles indicate the highly magnified portion (×20) of the images. Black arrows in Prok2 KO mice at E14.5 and E18.5 indicate Omp expression. mOSN, mature olfactory sensory neuron; iOSN, immature olfactory sensory neuron; GBC, globose basal cell; Sus, sustentacular cells. Scale bar, 200 μm.
In the NFJ, Nefm, Nefl, and Nrcam expression were analyzed at E11.5 and E14.5 together with Prokr2. Prokr2 was expressed near the forebrain at E11.5 in both WT and KO mice (Figure 7). However, the spots that expressed Nefm, Nefl, and Nrcam in the NFJ of WT mice appeared cohesive in KO mice (thin arrows in Figure 7). Furthermore, the linear arrangement of the spots that expressed Nefm and Nefl in the basal region of the forebrain in WT mice was absent in KO mice (thick arrows in Figure 7). At E14.5, the Nefm+ Nefl+ Nrcam+ spots which appeared in the NFJ of WT mice appeared less cohesive in KO mice (thick arrows in Figure 7). Previous studies have reported that GnRH neurons migrate from the VNO, penetrate the membrane of the brain, and bypass the basal region of the brain (Forni and Wray, 2015; Schwanzel-Fukuda et al., 1994; Taroc et al., 2020a; Taroc et al., 2017). Consistent with these findings, our results showed that migration was halted and the migratory route at the basal region of brain was disrupted in KO mice at E11.5. Moreover, it indicated that migration was reduced in KO mice at E14.5.
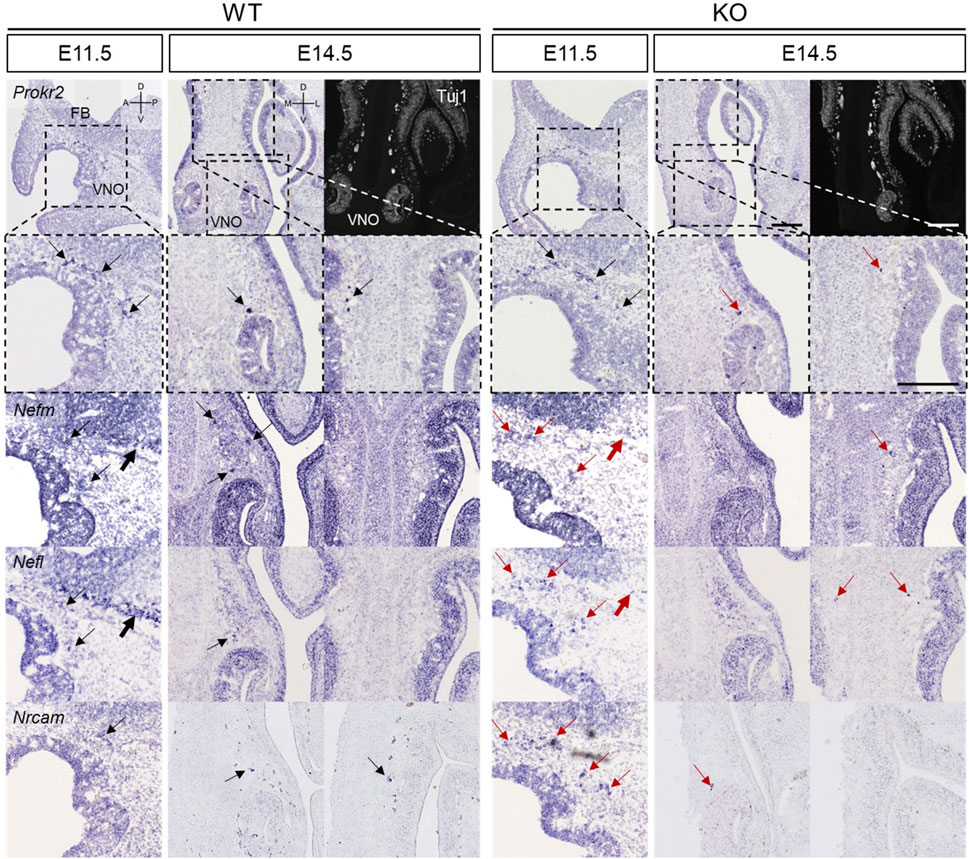
Figure 7. Abnormal development of the VFJ in Prok2 KO mouse embryos at E11.5 and E14.5 In situ hybridization images of the olfactory epithelium with probes of Prokr2, Nefm, Nefl, and Nrcam at E14.5, E18.5, and 16 weeks and IF images stained with α-Tuj1 antibody. Dotted black rectangles indicate the highly magnified portion (×20) of the images. Thin arrows indicate the expression of each gene in the migration route of GnRH neurons, and thick arrows indicate the basal region of the brain. Black arrows represent the normal gene expression, and red arrows indicate the difference in gene expression between WT and Prok2 KO mice. FB, forebrain; VNO, vomeronasal organ; D, dorsal; V, ventral; A, anterior; P, posterior; M, medial; L, lateral. Scale bar, 200 μm.
In the OB, the expression of Nefm, Nefl, Nrcam, Neurod6, Slc1a2, Gria2, Grin2b, and Nts were analyzed at E14.5, E18.5, and 16 weeks with that of Ascl1. Based on the Ascl1 expression, the MCL and ONL in the putative OB were normally developed in WT mice (Figure 8). Although the putative OB protruded similar to that in WT mice, the MCL and ONL were absent in KO mice (Figure 8). The abnormal development of the MCL in KO mice were also indicated by the expression of Nefm, Nefl, Slc1a2, Gria2, and Neurod6 (Figure 8). Parallel to the absent expression of the basal region of the forebrain at E11.5 (thick arrows in Figure 7), Nefm and Nefl were not notably expressed in the basal region of the putative OB (thick arrows in Figure 8). Additionally, these filament genes were expressed in the inner epidermis following the dorsal line of the rostrum in WT mice but not in KO mice (thin arrows in Figure 8). Furthermore, neuronal stem cells were cohesive in KO mice, whereas they were scattered in WT mice consistent with the expression of Nrcam (asterisks in Figure 8). The OB increased in size and OB layers were visible at E18.5 and 16 weeks in WT mice (Figure 8). Consistent with the expression of Ascl1, Nefm, Nefl, Nrcam, and Slc1a2, the protrusion of the putative OB from the subventricular zone was delayed, resulting in a larger migratory mass on this putative OB and abnormal development of the MCL in the putative OB of KO mice at E18.5 (Figure 8). Although all layers in the OB were normally developed, the ONL and GL interacting with OB interneurons were absent in KO mice at 16 weeks (Figure 8). Moreover, the MCL in the OB analog developed poorly and the granular cell layer almost did not develop in KO mice (Figure 8). These results suggested that localization of mitral cells expressing Nefm, Nefl, Nrcam, Neurod6, Slc1a2, Gria2, Grin2b, and Nts are disrupted in Prok2 KO mice and that Nefm and Nefl were involved in structural support, including the basal brain and the inner epidermis following the dorsal line of the rostrum.
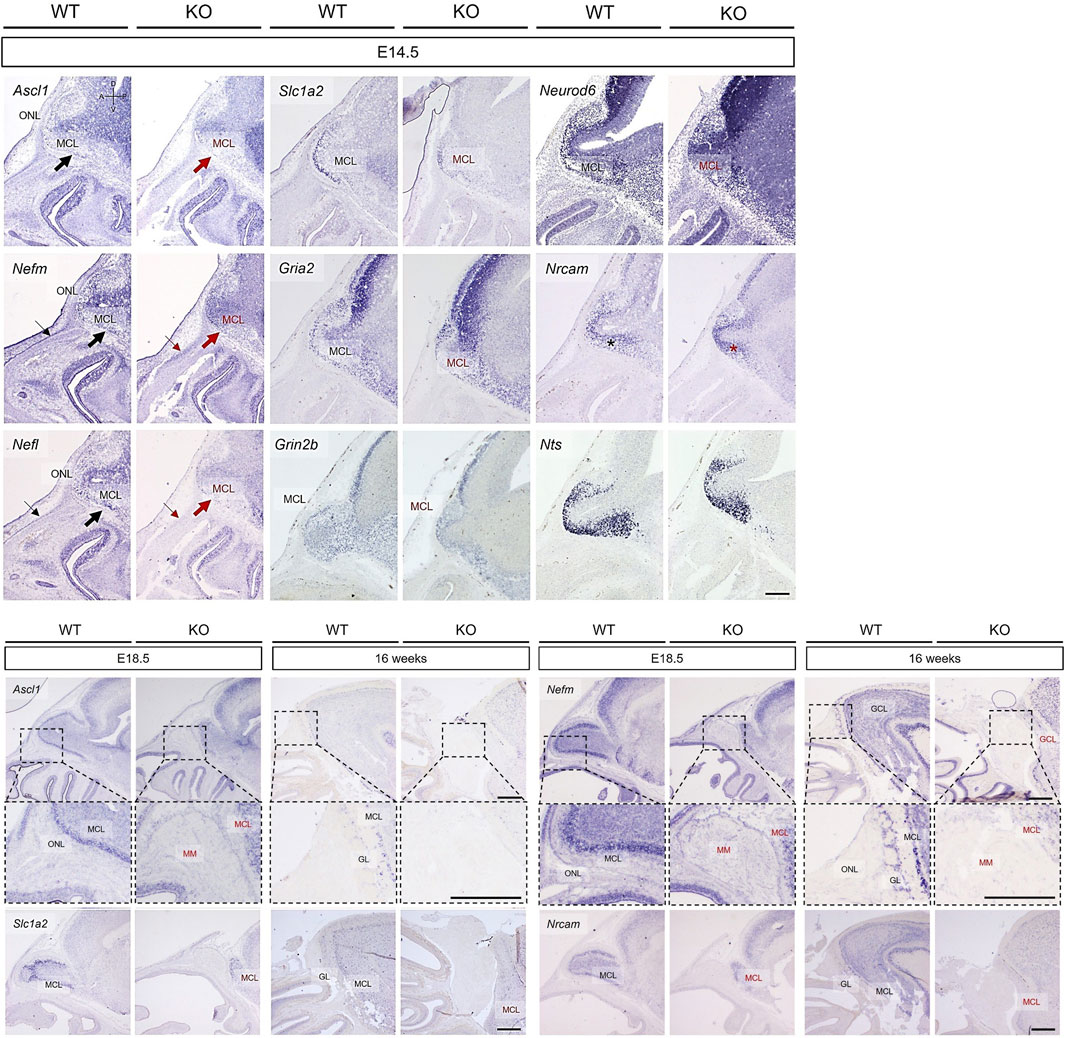
Figure 8. Abnormal development in the olfactory bulb of Prok2 KO mice at E14.5, E18.5, and 16 weeks. In situ hybridization images of the olfactory bulb stained with probes for Ascl1, Nefm, Nefl, Slc1a2, Gria2, Grin2b, Neurod6, Nrcam, and Nts at E14.5, E18.5, and 16 weeks. Thin arrows indicate the expression of each gene in the inner epidermis following the dorsal line of the rostrum in the WT mice, but not in KO mice. Thick arrows indicate the basal region of the brain. Black arrows and characters represent the normal gene expression, while red arrows and characters indicate the difference in gene expression between WT and Prok2 KO mice. Dotted black rectangles indicate the highly magnified portion (×20) of the images. ONL, olfactory nerve layer; MCL, mitral cell layer; MM, migratory mass; GL, glomerular layer; GCL, granule cell layer. Scale bar, 200 μm.
4 Discussion
To discover the effects of Prok2 on the olfactory system, the procedures in the formation of olfactory structure were analyzed with respect to the spatiotemporal dynamics and associated molecular events. In summary, intermediate filament genes and genes expressed in putative OB induced structural changes in the olfactory system during embryonic development (Figure 9). Subsequently, fewer mature OSNs in the OE brought about olfactory dysfunction (Figure 9). To the best of our knowledge, the following findings obtained through this research are novel. First, both Prok2/Prokr2 signaling and Prok2/Prokr1 signaling play a role in olfactory development. Second, the interaction between olfactory axons and glomerular neurons or mitral cells in putative OB may contribute substantially to the differentiation into mature OSNs in the OE.
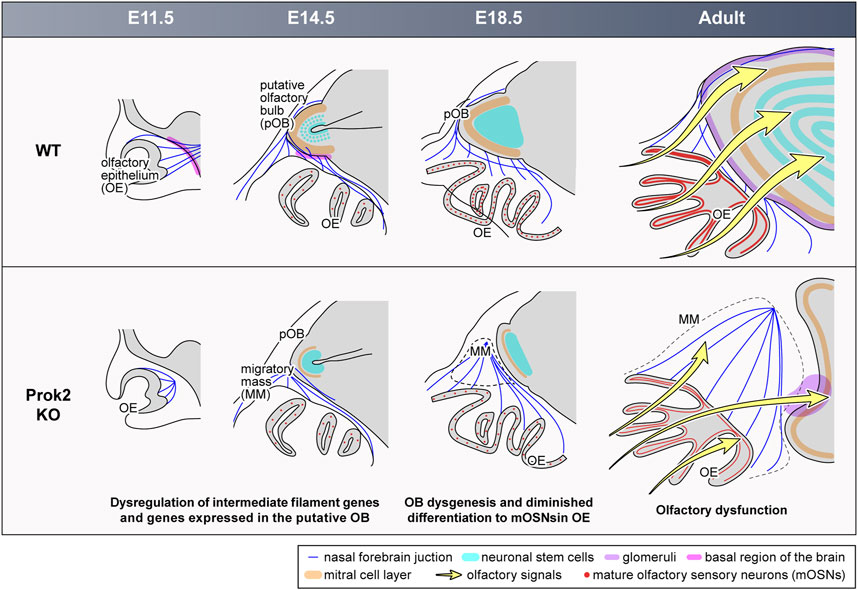
Figure 9. Abnormal development in the olfactory system of Prok2 KO mice from the embryonic stage to the adult stage. At E11.5, olfactory nerves failed to reach and pass into the basal region of the brain in Prok2 KO mice. At E14.5, the basal region of the brain and the layers were poorly formed in the putative OB of Prok2 KO mice. In addition, a migratory mass comprising olfactory nerves adhered to each other appeared. Regardless, the generation of olfactory sensory neurons was normal in the OE of Prok2 KO mice. At E18.5 and at the adult stage, OB dysgenesis and diminished differentiation to mature OSNs were distinct. This abnormality in the olfactory structure in Prok2 KO mice was greater at the adult stage than at E18.5. Furthermore, olfactory dysfunction due to the failure to transfer olfactory signals from the OE to the OB were observed in Prok2 KO mice.
According to previous studies, the main receptor of Prok2 is Prokr2 in the olfactory system (Dodé and Rondard, 2013; Sarfati et al., 2010; Wen et al., 2019). In contrast, our findings showed that Prokr1 was also expressed in the olfactory system similar to Prokr2 but their expression in the migration routes differed. Thus, Prok2/Prokr1 signaling is involved in the olfactory system. Considering the co-expression of Prok2 and Prokr2 in the migration route and the role of Prok2/Prokr2 signaling in the formation of the migration route, unlike Prok2/Prokr2 signaling, Prok2/Prokr1 signaling plays a role in the olfactory system. Future studies in the model limited Prokr2 expression will contribute to a deeper understanding of the precise mechanisms underlying Prok2/Prokr1 signaling in the olfactory system.
Several studies pertaining to the identification of the causes of KS are primarily focused on the migration route of GnRH neurons and subsequent OB formation, as mentioned above (Barraud et al., 2013; Schwanzel-Fukuda et al., 1994; Taroc et al., 2020a; b; Taroc et al., 2017; Watanabe et al., 2009). According to these studies, abnormal development of OB causes congenital anosmia in KS through genes expressed in the NFJ or OB interneurons. However, our results confirmed that olfactory dysfunction in Prok2 KO mice resulted in the detection of olfactory signals in the OE, that abnormal development of OE occurred as a subsequent event after disrupting the interaction between the olfactory nerve and OB neurons during embryonic development, and that intermediate filament genes and genes expressed in the putative OB were regulated by the Prok2 gene. These findings demonstrated that olfactory dysfunction in KS affected olfactory signaling in the OE. Furthermore, we speculated that the normal interaction between the olfactory nerves and mitral cells in the putative OB affected the differentiation to mature OSNs.
We found that several intermediate filament genes regulated by Prok2 gene were expressed in the olfactory system. These genes include keratin genes, neurofilament genes, and Prph. Notably, the deficiency of Prok2 led the suppression of the expression of Nefm, Nefl, and Nrcam together with Gnrh1 in the NFJ. Considering that the intermediate filaments build the cytoskeletal network by interacting with adhesion molecules (Sanghvi-Shah and Weber, 2017), Prok2 interacts with the migration of GnRH neurons by regulating neurofilaments and neural cell adhesion molecules in the NFJ. Previous studies have reported that axonal fasciculation of homotypic nerves is manipulated by olfactory ensheathing cells and neural cell adhesion molecules in the NFJ in the lamina propria before migrating to the OB (Barraud et al., 2013; Ekberg et al., 2012; Windus et al., 2007). According to these studies, the data on the discrete separation between olfactory axons and vomeronasal axons suggested that Prok2 did not affect the function of olfactory ensheathing cells and neural cell adhesion molecules in the NFJ. In line with this, our data showed that Prok2 did not affect the expression of Sox10, which regulates other genes in olfactory ensheathing cells (Supplementary Table S3). In addition, we observed that Krt25 and Krt77 were expressed in the non-olfactory system similar to the epidermis and whisker follicles, indicating that Prok2 regulates both olfactory region and non-olfactory regions. The disparity in gene expression patterns between Krt25 and Krt77 is evident due to their simultaneous expression in both olfactory and non-olfactory systems.
Moreover, neurofilament genes were expressed even in the OB. Although these genes were suppressed in Prok2 KO mice, the cluster 1 genes in Supplementary Figure S4 were overexpressed in the OB. This discrepancy in the expression level appears to be influenced by whether the genes were exclusively expressed in the OB. We found that penetration into the membrane of brain and innervation with interneurons, mitral cells, and tufted cells in the OB failed in Prok2 KO mice. Moreover, the defect in the differentiation of neuronal stem cells to projection neurons or radial glia cells at E14.5, the formation of the MCL and ONL, and subsequent normal development of all OB layers in Prok2 KO mice failed. It is likely that this abnormal development of OB indicates the overexpression of cluster 1 genes in the OB. Thus, our results demonstrate that Prok2 plays a role in the forebrain surrounding the olfactory nerves and the olfactory nerves penetrating the forebrain.
Despite the abnormal development in the NFJ and OB, no evident defect was found in the OE of Prok2 KO mice without less differentiation into mature OSNs. Among olfactory receptor genes, some had relatively higher expression levels between KO and WT mice (|fc| > 100, 1.00-E6 < adj.pval <1.00-E2) (Supplementary Table S3). However, these olfactory receptor genes had low expression levels (average LogCPM < −2) in both steady and Prok2-deficient states (Supplementary Table S3). Therefore, it cannot be accurately determined whether differentially expressed olfactory receptor genes with Prok2 cause less differentiation into mature OSNs. Furthermore, it is likely that the indirect signals from other olfactory structures affected the differentiation into mature OSNs, rather than the direct signals in the OE.
Prior studies have reported that tufted cell-like mitral cells encountered olfactory axons and formed fascicles (Blanchart et al., 2006; Ravi et al., 2017; Tufo et al., 2022). Other studies showed that the defasciculating of olfactory axons proceeded and that olfactory axons broke down the brain membrane in the outer ONL for sorting and refasciculating specific glomeruli in the inner ONL (Ekberg et al., 2012; Rich et al., 2018). It implied that many signals were sent and received between the OB and OE during the developmental procedure. Furthermore, regarding our data about the abnormal organization of the MCL and ONL appearing before the differentiation of mature OSNs in the OE of Prok2 KO mice, it is conferred that the failure to deliver signals from the OB due to poor penetration of olfactory axons into the OB resulted in less differentiation into OSNs in the OE. In particular, olfactory axons did not interact with genes expressed only in the OB, similar to Nts, Gria2, and Grin2b. Considering that glutamate from olfactory axons is used to transfer olfactory signaling into tufted cells expressing Gria2, Grin2b, or Slc1a2 in the OB (Gurden et al., 2006; O’Connor and Jacob, 2008), the failure of ONL and MCL formation indicated a low possibility that factors for differentiation to mature OSNs were transferred in the OE. For this reason, these genes likely play a crucial role in the differentiation to mature OSNs in the OE. Thus, our result showed that Prok2 mediated the differentiation into mature OSNs through the interaction between olfactory axons and the MCL and/or ONL. Unfortunately, more direct evidence is needed to support our hypothesis on the role of Prok2 in differentiation into mature OSNs. Future studies using direct treatment with neurotransmitters or co-culture of neurons will be required to demonstrate that the genes identified in our study solely affect the differentiation into mature OSNs.
In addition, Prok2 might affect the cellular composition and development of olfactory cilia in the OE and the formation of GL in the OB, according to the interval between E18.5 and 16 weeks. These organizations are ultimately connected to each other by numerous mature OSNs. Previous studies have reported that olfactory stimulation upon exposure to air after birth facilitated the generation of mature OSNs (Kim et al., 2023; van der Linden et al., 2020). We believe that the differentiation to mature OSNs during the postnatal period was dependent on olfactory stimulation. During both embryonic and postnatal periods in Prok2 KO mice, differentiation to mature OSNs was reduced. Thus, our data suggested that Prok2 mediated the differentiation to mature OSNs through both independent and dependent olfactory stimulation. Further research into the differentiation driven by dependent olfactory stimulation is necessary to elucidate the role of Prok2 in regulating the organization of the olfactory system during the postnatal period.
In summary, we studied the embryonic development of the olfactory system, especially focusing on the OE which has not been adequately addressed in previous studies. The results provide new insight into the development of the olfactory system, indicating that both OB and OE influence normal olfactory function and that their interaction is essential for the development and function of the olfactory system. Moreover, we elucidated the mechanistic role of Prok2 in the development of the olfactory system through intermediate genes and genes expressed in the putative OB. Finally, this study will aid in identifying the cause of olfactory disorders and advancing developmental or genetic research of the olfactory system.
Data availability statement
The datasets presented in this study can be found in online repositories. The names of the repository/repositories and accession number(s) can be found in the article/Supplementary Material.
Ethics statement
The animal study was approved by Yonsei Medical Center Animal Research Guidelines (IACUC No. 2023-0184). The study was conducted in accordance with the local legislation and institutional requirements.
Author contributions
B-RK: Writing – original draft, Writing – review and editing, Conceptualization, Formal Analysis, Methodology. M-SR: Investigation, Supervision, Writing – review and editing. H-JC: Investigation, Supervision, Writing – review and editing. J-HY: Investigation, Supervision, Writing – review and editing. C-HK: Investigation, Supervision, Writing – review and editing.
Funding
The author(s) declare that financial support was received for the research and/or publication of this article. This work was funded by the Bio and Medical Technology Development Program of the National Research Foundation (NRF) by the Korean government (MSIT) via grant Nos RS-2024-00443043, RS-2024-00400118, and RS-2024-00344509.
Acknowledgments
We thank MID (Medical Illustration and Design), as a member of the Medical Research Support Services of Yonsei University College of Medicine, for providing excellent support with medical illustration.
Conflict of interest
The authors declare that the research was conducted in the absence of any commercial or financial relationships that could be construed as a potential conflict of interest.
Generative AI statement
The author(s) declare that no Generative AI was used in the creation of this manuscript.
Publisher’s note
All claims expressed in this article are solely those of the authors and do not necessarily represent those of their affiliated organizations, or those of the publisher, the editors and the reviewers. Any product that may be evaluated in this article, or claim that may be made by its manufacturer, is not guaranteed or endorsed by the publisher.
Supplementary material
The Supplementary Material for this article can be found online at: https://www.frontiersin.org/articles/10.3389/fcell.2025.1550845/full#supplementary-material
References
Barraud, P., John, J., Stolt, C., Wegner, M., and Baker, C. (2013). Olfactory ensheathing glia are required for embryonic olfactory axon targeting and the migration of gonadotropin-releasing hormone neurons. Biol. Open 2, 750–759. doi:10.1242/bio.20135249
Blanchart, A., De Carlos, J. A., and López-Mascaraque, L. (2006). Time frame of mitral cell development in the mice olfactory bulb. J. Comp. Neurol. 496, 529–543. doi:10.1002/cne.20941
Bortolotto Felippe Trentin, M., Borges Daniel, K., Reis, F., Adolfo Silva Junior, N., Appenzeller, S., Rittner, L., et al. (2023). Reconsidering the olfactory and brain structures in Kallmann’s syndrome: new findings in the analysis of volumetry. Clin. Endocrinol. (Oxf). 98, 554–558. doi:10.1111/cen.14868
Cho, H.-J., Lee, Y. H., Kim, B. R., Kim, H.-K., Chung, H. J., Park, S. C., et al. (2018). Newly developed method for mouse olfactory behavior tests using an automatic video tracking system. Auris Nasus Larynx 45, 103–110. doi:10.1016/j.anl.2017.03.007
Cygnar, K. D., Stephan, A. B., and Zhao, H. (2010). Analyzing responses of mouse olfactory sensory neurons using the air-phase electroolfactogram recording. J. Vis. Exp. 37, 1850. doi:10.3791/1850
Dodé, C., and Rondard, P. (2013). PROK2/PROKR2 signaling and Kallmann syndrome. Front. Endocrinol. 4, 19. doi:10.3389/fendo.2013.00019
Ekberg, J. A., Amaya, D., Mackay-Sim, A., and St John, J. A. (2012). The migration of olfactory ensheathing cells during development and regeneration. Neurosignals 20, 147–158. doi:10.1159/000330895
Forni, P. E., and Wray, S. (2015). GnRH, anosmia and hypogonadotropic hypogonadism – where are we? Front. Neuroendocrinol. 36, 165–177. doi:10.1016/j.yfrne.2014.09.004
Ghibaudo, V., Turrel, M., Granget, J., Garcia, S., Plailly, J., and Buonviso, N. (2024). Pleasant smells: a privileged gateway to soothing autonomic responses and improving brain-body rhythm coupling. bioRxiv 2024.2011.2029.625994. doi:10.1101/2024.11.29.625994
Gudis, D. A., and Soler, Z. M. (2016). Chronic rhinosinusitis-related smell loss: medical and surgical treatment efficacy. Curr. Otorhinolaryngol. Rep. 4, 142–147. doi:10.1007/s40136-016-0114-4
Gurden, H., Uchida, N., and Mainen, Z. F. (2006). Sensory-evoked intrinsic optical signals in the olfactory bulb are coupled to glutamate release and uptake. Neuron 52, 335–345. doi:10.1016/j.neuron.2006.07.022
Herz, R. S., and Engen, T. (1996). Odor memory: review and analysis. Psychon. Bull. Rev. 3, 300–313. doi:10.3758/BF03210754
Kadohisa, M. (2013). Effects of odor on emotion, with implications. Front. Syst. Neurosci. 7, 66. doi:10.3389/fnsys.2013.00066
Kim, B. R., Rha, M. S., Cho, H. J., Yoon, J. H., and Kim, C. H. (2023). Spatiotemporal dynamics of the development of mouse olfactory system from prenatal to postnatal period. Front. Neuroanat. 17, 1157224. doi:10.3389/fnana.2023.1157224
Kobayakawa, K., Kobayakawa, R., Matsumoto, H., Oka, Y., Imai, T., Ikawa, M., et al. (2007). Innate versus learned odour processing in the mouse olfactory bulb. Nature 450, 503–508. doi:10.1038/nature06281
Lee, L., Luke, L., Boak, D., and Philpott, C. (2024). Impact of olfactory disorders on personal safety and well-being: a cross-sectional observational study. Eur. Arch. Otorhinolaryngol. 281, 3639–3647. doi:10.1007/s00405-024-08529-9
Li, L.-Y. J., Chien-Yi, L., Tsai, C.-Y., and Wu, C.-J. (2023). Anosmia caused by brain tumor. Am. J. Med. Sci. 365, e12. doi:10.1016/j.amjms.2022.08.014
Murphy, C. (2019). Olfactory and other sensory impairments in alzheimer disease. Nat. Rev. Neurol. 15, 11–24. doi:10.1038/s41582-018-0097-5
Ng, K. L., Li, J. D., Cheng, M. Y., Leslie, F. M., Lee, A. G., and Zhou, Q. Y. (2005). Dependence of olfactory bulb neurogenesis on prokineticin 2 signaling. Science 308, 1923–1927. doi:10.1126/science.1112103
O’Connor, S., and Jacob, J. C. T. (2008). Neuropharmacology of the olfactory bulb. Curr. Mol. Pharmacol. 1, 181–190. doi:10.2174/1874467210801030181
Parvin, P., Boesveldt, S., and Postma, E. M. (2024). Assessing the impact of olfactory dysfunction on eating behavior: a systematic scoping review and call for standardized assessments. Clin. Nutr. Open Sci. 56, 92–127. doi:10.1016/j.nutos.2024.05.013
Pautler, R. G., and Koretsky, A. P. (2002). Tracing odor-induced activation in the olfactory bulbs of mice using manganese-enhanced magnetic resonance imaging. Neuroimage 16, 441–448. doi:10.1006/nimg.2002.1075
Pitteloud, N., Zhang, C., Pignatelli, D., Li, J.-D., Raivio, T., Cole, L. W., et al. (2007). Loss-of-function mutation in the prokineticin 2 gene causes Kallmann syndrome and normosmic idiopathic hypogonadotropic hypogonadism. Proc. Natl. Acad. Sci. U. S. A. 104, 17447–17452. doi:10.1073/pnas.0707173104
Proskynitopoulos, P. J., Stippler, M., and Kasper, E. M. (2016). Post-traumatic anosmia in patients with mild traumatic brain injury (mTBI): a systematic and illustrated review. Surg. Neurol. Int. 7, S263–S275. doi:10.4103/2152-7806.181981
Ragancokova, D., Rocca, E., Oonk, A. M. M., Schulz, H., Rohde, E., Bednarsch, J., et al. (2014). TSHZ1-dependent gene regulation is essential for olfactory bulb development and olfaction. J. Clin. Investig. 124, 1214–1227. doi:10.1172/jci72466
Ravi, N., Sanchez-Guardado, L., Lois, C., and Kelsch, W. (2017). Determination of the connectivity of newborn neurons in Mammalian olfactory circuits. Cell. Mol. Life Sci. 74, 849–867. doi:10.1007/s00018-016-2367-y
Rich, C., Perera, S., Andratschke, J., Stolt, C., Buehler, D., Southard-Smith, E., et al. (2018). Olfactory ensheathing cells abutting the embryonic olfactory bulb express frzb, whose deletion disrupts olfactory axon targeting. Glia 66, 2617–2631. doi:10.1002/glia.23515
Rugarli, E. I. (1999). Kallmann syndrome and the link between olfactory and reproductive development. Am. J. Hum. Genet. 65, 943–948. doi:10.1086/302600
Sanghvi-Shah, R., and Weber, G. F. (2017). Intermediate filaments at the junction of mechanotransduction, migration, and development. Front. Cell. Dev. Biol. 5, 81. doi:10.3389/fcell.2017.00081
Santos, D. V., Reiter, E. R., DiNardo, L. J., and Costanzo, R. M. (2004). Hazardous events associated with impaired olfactory function. Arch. Otolaryngol. Head. Neck Surg. 130, 317–319. doi:10.1001/archotol.130.3.317
Sarfati, J., Dodé, C., and Young, J. (2010). Kallmann syndrome caused by mutations in the PROK2 and PROKR2 genes: pathophysiology and genotype-phenotype correlations. Front. Horm. Res. 39, 121–132. doi:10.1159/000312698
Schwanzel-Fukuda, M., Reinhard, G. R., Abraham, S., Crossin, K. L., Edelman, G. M., and Pfaff, D. W. (1994). Antibody to neural cell adhesion molecule can disrupt the migration of luteinizing hormone-releasing hormone neurons into the mouse brain. J. Comp. Neurol. 342, 174–185. doi:10.1002/cne.903420203
Taroc, E. Z. M., Katreddi, R. R., and Forni, P. E. (2020a). Identifying Isl1 genetic lineage in the developing olfactory system and in GnRH-1 neurons. Front. Physiol. 11, 601923. doi:10.3389/fphys.2020.601923
Taroc, E. Z. M., Naik, A. S., Lin, J. M., Peterson, N. B., Keefe, D. L., Genis, E., et al. (2020b). Gli3 regulates vomeronasal neurogenesis, olfactory ensheathing cell formation, and GnRH-1 neuronal migration. J. Neurosci. 40, 311–326. doi:10.1523/jneurosci.1977-19.2019
Taroc, E. Z. M., Prasad, A., Lin, J. M., and Forni, P. E. (2017). The terminal nerve plays a prominent role in GnRH-1 neuronal migration independent from proper olfactory and vomeronasal connections to the olfactory bulbs. Biol. Open 6, 1552–1568. doi:10.1242/bio.029074
Topan, Y. E., Bozkurt, B., Yılmaz, S., Elsürer, Ç., Gorcuyeva, S., and Bozkurt, M. K. (2021). Olfactory dysfunction in primary Sjogren’s syndrome and its correlation with dry eye. Acta Otorhinolaryngol. Ital. 41, 443–449. doi:10.14639/0392-100x-n1344
Tsukahara, T., Brann, D. H., and Datta, S. R. (2023). Mechanisms of SARS-CoV-2-associated anosmia. Physiol. Rev. 103, 2759–2766. doi:10.1152/physrev.00012.2023
Tufo, C., Poopalasundaram, S., Dorrego-Rivas, A., Ford, M. C., Graham, A., and Grubb, M. S. (2022). Development of the Mammalian main olfactory bulb. Development 149, dev200210. doi:10.1242/dev.200210
van der Linden, C. J., Gupta, P., Bhuiya, A. I., Riddick, K. R., Hossain, K., and Santoro, S. W. (2020). Olfactory stimulation regulates the birth of neurons that express specific odorant receptors. Cell. Rep. 33, 108210. doi:10.1016/j.celrep.2020.108210
Wakabayashi, T., Takei, A., Okada, N., Shinohara, M., Takahashi, M., Nagashima, S., et al. (2021). A novel SOX10 nonsense mutation in a patient with Kallmann syndrome and Waardenburg syndrome. Endocrinol. Diabetes Metab. Case Rep. 2021, 20–0145. doi:10.1530/edm-20-0145
Watanabe, Y., Inoue, K., Okuyama-Yamamoto, A., Nakai, N., Nakatani, J., Nibu, K., et al. (2009). Fezf1 is required for penetration of the basal lamina by olfactory axons to promote olfactory development. J. Comp. Neurol. 515, 565–584. doi:10.1002/cne.22074
Wen, Y., Zhang, Z., Li, Z., Liu, G., Tao, G., Song, X., et al. (2019). The PROK2/PROKR2 signaling pathway is required for the migration of Most olfactory bulb interneurons. J. Comp. Neurol. 527, 2931–2947. doi:10.1002/cne.24719
Windus, L. C., Claxton, C., Allen, C. L., Key, B., and St John, J. A. (2007). Motile membrane protrusions regulate cell-cell adhesion and migration of olfactory ensheathing glia. Glia 55, 1708–1719. doi:10.1002/glia.20586
Keywords: prokineticin 2 gene, kallman syndrome, olfactory dysfunction, olfactory sensory neuron, embryonic development, spatiotemporal regulation, Transcriptomic (RNA-Seq), intermediate filament (IF)
Citation: Kim B-R, Rha M-S, Cho H-J, Yoon J-H and Kim C-H (2025) Spatiotemporal regulation by downstream genes of Prok2 in the olfactory system: from development to function. Front. Cell Dev. Biol. 13:1550845. doi: 10.3389/fcell.2025.1550845
Received: 24 December 2024; Accepted: 07 July 2025;
Published: 22 July 2025.
Edited by:
Samir Vaid, University Hospital Carl Gustav Carus, GermanyReviewed by:
Cedric Patthey, Umeå University, SwedenRené Oliver Goral, National Institute of Environmental Health Sciences (NIH), United States
Junchao Shi, Jilin University, China
Copyright © 2025 Kim, Rha, Cho, Yoon and Kim. This is an open-access article distributed under the terms of the Creative Commons Attribution License (CC BY). The use, distribution or reproduction in other forums is permitted, provided the original author(s) and the copyright owner(s) are credited and that the original publication in this journal is cited, in accordance with accepted academic practice. No use, distribution or reproduction is permitted which does not comply with these terms.
*Correspondence: Chang-Hoon Kim, ZW50bWFuQHl1aHMuYWM=