 Hao Chen1†
 Ai Zhou
 Li Zhang
 Xing Li
- 1Department of Cardiology, Wuxi No. 2 People’s Hospital of Jiangnan University Medical Center, Wuxi, Jiangsu, China
- 2Department of Cardiology, Affiliated Changzhou Children’s Hospital of Nantong University, Changzhou, China
- 3Hongqiao International Institute of Medicine, Tongren Hospital, Shanghai Jiao Tong University School of Medicine, Shanghai, China
Acute myocardial infarction (AMI) is the main cause of death worldwide. We aim to compare the differences in plasma lipid metabolites between AMI patients and normal controls to search for biomarker molecules for AMI with different infarct sites. We enrolled 12 patients in Group A (left coronary artery occlusion), 15 in Group B (right coronary artery occlusion), and 14 in Group C (normal controls) from June 2020 to June 2021. Non-targeted lipidomic analysis was performed and a total of 93 differential lipid molecules were identified. Diagnostic efficiency was evaluated by receiver operating curve. Compared with Group C, there were nine lipid molecules with AUC>0.8 in Groups A and B. Compared with Group B, Group A had six lipid molecules with AUC>0.8. These lipid molecules belonged to the LPC, PC, TG, and DG classes. We focused on LPC (20:4) as a biomarker in AMI.
1 Introduction
Cardiovascular disease and its associated complications are the leading cause of death and disability worldwide, causing 17.8 million deaths each year (GBD, 2017 Causes of Death Collaborators, 2018). At present, the prevalence of cardiovascular disease in China is on the rise. It is estimated that there are 330 million cardiovascular patients, of whom coronary heart disease accounts for 11 million (Sanz and Fayad, 2008). Acute myocardial infarction (AMI) is one of the most serious and harmful types of coronary heart disease. Its pathogenesis is the formation of atherosclerotic plaques in the coronary arteries driven by lipoprotein deposition, which is involved in inflammatory responses, immune responses, and other factors. Vulnerable plaques rupture or erode, triggering a coagulation cascade which leads to acute thrombosis, thereby blocking coronary blood flow and causing acute ischemic damage or even necrosis of a large area of myocardial cells (Sanz and Fayad, 2008). Although medical technology has made great progress, AMI is still a killer that threatens human health. In recent decades, more and more metabolomic techniques have been used to demonstrate the metabolic changes in diseases such as atherosclerosis (Wang et al., 2017), myocardial ischemia (Al-Rasadi et al., 2018; Lanfear et al., 2017), heart failure (Lanfear et al., 2017), and hypertension (Zheng et al., 2013). These new metabolomic techniques provide novel approaches to exploring the pathogenesis of cardiovascular disease and to search for biologically active substances. Lipidomics, a branch of metabolomics, is the systems-based study of all lipids, their interacting molecules, and their functions in cells (Sud et al., 2007). As dyslipidemia is a vital risk factor for AMI, we chose lipidomic analysis to further explore changes of lipid metabolism in AMI.
In our daily clinical work, we found that the clinical presentation and long-term prognosis of patients with left or right coronary artery occlusion are quite different. American Cardiovascular Association guidelines for myocardial infarction indicate that anterior wall myocardial infarction is an important indicator for the prognosis risk assessment of MI patients (Arnett et al., 2019). The vessel most commonly involved in all MI patients is the left anterior descending (LAD) artery, and thus the anterior wall supplied by the LAD is also the most common in myocardial infarction. The anterior descending artery accounts for two-thirds of the blood supply to the entire heart. When myocardial infarction occurs in the anterior wall, its severity is often greater than that of non-anterior myocardial infarction, and the prognosis is worse. Adverse left ventricular remodeling and long-term major cardiovascular events risk is higher. However, the factors affecting cardiac structure, function and prognosis after myocardial infarction also include infarct volume and transmural degree. After excluding these factors that affect myocardial infarction, it is still worth exploring whether the location of infarction has an independent impact on myocardial infarction. Most previous studies on myocardial infarction have been divided into a myocardial infarction patient group and a normal control group. Considering the specificity of anterior wall infarcts mentioned above, there were three groups of subjects in our study: Group A, anterior wall infarction caused by the anterior descending artery; Group B, inferior wall infarction caused by the right coronary artery; Group C, normal control group.
Our study applied an untargeted lipidomic profiling strategy based on ultraperformance liquid chromatography coupled with mass spectrometry (UPLC-MS) to identify lipidomic features of the arterial plasma samples obtained from AMI patients with anterior wall infarction, inferior wall infarction, and healthy controls to observe the changes in lipid metabolism in those with a different infarct region and to identify biomarker molecules that may affect the development process of myocardial infarction.
2 Materials and methods
2.1 Study subjects
We included patients who underwent coronary angiography with AMI diagnosis from 30 January 2020 to 30 June 2021 in the Department of Cardiology of Wuxi No. 2 People’s Hospital of Nanjing Medical University due to chest pain, ischemic electrocardiogram (ECG) changes, and elevated myocardial markers. The diagnosis of AMI is based on the globally harmonized definition of myocardial infarction published by the European Society of Cardiology in 2018 (Arnett et al., 2019)—a typical elevation and/or decrease in biomarkers of myocardial necrosis, at least once exceeding the 99th percentile of healthy people, and evidence of at least one of the following: (1) clinical symptoms of myocardial ischemia; (2) new myocardial ischemia changes (ST-segment elevation or decrease) on ECG; (3) pathological Q on ECG waves; (4) imaging evidence of new loss of myocardial viability or regional wall motion abnormalities. Confirmed by percutaneous coronary angiography, 12 patients with left coronary artery occlusion and 17 with right coronary artery occlusion were enrolled. The control group underwent coronary angiography in the same period and showed normal coronary arteries—a total of 15 people. After quality control and PCA, two outliers in Group B and one in Group C were excluded (Supplementary Figure S1), so 41 samples were finally included for analysis. The inclusion criteria were (1) AMI discovered for the first time and did not receive reperfusion therapy; (2) family members and patients agreed to be enrolled. The exclusion criteria were: previous myocardial infarction; heart failure; history of malignant tumor; chronic obstructive pulmonary disease; arrhythmia high atrioventricular block, ventricular fibrillation; congenital heart disease, cardiomyopathy, rheumatic heart disease; abnormal renal function; blood system diseases; abnormal thyroid function; pregnant or lactating women; people with bacterial, viral infection, acute and chronic inflammation, and immune diseases.
Written informed consent was obtained from each subject before their participation in the study. Personal information was omitted, and identification was replaced by their health examination number. The research protocol was approved by the ethics committee of the Wuxi No. 2 People’s Hospital of Nanjing Medical University (2021-Y-9).
2.2 Diagnosis of the culprit vessel of AMI
Emergency coronary angiography (CAG) and percutaneous coronary intervention (PCI) were performed in the cardiac catheterization laboratory through the radial artery by four experienced coronary interventionists. Enteric-coated aspirin 300 mg and ticagrelor 180 mg were taken before the operation, and the patients were sent directly from the emergency room to the catheterization room. The right radial artery was routinely punctured with the Seldinger method placed into the 6F arterial sheath. The infarction-related vessels were determined by multi-projection angle selective coronary angiography using the Judkins method with a cardiovascular imaging machine. Judgment criteria for infarcted relative artery (IRA) were: (1) visible thrombus shadow; (2) visible ulcers formed by plaque detachment; (3) judgment of “culprit blood vessel”—ST-segment changes in the corresponding leads of the ECG and abnormal segment motion of the left ventricular wall. Patients with anterior or anterior septal myocardial infarction due to left coronary artery occlusion were defined as “Group A.” Patients with inferior wall or right ventricular myocardial infarction due to right coronary artery occlusion were defined as “Group B.” Healthy controls were defined as three coronary vascular stenosis <50% as “Group C.” The typical ECG and angiographic findings of anterior wall infarction and inferior wall infarction are shown in Figure 1.
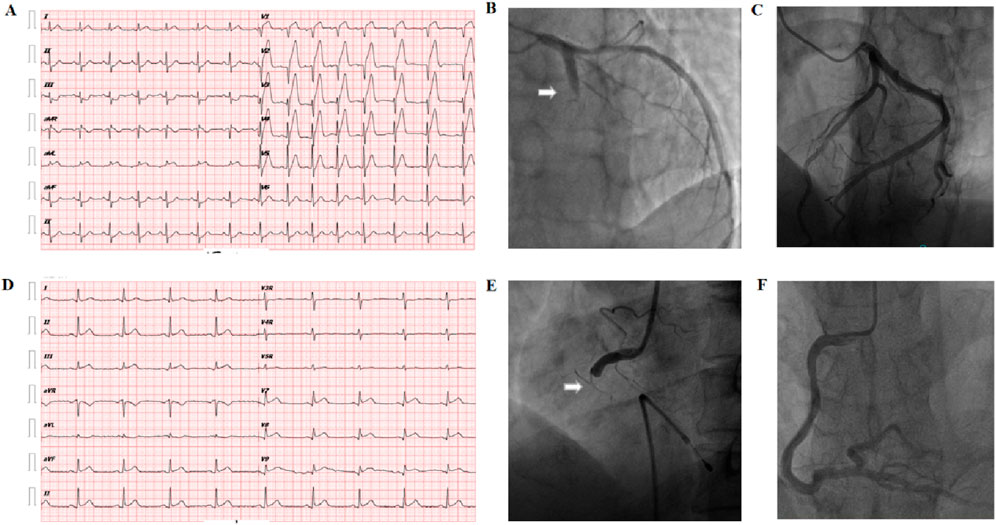
Figure 1. Diagnosis of the culprit vessel of AMI. (A) Abnormal Q waves in the V1–V4 chest leads and extensive ST-segment elevation in the anterior leads on the body surface electrocardiogram suggest acute anterior myocardial infarction. (B) Arrow: coronary angiography shows left acute occlusion of the proximal segment of the anterior descending coronary artery. (C) Left coronary artery of healthy controls: no obvious atherosclerotic plaque formation was found in the anterior descending and circumflex branches. (D) Electrocardiogram on the body surface showed Ⅱ, Ⅲ, avF leads combined ST-segment elevation, suggesting acute inferior wall myocardial infarction. (E) Arrow: acute occlusion of the proximal right coronary artery; (F) right coronary artery of healthy control: no obvious atherosclerotic plaque formation in the whole right coronary artery.
2.3 Collection of blood samples and clinical data
After successful radial artery puncture, a 5-mL sample of artery blood was immediately placed in a heparin anticoagulant tube, left to stand at room temperature for 30 min, centrifuged at 1200 g for 10 min, and 300 uL of the supernatant was kept and frozen at −80°C thereafter.
Baseline data such as age, gender, height, weight, blood pressure, renal function, liver function, electrolytes, markers of myocardial injury, routine blood test, and cardiac ultrasound examination results were collected for all subjects. The flow chart is shown in Figure 2. The information regarding the collection of clinical samples is as follows. 1) Sample collection: all samples were collected within 12 h of the onset of acute chest pain caused by myocardial ischemia. 2) Medication administration: blood was drawn before coronary angiography, with all patients receiving a loading dose of 300 mg aspirin, 180 mg ticagrelor, and 20 mg rosuvastatin. 3) Reperfusion therapy: all patients underwent emergency coronary angiography, with percutaneous coronary intervention (PCI) performed when necessary.
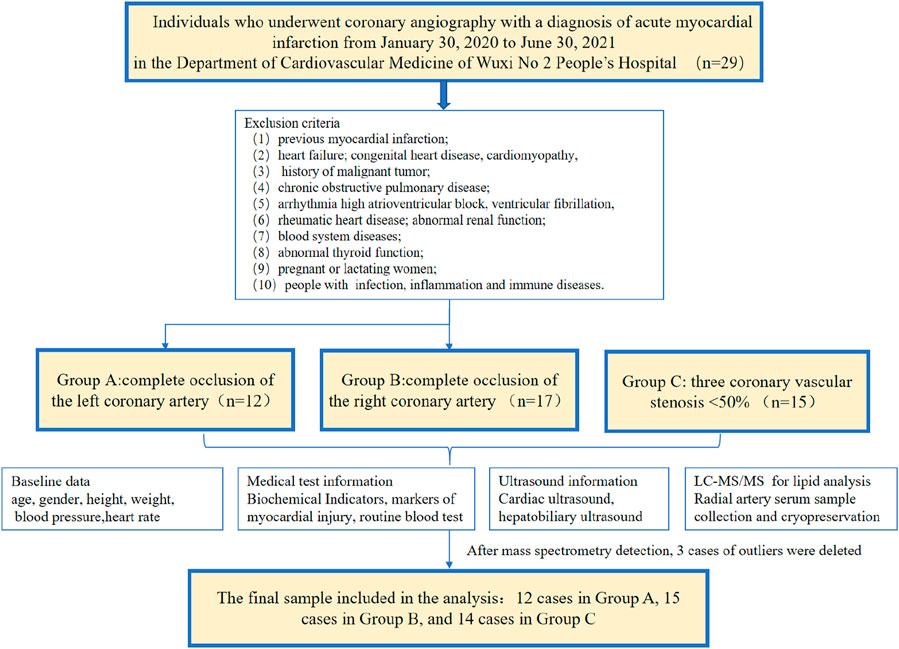
Figure 2. Flowchart of study design.
2.4 Preparation of quality control samples
Equal amounts of samples from each group were mixed as quality control samples, which were used to determine the state of the instrument before injection and to balance the chromatography mass spectrometry system. After every eight real samples were run, a quality control sample was inserted to evaluate the stability of the system during the entire experiment.
2.5 Sample preparation and lipid extraction
Lipids were extracted according to the MTBE method, where samples were first spiked with an appropriate amount of internal lipid standards and then homogenized with 200 µL water and 240 µL methanol. After that, 800 µL of MTBE was added and the mixture was subjected to 20 min ultrasound at 4°C, followed by sitting still for 30 min at room temperature. The solution was centrifuged at 14000 g for 15 min at 10°C, and the upper organic solvent layer was obtained and dried under nitrogen.
2.6 LC-MS/MS method for lipid analysis
Reverse-phase chromatography was selected for LC separation using a CSH C18 column (1.7 µm, 2.1 mm × 100 mm, Waters). The lipid extracts were re-dissolved in 200 µL 90% isopropanol/acetonitrile, centrifuged at 14000 g for 15 min, and 3 µL of the sample was then injected. Solvent A was acetonitrile–water (6:4, v/v) with 0.1% formic acid and 0.1 Mm ammonium formate, and solvent B was acetonitrile–isopropanol (1:9, v/v) with 0.1% formic acid and 0.1 Mm ammonium formate. The initial mobile phase was 30% solvent B at a flow rate of 300 μL/min. It was held for 2 min and then linearly increased to 100% solvent B in 23 min, followed by equilibrating at 5% solvent B for 10 min.
Mass spectra were acquired by Q-Exactive Plus in positive and negative mode. ESI parameters were optimized and preset for all measurements as follows: source temperature, 300°C; capillary temp, 350°C; ion spray voltage was set at 3000V; S-Lens RF level was set at 50%; scan range of the instruments was set at m/z 200–1800.
2.7 Data preprocessing and annotation
The data were normally distributed and homoskedastic. One-way analysis of variance (one-way ANOVA) was used to identify the significantly changed (p < 0.05) lipid metabolites among the three groups. If a significant difference was observed, we used the Bonferroni post hoc test to check which two groups differed significantly. A principal component analysis (PCA) model was used to observe the overall distribution trend and degree of difference between the three groups, providing a comprehensive view of clustering trends and outliers, and then a partial least-squares discriminant analysis (partial least-squares) was used. The orthogonal partial least squares discriminant analysis (OPLS-DA) model was performed to visualize the discrimination between the different groups. Lipid metabolites with variable importance in projection (VIP) value >1 were viewed as the differential lipid metabolites. Markedly changed lipid metabolites identified by both one-way ANOVA and OPLS-DA model were viewed as the key differential lipid metabolites. Meanwhile, we used a hierarchical clustering algorithm to investigate whether these key differential lipid metabolites could correctly cluster the samples. A receiver operating characteristic (ROC) curve was used to evaluate the diagnostic efficiency of the selected differential lipid molecules. Finally, if one key lipid metabolite was also significantly changed between the three groups (P value ≤ 0.05, one-way ANOVA; VIP>1, OPLS-DA; AUC>0.8, ROC), then this could be ultimately selected as candidate biomarker. We use two-factor correlation analysis to judge the linear relationship between two variables. When the P value ≤ 0.05, it was considered statistically different. When the Pearson correlation was 0.4–0.6, the two factors were considered to have a moderate degree of correlation, 0.6–0.8 was considered strongly correlated, and 0.8–1.0 was considered very strongly correlated.
3 Results
3.1 Baseline characteristics of the study population
The clinical characteristics of the participants are shown in Table 1. The study population comprised 41 individuals: 12 in Group A (age 60.25 ± 2.84 years), 15 in Group B (age 63.94 ± 2.98 years), and 14 in Group C (age 55.29 ± 4.81 years). The comparison showed that there was no statistical difference in gender ratio, age, renal function, blood glucose level, electrolytes, diastolic blood pressure, and other indicators among the three groups of subjects, while systolic blood pressure, blood lipid metabolism-related APOA, myocardial injury-related indicators, left ventricular ejection fraction, and inflammation-related indicators (leukocytes, neutrophils, lymphocytes, neutrophils/lymphocytes, and high-sensitivity C-reactive protein) were statistically different (P > 0.05).
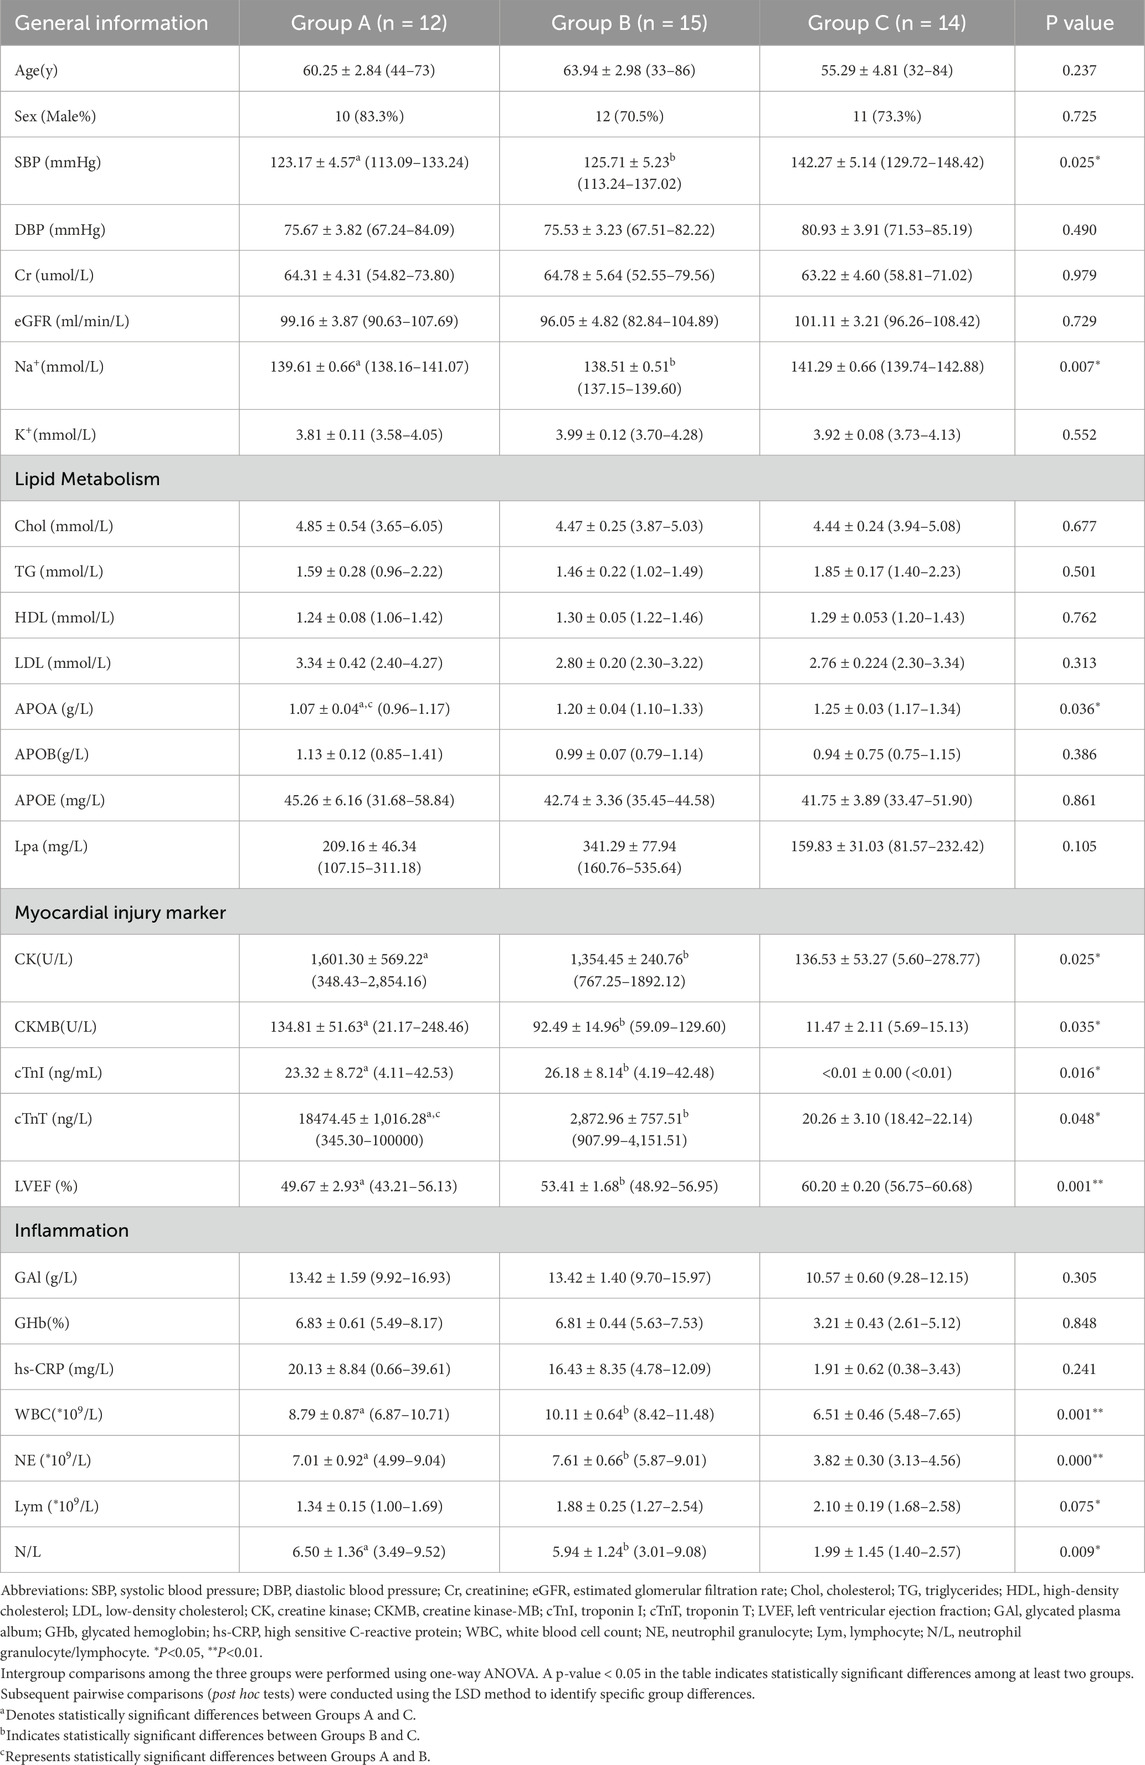
Table 1. Clinical characteristics of the participants in the three groups.
3.2 Lipid composition analysis of lipid metabolites
The lipid profiles of the 12 participants with AMI due to left coronary artery occlusion, 15 participants with AMI due to right coronary artery occlusion, and the 14 participants with normal coronary arteries were analyzed. In total, 20 lipid classes and 1,355 signals were obtained after data processing, as described in “Methods” above. Differential lipid molecules were defined as the fold change (FC) > 1.5 or <0.67, P value < 0.05. The differentially expressed lipid molecules are shown in Table 2.
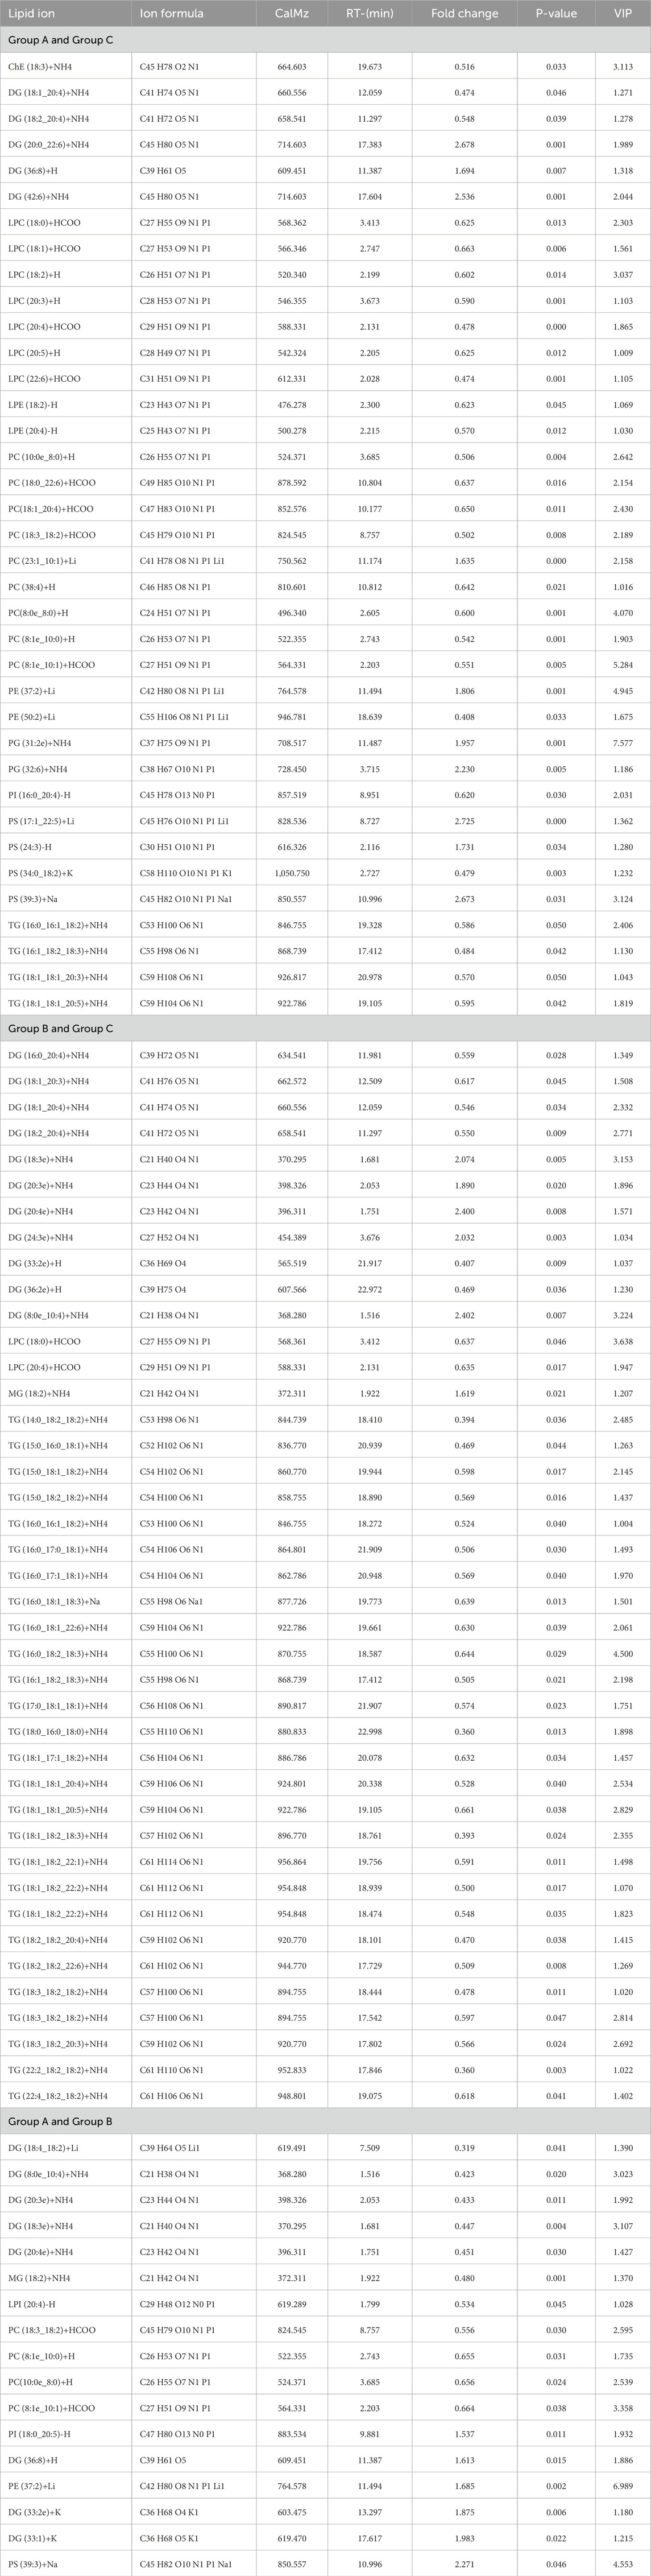
Table 2. Change of lipids between different groups.
The main lipid composition and content distribution range of the sample was investigated through lipid composition analysis, of which Figures 3A, B show the results. The differences in lipid subclass content among the left coronary artery occlusion group, right coronary artery occlusion group, and control group were quantitatively analyzed and presented as a histogram. Through comprehensive lipidomic profiling of 1,355 lipid species, we identified 93 differentially expressed lipid molecules (Figure 3C volcano plot). Compared with group C, significantly changed lipid molecules caused by left or right coronary artery occlusion can be clearly observed. The left side of the dotted line represents significantly down-regulated expression, while the right side of the dotted line represents significantly up-regulated expression (P < 0.05).
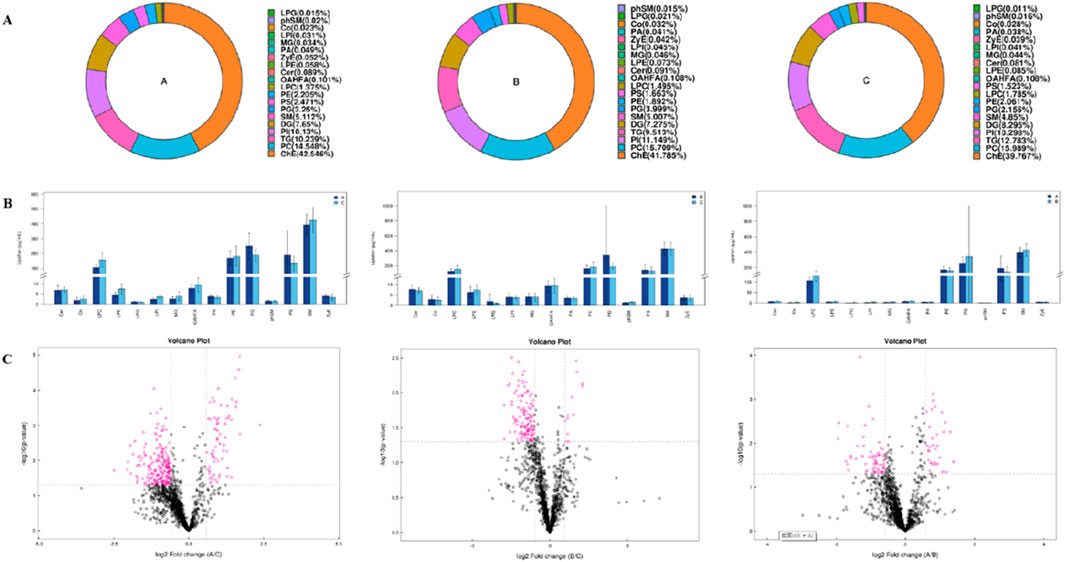
Figure 3. Univariate statistical analysis of lipid metabolites. (A) Ring diagram of lipid subclass composition of each group. (B) Histogram of differences in lipid subclass content between Groups A and C, Groups B and C, and Groups A and B. (C) Volcano plot of differential lipid molecules between Groups A and C, Groups B and C, and Groups A and B.
3.3 Multidimensional statistical analysis of lipid metabolites
We used PCA to examine grouping trends and outliers as an unsupervised data analysis method. In the PCA plot, we observed a clear separation trend in the left coronary artery occlusion group, the right coronary artery occlusion group, and the normal group (Supplementary Figure S1). At the same time, the quality control samples were closely clustered, which also indicated that the instrument was reproducible throughout the analysis period. Pearson’s correlation analysis was performed on the QC samples. The experimental results show that the correlation coefficients between QC samples are all above 0.9, indicating that the experiment has good repeatability. Due to the relatively high dispersion of human plasma samples, we removed three extreme outliers for subsequent analysis. The scatter plots of the OPLS-DA scores based on these signals show an unambiguous difference among the lipid profiles of Groups A, B, and C (Figures 4A,C,E). Figures 4B, D,and F are the permutation test chart of the OPLS-DA model. As the permutation retention gradually decreases, the R2 and Q2 of the random model gradually decrease, indicating that the original model does not have overfitting and that the model is robust.
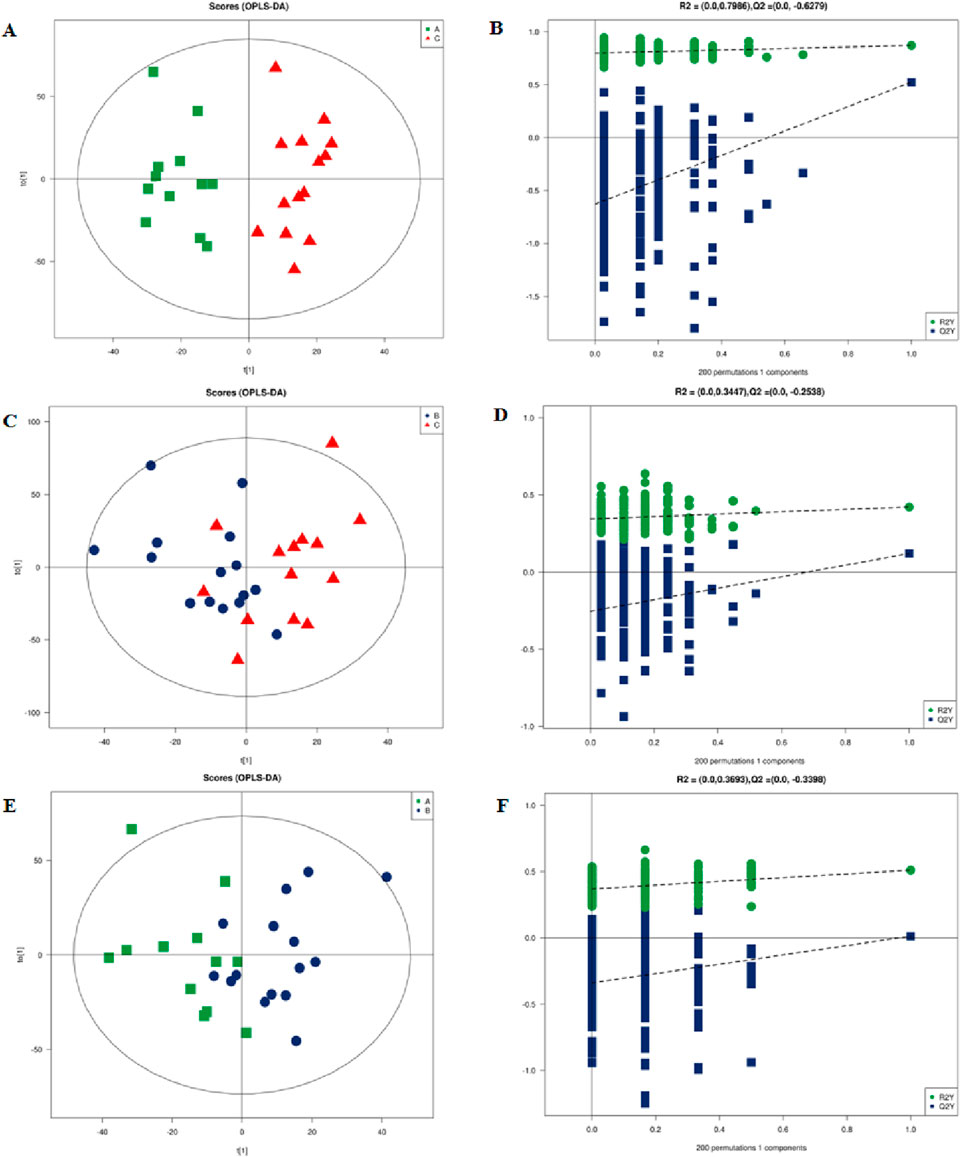
Figure 4. Multidimensional statistical analysis of lipid metabolites. (A) OPLS-DA-based plot of acquired MS spectra from Group A (green) and Group C (red). (B) Score plot of OPLS-DA model for Groups A and C. (C) OPLS-DA-based plot of acquired MS spectra from Group B (blue) and Group C (red). (D) Score plot of the OPLS-DA model for Groups B and C. (E) OPLS-DA-based plot of acquired MS spectra from Group A (green) and Group B (blue). (F) Score plot of OPLS-DA model for Groups A and B: green dots, R2; blue squares, Q2. Green and blue lines represent regression lines for R2 and Q2, respectively. OPLSDA, orthogonal partial least squares discriminant analysis.
3.4 Cluster analysis
In order to evaluate the rationality of differential lipids and to display relationships between samples and differences in lipid expression patterns across samples comprehensively and intuitively, we used the expression levels of significantly different lipids to perform hierarchical clustering on each group of samples. The same group of samples can appear in the same cluster. Lipids in the same cluster have similar expression patterns and may be in relatively close reaction steps in the metabolic process. From Figure 5A, we found that compared with Group C, Group A had significantly lower detection of LPC class. By comparing Groups B and C (Figure 5B), we found that their differences were mainly concentrated in the glycerol class, including monoglyceride (MG), diglyceride (DG), and triglyceride (TG). Figure 5C shows that the phosphatidylcholine (PC) class was highly expressed in Group B, while the phosphatidylethanolamine (PE) class was highly expressed in Group A. In order to visualize the distribution and expression of differential lipid molecules, we made color scale diagrams of the differential lipid molecules between Groups A and C and Groups B and C respectively in Figures 6 and 7, and the differential lipid molecules between Groups A and B in Supplementary Figure S2.
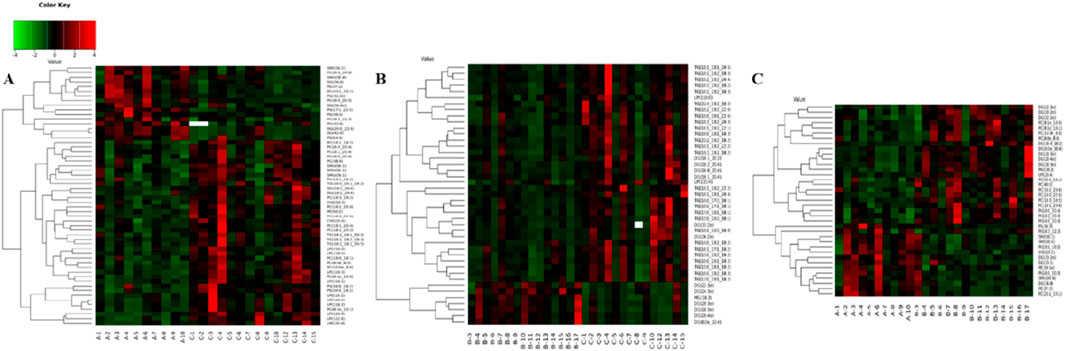
Figure 5. Hierarchical clustering of each sample data set showing differentially expressed lipids. Color is proportional to the intensity of lipid species changes; red color represents up-regulation, and green represents down-regulation. (A) Group A compared with Group C. (B) Group B compared with Group C. (C) Group A compared with Group B.
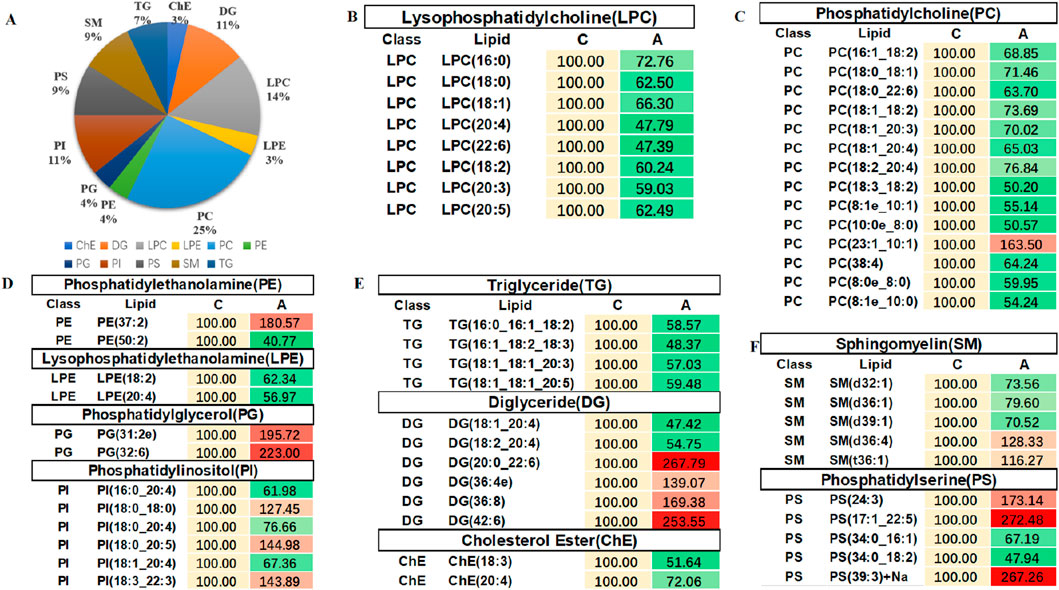
Figure 6. Color scale diagrams of the differential lipid molecules between Groups A and C. (A) Analysis of various lipid components. (B) Trends of LPC. (C) Trends of PC. (D) Trends of PE, LPE, PG, and PI. (E) Trends of TG, DG, and ChE. (F) Trends of SM and PS. LPC, lysophosphatidylcholines; PS, lysophosphatidylcholines; PC, phosphatidylcholine; TG, triglyceride; DG, diglyceride; MG, monoglycerides. PE, phosphatidylethanolamine; des. LPE, lysophosphatidylethanolamine; PG, phosphatidylglycerol; PI, phosphatidylinositol; ChE, cholesterol ester; SM, sphingomyelin.
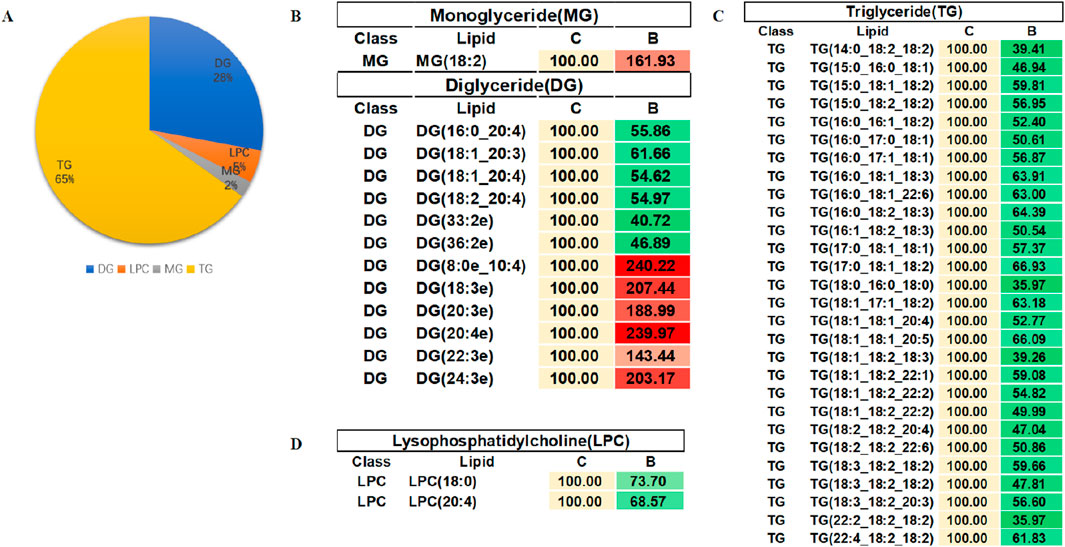
Figure 7. Color scale diagrams of differential lipid molecules between Groups B and C. (A) Analysis of various lipid components. (B) Trends of MG and DG. (C) Trends of TG. (D) Trends of LPC. LPC, lysophosphatidylcholines; TG, triglyceride; DG, diglyceride; MG, monoglycerides.
3.5 Assessing the diagnostic value of biomarkers
In order to evaluate the diagnostic value of these differential lipid molecules, we constructed a receiver operating curve (ROC) for the 93 differential lipid molecules with FC > 1.5 or <0.67, P value < 0.01. Among the differential lipid molecules between Groups A and C are 27 lipid molecules with an area under the ROC curve>0.8. We selected the top six lipid molecules with an area under the ROC curve >0.9: LPC (20:4,AUC = 0.914), LPC (20:3, AUC = 0.921), PS (17:1_22:5, AUC = 0.929), PC (8:1e_10:0, AUC = 0.964), PC (8:1e_10:1, AUC = 0.964), PC (23:1_10:1, AUC = 0.943), mainly in the LPC, PS, DG, PC classes (Figure 5A). Among the differential lipid molecules between Groups B and C are nine lipid molecules with ROC curve>0.8, the top six being TG (22:2_18:2_18:2, AUC = 0.821), MG (18:2, AUC = 0.811), DG (24:3e, AUC = 0.816), DG (18:3e, AUC = 0.816), DG (20:4e, AUC = 0.842), DG (8:0e_10:4, AUC = 0.829), mainly in the MG, DG, and TG classes. There are also differences in lipid molecules between patients with left coronary artery occlusion and those with right coronary artery occlusion; these six lipid molecules with an area under the ROC curve>0.8 are MG (18:2, AUC = 0.921), PE (37:2, AUC = 0.886), DG (8:0e_10:4, AUC = 0.85), DG (20:3e, AUC = 0.843), DG (18:3e, AUC = 0.893), DG (33:1, AUC = 0.879), mainly in the MG, PE, and DG classes. These areas under the ROC curve are shown in Figures 8A–C. We also found that some of the lipid molecules also overlapped between Groups A and C and Groups B and C This lipid molecule was LPC (20:4). Since the expression of LPC (20:4) in the two disease groups (A and B) showed a downward trend (P < 0.05, FC < 0.67, VIP > 1), we used it as a biomarker for the diagnosis of myocardial infarction.
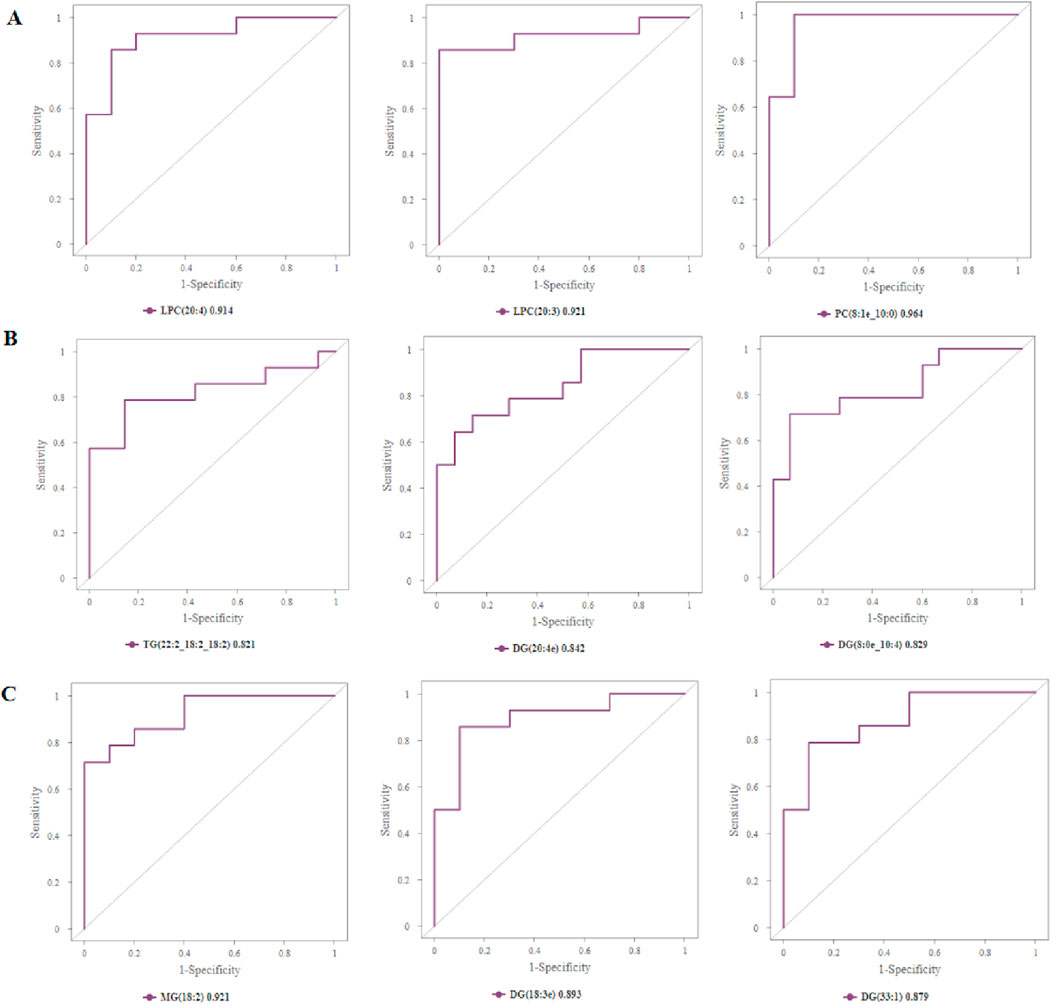
Figure 8. Assessing the diagnostic value of biomarkers. (A) Top 3 differential lipid molecules between Groups A and C with an area under the ROC curve >0.9, and the expressions of LPC, PS, and PC in Groups A and C. (B) Top 3 differential lipid molecules between Groups B and C with an area under the ROC curve >0.8, and expressions of TG, DG in Groups B and C. (C) Top 3 differential lipid molecules between Groups A and B with an area under the ROC curve >0.8, and expressions of MG, DG in Groups A and B. LPC, lysophosphatidylcholines; PS, lysophosphatidylcholines; PC, phosphatidylcholine; TG, triglyceride; DG, diglyceride; MG, monoglycerides.
3.6 Correlation analysis of lipid molecules
Since there is no evidence that lipid molecules are directly involved in the GO (Gene Ontology Analysis)/KEGG (Kyoto Encyclopedia of Genes and Genomes Pathway Analysis) pathway analysis, we produced a heat map of the interactions of lipid molecules to analyze the possible network of relationships between these molecules. In this study, we focused on lipid molecules meeting the following criteria: fold change (FC) > 1.5 or <0.67, P-value <0.01 and area under the curve (AUC) > 0.8. 1). Group A vs. C (Figure 9A): correlation analysis of differential lipids revealed a positive association between LPC (20:4) and both LPC (22:6) and LPE (20:3). 2). Group B vs. C (Figure 9B): the interaction network was less complex, with DG (8:0e_10:4) showing positive correlations with DG (20:4e), DG (20:3e), MG (18:2), DG (22:3e), and DG (24:3e). Additionally, LPC (20:4) was positively correlated with LPC (18:0). 3). Group A vs. B (Figure 9C): a significant positive correlation was observed between PE (37:2) and PC(23:1_10:1). These lipid molecules seem to be shining stars in a splendid galaxy, waiting for us to connect the related stars into a constellation with beautiful stories. Network diagram of differential lipid molecules between Groups A and C, Groups B and C, Groups A and B (p < 0.05, VIP > 1) were shown in Figures 9D–F.
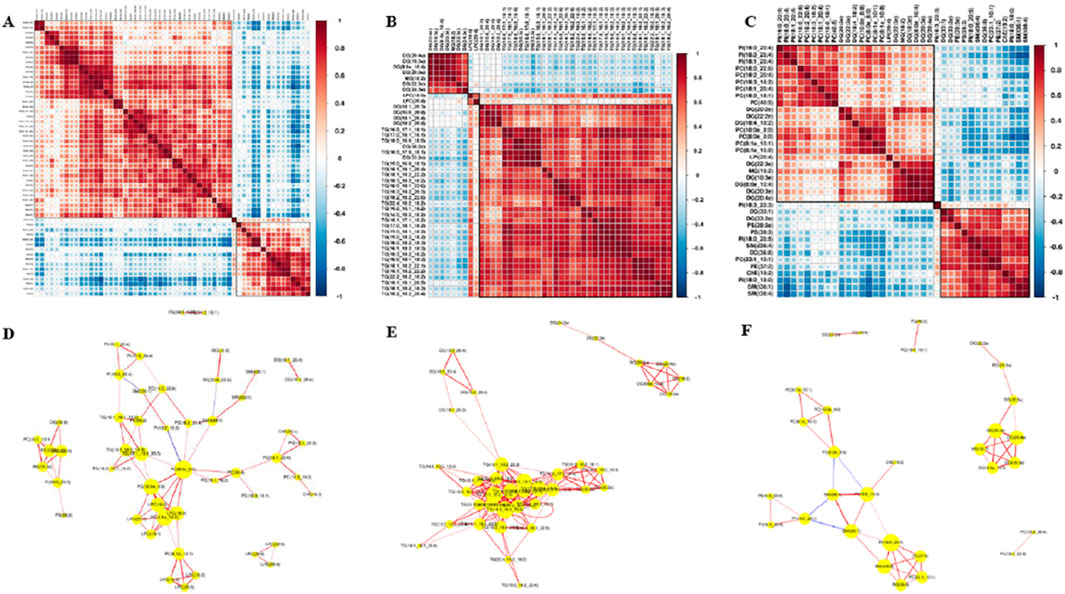
Figure 9. Correlation analysis of lipid molecules. (A) Lipid–lipid correlation matrix of differential lipid molecules between Groups A and C. (B) Lipid–lipid correlation matrix of differential lipid molecules between Groups B and C. (C) Lipid–lipid correlation matrix of differential lipid molecules between Groups A and B, implying the metabolic proximities; red color represents up-correlation, and blue represents down-correlation. (D) Network diagram of differential lipid molecules between Groups A and C (p < 0.05, VIP>1). (E) Network diagram of differential lipid molecules between Groups B and C. (F) Network diagram of differential lipid molecules between Groups A and B.
3.7 Bivariate correlation analysis between differential lipids and clinical indicator
We were pleasantly surprised to find that LPC (20:4) was positively correlated with patients’ left ventricular ejection fraction (EF value) —the lower the content of LPC (20:4), the lower the left heart ejection fraction and the worse the heart function and clinical prognosis (Figure 10A). The association between APOA, LPC species, and cardiac function was consistent with our clinical findings. APOA—the only significantly altered clinical biomarker in our analysis—demonstrated a strong positive correlation with LPC (20:4) (Figure 10B), suggesting potential interaction between lysophosphatidylcholines (LPCs) and lipoprotein metabolism.
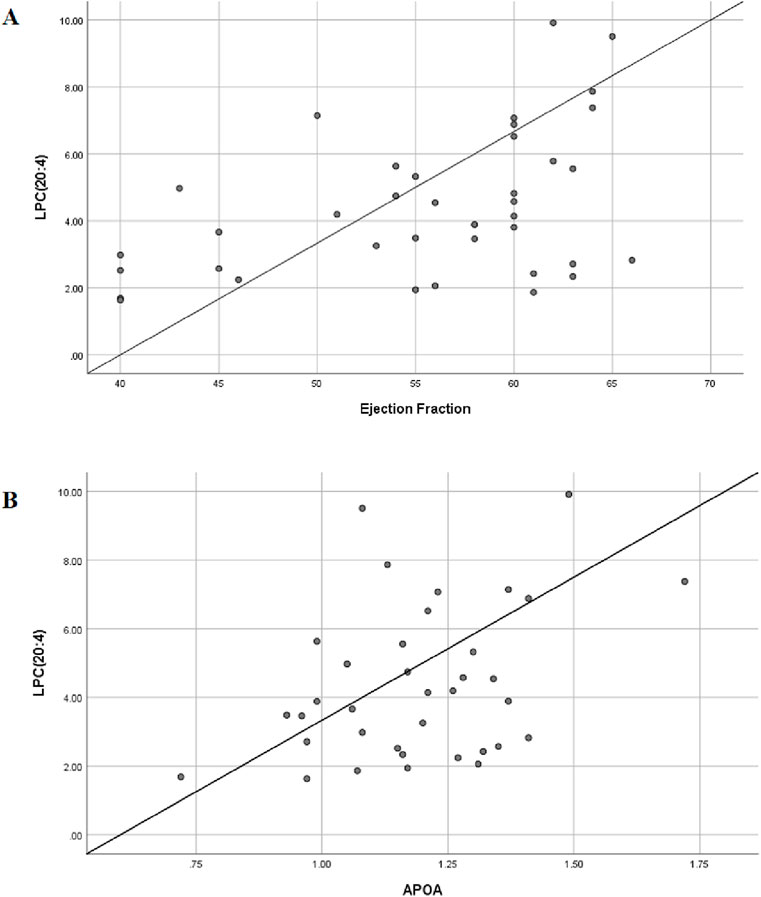
Figure 10. Bivariate correlation analysis between differential lipids and clinical indicator. (A) Scatter diagram of correlation between LPC(20:4) and left ventricular ejection fraction; Pearson coefficient is 0.437. (B) Scatter diagram of correlation between LPC(20:4) and serum APOA; Pearson coefficient is 0.471.
To further explore this relationship, we expanded our correlation analysis to include all detected LPC species and ejection fraction (EF) values. The results revealed significant associations between multiple LPCs and cardiac function parameters (Table 3), reinforcing the potential role of the LPC metabolism in cardiovascular pathophysiology. A moderate degree of correlation was considered when the Pearson correlation coefficient was in the range of 0.4–0.6. We believe that this trend will become more pronounced when the sample size is further expanded in the future.
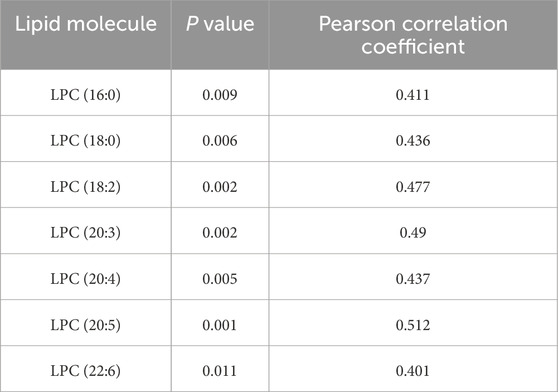
Table 3. Correlation analysis between with all obtained LPC and the EF value.
4 Discussion
In this study, we performed a comprehensive lipidomic analysis in human artery plasma to investigate lipidomic features from healthy controls and AMI patients with different infarct regions. Subsequent study found significant differences in lipidomics, both between myocardial infarctions with different infarct regions and between myocardial infarction and healthy controls, implying a uniquely altered lipid profile in different locations of AMI. A total of 1,335 molecules were identified, and 93 lipid molecules were differential to distinguish Groups A from C, B from C, and A from B. These results suggest that disordered lipid homeostasis may be related to the onset of AMI.
Atherosclerosis is generally regarded as a chronic inflammatory disease (Lusis, 2000). As we know, arterial blood flow is fast with high oxygen content, and lipid molecules in arterial blood are oxidatively stressed. The occurrence and development of inflammation is closely related to abnormal lipid metabolism and oxidative stress, which are the common pathophysiological changes in the development of atherosclerosis. Therefore, we chose arterial rather than venous plasma for this study.
The anterior descending branch (LAD) runs along the upper ventricular septum (anterior interventricular sulcus) of the right ventricle and the left ventricle, going around the apical notch to the posterior interventricular sulcus. The blood supply area is large, and when it is occluded, the cardiac diastolic and systolic force is significantly reduced or uncoordinated (Hubers et al., 2021). The myocardium supplied by the right coronary artery (RCA) includes the right ventricle. Occlusion of the RCA causes right ventricular infarction. The sharp decrease in right ventricular systolic function can easily lead to a decrease in the left ventricular return blood volume, insufficient filling of the left ventricle, and a decrease in cardiac output (Libby, 2013). Therefore, considering the different function of the left and right coronaries, we grouped patients according to the different branches of the coronary artery.
Through in-depth analysis of clinical data, our study demonstrated that inflammation-related leukocytes, neutrophils, NLR, and hs-CRP in the myocardial infarction patient group were significantly higher than those in the normal group. Numerous studies have shown that atherosclerosis is an inflammatory disease (Sanz and Fayad, 2008). The inflammatory process accompanying AMI is very complex and involves many acute phasing proteins and cell signaling molecules (Knol et al., 2007). An autopsy study of 17 patients who died due to AMI found that CRP was more concentrated in the infarcted cardiac tissue, suggesting that CRP may promote myocardial injury and lead to poor prognosis after AMI (Lagrand et al., 1997). Activated platelets are the core elements of coronary occlusive thrombus in the occurrence of AMI. These activated platelets can bind to WBC and accelerate the occlusive thrombus formation of large coronary arteries and microvessels (Nash, 1994). The larger the infarct size of AMI, the more the myocardial damage, the stronger the inflammatory response, and the higher the WBC count (Grzybowski et al., 2004). Our study also confirmed that hs-CRP is an easily accessible but significant indicator reflecting the inflammatory state of the body. Moreover, lysophosphatidylcholines (LPCs) are highly related to inflammation response, which is also the reason why we choose LPC (20:4) as biomarker metabolites.
This study also found that systolic blood pressure was significantly lower in patients with AMI than in normal controls. In severe AMI patients, the rapid decrease in arterial blood pressure is generally caused by left ventricular dysfunction, which further aggravates myocardial ischemia and necrotic injury (Detollenaere et al., 1993).
Recent studies documenting significant changes in the metabolic profiles of plasma and urinary lipids in cardiovascular disease suggest that these profiles represent potential biomarkers for improving diagnostic efficiency (Lu et al., 2017; Anroedh et al., 2018; Solati and Ravandi, 2019). Lipidomics is a systems-based study of all lipids (Watson, 2006) that has been defined as the full characterization of lipid molecular species and their biological roles (Roberts et al., 2008). A recent cross-sectional study identified 8,9-DiHETrE, a bioactive oxylipin, as being significantly associated with cardiovascular disease (CVD) risk (Caligiuri et al., 2017). This finding adds to growing evidence that implicates oxylipin-mediated pathways in cardiovascular pathophysiology (Caligiuri et al., 2017). There is accumulating evidence that bioactive lipids play important roles in ischemic cardiovascular disease. In the following, we investigate the pathophysiological roles of the differential lipids screened out.
Of the entire lipid subclass level, the LPC class was more significantly reduced in the AMI group (Groups A and B) than that in the normal control group (Group C). ROC curve analysis demonstrated that lysophosphatidylcholine (LPC) species exhibited moderate diagnostic efficacy, with AUC values ranging from 0.914 to 0.921 (Figure 8). These findings suggest that LPC metabolites may serve as potential biomarkers. Since the expression of LPC (20:4) showed a downward trend in both AMI groups (P < 0.05, FC < 0.67, VIP>1) and LPC (20:4) is positively correlated with left ventricular ejection fraction and APOA, we considered LPC (20:4) to be an important biomarker in the pathophysiology of myocardial infarction. LPCs, a type of phospholipids, have a variety of physiological functions and are closely related to metabolic diseases such as diabetes, atherosclerosis, dyslipidemia, and cardiovascular diseases (Schmitz and Ruebsaamen, 2010; Domeij et al., 2013). LPCs exist in small or trace amounts in cell membranes and tissues; they are cytotoxic, causing endothelial cell degeneration, necrosis, and shedding. LPCs can regulate the metabolism of low-density lipoprotein and participate in atherosclerotic lesions caused by sterols. Most recent studies have found that lower LPC plasma levels are associated with unfavorable disease outcomes. Decreased levels of LPC were observed in diabetes (Barber et al., 2012), rheumatoid arthritis (Fuchs et al., 2005), schizophrenia (Wang et al., 2019), polycystic ovary syndrome (Jiang et al., 2019), Alzheimer’s disease (Grösgen et al., 2011), aging (Semba et al., 2019), pulmonary arterial hypertension (Chen et al., 2020), asthma (Baurecht et al., 2013), and liver cirrhosis, where they were associated with increased mortality risk (Krautbauer et al., 2016). These findings strongly corroborate our principal observation that circulating LPC levels are significantly reduced in AMI patients compared to controls. LPC exhibits complex, context-dependent effects on vascular biology. Notably, it demonstrates paradoxical atheroprotective properties through its capacity to mediate cholesterol efflux from lipid-laden macrophages—a mechanism that mirrors HDL’s cardioprotective function (Hou et al., 2007). This finding suggests that LPC may participate in reverse cholesterol transport pathways.
Concurrently, LPC modulates vascular homeostasis by influencing the nitric oxide (NO)–endothelin-1 equilibrium, thereby regulating vascular tone (Gupta et al., 2020). In contrast to these potentially beneficial effects, LPC functions as a potent chemoattractant, recruiting monocytes (Quinn et al., 1988), natural killer cells (Jin et al., 2005), and T lymphocytes (Radu et al., 2004) to inflammatory foci. This chemotactic activity may exacerbate vascular inflammation under certain pathophysiological conditions. Coagulation is a complex process, and LPC was found to not just inhibit platelet aggregation but also to reduce tissue factor activity in monocytes, thereby attenuating coagulation in atherosclerotic lesions (Engelmann et al., 1999). Finally, the ability of LPC to bind C-reactive protein (CRP) and therefore suppress its pro-atherogenic effect on macrophages and delay the progression of atherosclerosis was reported (Chang et al., 2012). Moreover, LPC administration increased coronary blood flow as well as decreasing mean arterial pressure and total vascular resistance in rabbits (Wolf et al., 1991). This could even serve as a promising therapeutic avenue to improve myocardial perfusion and the early correction of myocardial ischemia. Coronary atherosclerosis serves as the pathological foundation of coronary artery disease (CAD). Oxidized low-density lipoprotein (ox-LDL) is one of the primary contributors to atherosclerotic lesions (Steinberg, 2009). Its bioactive component, LPCs, is not only involved in the initiation and progression of atherosclerosis but also closely associated with the early diagnosis and risk assessment of CAD. Galle and Jan were the first to investigate the effects of ox-LDL on vasoconstriction. They discovered that ox-LDL enhances angiotensin II (AngII)-induced vasoconstriction by activating the RhoA signaling pathway. Further studies revealed that LPC fully replicates the causal effects of ox-LDL (Galle et al., 2003). Therefore, we suggest that LPCs should be recognized as important homeostatic mediators involved in all stages of vascular inflammation through their effect on vascular reactivity, endothelial activation and infiltration, the activation of immune cells, and most importantly, on the onset and progression of AMI.
Intergroup comparisons demonstrated a predominant representation of the DG class, particularly in Group B versus C and Group B versus A. DG (8:0e_10:4) levels were significantly higher in Group B relative to the normal controls and Group A (p < 0.05). Diacylglycerol (DAG) is a bioactive lipid that has been shown to reduce fasting serum triglyceride (TG) levels, attenuate postprandial hypertriglyceridemia, decrease glycated hemoglobin (HbA1c) levels in patients with type 2 diabetes mellitus (T2DM), and inhibit ectopic lipid accumulation in both animal models and humans. (Murase et al., 2001). Some have proposed that replacing TG with DAG in the diet is beneficial for the control diabetes and preventing the occurrence of arteriosclerosis and related diseases (Taguchi et al., 2000). Results also show that DAG can effectively improve the lipoprotein status and the ratio of visceral fat and body fat in patients with genetic variants of lipid transporters (Yanagisawa et al., 2003). By increasing the β-oxidation of fatty acids (Murata et al., 1997), affecting the expression of genes related to lipid metabolism, and over-regulating the co-activators of the PPAR family (Murase et al., 2002), DAG can control body weight and reduce visceral fat content. Current studies show that the lipid metabolism in gut microbes may be associated with atherosclerosis and that elevated levels of phosphatidylcholine (PC) are positively correlated with the risk of cardiovascular disease. This phenomenon may be associated with trimethylamine N-oxide (TMAO), a gut microbiota-dependent metabolite derived from phosphatidylcholine metabolism. High levels of TMAO in the body can affect the cholesterol metabolism, promote the formation of atherosclerotic plaques, and aggravate lipid metabolism disorders (Wang et al., 2011). Phosphatidylcholine is the main food source for the formation of TMAO, and it serves as the primary dietary precursor for trimethylamine N-oxide (TMAO) formation; TMAO has been identified as a key mediator in phosphatidylcholine-induced cardiovascular disease pathogenesis (Koeth et al., 2013; Tang et al., 2013).
5 Conclusion
This study demonstrated that lipid metabolism in patients with AMI in different infarct regions was significantly changed compared with normal controls. After ROC screening, those with higher diagnostic values belonged to the following categories: LPC, PS, PC, PE, DG, and MG. We finally focused on the LPC (20:4) molecule as a biomarker metabolite. These lipidomics findings provide valuable insights for the further investigation of potential biomarkers and pathological mechanisms underlying AMI.
Given the limited sample size in this study, larger-scale validation studies are required to confirm the functional roles of differentially expressed lipid species in AMI patients across various stages of coronary artery disease. The standardization of mass spectrometry-based quantification and analytical methodologies is essential to enable high-throughput cohort analyses. Such standardization will facilitate a more precise understanding of the pathophysiological contributions of individual lipid molecules in AMI. In subsequent research, we will establish a mouse myocardial infarction model by ligating the left anterior descending coronary artery. We will specifically assess changes in LPC (20:4) content and its effects on inflammatory and immune signaling within cardiomyocytes following ischemia/hypoxia. In addition, we will verify the function of LPC (20:4) in myocardial ischemia.
Data availability statement
The datasets presented in this article are not readily available; the data that support the findings of this study are available from the corresponding author upon reasonable request. Requests to access the datasets should be directed to Xing Li,bGl4aW5nODgwMjE2QDEyNi5jb20=.
Ethics statement
The collection of plasma samples from participants was approved by the Ethics Committee of the Wuxi No. 2 People’s Hospital (No. Y-9). All participants agreed to plasma collection and provided written informed consent. All procedures followed were in accordance with the ethical standards of the responsible committee on human experimentation (institutional and national) and with the Helsinki Declaration of 1975, as revised in 2000 (5). Informed consent was obtained from all patients for inclusion in the study. The studies were conducted in accordance with local legislation and institutional requirements. Participants provided their written informed consent to participate in this study. Written informed consent was obtained from individuals for the publication of any potentially identifiable images or data included in this article.
Author contributions
HC: Project administration, Writing – original draft. QZ: Methodology, Writing – original draft. AZ: Methodology, Writing – original draft. LZ: Conceptualization, Supervision, Writing – review and editing. XL: Conceptualization, Funding acquisition, Supervision, Writing – review and editing.
Funding
The author(s) declare that financial support was received for the research and/or publication of this article. This research was supported by grants from Top Talent Support Program for young and middle-aged people of Wuxi Health Committee (BJ2020030, HB2023026).
Acknowledgments
We would like to thank Shanghai Applied Protein Technology Co. Ltd for technical support.
Conflict of interest
The authors declare that the research was conducted in the absence of any commercial or financial relationships that could be construed as a potential conflict of interest.
Generative AI statement
The author(s) declare that no Generative AI was used in the creation of this manuscript.
Publisher’s note
All claims expressed in this article are solely those of the authors and do not necessarily represent those of their affiliated organizations, or those of the publisher, the editors and the reviewers. Any product that may be evaluated in this article, or claim that may be made by its manufacturer, is not guaranteed or endorsed by the publisher.
Supplementary material
The Supplementary Material for this article can be found online at: https://www.frontiersin.org/articles/10.3389/fcell.2025.1575431/full#supplementary-material
SUPPLEMENTARY FIGURE S1 | PCA of Groups A, B, C, and QC. Two outliers (black arrow) in Group B and one (blue arrow) in Group C were excluded, and 41 samples were finally included for analysis. PCA, principal component analysis; QC, quality control.
SUPPLEMENTARY FIGURE S2 | Color scale diagrams of the differential lipid molecules between Groups A and B. (A) Analysis of various lipid components. (B) Trends of DG. (C) Trends of PC. (D) Trends of ChE, PE, PS, and SM. (E) Trends of LPI. (F) Trends of PI. PS, lysophosphatidylcholines; PC, phosphatidylcholine; DG, diglyceride; PE, phosphatidylethanolamine; PI, phosphatidylinositol; ChE, cholesterol ester; SM, sphingomyelin; LPI, lysophosphatidylinositol.
References
Al-Rasadi, K., Al-Zakwani, I., Alsheikh-Ali, A. A., Almahmeed, W., Rashed, W., Ridha, M., et al. (2018). Prevalence, management, and outcomes of familial hypercholesterolemia in patients with acute coronary syndromes in the arabian gulf. J. Clin. Lipidol. 12 (3), 685–692.e2. doi:10.1016/j.jacl.2018.02.003
Anroedh, S., Hilvo, M., Akkerhuis, K. M., Kauhanen, D., Koistinen, K., Oemrawsingh, R., et al. (2018). Plasma concentrations of molecular lipid species predict long-term clinical outcome in coronary artery disease patients. J. Lipid Res. 59 (9), 1729–1737. doi:10.1194/jlr.P081281
Arnett, D. K., Blumenthal, R. S., Albert, M. A., Buroker, A. B., Goldberger, Z. D., Hahn, E. J., et al. (2019). 2019 ACC/AHA guideline on the primary prevention of cardiovascular disease: a report of the American college of cardiology/american heart association task force on clinical practice guidelines. Circulation 141 (4), e60. doi:10.1161/CIR.0000000000000678
Barber, M. N., Risis, S., Yang, C., Meikle, P. J., Staples, M., Febbraio, M. A., et al. (2012). Plasma lysophosphatidylcholine levels are reduced in obesity and type 2 diabetes. PLoS ONE 7, e41456. doi:10.1371/journal.pone.0041456
Baurecht, H., Stückler, F., Krumsiek, J., Gieger, C., Heinrich, J., Kabesch, M., et al. (2013). Integrative genetic and metabolite profiling analysis suggests altered phosphatidylcholine metabolism in asthma. Allergy Eur. J. Allergy Clin. Immunol. 68, 629–636. doi:10.1111/all.12110
Caligiuri, S., Aukema, H. M., Ravandi, A., Lavallée, R., Guzman, R., and Pierce, G. N. (2017). Specific plasma oxylipins increase the odds of cardiovascular and cerebrovascular events in patients with peripheral artery disease. Can. J. Physiol. Pharmacol. 95 (8), 961–968. doi:10.1139/cjpp-2016-0615
Chang, M.-K., Hartvigsen, K., Ryu, J., Kim, Y., and Han, K. H. (2012). The pro-atherogenic effects of macrophages are reduced upon formation of a complex between C-reactive protein and lysophosphatidylcholine. J. Inflamm. 9, 42. doi:10.1186/1476-9255-9-42
Chen, C., Luo, F., Wu, P., Huang, Y., Das, A., Chen, S., et al. (2020). Metabolomics reveals metabolite changes of patients with pulmonary arterial hypertension in China. J. Cell. Mol. Med. 24, 2484–2496. doi:10.1111/jcmm.14937
Detollenaere, M. S., Duprez, D. A., De Buyzere, M. L., Vandekerckhove, H. J., De Backer, G. G., and Clement, D. L. (1993). Autonomic imbalance in the recovery period after myocardial infarction. Eur. Heart J. 14 (9), 1189–1194. doi:10.1093/eurheartj/14.9.1189
Domeij, H., Hua, X., Su, J., Bäcklund, A., Yan, Z., Frostegård, A. G., et al. (2013). Annexin A5 inhibits atherogenic and pro-inflammatory effects of lysophosphatidylcholine. Prostagl. Other Lipid Mediat. 106, 72–78. doi:10.1016/j.prostaglandins.2013.01.004
Engelmann, B., Zieseniss, S., Brand, K., Page, S., Lentschat, A., Ulmer, A. J., et al. (1999). Tissuefactorexpression of human monocytes is suppressed by lysophosphatidylcholine. Arterioscler. Thromb. Vasc. Biol. 19, 47–53. doi:10.1161/01.atv.19.1.47
Fuchs, B., Schiller, J., Wagner, U., Häntzschel, H., and Arnold, K. (2005). The phosphatidylcholine/lysophosphatidylcholine ratio in human plasma is an indicator of the severity of rheumatoid arthritis: investigations by 31P NMR and MALDI-TOF MS. Clin. Biochem. 38, 925–933. doi:10.1016/j.clinbiochem.2005.06.006
Galle, J., Mameghani, A., Bolz, S. S., Gambaryan, S., Görg, M., Quaschning, T., et al. (2003). Oxidized LDL and its compound lysophosphatidylcholine potentiate AngII-induced vasoconstriction by stimulation of RhoA. J. Am. Soc. Nephrol. 14 (6), 1471–1479. doi:10.1097/01.asn.0000067412.18899.9b
GBD 2017 Causes of Death Collaborators (2018). Global, regional, and national age-sex-specific mortality for 282 causes of death in 195 countries and territories, 1980-2017: a systematic analysis for the global burden of disease study 2017. Lancet 392 (10159), 1736–1788. doi:10.1016/S0140-6736(18)32203-7
Grösgen, S., Riemenschneider, M., Tanila, H., Tanila, H., Grimm, M. O. W., and Hartmann, T. (2011). From brain to food: analysis of phosphatidylcholins, lyso-phosphatidylcholins and phosphatidylcholin–plasmalogens derivates in Alzheimer’s disease human post mortem brains and mice model via mass spectrometry. J. Chromatogr. A 1218, 7713–7722. doi:10.1016/j.chroma.2011.07.073
Grzybowski, M., Welch, R. D., Parsons, L., Ndumele, C. E., Chen, E., Zalenski, R., et al. (2004). The association between white blood cell count and acute myocardial infarction in-hospital mortality: findings from the national registry of myocardial infarction. Acad. Emerg. Med. 11 (10), 1049–1060. doi:10.1197/j.aem.2004.06.005
Gupta, R. M., Libby, P., and Barton, M. (2020). Linking regulation of nitric oxide to endothelin-1: the yin and yang of vascular tone in the atherosclerotic plaque. Atherosclerosis 292, 201–203. doi:10.1016/j.atherosclerosis.2019.11.001
Hou, M., Xia, M., Zhu, H., Wang, Q., Li, Y., Xiao, Y., et al. (2007). Lysophosphatidylcholine promotes cholesterol efflux from mouse macrophage foam cells via PPARgamma-LXRalpha-ABCA1-dependent pathway associated with apoE. Cell biochem. Funct. 25, 33–44. doi:10.1002/cbf.1374
Hubers, S. A., Schirger, J. A., Sangaralingham, S. J., Chen, Y., Burnett, J. C., Hodge, D., et al. (2021). B-type natriuretic peptide and cardiac remodelling after myocardial infarction: a randomised trial. Heart 107 (5), 396–402. doi:10.1136/heartjnl-2020-317182
Jiang, Y., Qi, J., Xue, X., Huang, R., Zheng, J., Liu, W., et al. (2019). Ceramide subclasses identified as novel lipid biomarker elevated in women with polycystic ovary syndrome: a pilot study employing shotgun lipidomics. Gynecol. Endocrinol. 36, 508–512. doi:10.1080/09513590.2019.1698026
Jin, Y., Damaj, B. B., and Maghazachi, A. A. (2005). Human resting CD16-CD16+ and IL-2-IL-12-IL-15- or IFN-α-activated natural killer cells differentially respond to sphingosylphosphorylcholine, lysophosphatidylcholine and platelet-activating factor. Eur. J. Immunol. 35, 2699–2708. doi:10.1002/eji.200526129
Knol, M. J., van der Tweel, I., Grobbee, D. E., Numans, M. E., and Geerlings, M. I. (2007). Estimating interaction on an additive scale between continuous determinants in a logistic regression model. Int. J. Epidemiol. 36 (5), 1111–1118. doi:10.1093/ije/dym157
Koeth, R. A., Wang, Z., Levison, B. S., Buffa, J. A., Org, E., Sheehy, B. T., et al. (2013). Intestinal microbiota metabolism of L-carnitine, a nutrient in red meat, promotes atherosclerosis. Nat. Med. 19 (5), 576–585. doi:10.1038/nm.3145
Krautbauer, S., Eisinger, K., Wiest, R., Liebisch, G., and Buechler, C. (2016). Systemic saturated lysophosphatidylcholine is associated with hepatic function in patients with liver cirrhosis. Prostagl. Other Lipid Mediat 124, 27–33. doi:10.1016/j.prostaglandins.2016.06.001
Lagrand, W. K., Niessen, H. W., Wolbink, G. J., Jaspars, L. H., Visser, C. A., Verheugt, F. W., et al. (1997). C-reactive protein colocalizes with complement in human hearts during acute myocardial infarction. Circulation 95 (1), 97–103. doi:10.1161/01.cir.95.1.97
Lanfear, D. E., Gibbs, J. J., Li, J., She, R., Petucci, C., Culver, J. A., et al. (2017). Targeted metabolomic profiling of plasma and survival in heart failure patients. JACC Heart Fail 5 (11), 823–832. doi:10.1016/j.jchf.2017.07.009
Libby, P. (2013). Mechanisms of acute coronary syndromes and their implications for therapy. N. Engl. J. Med. 368 (21), 2004–2013. doi:10.1056/NEJMra1216063
Lu, J., Chen, B., Chen, T., Guo, S., Xue, X., Chen, Q., et al. (2017). Comprehensive metabolomics identified lipid peroxidation as a prominent feature in human plasma of patients with coronary heart diseases. Redox Biol. 12, 899–907. doi:10.1016/j.redox.2017.04.032
Murase, T., Aoki, M., Wakisaka, T., Hase, T., and Tokimitsu, I. (2002). Anti-obesity effect of dietary diacylglycerol in C57BL/6J mice: dietary diacylglycerol stimulates intestinal lipid metabolism. J. Lipid Res. 43 (8), 1312–1319. doi:10.1194/jlr.M200094-JLR200
Murase, T., Mizuno, T., Omachi, T., Onizawa, K., Komine, Y., Kondo, H., et al. (2001). Dietary diacylglycerol suppresses high fat and high sucrose diet-induced body fat accumulation in C57BL/6J mice. J. Lipid Res. 42 (3), 372–378. doi:10.1016/S0022-2275(20)31661-8
Murata, M., Ide, T., and Hara, K. (1997). Reciprocal responses to dietary diacylglycerol of hepatic enzymes of fatty acid synthesis and oxidation in the rat. Br. J. Nutr. 77 (1), 107–121. doi:10.1079/bjn19970013
Nash, G. B. (1994). Adhesion between neutrophils and platelets: a modulator of thrombotic and inflammatory events? Thromb. Res. 74 (Suppl. 1), S3–S11. doi:10.1016/s0049-3848(10)80002-7
Quinn, M. T., Parthasarathy, S., and Steinberg, D. (1988). Lysophosphatidylcholine: a chemotactic factor for human monocytes and its potential role in atherogenesis. Proc. Natl. Acad. Sci. U. S. A. 85, 2805–2809. doi:10.1073/pnas.85.8.2805
Radu, C. G., Yang, L. V., Riedinger, M., Au, M., and Witte, O. N. (2004). T cell chemotaxis to lysophosphatidylcholine through the G2A receptor. Proc. Natl. Acad. Sci. U. S. A. 101, 245–250. doi:10.1073/pnas.2536801100
Roberts, L. D., McCombie, G., Titman, C. M., and Griffin, J. L. (2008). A matter of fat: an introduction to lipidomic profiling methods. J. Chromatogr. B Anal. Technol. Biomed. Life Sci. 871 (2), 174–181. doi:10.1016/j.jchromb.2008.04.002
Sanz, J., and Fayad, Z. A. (2008). Imaging of atherosclerotic cardiovascular disease. Nature 451 (7181), 953–957. doi:10.1038/nature06803
Schmitz, G., and Ruebsaamen, K. (2010). Metabolism and atherogenic disease association of lysophosphatidylcholine. Atherosclerosis 208 (1), 10–18. doi:10.1016/j.atherosclerosis.2009.05.029
Semba, R. D., Zhang, P., Adelnia, F., Sun, K., Gonzalez-Freire, M., Salem, N., et al. (2019). Low plasma lysophosphatidylcholines are associated with impaired mitochondrial oxidative capacity in adults in the Baltimore longitudinal study of aging. Aging Cell 18, e12915. doi:10.1111/acel.12915
Solati, Z., and Ravandi, A. (2019). Lipidomics of bioactive lipids in acute coronary syndromes. Int. J. Mol. Sci. 20 (5), 1051. doi:10.3390/ijms20051051
Steinberg, D. (2009). The LDL modification hypothesis of atherogenesis: an update. J. Lipid Res. 50 (Suppl. l), S376–S381. doi:10.1194/jlr.R800087-JLR200
Sud, M., Fahy, E., Cotter, D., Brown, A., Dennis, E. A., Glass, C. K., et al. (2007). LMSD: LIPID MAPS structure database. Nucleic Acids Res. 35 (Database issue), D527–D532. doi:10.1093/nar/gkl838
Taguchi, H., Watanabe, H., Onizawa, K., Nagao, T., Gotoh, N., Yasukawa, T., et al. (2000). Double-blind controlled study on the effects of dietary diacylglycerol on postprandial serum and chylomicron triacylglycerol responses in healthy humans. J. Am. Coll. Nutr. 19 (6), 789–796. doi:10.1080/07315724.2000.10718079
Tang, W. H., Wang, Z., Levison, B. S., Koeth, R. A., Britt, E. B., Fu, X., et al. (2013). Intestinal microbial metabolism of phosphatidylcholine and cardiovascular risk. N. Engl. J. Med. 368 (17), 1575–1584. doi:10.1056/NEJMoa1109400
Wang, D., Cheng, S. L., Fei, Q., Gu, H., Raftery, D., Cao, B., et al. (2019). Metabolic profiling identifies phospholipids as potential serum biomarkers for schizophrenia. Psychiatry Res. 272, 18–29. doi:10.1016/j.psychres.2018.12.008
Wang, X., Wang, D., Wu, J., Yu, X., Lv, J., Kong, J., et al. (2017). Metabolic characterization of myocardial infarction using GC-MS-Based tissue metabolomics. Int. Heart J. 58 (3), 441–446. doi:10.1536/ihj.16-432
Wang, Z., Klipfell, E., Bennett, B. J., Koeth, R., Levison, B. S., Dugar, B., et al. (2011). Gut flora metabolism of phosphatidylcholine promotes cardiovascular disease. Nature 472 (7341), 57–63. doi:10.1038/nature09922
Watson, A. D. (2006). Thematic review series: systems biology approaches to metabolic and cardiovascular disorders. Lipidomics: a global approach to lipid analysis in biological systems. J. Lipid Res. 47 (10), 2101–2111. doi:10.1194/jlr.R600022-JLR200
Wolf, A., Saito, T., Dudek, R., and Bing, R. J. (1991). The effect of lysophosphatidylcholine on coronary and renal circulation in the rabbit. Lipids 26, 223–226. doi:10.1007/BF02543975
Yanagisawa, Y., Kawabata, T., Tanaka, O., Kawakami, M., Hasegawa, K., and Kagawa, Y. (2003). Improvement in blood lipid levels by dietary sn-1,3-diacylglycerol in young women with variants of lipid transporters 54T-FABP2 and -493g-MTP. Biochem. Biophys. Res. Commun. 302 (4), 743–750. doi:10.1016/s0006-291x(03)00220-1
Keywords: myocardial infarction, lipid molecules, lipidomic, phosphatidylcholine, lysophosphatidylcholines
Citation: Chen H, Zhang Q, Zhou A, Zhang L and Li X (2025) Identification of plasma lipid metabolism and potential biomarkers in patients with different coronary occlusive acute myocardial infarction. Front. Cell Dev. Biol. 13:1575431. doi: 10.3389/fcell.2025.1575431
Received: 12 February 2025; Accepted: 14 July 2025;
Published: 14 August 2025.
Edited by:
Wenwu Liu, Naval Medical University, ChinaReviewed by:
Elena Grossini, University of Eastern Piedmont, ItalySwapneeta Date, Vanderbilt University, United States
Copyright © 2025 Chen, Zhang, Zhou, Zhang and Li. This is an open-access article distributed under the terms of the Creative Commons Attribution License (CC BY). The use, distribution or reproduction in other forums is permitted, provided the original author(s) and the copyright owner(s) are credited and that the original publication in this journal is cited, in accordance with accepted academic practice. No use, distribution or reproduction is permitted which does not comply with these terms.
*Correspondence: Li Zhang, bGlfemhhbmcyMDE5QDEyNi5jb20=; Xing Li, OTg2MjAyMzE0MEBqaWFuZ25hbi5lZHUuY24=
†These authors share first authorship