 Dario Dourado Luis1
 Thomas Liehr1*Stefanie Kankel1
 Anja Weise1
 Constanze Pentzold1
 Eva M. Buhl2Katharina S. Hardt3
 Diandra T. Keller3
 Sarah K. Schröder-Lange3
 Ralf Weiskirchen3*
- 1Institute of Human Genetics, Jena University Hospital, Friedrich Schiller University, Jena, Germany
- 2Electron Microscopy Facility, Institute of Pathology, RWTH University Hospital Aachen, Aachen, Germany
- 3Institute of Molecular Pathobiochemistry, Experimental Gene Therapy and Clinical Chemistry (IFMPEGKC), RWTH, University Hospital Aachen, Aachen, Germany
Introduction: Immortalized cell lines play a crucial role in biomedical research by enabling reproducible experiments and enhancing our understanding of complex diseases. HuH-7, originally derived from a human hepatocellular carcinoma, is particularly valuable for studying liver cancer dynamics, viral hepatitis, and drug metabolism. However, concerns about cell line misidentification and genetic drift in cell lines highlight the importance of rigorous authentication to maintain the reliability of research outcomes, despite their widespread use.
Methods: In this study, we present a detailed (cyto)genetic and molecular analysis of HuH-7 cells, focusing on their hepatocellular characteristics and potential applications in translational research. Through thorough genomic profiling and next-generation mRNA expression analyses, we aimed to confirm the authenticity of the cell line and identify key genetic signatures associated with tumorigenic pathways.
Results and Discussion: Our results emphasize the importance of regular identity verification, such as short tandem repeat (STR) profiling, and demonstrate how subtle genetic variations can affect phenotypic traits relevant to modeling liver disease. By providing insights into the genetic and transcriptomic features of HuH-7 cells, this study establishes a robust basis for future research and therapeutic investigations using this widely accepted liver cell model. It also emphasizes the importance for maintaining high-quality standards and robust authentication practices to ensure that cell-based studies produce reliable and reproducible results.
1 Introduction
The use of immortalized cell lines is a cornerstone of modern biomedical research, providing reproducible model systems for studying the molecular mechanisms underlying various diseases (Weiskirchen et al., 2023). These cell lines offer several advantages, including infinite proliferative capacity, ease of cultivation, and well-established experimental protocols. These features facilitate large-scale studies and comparative analyses. However, when working with any cell lines, it is crucial to ensure their identity and purity through rigorous authentication to guarantee the validity and reliability of experiments (Souren et al., 2022). Misidentification or cross-contamination of cell lines can lead to inaccurate results and compromise the reproducibility of scientific findings. This highlights the significance of consistently verifying their identity using methods such as short tandem repeat (STR) profiling (Almeida and Korch, 2023).
Among the many cellular models available, the HuH-7 cell line has received particular attention in research focusing on hepatic biology and disease. Established from a human hepatocellular carcinoma (HCC) in 1982, HuH-7 cells exhibit features relevant to the pathological state of liver cancer. This makes them a valuable model for exploring the molecular and genetic underpinnings of tumorigenesis (Nakabayashi et al., 1982). They have been widely used to study viral hepatitis, drug metabolism, cancer development, and liver-specific signaling pathways, providing a platform for in vitro high-throughput drug screening and mechanistic analyses (Jiraviriyakul et al., 2025; Li et al., 2025; Zhang et al., 2025). Furthermore, this cell line has played a key role in elucidating the molecular pathways linking chronic liver inflammation and tumor development (Niu et al., 2025).
In the recent years continued refinements in molecular biology and sequencing technologies have emphasized the importance of thoroughly characterizing and authenticating of commonly used cell lines (Horbach and Halffman, 2017; Souren et al., 2022; Weiskirchen et al., 2023). However, awareness and handling of cell misidentification among scientists and journal editorial teams varies widely and often requires significant improvement (Weiskirchen, 2025). Despite the critical importance of accurate cell line identification for the integrity of biomedical research, instances of misidentified or contaminated cell lines persist in published studies. This not only undermines the reproducibility of scientific findings but also poses risks to patient safety when research is translated into clinical practice. Therefore, it is crucial for the scientific community to prioritize rigorous authentication protocols and foster a culture of transparency regarding cell line usage. This will ensure that both researchers and journals actively contribute to maintaining high standards in cellular research.
Detailed genetic and molecular profiling reveals potential differences from the original tumor derived from the patient, helping to mitigate the risk of inaccurate data caused by cell line drift. Therefore, an in-depth understanding of the genetic composition, gene expression profiles, and phenotypic properties of HuH-7 are of considerable interest to the broader scientific community. The karyotype of the HuH-7 line is known to be severely abnormal (Ding et al., 2013). Furthermore, a previous study using single-cell analysis, multi-color fluorescence in situ hybridization (M-FISH), single nucleotide polymorphism (SNP) microarrays, and amplicon sequencing has already defined a reference genome profile for HuH-7. This study revealed that the HuH-7 cell line exhibits complex chromosomal abnormalities affecting all chromosomes, as well as substantial loss of heterozygosity (Kasai et al., 2018). This previous study has suggested that the HuH-7 is a highly heterogeneous population. Therefore, it is mandatory to re-examine the HuH-7 cell line after all these years to ensure its continued validity as a model for research.
This study aims to extend the comprehensive genetic and molecular characterization of the HuH-7 cell line, with a focus on verifying its identity and identifying features that are unique to HCC. This will enhance the reliability and biological relevance of future research utilizing HuH-7 cells and contribute to more robust and reproducible findings in liver disease research. Furthermore, by comparing our genetic data with those of previous studies from other laboratories, we intend to provide an approximate estimate of the heterogeneity of this tumor cell line. As such, the present work was conceived as a resource-building study. Rather than focusing on a specific pathogenic mechanism in animals, our goal was to document the stable and variable characteristics of low-passage HuH-7 cultures at the chromosome, RNA, and protein levels. This ‘molecular portrait’ serves as a reference point for individual laboratories to assess their own HuH-7 stocks and provides a strong foundation for future mechanistic studies, such as xenograft models, where well-documented starting materials are essential.
2 Materials and methods
2.1 Literature research
A literature search was conducted on 17 May 2025 in PubMed (National Center for Biotechnology Information, 2025) to identify publications involving Huh-7 cells. The search term “Huh7 or Huh-7” was used to encompass all relevant papers, regardless of minor variations in cell line nomenclature. The retrieved articles were then assessed for their relevance to our study, as well as for information on experimental techniques, results, and applications involving HuH-7 cells.
2.2 Cell culture
The human cell line HuH-7 (#JCRB0403, RRID: CVCL_0336) was obtained from the Japanese Collection of Research Bioresources (JCRB) via the FUJIFILM Wako Chemicals Europe GmbH representative. The cells were cultured in a humidified incubator at 37 °C with 5% CO2 in Dulbecco’s Modified Eagle Medium (DMEM, high glucose #6171, Sigma-Aldrich, Merck, Taufkirchen, Germany) with 1.5 g/L sodium bicarbonate. This medium was supplemented with 10% fetal bovine serum (FBS, #F7524, Sigma-Aldrich), 4 mM L-glutamine (#G7513, Sigma-Aldrich), and 1× penicillin-streptomycin antibiotic solution (DE17-602E, Lonza, Cologne, Germany). The cells were passaged when they reached 80%–90% confluence, using an Accutase solution (A6964-100 ML, Sigma-Aldrich), and seeded at the appropriate density for subsequent analyses. All experiments were conducted using cells from low passage numbers to minimize phenotypic drift.
2.3 Short tandem repeat profiling and Mycoplasma testing
To confirm the authenticity of the HuH-7 cell line and identify any Mycoplasma spp. contamination, we performed short tandem repeat (STR) profiling and a sensitive real-time PCR assay to detect even trace amounts of the bacterium. For this purpose, we utilized the cell line authentication service provided by IDEXX (Kornwestheim, Germany) through the CellCheck™ 16 Human PLUS (test code: 42–00098). This test system includes the 13 human reference STR loci recommended for human cell line authentication: CSF1PO, D3S1358, D5S818, D7S820, D8S1179, D13S317, D16S539, D18S51, D21S11, FGA, TH01, TPOX, and vWA (Almeida and Korch, 2023; Korch et al., 2021), two additional variant markers (Penta D and Penta E), and the amelogenin (AMEL) locus, which is used to determine gender. Additionally, we conducted regular mycoplasma testing in our laboratory. Cell culture supernatants from 80%–90% confluent cultures were directly processed with the Venor®GeM OneStep kit for conventional PCR (#11–8050, Minerva Biolabs GmbH, Berlin, Germany). The resulting amplicons were analyzed on a 2% standard agarose gel and stained with Midori Green, in accordance with an established standard protocol (Supplementary Figure S1) (Weiskirchen et al., 2023).
2.4 Western blot analysis
For the protein expression studies, cells were lysed in an ice-cold RIPA buffer supplemented with protease and phosphatase inhibitors. Protein concentration was determined using the DC Protein Assay (#5000116, Bio-Rad Laboratories, CA, USA). Subsequently, 60 µg of cell lysate was separated using sodium dodecyl sulfate-polyacrylamide gel electrophoresis (SDS-PAGE), as previously described (Liehr et al., 2025). The proteins were then transferred onto 0.45 µm nitrocellulose membranes, blocked with a 5% non-fat dry milk solution, and incubated overnight at 4 °C with primary antibodies specific to the targets of interest. After washing, the membranes were incubated with the relevant secondary antibodies conjugated to horseradish peroxidase (HRP). Protein bands were visualized using the Supersignal™ West Dura Extended duration Substrate (#34076, Thermo Fisher Scientific, Schwerte, Germany). Information on the antibodies, including their RRID identifiers, used in this study is provided in Table 1. In the Western blot analysis we used protein extracts generated from human livers as controls. These were obtained from the centralized RWTH Biomaterial Bank (https://www.ukaachen.de/kliniken-institute/institut-fuer-pathologie/biobank/) with approval from the Ethics Committee of the Medical Faculty of RWTH Aachen University (permit number EK 206/09). Human liver tissue was homogenized in a MM400 mixer mill (Retsch GmbH, Haan, Germany) using established protocols (Liehr et al., 2025). Following protein quantification, 80 µg of protein tissue lysate was utilized for Western blot analysis.
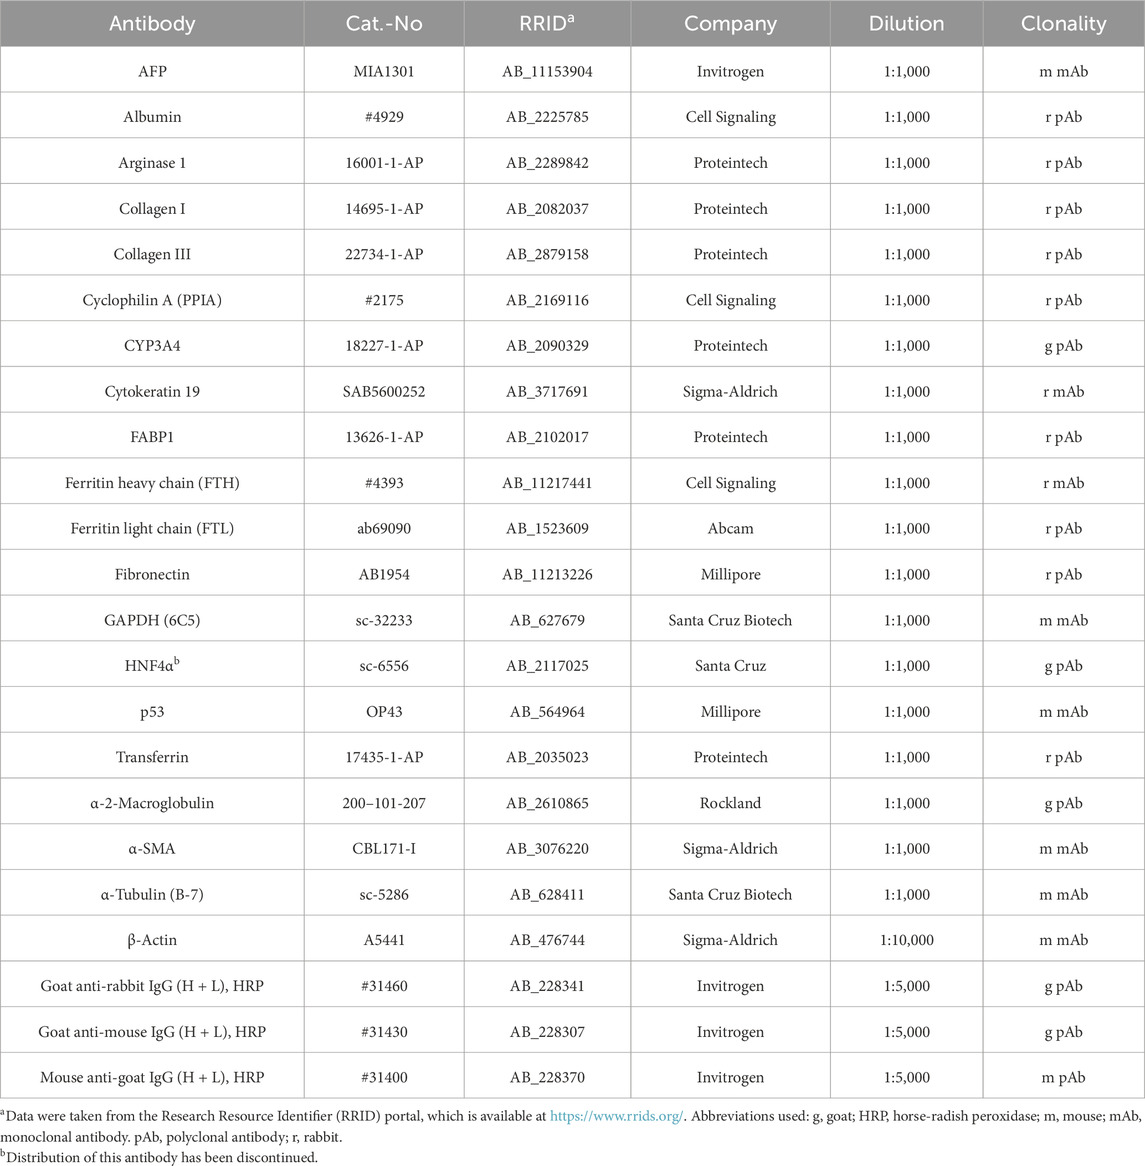
Table 1. Antibodies used for Western blot analysis.
2.5 Combined karyotype and M-FISH analysis and multicolor banding
For the combined karyotype and M-FISH analysis, metaphase chromosome spreads were prepared by treating HuH-7 cells with colcemid to arrest them in metaphase, following the detailed protocol previously described (Liehr et al., 2024). After hypotonic treatment and fixation in methanol-acetic acid, the chromosome spreads were placed dropwise onto glass slides and hybridized with a M-FISH probe mixture containing 24 whole chromosome painting probes specific to the 24 different human chromosomes (#D-0125–120-DI, XCyting, MetaSystems Probes, Altlussheim, Germany). Chromosome banding was performed using inverted 4′,6-diamidino-2-phenylindole (DAPI, #D1306, Thermo Fisher Scientific) staining; 20 metaphases were analyzed in detail. We analyzed karyotypes across all 20 metaphases observed by mFISH using whole chromosome paints and also confirmed and refined the results with 20 chromosome-specific multicolor banding (MCB) experiments. For each MCB experiment 20–25 metaphases were analyzed. Additionally, 24 homemade chromosome-specific MCB probe sets were applied as previously described (Weise et al., 2008), and 20–25 metaphases were analyzed for each. All FISH analyses were conducted using a Zeiss Axioplan fluorescence microscope (Carl Zeiss Jena, Jena, Germany) equipped with a CCD camera and image processing software (ISIS, MetaSystems, Altlussheim, Germany.
2.6 Array comparative genomic hybridization
The losses and gains of chromosomal regions in human chromosomes were identified using chromosomal microarray as array comparative genomic hybridization (aCGH). DNA was isolated from the cell line and aCGH analysis was performed using 4 × 180 K SurePrint G3 Human CGH Microarray slides (Agilent Technologies). These slides cover the entire human genome with a 13-kb overallmedian probe spacing (11 kb in refseq genes). The probes were combined with reference DNA (male) provided by Promega as controls and processed as previously reported in GRCh37/hg19 (Aust et al., 2013). The data obtained was compared with CGH-results obtained in human hepatocellular carcinoma (Guan et al., 2000).
2.7 Next-generation sequencing (NGS) mRNA bulk sequencing
For the transcriptomic analysis, total RNA was extracted from HuH-7 cells that had been grown to 80% confluency using an established CsCl density gradient protocol (Liehr et al., 2024). Quantity and quality/integrity were evaluated via UV spectroscopy and on the Agilent 4200 TapeStation instrument (Agilent Technologies Inc., Waldbronn, Germany). Library preparation involved mRNA enrichment or rRNA depletion, followed by fragmentation, synthesis of first- and second-strand cDNA synthesis, adapter ligation, and PCR amplification according to established protocols (Liehr et al., 2025). The libraries were then sequenced on a high-throughput Illumina sequencing platform with prefilled cartridges and the downstream analysis was performed using standardized pipelines at the IZKF Genomic Facility of the University Hospital Aachen. The obtained sequence data were aligned to the human reference genome (Genome assembly GRCh38: https://www.ncbi.nlm.nih.gov/datasets/genome/GCF_000001405.26/), and quantified at the gene and transcript levels. This resulted in length-normalized transcripts per million (TPM) values.
2.8 Microscopic analysis
Cellular morphology was routinely monitored using phase-contrast or bright-field microscopy to assess growth patterns and overall health. Images were captured using a Leica EC3 digital camera connected to a Leica DM IL LED microscope fitted with the Leica Application Suite (LAS) software (version 3.4.0, Leica Microsystems GmbH, Wetzlar, Germany).
2.9 Phalloidin staining
For Phalloidin Staining, 30,000 cells were seeded in four-chamber culture sides (#354104, BD Falcon™, BD Biosciences, Erembodegem, Belgium). After 72 h, microfilament staining was conducted as previously described (Liehr et al., 2025). The cells were stained with a 1× diluted Rhodamine-Phalloidin solution (#R415, Invitrogen, Thermo Fisher Scientific, Schwerte, Germany) for 20 min in the dark. Nuclear counterstain was performed with 4′,6-diamidino-2-phenylindole (DAPI, #D1306, Thermo Fisher Scientific) for 30 min in the dark. After staining, the slides were embedded in Vectashield Antifade mounting medium (#H-1000, Burlingame, California, United States) and stored at 4 °C. For analysis, a Nikon Eclipse E80i fluorescence microscope with NIS-Elements Vis software (version 3.22.01) was used.
2.10 Electron microscopy analysis
For ultrastructure studies, the cells were harvested and fixed in a solution of 2.5% glutaraldehyde solution in a 0.1 M phosphate buffer. They were then post-fixed in 1% osmium tetroxide. Following dehydration using a graded ethanol series, the samples were embedded in epoxy resin. Ultrathin sections (approximately 70–90 nm thick) were cut using an ultramicrotome and mounted on copper grids. These sections were subsequently post-stained with uranyl acetate and lead citrate prior to examination using a Zeiss Leo 906 transmission electron microscope (Carl Zeiss AG, Oberkochen, Germany) operating at 60 kV. High-resolution micrographs were taken at various magnifications ranging from ×2,784 to 12,930× in order to elucidate the organelle integrity of organelles and the morphology of mitochondria and other subcellular features that are characteristic of HuH-7 cells.
3 Results
3.1 Usage of HuH-7 cells in biomedical research
The Huh-7 cell line was first established in 1982 by Hidekazu Nakabayashi and his team at Kagawa University. It originated from a well-differentiated hepatocyte carcinoma that was removed during surgery from a 57-year-old Japanese male (Nakabayashi et al., 1982). A PubMed search conducted on 17 May 2025 using the search term “HuH-7 or HuH7” revealed that this cell line has been used in 8,319 studies. Furthermore, HuH-7 cells have been referenced over 5,000 times in the RRID portal (https://rrid.site/data/source/SCR_013869-1/search?q=CVCL_0336&l=CVCL_0336), which underscores the extensive use of this cell line in biomedical research.
3.2 Appearance of HuH-7 as assessed by light microscopy
When observed under a light microscope, HuH-7 cells exhibit an epithelial morphology. They grow as adherent, polygonal cells with a relatively uniform appearance (Figure 1). They often form monolayers in culture, with rounded or oval nuclei that have prominent nucleoli and abundant cytoplasm. Binucleation and characteristic intercellular contacts may occasionally be observed. These morphological features are consistent with the cells being derived from a well-differentiated hepatocellular carcinoma tissue.
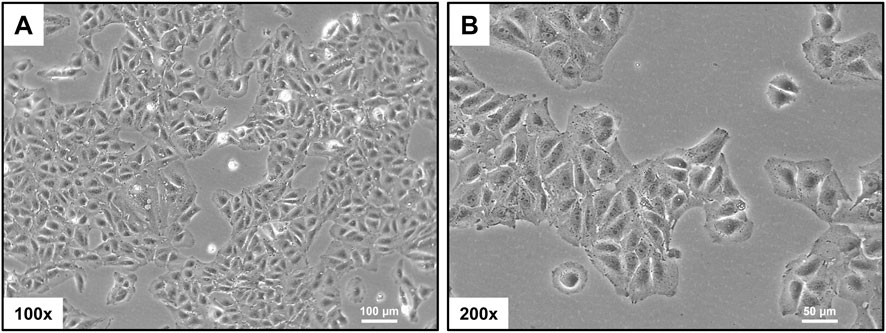
Figure 1. Morphological assessment. Phase-contrast micrographs show the characteristic polygonal shape and epithelial-like growth pattern of HuH-7 cells. The scale bar indicates 100 µm in panel (A) and 50 µm in panel (B).
3.3 Short tandem repeat profiling for HuH-7
For authentication purposes, we performed short tandem repeat (STR) profiling on our Huh-7 cells. We analyzed 15 specific STR markers, including Penta E, D18S51, D21S11, TH01, D3S1358, FGA, TPOX, D8S1179, vWA, Penta D, CSF1PO, D16S539, D7S820, D13S317, and D5S818, as well as the amelogenin gene to determine sex (Figure 2; Table 2). The resulting profile showed a 100% match to the published reference data (Kasai et al., 2018), thus confirming the authenticity and genetic consistency of our HuH-7 cell line.
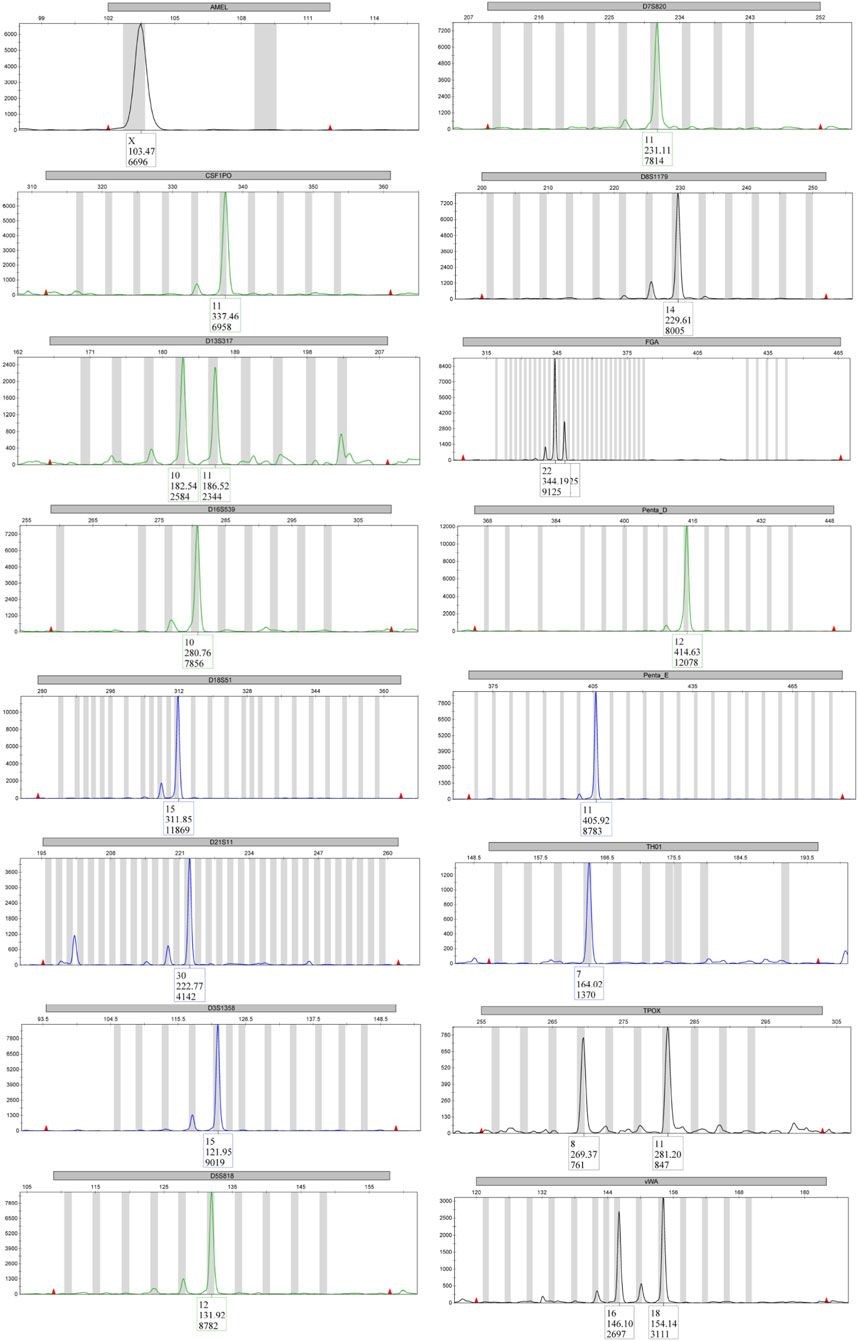
Figure 2. STR profiling. This representative electropherogram shows the amplified STR loci for HuH-7. The unique peaks confirm the identity of the cell line when compared with reference databases.
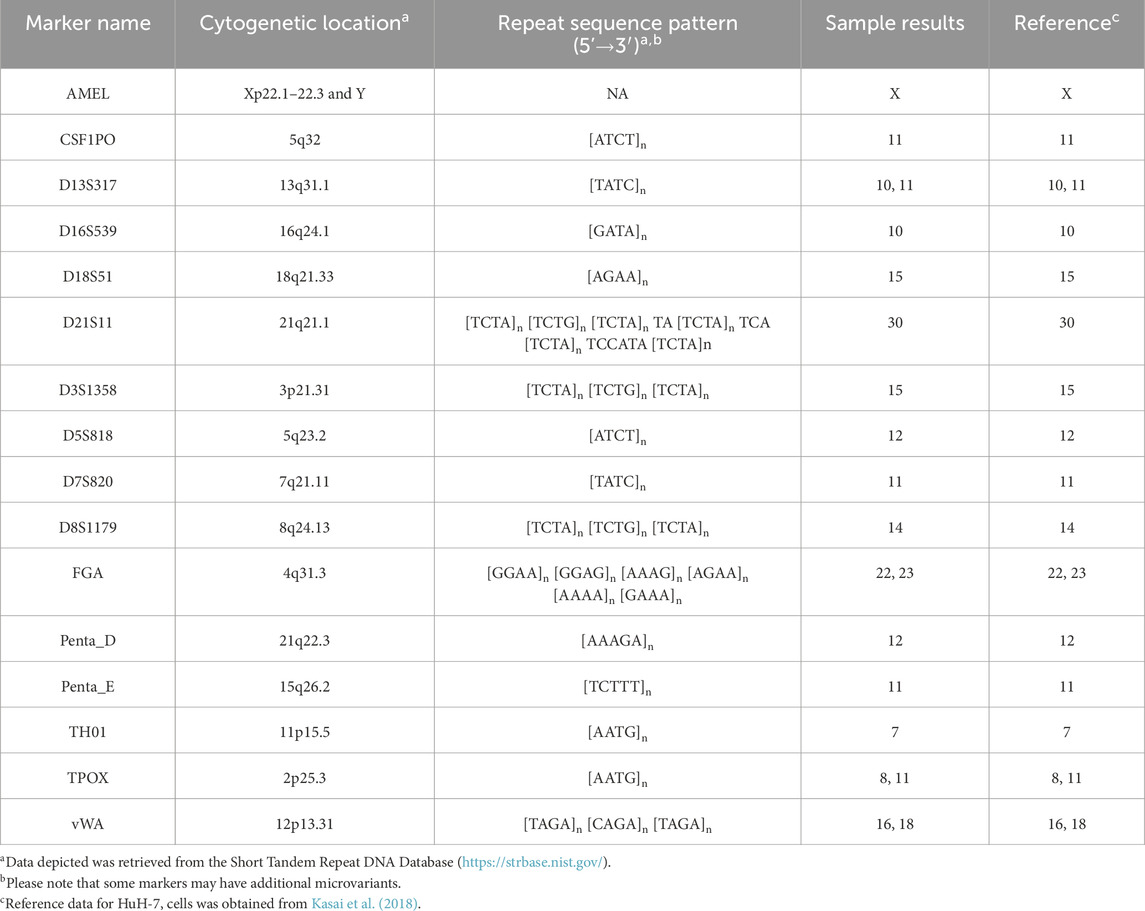
Table 2. Short tandem repeat (STR) profiling of HUH-7 cells using 15 human-specific STR loci and the amelogenin locus.
3.4 Combined karyotype and M-FISH analysis
A molecular cytogenetic analysis on the HuH-7 cell line was conducted to obtain a comprehensive understanding of its chromosomal composition. Utilizing inverted DAPI-banding in conjunction with M-FISH allowed for each chromosome to be visualized in a distinct color, adding in the identification and mapping of intrachromosomal genetic alterations and/or aneuploidies within the cells. Our analysis indicated that HuH-7 cells have an almost triploid karyotype (59<3n>), showcasing both numerical and highly complex structural aberrations in some parts (Figure 3).
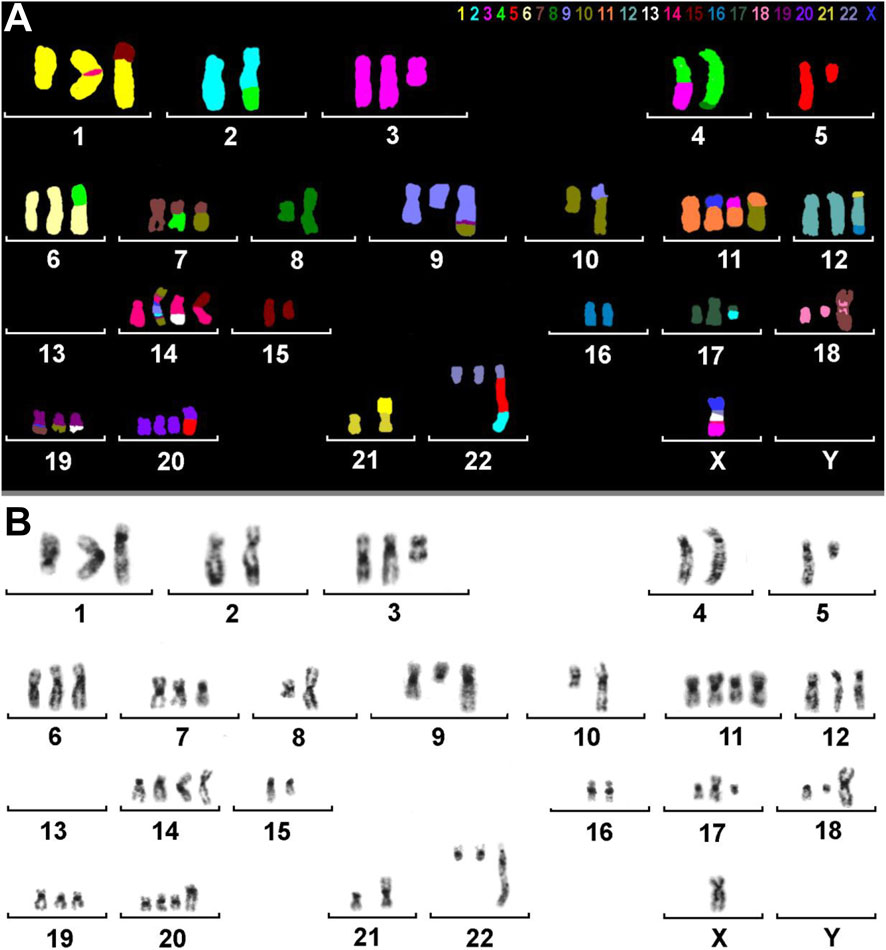
Figure 3. M-FISH and inverted DAPI-banding of HuH-7. (A) M-FISH result of a metaphase with colors assigned to each chromosome. Most chromosomes are derivatives consisting of parts from two or more original human chromosomes. The color key for each chromosome is provided at the top of the image. It is important to note that there is no Y chromosome present. (B) The same metaphase is displayed with inverted DAPI banding. The karyogram reveals chromosomal rearrangements and numerical abnormalities in HuH-7 cells.
To clarify the complex chromosomal rearrangements in HuH-7 cells, we performed a high-resolution, multicolor banding (MCB) analysis. This technique enables DNA-specific color banding along one chromosome at a time (Figures 4, 5). Notably, the Y-chromosome is absent, with only one derivative X chromosome present, although parts of X-chromosome(s) are also found on derivatives of chromosomes 11, 14, and 19. Chromosome 1 shows multiple rearrangements, including a deletion and an insertion involving chromosome 14, as well as a large derivative containing chromosome 15. Chromosome 2 displays deletions and a translocation to chromosome 4, leading to the complete loss of one copy. Several other chromosomes (3, 4, 5, 7, 9, 10, 11, 14 and 19) exhibit complex derivative forms, with merged, inverted, or inserted segments from multiple sources. For example, chromosome 3 has a derivative that incorporates multiple rearrangements and a neochromosome. Isochromosomes are observed in chromosomes 8, and 18. Chromosome 13 is absent, with some fragments replaced by translocated segments. Chromosome 14 shows significant rearrangements, while the remaining derivatives contain interspersed chromosome arms. Additional abnormalities include large deletions, missing chromosomes, and recurring translocations, such as with chromosomes 15, 16, 21, and 22. Moreover, several aberrations are so complex that they could not be fully resolved by FISH or aCGH (see below). Therefore, one derivative each of chromosome 5 and 11 were reported as having been going through ‘cha’ = chromoanasynthesis, which is a special form of chromothripsis.
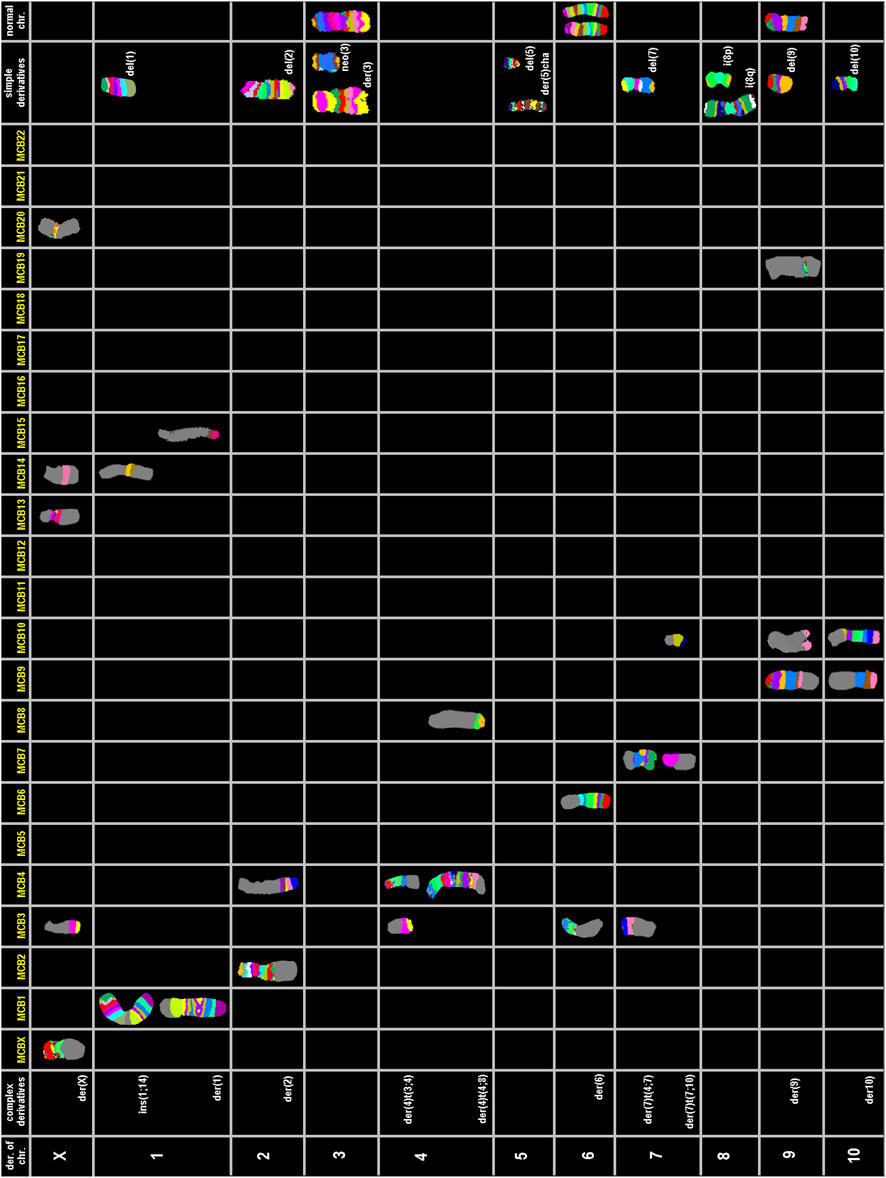
Figure 4. Multicolor banding (MCB) of HuH-7 chromosomes. Representative examples of high-resolution multicolor banding profiles of HuH-7 chromosomes are shown for derivatives of chromosomes X, 1 to 10.
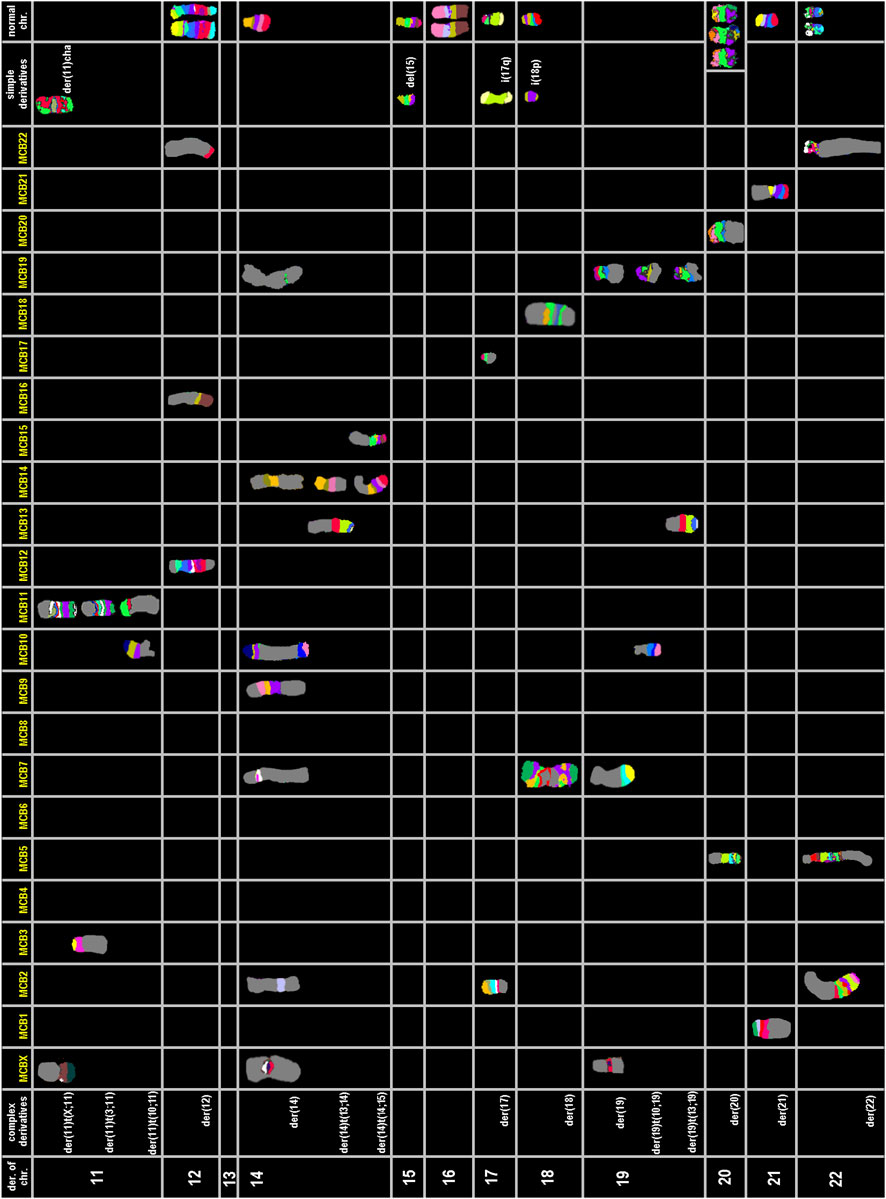
Figure 5. Multicolor banding (MCB) of HuH-7 chromosomes. Representative examples of high-resolution multicolor banding profiles of HuH-7 chromosomes are shown for derivatives of chromosomes 11 to 22.
Overall, the karyotype (also detailed by chromosome in Table 3) can be summarized as: 56<3n>,der(X) (Xpter- > Xq12::20p13->20p13::13q11.2->13q12::14q23->14q24.3::3q26->3qter),-X,-X,del (1) (q12),ins (1; 14) (q12; p1?2q11.2),der (1) (15qter->15q26.1::1q12->1q24::1q24->1q12::1q24->1qter),del (2) (p21),der (2)t (2; 4) (q14.1; q31),-2,3,der (3) (qter- > q28::p12- > q11.2::q28- > q29::q11.2- > qter),neo (3) (pter- > p21.3::p21.3- > pter),der (4) (3pter->3p21.3::4p16->4q12),der (4)t (4; 8) (q33; p23.1),-4,der (5)cha (q12->?qter),del (5) (q13),-5,6,6,der (6)t (4; 6) (p12; p11.2),del (7) (q22),der (7)t (4; 7) (q31; p11.2),der (7) (7p12->7q11.2::10p13->10pter),i (8) (p10),i (8) (q10),-8,9,del (9) (q12),der (9) (9pter->9q34.3::19q13->19q13::10q25.3->10qter),-9,del (10) (q23),der (10)t (9; 10) (q31; p11.2),-10,der (11)cha (pter- > q1?2),der (11)t (X; 11) (q26; p11.2),der (11)t (3; 11) (q26; p11.11),+der (11)t (10; 11) (q11.2; p14),12,12,der (12) (21qter->21q22.2 :: 12p11.2->12q23 ::16q11.2-> 16qter), -13, -13,-13,14,der (14) (10pter->10p11.2::7q11.21->7q11.21::14q11.2->14p12::Xp11.21- > Xp11.21::9q12->9q21::9q33->9q34::2p16->2p16::19p12->19p12::10q25.1->10qter),der (14)t (13; 14) (q11.2; q23),+der (14)t (14; 15) (p13; q11.2),del (15) (q22),-15,-16,17,i (17) (q10),der (17)t (2; 17) (p21; q12),18,i (18) (p10),der (18) (7qter->7q11.2::18q12->18p11.1::7q11.2->7q11.2::18q21->18q12::7q11.2->7qter),der (19) (19pter->19q13.4::Xq11.2- > Xq12::7p11.2->7pter),der (19)t (10; 19) (q24; q13.4),der (19)t (13; 19) (q11.2; q13.4),+der (20)t (5; 20) (q13; q12),der (21)t (1; 21) (p33; p13),-21,der (22) (22pter->22q11.2::5p13.2->5q35::2q14.1->2qter)[cp∼500].
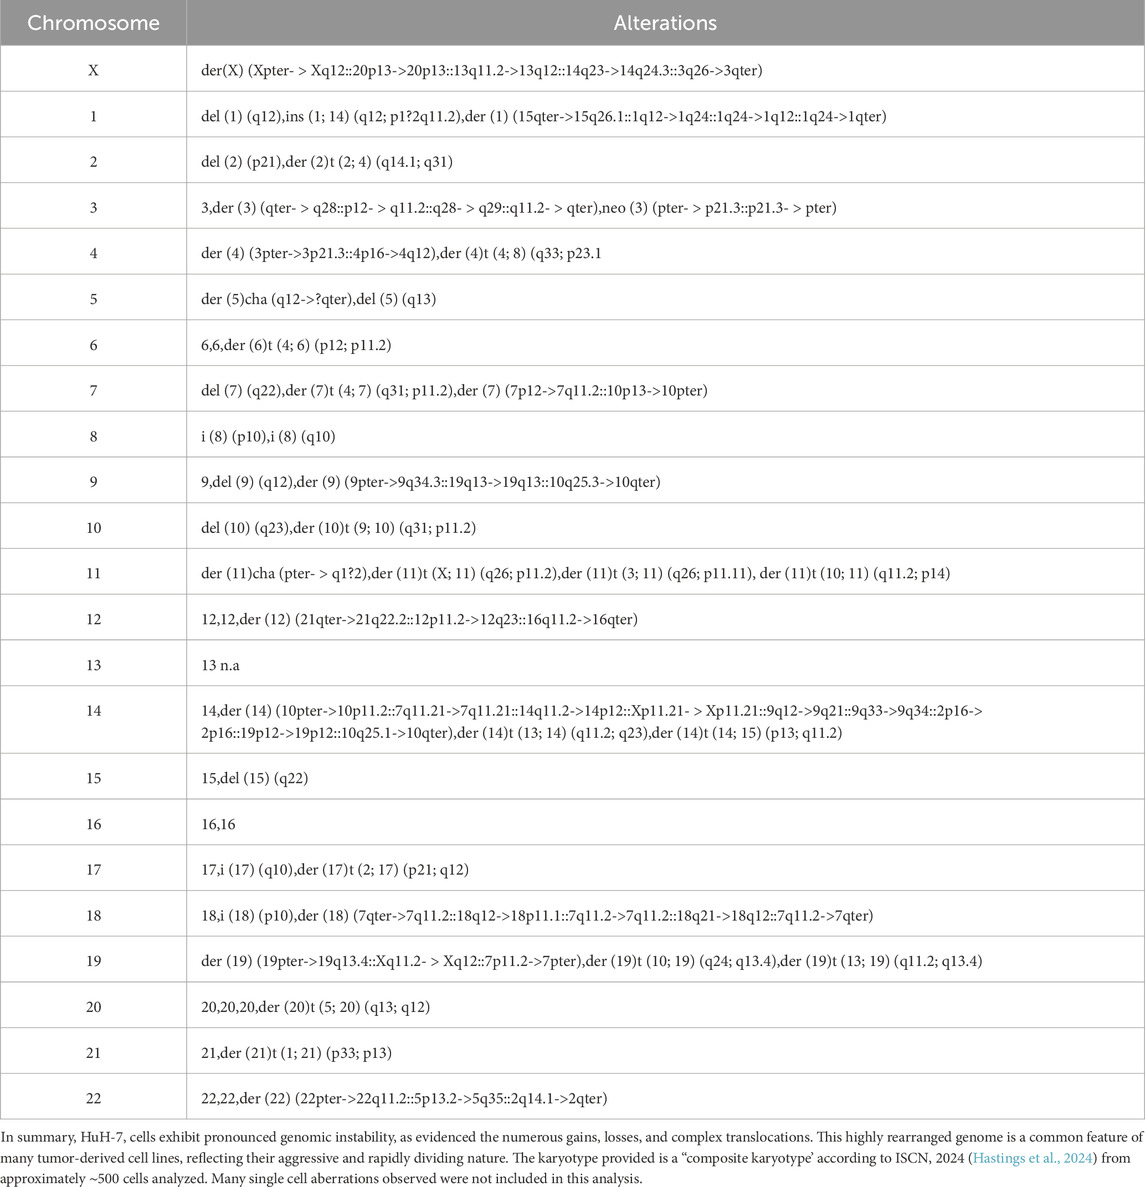
Table 3. Summary of M−FISH and MCB analysis for HuH-7 cells.
3.5 Array comparative genomic hybridization
Array comparative genomic hybridization (aCGH) was conducted on HuH-7 cells to visually map chromosomal gains and losses throughout the genome. This revealed the unique and complex genomic landscape of HuH-7 cells. Through aCGH analysis, we identified gains on the short arms of chromosomes 3, 5, 18, and 20, as well as on the long arms of chromosomes 15, 16, and 20. Conversely, losses were observed on the short arms of chromosomes 5, 6, 8, 11, 12, and 17, and on the long arms of chromosomes 4, 8, 11, 12, 13, 14, 21, and 22 (Figure 6). Overall, the results obtained here were consistent with the copy number alterations seen in molecular cytogenetic analyses. However, the complexity revealed in the molecular cytogenetic analyses was not fully captured in the aCGH profile.
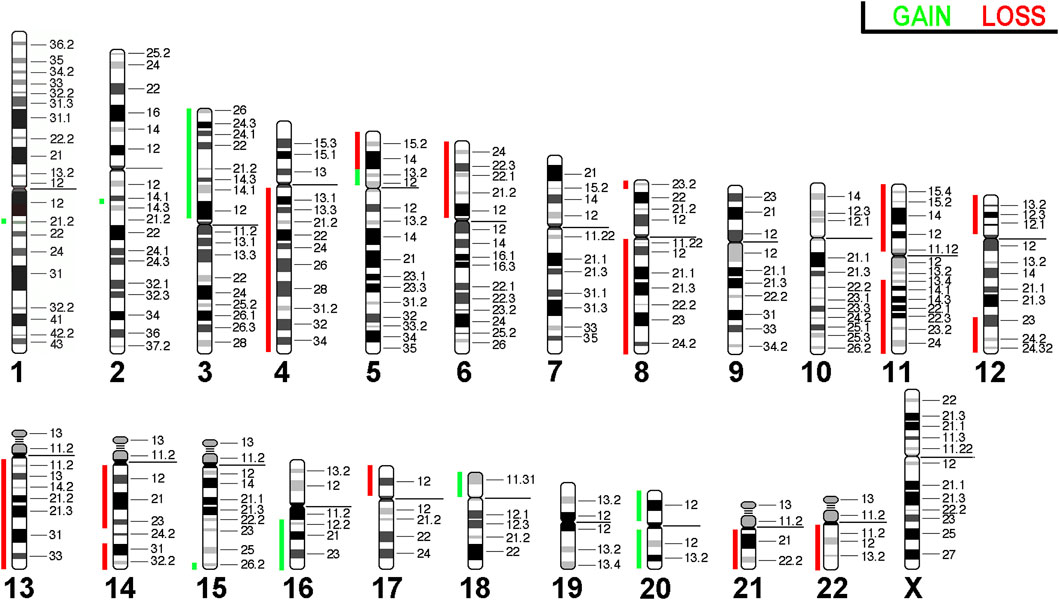
Figure 6. Array comparative genomic hybridization for the HuH-7 cell line. Copy number alterations are represented using a color code with red shades indicating losses and while green indicating gains.
As shown in Table 4, 15 out of 19 major copy number variations (CNVs) (approximately 80%) observed in HuH-7 are also found in human hepatocellular carcinoma, indicating that this cell line is a suitable model for advanced hepatocellular carcinoma.
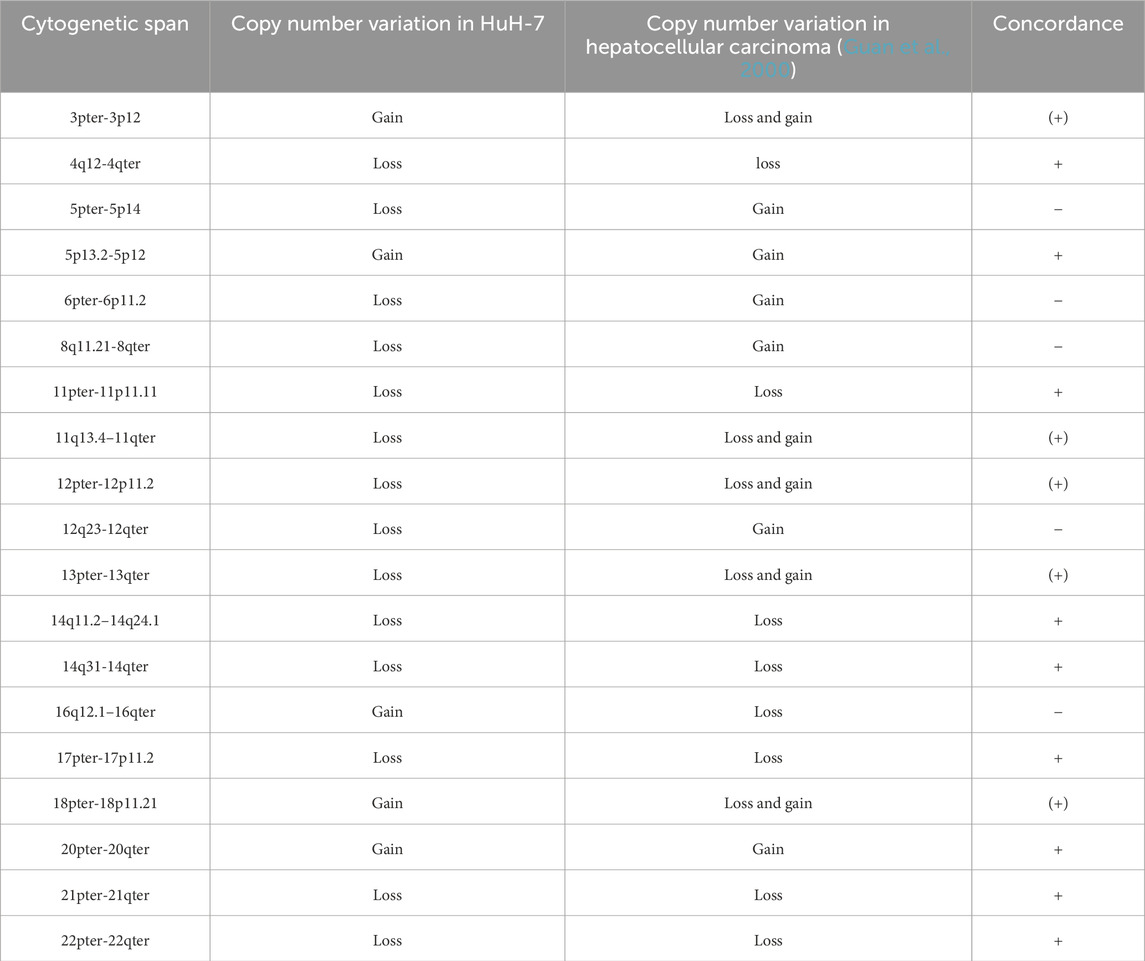
Table 4. Losses and gains of chromosomal regions larger than one cytoband in HuH-7 cells compared with copy number alterations in hepatocellular carcinoma.
3.6 Next-generation mRNA bulk sequencing
To gain an unbiased overview of the transcriptomic landscape of HuH-7 cells and accurately assess their mRNA expression capacity, we conducted next-generation mRNA bulk sequencing. This approach involves isolating and sequencing the entire mRNA pool, providing a comprehensive snapshot of gene expression in the cells when cultured in a standard medium. Capturing both abundant and lowly expressed transcripts provides valuable insight into the molecular pathways, potential biomarkers, and regulatory networks underlying cell function and disease mechanisms. This information is particularly important for understanding the susceptibility of HuH-7 cells to the hepatitis C virus (HCV).
Our analysis revealed several groups of highly expressed genes in HuH-7 cells. Firstly, there was strong representation of mitochondrial transcripts, including subunits of the electron transport chain (e.g., MT-CO1, MT-CO2, MT-CO3, MT-ND1, MT-ND2, MT-ATP6, and MT-ATP8), reflecting the active metabolic state of these cells. Secondly, numerous ribosomal proteins (e.g., RPL41, RPS12, RPL37, RPS17, and RPS27) and translation factors, such as eukaryotic translation elongation factor 1 alpha 1 (EEF1A1) and eukaryotic translation elongation factor 2 (EEF2), exhibited robust expression, suggesting significant protein synthesis activity (Supplementary Table S1). A further notable category comprised essential housekeeping and cytoskeletal genes, including glyceraldehyde-3-phosphate dehydrogenase (GAPDH), actin beta (ACTB), tubulin alpha 1b (TUBA1B), vimentin (VIM), the biliary/hepatic progenitor cell marker keratin 19 (KRT19), and keratins 18 (KRT18), and 8 (KRT8). These genes are indicative of fundamental cellular processes. Similarly, HuH-7 cells exhibited high mRNA expression of the transferrin receptor 1 (TFRC), which is a hepatitis C virus entry factor (Martin and Uprichard, 2013). HuH-7 cells also express scavenger receptor class B member 1 (SCARB1), which has also been reported to act as a hepatitis C virus receptor that and facilitates its entry into cells (Arandhara et al., 2023). Other genes that are thought to act as hepatitis C virus entry factors such as the CD81 molecule, occludin (OCLN), and claudin-1 (CLDN1), as well as the cofactor epidermal growth factor receptor (EGFR) (Carriquí-Madronal et al., 2023), are expressed at high levels (CD81, CLDN1, and EGFR) or median levels (OCLN) in HuH-7 cells (Supplementary Table S1).
Furthermore, a high expression of α1-antitrypsin, encoded by the serpin family A member 1 (SERPINA1) gene, was observed. This confirms previous data showing that HuH-7 cells can secrete large quantities of this protein (Ke et al., 2022). Considerable amounts of mRNA encoding the hepatocyte differentiation marker nuclear factor 4α (HNF4A) were also found. HNF4A regulates many genes involved in lipid and carbohydrate metabolism, including those that control very low-density lipoprotein (VLDL) secretion and gluconeogenesis (Huck et al., 2021). Ferritin heavy chain 1 (FTH1) and ferritin light chain (FTL) were expressed at high mRNA levels. These proteins form a complex that stores iron in a non-toxic form, and are predominantly expressed in the liver (Gao et al., 2022). Lastly, markers predominantly expressed in hepatocytes were found among the most highly expressed transcripts, which is consistent with the hepatocellular carcinoma origin of HuH-7 cells. Notably, HuH-7 cells exhibited high levels of expression of both albumin (ALB) and α-fetoprotein (AFP) (Table 5). However, cytochrome P450 (CYP) genes, such as CYP3A4, which are mainly responsible for the phase I metabolism of xenobiotics in hepatocytes, were found to be expressed at low levels. This confirms a previous report demonstrating that HuH-7 cells express negligible amounts of CYP450 enzymes (Bulutoglu et al., 2019). Under the chosen condition, HuH-7 cells also express mRNA of several transporters relevant for drug metabolism at low level, including organic anion transporter polypeptides (OATP1A2/SLCO1A2, OATP1B1/SLCO1B1, OATPB3/SLC01B3), organic cation transporters (OCT1/SLC22A1), multidrug-resistance-associated proteins (MRP2/ABCC2, MRP3/ABCC3, MRP4/ABCC4), bile salt export pumps (ABCB11), and many others (Supplementary Table S1).

Table 5. Selected gene expression in HuH-7 cells that underpins their hepatocytic origina.
3.7 Western blot analysis
To ensure the accuracy of our next-generation mRNA sequencing results, we performed Western blot analyses on selected proteins of interest (Figure 7), using a protein extract from human liver tissue as a control. In most cases, the Western blot results were consistent with our NGS findings, confirming that many of the transcripts detected at the RNA level were indeed translated into proteins. Specifically, we observed strong expression of fibronectin, HNF4α, β-actin, FTH1, cyclophilin A, collagen type III, AFP, GAPDH, FTL, and (cyto)keratin 19. In line with our NGS data, we demonstrated that CYP3A4 expression was rather low. However, despite the presence of relatively high quantities of fatty acid binding protein 1 (FABP1) mRNA, the FABP1 protein was either undetectable or very low. Interestingly, HuH-7 cells also expressed the tumor marker p53, consistent with the mRNA data (Supplementary Table S1). Overall, the Western blot data predominantly confirmed the transcript-level findings from our NGS analysis, demonstrating that most of the identified mRNAs were translated into proteins. This strong alignment underscores the reliability of our NGS data.
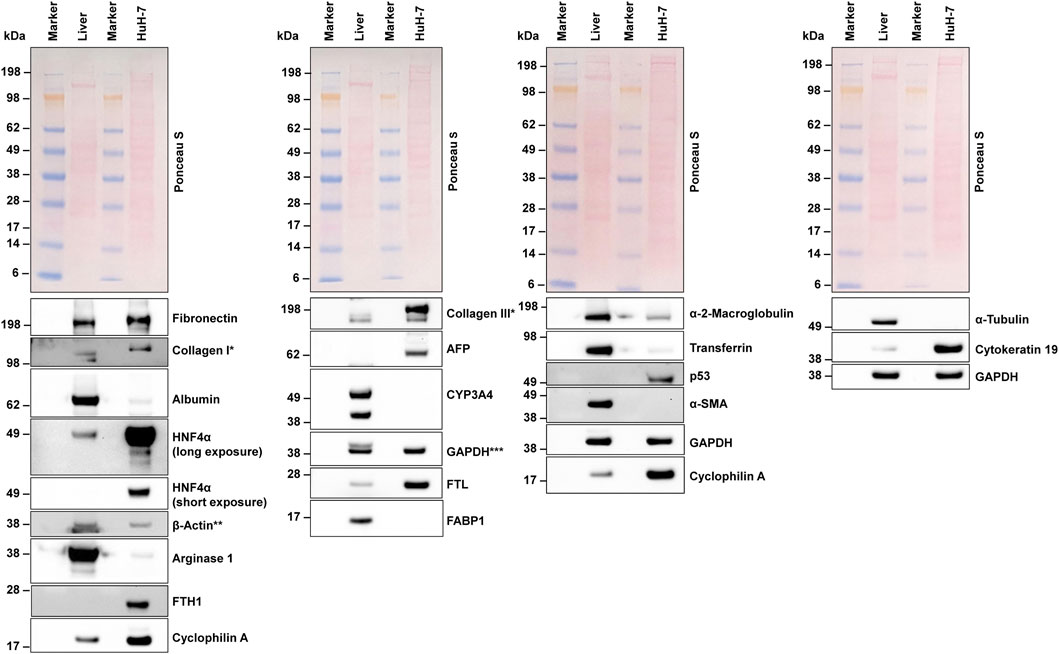
Figure 7. Western blot analysis. Protein extracts from HuH-7 cells and human liver tissue were analyzed using Western blot analysis. Equal protein loading was confirmed through Ponceau S staining and probing with antibodies for housekeeping proteins. A variety of proteins were detected, including important hepatic markers like albumin, hepatocyte nuclear factor 4 alpha (HNF4α), and α-fetoprotein (AFP). * In the extracts tested, collagens showed a multiple band pattern. A similar pattern was found in the murine hepatocyte cell line AML12 and murine hepatic stellate cell line GRX (Schröder et al., 2022). ** The lower signal for β-actin in the liver extracts resulted from former probing for Arginase 1. *** The upper signal for GAPDH in the liver extracts resulted from former probing with CYP3A4. Abbreviations: α-SMA, α-smooth muscle actin; CYP3A4, cytochrome P450 family 3 subfamily A member 4; FABP1, fatty acid binding protein 1; FTH1, Ferritin heavy chain 1; FTL, ferritin light chain; GAPDH, glyceraldehyde-3-phosphate dehydrogenase.
3.8 Electron microscopic analysis
Electron microscopy was used to characterize the ultrastructure of HuH-7 cells (Figure 8). As expected for a hepatocyte-derived cell line, the cells exhibited numerous well-organized organelles associated with protein synthesis and detoxification. The large number of mitochondria reflects the high metabolic demand of these cells. Additionally, cells also exhibited prominently developed rough endoplasmic reticulum and a distinct Golgi apparatus. Similarly, the nuclei of the cells have a lot of euchromatin and pronounced, often two, nucleoli, which also indicate a high metabolic activity of the cells. Some cells also showed evidence of glycogen granules and lipid droplets in certain areas, both of which are characteristic features of hepatocytes involved in energy storage and lipid metabolism. Fibers typical of keratin bundles were also found inside the cells. Moreover, cell junctions were visible between neighboring cells, suggesting preserved epithelial characteristics. However, these junctions may be less extensive in vitro than in primary liver tissue. Overall, these ultrastructural traits corroborate the hepatocellular identity of HuH-7 cells and align with the known morphology of parenchymal liver cells.
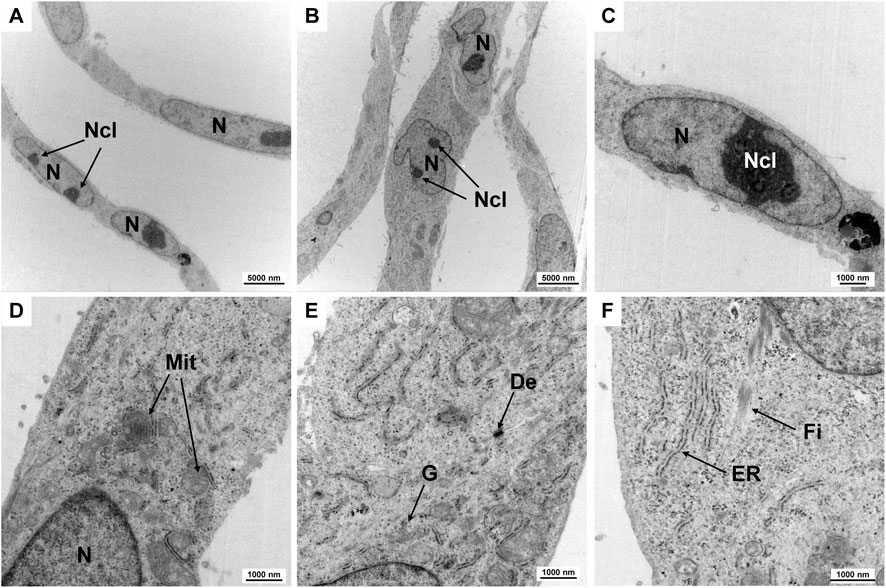
Figure 8. Ultrastructural examination using TEM. Transmission electron micrographs of the subcellular organelles in HuH-7 cells are shown, including mitochondria (Mit), endoplasmic reticulum (ER), Golgi apparatus (G), desmosome (De), and fibers. Some nuclei contain two nucleoli (Ncl). Characteristic fibers (Fi) are visible. Scale bars are 5,000 nm for images (A,B), and 1,000 nm for images (C–F). Magnifications are as follows: (A,B) ×2,784, (C) 7,750×, (D,E) 10,000×, and (F) 12,930×.
3.9 Cytoskeleton of HuH-7 cells
Finally, we used Rhodamine-Phalloidin staining to visualize the organization of the actin cytoskeleton in HuH-7 cells, revealing their characteristic epithelial morphology (Figure 9). As expected for a hepatocyte-derived cell line, the cells exhibited a prominent cortical actin belt. This helps maintain a polygonal cell shape and facilitates strong cell-to-cell contacts in order to form monolayers. Additionally, F-actin stress fibers were visible throughout the cytoplasm, reflecting the dynamic and contractile properties of the cellular actin network. Some cells also displayed peripheral ruffling, indicating ongoing membrane remodeling activities that support cell motility and adhesion. Overall, this cytoskeletal arrangement is consistent with the hepatocellular origin of HuH-7 cells, emphasizing their capacity to maintain robust structural integrity in culture.
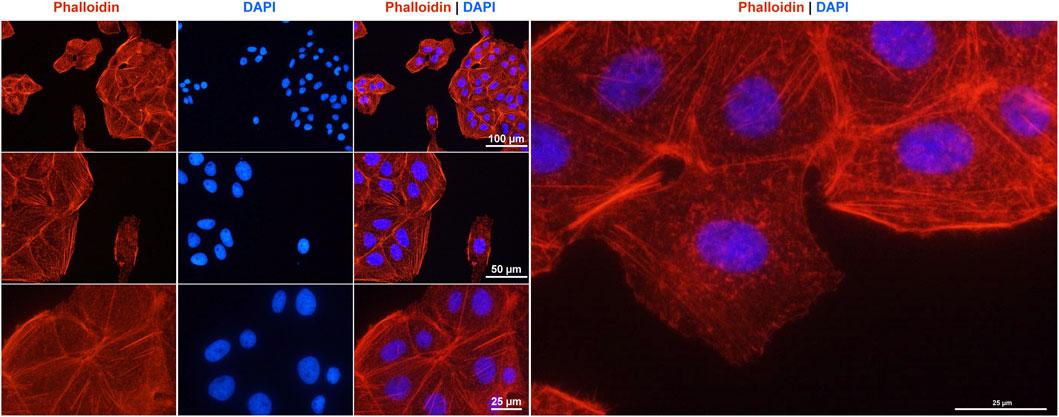
Figure 9. F-actin cytoskeleton staining in HuH-7 cells. The F- actin fibers in the cultured cells were labeled with a Rhodamine-Phalloidin probe (red) and the nuclei were counterstained with DAPI (blue). Images were captured using a Nikon Eclipse E80i fluorescence microscope at magnifications of ×200, ×400 and ×600 magnification. Scale bars (25 μm, 50 μm, and 100 µm) at different magnifications are shown.
3.10 Markers of hepatic stellate cells, Kupffer cells and liver sinusoidal endothelial cells
In our analyses, markers specific to hepatic stellate cells (HSCs) (Supplementary Table S2), Kupffer cells (Supplementary Table S3), and liver sinusoidal endothelial cells (LSECs) (Supplementary Table S4) were either absent or present only minimally in HuH-7 cells. This finding supports the conclusion that HuH-7 cells predominantly exhibit a hepatocellular phenotype rather than that of non-parenchymal liver cells. For example, the HSC-associated genes such as those encoding α-smooth muscle actin (ACTA2, which is essential for the contractile phenotype of activated perisinusoidal cells) and fibroblast activation protein alpha (FAP, which is involved in tissue remodeling and fibrotic processes) were not detected at the transcript level. Other markers, such as desmin (DES, an intermediate filament characteristic of muscle and stellate cells), decorin (DCN, an extracellular matrix proteoglycan), glial fibrillary acidic protein (GFAP, an intermediate filament), and retinol binding protein 1 (RBP1, an intracellular retinoid transporter in stellate cells) were only found in trace amounts. The absence of these core stellate cell markers highlights the hepatocyte-like nature of HuH-7 cells (Supplementary Table S2).
Similarly, the following canonical Kupffer cell markers were either absent or present at extremely low levels in HuH-7 cells: CD163 (a hemoglobin-haptoglobin scavenger receptor); C-type lectin domain family member 1B (CLEC1B) and member CLEC4E (both are pattern-recognition lectins); folate receptor β (FOLR2); Spi-C transcription factor (SPIC, which guides macrophage differentiation), Toll like receptor 9 (TLR9, which mediates innate immune responses via endosomes), CLEC4G (which is involved in pathogen recognition and immune regulation); myeloperoxidase (MPO, which is a hallmark enzyme in myeloid cells) (Supplementary Table S3). These proteins are key mediators of macrophage or immune cell activity, which further supports the idea that HuH-7 cells do not exhibit macrophage-like characteristics.
Finally, genes that are usually found in liver sinusoidal endothelial cells (LSECs), such as stabilin-1 (STAB1) and stabilin-2 (STAB2) (which are important for clearing lymph and blood waste), lymphatic vessel endothelial hyaluronan receptor-1 (LYVE1, a hyaluronan receptor found in lymphatic and sinusoidal endothelium), scavenger receptor class F member 1 (SCARF1, another scavenger receptor), and von Willebrand factor (VWF, a glycoprotein that plays a key role pivotal in platelet adhesion), were not expressed, or were only marginally expressed, in HuH-7 cells (Supplementary Table S4). These genes normally confer specialized endothelial functions that are absent in hepatocytes. Together, these results strongly support the conclusion that HuH-7 cells are of hepatocyte origin, further confirming their utility as a model for hepatic biology and liver carcinoma research.
3.11 Expression of hepatitis C virus host factors in HuH-7 cells
HuH-7 hepatoma cells and some of their derivatives, such as HuH-7.5, are the only continuous cell culture models that consistently support high-level replication of both sub-genomic replicons and fully infectious hepatitis C virus (Dächert et al., 2019). However, within this single lineage, the magnitude of viral RNA amplification varies significantly. Individual sub-clones or long-term passages can differ by up to three orders of magnitude in replication efficiency, highlighting the significant impact of subtle genetic or transcriptional drift on HCV permissiveness (Dächert et al., 2019). Specifically, seven host-dependency factors (ZNF512B, SFI1, LBHD1, CRYM, CRAMP1, THAP7, and NROB2) appear to play a crucial role in mediating HCV permissiveness (Dächert et al., 2019). In our bulk mRNA-sequencing analysis of our low-passage HuH-7 stock, we confirmed the expression of each of the HCV-permissiveness genes identified by Dächert and colleagues (Supplementary Table S5). This confirms that the molecular machinery previously associated with efficient HCV replication is intact in our HuH-7 cultures. Interestingly, we also detected the expression of THAP7 antisense RNA 1 (THAP7-AS1), a long noncoding RNA (lncRNA) that has been linked to oncogenic properties such as invasion and metastasis (Liu et al., 2022).
4 Discussion
HuH-7 cells, which were originally established in 1982 from human HCC tissue (Nakabayashi et al., 1982), have become one of the most prominent in vitro model systems for studying liver biology and disease. Since their introduction in the early 1980s, they have been widely used in biomedical research, particularly in areas such as viral hepatitis infection dynamics (Stuyver et al., 2003; Sainz et al., 2009; Padarath et al., 2024), drug metabolism (Choi et al., 2009; Bulutoglu et al., 2019; Li et al., 2022), aspects of cholestasis (Saran et al., 2022), and tumorigenesis (Chen et al., 2019; Mo and Wang, 2023). Thanks to their relatively straightforward cultivation and robust growth characteristics, these cells provide a cost-effective and reproducible platform for high-throughput assays. For example, research into hepatitis C virus replication has relied on HuH-7 cells to elucidate host-pathogen interactions and to screen antivirals prior to moving to clinical trials (Collett et al., 2021). Furthermore, HuH-7 cells have capacity to express numerous transporters relevant to drug metabolism (organic anion transporter polypeptides (OATPs), organic cation transporters (OCTs), multidrug resistance-associated proteins (MRPs), and many others, and produce and secrete various liver-specific proteins, making them indispensable for studies on lipid metabolism, iron homeostasis, and the toxicity testing of potential therapeutic compounds (Malinen et al., 2019; Mleczko-Sanecka et al., 2017; Jetter and Kullak-Ublick, 2020). Additionally, this cell line is used in xenograft models that facilitate preclinical tumor growth inhibition studies (Shao et al., 2019; Ye et al., 2025). Overall, the reliability and distinctive hepatic-like features of HuH-7 cells continue to underpin their broad adoption as a cornerstone model system in diverse areas of basic, translational, and preclinical research.
Our comprehensive analyses clearly show that HuH-7 cells have a phenotype consistent with a hepatocytic origin, rather than a non-parenchymal origin, in the liver. Firstly, the solid expression of classic hepatocyte markers (e.g., albumin, α-fetoprotein, and HNF4α) at both the transcript and protein levels clearly indicates a hepatocellular lineage. HuH-7 cells also express large quantities of keratin 19 (K19), a type I intermediate filament that is strongly implicated in the progression of various human carcinomas. By reinforcing cytoskeletal integrity and interacting with key signaling molecules, K19 promotes cancer cell survival, facilitates invasive behavior, and supports angiogenic processes that are essential for tumor expansion, particularly in the invasiveness of hepatocellular carcinomas (Takano et al., 2016; Govaere et al., 2014). This cytoskeletal protein therefore contributes to the aggressive phenotype of malignancies, making it a valuable marker and potential therapeutic target in hepatocellular carcinoma and other tumor types. Serpin A1, also known as α-1 antitrypsin, is robustly expressed in HuH-7 cells. This key acute-phase protein inhibits neutrophil elastase and other proteases. Under normal conditions, it maintains proteolytic balance and contributes significantly to immune regulation and inflammatory responses in the hepatic environment. Its capacity to regulate the proteolytic activity of enzymes that degrade extracellular matrices in the tumor environment may influence tumor progression and metastatic potential, which could explain the high activity of HuH-7 cells in xenograft models (Shao et al., 2019; Ye et al., 2025).
In our analysis, we observed that despite the relatively high quantities of FABP1 mRNA present, the corresponding FABP1 protein was either undetectable or exhibited very low levels in HuH-7 cells. This discrepancy may be attributed to several factors, including post-transcriptional regulation mechanisms such as microRNA-mediated repression, which can inhibit translation or promote mRNA degradation. Additionally, post-translational modifications or rapid protein degradation pathways could also contribute to the reduced levels of FABP1 protein detected in our Western blot analysis.
By contrast, markers that are specific to hepatic stellate cells (e.g., ACTA2, FAP, desmin, and retinol binding protein 1), Kupffer cells (e.g., CD163, CLEC1B, CLEC4E, FOLR2, SPIC, TLR9, and MPO), and liver sinusoidal endothelial cells (e.g., STAB1, STAB2, LYVE1, SCARF1, and von Willebrand factor) were either absent or present at negligible levels. Therefore, our findings reinforce that HuH-7 cells are derived from hepatocytes, corroborating the original description of this cell line as originating from a well-differentiated HCC.
Interestingly, we observed low expression of cytochrome P450 genes in HuH-7 cells, confirming a previous report (Bulutoglu et al., 2019). In primary hepatocytes, the expression of these genes is regulated by a network of transcription factors that respond to both endogenous signals and xenobiotic compounds (Ekiciler et al., 2023). At the core of this regulatory network are nuclear receptors such as the pregnane X receptor (PXR, encoded by the nuclear receptor subfamily 1 group I member 3, NR1I2 gene) and the constitutive androstane receptor (CAR, encoded by the nuclear receptor subfamily 1 group I member 3 gene (NR1I3)). Upon ligand binding, these receptors form heterodimers with the retinoid X receptor (RXR) to activate CYP gene transcription. The aryl hydrocarbon receptor (AHR) is also involved, particularly in the induction of CYP1 family members after binding to environmental contaminants (Ye et al., 2019). Additionally, HNF4α plays a pivotal role in regulating the basal expression of several CYP enzymes (Jover et al., 2001). Together, these transcription factors ensure that cytochrome P450 levels adjust dynamically in response to metabolic states and the presence of potentially harmful substances. However, under the basal conditions analyzed, only AHR and HNF4α were found to be expressed at moderate levels (AHR: ΣTPM ∼48; HNF4α: ΣTPM ∼102), while the mRNA expression of NR1I3 (ΣTPM 0.05297) and NR1I2 (ΣTPM ∼3.3) was extremely low. Based on these findings, it is reasonable to conclude that NR1I3 and NR1I2 play a more significant role in regulating CYP genes in HuH-7 cells. Moreover, previous studies have shown that HuH-7 cells substantially induce CYP3A4 mRNA, protein and activity when reaching confluency by endogenous induction of the pregnane X receptor (PXR) as a result of cell-cell contact, suggesting that factors dependent on culture-conditions are also relevant for the expression of CYP genes (Sivertsson et al., 2013). This suggests that these cells could be an ideal model for investigating the underlying mechanism of CYP gene regulation in future studies.
Another important finding is the presence of complex genomic rearrangements in HuH-7 cells, which could only be resolved through comprehensive molecular cytogenetic analyses. Overall, we identified similarities in certain translocations and copy numbers of chromosomes when compared with previously published SKY data (Kasai et al., 2018). However, our MCB study shows that neither M-FISH nor aCGH alone is able to provide insights into the karyotype of an advanced tumor cell line. The results of aCGH could be used to highlight that HuH-7 is indeed a suitable model for hepatocellular carcinoma. However, the relatively simple aCGH pattern provided no indication of the many complex rearrangements seen in MCB. This suggests that studying this and other cell lines using new approaches like optical genomic mapping (Paulraj et al., 2024) will lead to a better understanding of the influence of chromothriptic events in cell line evolution.
Kasai and colleagues showed that the HuH-7 hepatoma cell line exhibits extensive karyotypic diversity, with the number of chromosome typically clustering around 60, but ranging from 55 to 63 (Kasai et al., 2018). This is consistent with our finding that the cell line has an almost triploid karyotype. Multi-color fluorescence in situ hybridization (FISH) in the aforementioned study revealed abnormalities in every chromosome except chromosome 21, which appeared normal only by visual inspection. This chromosome was later found to exhibit copy-neutral loss of heterozygosity using SNP microarray. In our analysis, we confirmed that many chromosomes exhibit complex derivative forms. However, we also identified large deletions in chromosome 21. In line with the previous study, we confirmed the absence of the Y chromosome in HuH-7 cells. Complete loss of the Y chromosome (LOY) is frequently observed in cells originating from male tumors (Kido and Lau, 2015; Brown and Machiela, 2020). Recent studies have demonstrated that LOY, the most prevalent somatic alteration in men, is associated with aggressive cancer and poor prognosis (Abdel-Hafiz et al., 2023; Chen et al., 2025). Current research has revealed that LOY creates common dependencies on DEAD-box helicase 3 X-linked (DDX3X) and eukaryotic translation initiation factor 1A X-linked (EIF1AX) in male cell lines (Qi et al., 2023). These factors are abundantly expressed in HuH-7 cells. Therefore, HuH-7 cells may be useful for investigating how these two proteins can be targeted therapeutically, and the pathways through which they contribute to the multiple inter-chromosomal rearrangements, deletions, duplications, and pronounced genomic instability we observed in HuH-7 cells.
Our vCGH analysis of HuH-7 cells revealed several genomic alterations. Gains were identified on the short arms of chromosomes 3, 5, 18, and 20, and on the long arms of chromosomes 15, 16, and 20. Conversely, were detected losses on the short arms of chromosomes 5, 6, 8, 11, 12, and 17, and on the long arms of chromosomes 4, 8, 11, 12, 13, 14, 21, and 22. These genomic changes could potentially influence key cellular functions such as proliferation and apoptosis in HuH-7 cells. Therefore, it is crucial for researchers to consider these findings when conducting experiments involving HuH-7 cells, in order to accurately interpret the results and understand how the cells behave in relation to its genomic landscape.
The high level of heterogeneity observed in HuH-7 cells by us and others again underscores the importance of routine cell line characterization and quality control to ensure accurate and reproducible experimental results. In our view, this discrepancy in genetic findings underscores how ongoing subcloning, prolonged passage in culture, and other external factors can drive genomic evolution within the same cell line, resulting in divergence from earlier reference profiles. Despite these variations, our STR analysis showed a 100% match with the previously established STR profile for HuH-7 (Kasai et al., 2018). This finding that validates the identity of our current cell population, confirming that the observed alterations likely reflect clonal divergence over time rather than misidentification.
Our comprehensive (cyto)genetic and RNA-seq characterization complements and extends a previous functional study (Dächert et al., 2019). While their work focused on identifying transcriptomic differences that influence HCV permissiveness in various HuH-7 sub-clones, our data establishes a validated STR profile, resolves complex chromosomal rearrangements, and provides a high-resolution bulk-RNA expression atlas of a low-passage reference HuH-7 stock. Analysis of our RNA-seq dataset in conjunction with their candidate genes reveals that THAP7 and NR0B2 are expressed at intermediate to high levels, while CRYM, LBHD1, and CRAMP1 are present at lower but detectable amounts. This consistency suggests a cellular state that is inherently permissive to HCV but still responsive to further modulation. Importantly, we confirm robust expression of the classical HCV-entry receptors CD81, SCARB1, CLDN1 and OCLN at the mRNA level, confirming the suitability of our HuH-7 cells for virus-host interaction studies. The previous study by Dächert and colleagues highlights specific transcriptional determinants of viral replication, while our work provides an authenticated genomic framework and transcript abundance reference that will aid in dissecting how these, and newly emerging, host factors interact with the complex karyotype of HuH-7 cells to influence HCV biology.
In light of the significant heterogeneity reported in numerous studies, including those documented here, it is crucial for laboratories to consistently authenticate and characterize their cell lines at the genetic level (Horbach and Halffman, 2017; Souren et al., 2022; Weiskirchen et al., 2023). Routine short tandem repeat (STR) profiling and molecular analyses help to detect possible cross-contamination, confirm cell line identity, and track genetic drift, all of which could influence experimental outcomes (Horbach and Halffman, 2017; Souren et al., 2022; Weiskirchen et al., 2023).
In addition to commercial STR kits, several low-cost assays can be incorporated into the routine workflow to confirm HuH-7 identity before extensive experimentation. (i) A rapid multiplex PCR for species- and sex-determining loci (e.g., amelogenin) can rule out cross-species contamination within 2 hours. (ii) HuH-7 cells carry a stable TP53 Y220C mutation (Tseng et al., 2022) and lack the Y chromosome. Both charactersitics can be confirmed through Sanger sequencing or a single PCR that detects the p53 codon-220 variant along with an SRY amplicon. (iii) Our bulk RNA-seq data demonstrates very high expression of albumin, α-fetoprotein (AFP), hepatocyte-nuclear-factor-4α (HNF4A) and keratin-19 (KRT19), along with minimal levels of hepatic stellate cell (ACTA2) or Kupffer cell (CD163) markers. A simple four-gene qPCR or Western blot panel (ALB, AFP, HNF4A, and KRT19) can reliably differentiate authentic HuH-7 from other hepatic or non-hepatic cell lines. These PCR/Western assays can be conducted using standard reagents and equipment, offering a practical alternative or rapid supplement to full STR profiling for daily cell line authentication.
In the context of HuH-7, our transcriptomic data also provide a valuable resource for researchers seeking to use to study tumor formation, drug metabolism, or viral infection. Notably, we identified transcripts and proteins that are crucial for liver-specific processes, such as iron storage (ferritin chain proteins), lipoprotein metabolism (apolipoproteins), and the acute-phase response proteins (e.g., α1-antitrypsin). These expression patterns further validate the utility of HuH-7 for investigating hepatic functions and pathophysiological pathways relevant to HCC. HuH-7 cells express a large number of genes that are specific for liver, HCV permissiveness, drug metabolism, cholestasis, and tumorigenesis (Figure 10). The reference atlas presented here will serve as a guide for the rational design of subsequent in vivo studies. This will enable researchers to choose genomically characterized HuH-7 sub-clones and develop xenograft experiments that investigate the functional significance of particular alterations within a physiological setting. Additionally, our expression data will provide the research community with the opportunity to conduct systematic analysis using GO, KEGG, and GSEA methods, potentially revealing further pathway enrichments and functional networks that regulate HuH-7 biology. This will further enhance the value of the molecular profile outlined in this study.
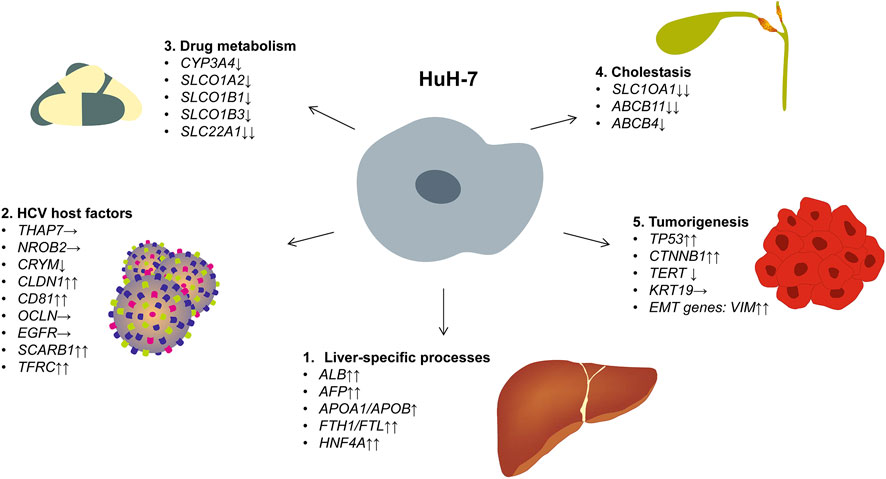
Figure 10. Gene expression in HuH-7 cells. The figure illustrates the expression of representative genes associated with liver-specific functions, hepatitis C virus permissiveness, drug metabolism, cholestasis, and tumorigenesis. Based on our bulk mRNA sequencing data, expression levels are categorized as follows: ↑↑ very high expression (TPM >100), ↑ high expression (TPM 50–100), → moderate expression (TPM 10–50), ↓ low expression (TPM 1–10), and ↓↓ very low/no expression (TPM <1). The complete mRNA expression data of HuH-7 cells, including exact TPM values for each gene, are depicted in Supplementary Table S1.
Despite the high overall concordance that we observed with historical karyotypes and STR data, HuH-7 must be regarded as a dynamic, evolving population in which passage number, culture conditions and sporadic sub-cloning can all create measurable genetic and phenotypic drift. To minimize inter-laboratory variability we recommend a two-tier, “same-day” authentication workflow that laboratories can routinely apply before embarking on extensive experimentation. Firstly, a rapid multiplex PCR that amplifies the amelogenin sex locus together with the TP53 c.659A>G (p.Y220C) hotspot, present in all bona fide HuH-7 stocks, confirms both species origin and the signature tumor mutation within 2 hours. Secondly, a downstream four-marker expression panel, implemented either as qPCR or Western blot, interrogates albumin (ALB), α-fetoprotein (AFP), hepatocyte-nuclear-factor-4α (HNF4A) and keratin-19 (KRT19). These genes are more than 50-fold enriched in our bulk-RNA dataset, whereas transcripts typical of hepatic stellate cells (ACTA2), Kupffer cells (CD163) or LSEC (STAB1/2) are virtually absent (Supplementary Tables S1–S4). Nevertheless, it might be possible that the expression pattern is slightly different in other HuH-7 sub-clones or in batches with different passage numbers, which might reflect clonal drift and passage-related adaptations. Therefore, this underscores the need for each laboratory to verify key markers in its own stocks before undertaking critical experiments.
Together, the mutation/sex PCR and the four-marker hepatocyte panel can be completed with standard reagents in a single working day and provide an inexpensive yet robust benchmark against the molecular portrait presented here, allowing individual laboratories to detect cross-contamination, monitor clonal drift and harmonize their HuH-7 sub-clones with the reference stock characterized in this study.
5 Conclusion
Our analyses confirmed the authenticity and hepatocytic origin of HuH-7, while revealing genetic alterations indicative of its tumor-derived background. Short tandem repeat profiling verified the identity of the cell line, and spectral karyotyping revealed complex chromosomal rearrangements and aneuploidy. Expression studies on mRNA and protein levels confirmed the expression of key liver-specific markers such as albumin, α-fetoprotein, and HNF4α, and excluded the presence of non-parenchymal liver cells. These findings emphasize the value of the HuH-7 cell line in studying liver carcinogenesis, hepatic functions, drug metabolism, and viral infections. However, the observed genetic and phenotypic variability underscores the importance of routine authentication and molecular characterization to ensure reliable and reproducible research.
Data availability statement
The original contributions presented in the study are included in the article/Supplementary Material, further inquiries can be directed to the corresponding authors.
Author contributions
DL: Data curation, Writing – review and editing, Investigation. TL: Funding acquisition, Writing – review and editing, Investigation, Resources, Formal Analysis, Conceptualization, Data curation, Validation, Supervision, Methodology, Project administration. SK: Data curation, Writing – review and editing, Investigation. AW: Writing – review and editing, Investigation, Data curation. CP: Investigation, Formal Analysis, Writing – review and editing, Data curation. EB: Formal Analysis, Writing – review and editing, Data curation, Investigation. KH: Data curation, Writing – review and editing, Investigation. DK: Data curation, Writing – review and editing, Investigation. SS-L: Formal Analysis, Data curation, Investigation, Writing – review and editing. RW: Formal Analysis, Writing – original draft, Resources, Writing – review and editing, Data curation, Investigation, Funding acquisition, Visualization, Project administration, Supervision, Conceptualization, Methodology, Validation.
Funding
The author(s) declare that financial support was received for the research and/or publication of this article. RW is supported by grants from the German Research Foundation (project WE2554/17–1), the Deutsche Krebshilfe (grant 70115581), and the Interdisciplinary Centre for Clinical Research within the Faculty of Medicine at the RWTH Aachen University (grant PTD 1–5).
Acknowledgements
The authors would like to thank the centralized RWTH Biomaterial Bank at the RWTH Aachen University for providing the human liver tissue samples. They would also like to thank Julia Franzen, Anna Rudzinski, Jasmin Hübner, and Mohamed Hamdy Elsafi Mabrouk, of the Genomics Facility at the Interdisciplinary Centre for Clinical Research within the Faculty of Medicine, RWTH Aachen University, for their expertise in conducting the NGS and bioinformatics analyses.
Conflict of interest
The authors declare that the research was conducted in the absence of any commercial or financial relationships that could be construed as a potential conflict of interest.
The author(s) declared that they were an editorial board member of Frontiers, at the time of submission. This had no impact on the peer review process and the final decision.
Generative AI statement
The author(s) declare that no Generative AI was used in the creation of this manuscript.
Any alternative text (alt text) provided alongside figures in this article has been generated by Frontiers with the support of artificial intelligence and reasonable efforts have been made to ensure accuracy, including review by the authors wherever possible. If you identify any issues, please contact us.
Publisher’s note
All claims expressed in this article are solely those of the authors and do not necessarily represent those of their affiliated organizations, or those of the publisher, the editors and the reviewers. Any product that may be evaluated in this article, or claim that may be made by its manufacturer, is not guaranteed or endorsed by the publisher.
Supplementary material
The Supplementary Material for this article can be found online at: https://www.frontiersin.org/articles/10.3389/fcell.2025.1648639/full#supplementary-material
References
Abdel-Hafiz, H. A., Schafer, J. M., Chen, X., Xiao, T., Gauntner, T. D., Li, Z., et al. (2023). Y chromosome loss in cancer drives growth by evasion of adaptive immunity. Nature 619 (7970), 624–631. doi:10.1038/s41586-023-06234-x
Almeida, J. L., and Korch, C. T. (2023). “Authentication of human and mouse cell lines by short tandem repeat (STR) DNA genotype analysis,” in Assay guidance manual. Editors S. Markossian, A. Grossman, H. Baskir, M. Arkin, D. Auld, and C. Austin (Bethesda (MD): Eli Lilly and Company and the National Center for Advancing Translational Sciences). Available online at: https://www.ncbi.nlm.nih.gov/books/NBK144066/.
Arandhara, V. L., McClure, C. P., Tarr, A. W., Chappell, S., Morgan, K., Baumert, T. F., et al. (2023). Scavenger receptor class B type I genetic variants associated with disease severity in chronic hepatitis C virus infection. J. Med. Virol. 95 (1), e28331. doi:10.1002/jmv.28331
Aust, N., Schüle, S., Altendorf-Hofmann, A. K., Chen, Y., Knösel, T., Dirsch, O., et al. (2013). Loss of chromosome 4 correlates with better long-term survival and lower relapse rate after R0-resection of colorectal liver metastases. J. Cancer Res. Clin. Oncol. 139 (11), 1861–1867. doi:10.1007/s00432-013-1505-2
Brown, D. W., and Machiela, M. J. (2020). Why Y? Downregulation of chromosome Y genes potentially contributes to elevated cancer risk. J. Natl. Cancer Inst. 112 (9), 871–872. doi:10.1093/jnci/djz236
Bulutoglu, B., Mert, S., Rey-Bedón, C., Deng, S. L., Yarmush, M. L., and Usta, O. B. (2019). Rapid maturation of the hepatic cell line Huh7 via CDK inhibition for PXR dependent CYP450 metabolism and induction. Sci. Rep. 9 (1), 15848. doi:10.1038/s41598-019-52174-w
Carriquí-Madroñal, B., Sheldon, J., Duven, M., Stegmann, C., Cirksena, K., Wyler, E., et al. (2023). The matrix metalloproteinase ADAM10 supports hepatitis C virus entry and cell-to-cell spread via its sheddase activity. PLoS Pathog. 19 (11), e1011759. doi:10.1371/journal.ppat.1011759
Chen, Y., Chen, X., Ding, X., and Wang, Y. (2019). Afatinib, an EGFR inhibitor, decreases EMT and tumorigenesis of Huh-7 cells by regulating the ERK-VEGF/MMP9 signaling pathway. Mol. Med. Rep. 20 (4), 3317–3325. doi:10.3892/mmr.2019.10562
Chen, X., Shen, Y., Choi, S., Abdel-Hafiz, H. A., Basu, M., Hoelzen, L., et al. (2025). Concurrent loss of the Y chromosome in cancer and T cells impacts outcome. Nature 642, 1041–1050. doi:10.1038/s41586-025-09071-2
Choi, S., Sainz, B. Jr, Corcoran, P., Uprichard, S., and Jeong, H. (2009). Characterization of increased drug metabolism activity in dimethyl sulfoxide (DMSO)-treated Huh7 hepatoma cells. Xenobiotica 39 (3), 205–217. doi:10.1080/00498250802613620
Collett, S., Torresi, J., Silveira, L. E., Truong, V. K., Christiansen, D., Tran, B. M., et al. (2021). Investigating virus-host cell interactions: comparative binding forces between hepatitis C virus-like particles and host cell receptors in 2D and 3D cell culture models. J. Colloid Interface Sci. 592, 371–384. doi:10.1016/j.jcis.2021.02.067
Dächert, C., Gladilin, E., and Binder, M. (2019). Gene expression profiling of different Huh7 variants reveals novel hepatitis C virus host factors. Viruses 12 (1), 36. doi:10.3390/v12010036
Ding, Q., Lee, Y. K., Schaefer, E. A., Peters, D. T., Veres, A., Kim, K., et al. (2013). A TALEN genome-editing system for generating human stem cell-based disease models. Cell Stem Cell 12 (2), 238–251. doi:10.1016/j.stem.2012.11.011
Ekiciler, A., Chen, W. L. K., Bo, Y., Pugliano, A., Donzelli, M., Parrott, N., et al. (2023). Quantitative cytochrome P450 3A4 induction risk assessment using human hepatocytes complemented with pregnane X receptor-activating profiles. Drug Metab. Dispos. 51 (3), 276–284. doi:10.1124/dmd.122.001132
Ganesan, L. P., Mates, J. M., Cheplowitz, A. M., Avila, C. L., Zimmerer, J. M., Yao, Z., et al. (2016). Scavenger receptor B1, the HDL receptor, is expressed abundantly in liver sinusoidal endothelial cells. Sci. Rep. 6, 20646. doi:10.1038/srep20646
Gao, H., Jin, Z., Bandyopadhyay, G., Wang, G., Zhang, D., Rocha, K. C. E., et al. (2022). Aberrant iron distribution via hepatocyte-stellate cell axis drives liver lipogenesis and fibrosis. Cell Metab. 34 (8), 1201–1213.e5. doi:10.1016/j.cmet.2022.07.006
Govaere, O., Komuta, M., Berkers, J., Spee, B., Janssen, C., de Luca, F., et al. (2014). Keratin 19: a key role player in the invasion of human hepatocellular carcinomas. Gut 63 (4), 674–685. doi:10.1136/gutjnl-2012-304351
Guan, X. Y., Fang, Y., Sham, J. S., Kwong, D. L., Zhang, Y., Liang, Q., et al. (2000). Recurrent chromosome alterations in hepatocellular carcinoma detected by comparative genomic hybridization. Genes Chromosom. Cancer 29 (2), 110–116. doi:10.1002/1098-2264(2000)9999:9999<::AID-GCC1022>3.0.CO;2-V
Hastings, R. J., Moore, S., and Chia, N. (2024). ISCN 2024: an international system for human cytogenomic nomenclature. Switzerland: Karger.
Horbach, SPJM, and Halffman, W. (2017). The ghosts of HeLa: how cell line misidentification contaminates the scientific literature. PLoS One 12 (10), e0186281. doi:10.1371/journal.pone.0186281
Huck, I., Morris, E. M., Thyfault, J., and Apte, U. (2021). Hepatocyte-specific hepatocyte nuclear factor 4 alpha (HNF4) deletion decreases resting energy expenditure by disrupting lipid and carbohydrate homeostasis. Gene Expr. 20 (3), 157–168. doi:10.3727/105221621X16153933463538
Jetter, A., and Kullak-Ublick, G. A. (2020). Drugs and hepatic transporters: a review. Pharmacol. Res. 154, 104234. doi:10.1016/j.phrs.2019.04.018
Jiraviriyakul, A., Nensat, C., Promchai, S., Chaiaun, Y., Hoiraya, Y., Yamnak, N., et al. (2025). High mobility group box 1 is potential target therapy for inhibiting metastasis and enhancing drug sensitivity of hepatocellular carcinoma. Int. J. Mol. Sci. 26 (8), 3491. doi:10.3390/ijms26083491
Jover, R., Bort, R., Gómez-Lechón, M. J., and Castell, J. V. (2001). Cytochrome P450 regulation by hepatocyte nuclear factor 4 in human hepatocytes: a study using adenovirus-mediated antisense targeting. Hepatology 33 (3), 668–675. doi:10.1053/jhep.2001.22176
Kasai, F., Hirayama, N., Ozawa, M., Satoh, M., and Kohara, A. (2018). HuH-7 reference genome profile: complex karyotype composed of massive loss of heterozygosity. Hum. Cell 31 (3), 261–267. doi:10.1007/s13577-018-0212-3
Ke, H., Guay, K. P., Flotte, T. R., Gierasch, L. M., Gershenson, A., and Hebert, D. N. (2022). Secretion of functional α1-antitrypsin is cell type dependent: implications for intramuscular delivery for gene therapy. Proc. Natl. Acad. Sci. U. S. A. 119 (31), e2206103119. doi:10.1073/pnas.2206103119
Kido, T., and Lau, Y. F. (2015). Roles of the Y chromosome genes in human cancers. Asian J. Androl. 17 (3), 373–380. doi:10.4103/1008-682X.150842
Korch, C. T., Hall, E. M., Dirks, W. G., Sykes, G. R., Capes-Davis, A., Butler, J. M., et al. (2021). Authentication of human cell lines: standardization of short tandem repeat (STR) profiling - revised 2022, ANSI/ATCC ASN-0002-2022. American National Standards Institute - American Type Culture Collection Standards Development Organization. Available online at: https://webstore.ansi.org/standards/atcc/ansiatccasn00022022?srsltid=AfmBOoqKQlHmNFzb1ye58mHQ9xp1HLEllG870szhSxoYbCXWpkM3Pq7Y June 10, 2025).
Li, C. Q., Liu, Z. Q., Liu, S. S., Zhang, G. T., Jiang, L., Chen, C., et al. (2022). Transcriptome analysis of liver cancer cell Huh-7 treated with metformin. Front. Pharmacol. 13, 822023. doi:10.3389/fphar.2022.822023
Li, X., Wang, Y., Liu, J., Gao, T., Cao, L., Yan, M., et al. (2025). Dysregulation of the SREBP pathway is associated with poor prognosis and serves as a potential biomarker for the diagnosis of hepatocellular carcinoma. Mol. Med. Rep. 31 (5), 112. doi:10.3892/mmr.2025.13477
Liehr, T., Kankel, S., Buhl, E. M., Schröder-Lange, S. K., and Weiskirchen, R. (2024). Genetic characteristics of the rat fibroblast cell line rat-1. Cells 14 (1), 21. doi:10.3390/cells14010021
Liehr, T., Kankel, S., Hardt, K. S., Buhl, E. M., Noels, H., Keller, D. T., et al. (2025). Genetic and molecular characterization of H9c2 rat myoblast cell line. Cells 14 (7), 502. doi:10.3390/cells14070502
Liu, H. T., Zou, Y. X., Zhu, W. J., Sen-Liu, , Zhang, G. H., Ma, R. R., et al. (2022). lncRNA THAP7-AS1, transcriptionally activated by SP1 and post-transcriptionally stabilized by METTL3-mediated m6A modification, exerts oncogenic properties by improving CUL4B entry into the nucleus. Cell Death Differ. 29 (3), 627–641. doi:10.1038/s41418-021-00879-9
Malinen, M. M., Ito, K., Kang, H. E., Honkakoski, P., and Brouwer, K. L. R. (2019). Protein expression and function of organic anion transporters in short-term and long-term cultures of Huh7 human hepatoma cells. Eur. J. Pharm. Sci. 130, 186–195. doi:10.1016/j.ejps.2019.01.022
Martin, D. N., and Uprichard, S. L. (2013). Identification of transferrin receptor 1 as a hepatitis C virus entry factor. Proc. Natl. Acad. Sci. U. S. A. 110 (26), 10777–10782. doi:10.1073/pnas.1301764110
Mleczko-Sanecka, K., da Silva, A. R., Call, D., Neves, J., Schmeer, N., Damm, G., et al. (2017). Imatinib and spironolactone suppress hepcidin expression. Haematologica 102 (7), 1173–1184. doi:10.3324/haematol.2016.162917
Mo, Z., and Wang, Z. (2023). Deciphering role of lncRNA 91H in liver cancer: impact on tumorigenesis. Cell J. 25 (12), 829–838. doi:10.22074/cellj.2023.2010456.1395
Nakabayashi, H., Taketa, K., Miyano, K., Yamane, T., and Sato, J. (1982). Growth of human hepatoma cells lines with differentiated functions in chemically defined medium. Cancer Res. 42 (9), 3858–3863. PMID: 6286115.
National Center for Biotechnology Information (NCBI) (2025). National library of medicine (US). Bethesda (MD): National Center for Biotechnology Information. Available online at: https://pubmed.ncbi.nlm.nih.gov/(Accessed June 10, 2025).
Niu, Z., Zhao, Q., Cao, H., Yang, B., and Wang, S. (2025). Hypoxia-activated oxidative stress mediates SHP2/PI3K signaling pathway to promote hepatocellular carcinoma growth and metastasis. Sci. Rep. 15 (1), 4847. doi:10.1038/s41598-025-89137-3
Padarath, K., Deroubaix, A., Naicker, P., Stoychev, S., and Kramvis, A. (2024). Comparison of the proteome of Huh7 cells transfected with hepatitis B virus subgenotype A1, with or without G1862T. Curr. Issues Mol. Biol. 46 (7), 7032–7047. doi:10.3390/cimb46070419
Paulraj, P., Barrie, E., and Jackson-Cook, C. (2024). Optical genome mapping reveals balanced and unbalanced genetic changes associated with tumor-forming potential in an early-stage prostate cancer epithelial subline (M2205). Mol. Genet. Genomic Med. 12 (1), e2307. doi:10.1002/mgg3.2307
Qi, M., Pang, J., Mitsiades, I., Lane, A. A., and Rheinbay, E. (2023). Loss of chromosome Y in primary tumors. Cell 186, 3125–3136.e11. doi:10.1016/j.cell.2023.06.006
Sainz, B. Jr, TenCate, V., and Uprichard, S. L. (2009). Three-dimensional Huh7 cell culture system for the study of hepatitis C virus infection. Virol. J. 6, 103. doi:10.1186/1743-422X-6-103
Saran, C., Fu, D., Ho, H., Klein, A., Fallon, J. K., Honkakoski, P., et al. (2022). A novel differentiated HuH-7 cell model to examine bile acid metabolism, transport and cholestatic hepatotoxicity. Sci. Rep. 12 (1), 14333. doi:10.1038/s41598-022-18174-z
Schröder, S. K., Schüler, H. M., Petersen, K. V., Tesauro, C., Knudsen, B. R., Pedersen, F. S., et al. (2022). Genetic and molecular characterization of the immortalized murine hepatic stellate cell line GRX. Cells 11 (9), 1504. doi:10.3390/cells11091504
Shao, Y. Y., Li, Y. S., Hsu, H. W., Lin, H., Wang, H. Y., Wo, R. R., et al. (2019). Potent activity of composite cyclin dependent kinase inhibition against hepatocellular carcinoma. Cancers (Basel) 11 (10), 1433. doi:10.3390/cancers11101433
Sivertsson, L., Edebert, I., Palmertz, M. P., Ingelman-Sundberg, M., and Neve, E. P. (2013). Induced CYP3A4 expression in confluent Huh7 hepatoma cells as a result of decreased cell proliferation and subsequent pregnane X receptor activation. Mol. Pharmacol. 83 (3), 659–670. doi:10.1124/mol.112.082305
Souren, N. Y., Fusenig, N. E., Heck, S., Dirks, W. G., Capes-Davis, A., Bianchini, F., et al. (2022). Cell line authentication: a necessity for reproducible biomedical research. EMBO J. 41 (14), e111307. doi:10.15252/embj.2022111307
Stuyver, L. J., McBrayer, T. R., Tharnish, P. M., Hassan, A. E., Chu, C. K., Pankiewicz, K. W., et al. (2003). Dynamics of subgenomic hepatitis C virus replicon RNA levels in Huh-7 cells after exposure to nucleoside antimetabolites. J. Virol. 77 (19), 10689–10694. doi:10.1128/jvi.77.19.10689-10694.2003
Takano, M., Shimada, K., Fujii, T., Morita, K., Takeda, M., Nakajima, Y., et al. (2016). Keratin 19 as a key molecule in progression of human hepatocellular carcinomas through invasion and angiogenesis. BMC Cancer 16 (1), 903. doi:10.1186/s12885-016-2949-y
Tseng, T. H., Wang, C. J., Lee, Y. J., Shao, Y. C., Shen, C. H., Lee, K. C., et al. (2022). Suppression of the proliferation of Huh7 hepatoma cells involving the downregulation of mutant p53 protein and inactivation of the STAT 3 pathway with ailanthoidol. Int. J. Mol. Sci. 23 (9), 5102. doi:10.3390/ijms23095102
Weise, A., Mrasek, K., Fickelscher, I., Claussen, U., Cheung, S. W., Cai, W. W., et al. (2008). Molecular definition of high-resolution multicolor banding probes: first within the human DNA sequence anchored FISH banding probe set. J. Histochem Cytochem 56 (5), 487–493. doi:10.1369/jhc.2008.950550
Weiskirchen, R. (2025). Misidentified cell lines: failures of peer review, varying journal responses to misidentification inquiries, and strategies for safeguarding biomedical research. Res. Int. Peer Rev. 10, 12. in press. doi:10.1186/s41073-025-00170-2
Weiskirchen, S., Schröder, S. K., Buhl, E. M., and Weiskirchen, R. (2023). A beginner's guide to cell culture: practical advice for preventing needless problems. Cells 12 (5), 682. doi:10.3390/cells12050682
Ye, W., Chen, R., Chen, X., Huang, B., Lin, R., Xie, X., et al. (2019). AhR regulates the expression of human cytochrome P450 1A1 (CYP1A1) by recruiting Sp1. FEBS J. 286 (21), 4215–4231. doi:10.1111/febs.14956
Ye, M., Chen, S., Lu, C., Wu, Y., Tian, J., Han, A., et al. (2025). Cinobufagin inhibits hepatocellular carcinoma EMT-Like stemness via VEGF/VEGFR2 autocrine signaling. Discov. Oncol. 16 (1), 930. doi:10.1007/s12672-025-02707-9
Keywords: molecular profiling, tumorigenesis, drug metabolism, hepatocellular carcinoma, genetic characterization, cell line authentication, transcriptomic analysis, HuH-7
Citation: Luis DD, Liehr T, Kankel S, Weise A, Pentzold C, Buhl EM, Hardt KS, Keller DT, Schröder-Lange SK and Weiskirchen R (2025) Decoding HuH-7: a comprehensive genetic and molecular portrait of a widely used hepatocellular carcinoma model. Front. Cell Dev. Biol. 13:1648639. doi: 10.3389/fcell.2025.1648639
Received: 18 June 2025; Accepted: 21 October 2025;
Published: 11 November 2025.
Edited by:
Cristina Montiel Duarte, Nottingham Trent University, United KingdomReviewed by:
Jun Huang, Zhengzhou University, ChinaJuan Contreras Mancilla, Instituto Nacional de Enfermedades Neoplásicas (INEN), Peru
Khoa Nguyen, Nguyen Tat Thanh University, Vietnam
Copyright © 2025 Luis, Liehr, Kankel, Weise, Pentzold, Buhl, Hardt, Keller, Schröder-Lange and Weiskirchen. This is an open-access article distributed under the terms of the Creative Commons Attribution License (CC BY). The use, distribution or reproduction in other forums is permitted, provided the original author(s) and the copyright owner(s) are credited and that the original publication in this journal is cited, in accordance with accepted academic practice. No use, distribution or reproduction is permitted which does not comply with these terms.
*Correspondence: Ralf Weiskirchen, cndlaXNraXJjaGVuQHVrYWFjaGVuLmRl; Thomas Liehr, dGhvbWFzLmxpZWhyQG1lZC51bmktamVuYS5kZQ==