 Marina S. Folguieri
 Bruno Calsa
 Patricia Aline Boer
 José Antonio Rocha Gontijo
- Fetal Programming and Hydroelectrolyte Metabolism Laboratory, Department of Internal Medicine, Nucleus of Medicine and Experimental Surgery, FCM, Campinas, Brazil
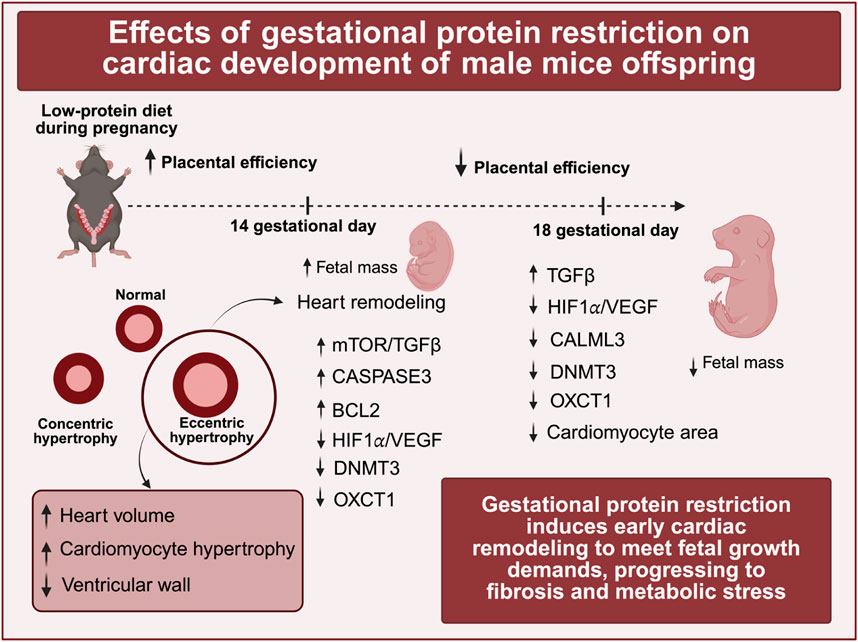
Introduction: Maternal protein restriction in animal models poses significant risks that lead to detrimental outcomes such as decreased birth weights, reduced nephron counts, neurological disorders, and increased arterial hypertension. Previous studies have shown that gestational protein deficiency is linked to reductions in cardiac mass, an increased presence of cardiac fibroblasts, and the development of fibrosis in both the left and right ventricles of adult rodents. This leads to the hypothesis that nutritional deprivation negatively impacts cellular proliferation mechanisms, ultimately resulting in a decrease in cell populations.
Aims: The present study aims to elucidate the complex relationships among growth factor signaling, molecular expression profiles, and developmental pathways that underpin cardiac morphogenesis during the embryonic and fetal stages of development. We focus on the potentially harmful effects of maternal protein restriction on the cardiogenesis of the offspring.
Methods: Methodologically, we analyzed the responses of female mice subjected to protein deficiency and evaluated the effects on their offspring, with a particular emphasis on early cardiac remodeling and key cellular pathways. Specifically, we analyzed cleaved caspase-3 as a marker for apoptosis, along with autophagy. Techniques employed include RT-qPCR, immunohistochemistry, and a transgenic model for direct quantification of autophagic flux.
Results: Our findings indicate that gestational protein restriction alters the expression profiles of genes associated with cardiac remodeling and increases the levels of apoptotic markers. In contrast, autophagic flux did not show significant alterations.
Conclusion: We conclude that early protein restriction triggers a cascade of remodeling responses, including transient heart volume expansion accompanied by cardiomyocyte hypertrophy, which may progress towards fibrosis and metabolic stress. Autophagic flux was not significantly altered. We conclude that early protein restriction triggers a cascade of remodeling responses, including a transient heart volume expansion accompanied by cardiomyocyte hypertrophy, which has the potential to progress towards fibrosis and metabolic stress.
Introduction
During the critical stages of embryonic development, the limited transport and diffusion of nutrients and oxygen through the placenta render the functioning of the developing heart essential. As one of the first organs to form and initiate its activity, the heart plays a pivotal role in supplying vital nutrients and oxygen to the fetus, thereby supporting its metabolic needs (Berhrsin and Gibson, 2011; Finnemore and Groves, 2015; Morton and Brodsky, 2016; Tan and Adam, 2020). The process of heart development commences with the migration of initial mesodermal cells, which differentiate into cardiac progenitor cells that establish two distinct molecular lineages. Both cell conception and differentiation are critical for the proper formation of the heart (Buijtendijk et al., 2020). The initial fusion of these cells forms the heart tube, which subsequently undergoes several morphological transformations, including looping morphogenesis, septation, chamber specification, and the formation of heart valves. The proliferation of cardiomyocytes is crucial for the rapid growth and development of the heart. Following birth, the cell cycle of cardiomyocyte proliferation is interrupted, and further heart growth is achieved through the hypertrophy of these cells (Li et al., 1996; Porrello et al., 2011). Complex gene regulatory networks orchestrate these developmental processes to ensure proper heart formation (Porrello et al., 2011). Disruptions that occur during early development or in the transition from intrauterine to extrauterine life can lead to long-lasting adverse effects and potentially fatal consequences (Wu et al., 2016; Cohen et al., 2016; Aye et al., 2017). According to the World Health Organization, cardiovascular disease represents the foremost cause of mortality worldwide. These diseases are frequently associated with several risk factors, including excessive alcohol consumption, tobacco use, unhealthy dietary practices, obesity, physical inactivity, and exposure to air pollution (WHO, 2024). Moreover, research conducted by Barker and colleagues has documented a higher incidence of cardiovascular diseases among individuals born with low birth weight (Barker et al., 1989a; Barker et al., 1989b). In light of Barker’s findings linking low birth weight to an increased incidence of adult diseases, a multidisciplinary research area known as the Developmental Origins of Health and Disease (DOHaD) has emerged. This field emphasizes the significant impact of early life stages—from embryonic development through early childhood—on an individual’s long-term health trajectory. Numerous studies have established correlations between developmental disorders and the onset of cardiovascular diseases in later life (Barker et al., 1989a; Barker et al., 1989b; Langley-Evans et al., 1996; Roseboo et al., 2000). Among various factors, maternal protein restriction in animal studies is noteworthy, as it has been linked to lower birth weight, reduced nephron numbers, central and peripheral neural disorders, and arterial hypertension (Mesquita et al., 2010a; Mesquita et al., 2010b; Sene et al., 2013; Custódio et al., 2017; Sene et al., 2021; Lamana et al., 2021; Folguieri et al., 2022; Mariano et al., 2021). Such maternal protein restriction has also been associated with a reduction in the number of cardiomyocytes (Corstius et al., 2005; Assalin et al., 2019) and the induction of hypertrophy in these cells (Folguieri et al., 2022; Morrison et al., 2007; Lim et al., 2006). Furthermore, gestational protein deficiency may contribute to reduced heart weight, an increased number of cardiac fibroblasts, and consequently, fibrosis in the left and right ventricles of adult rodents ultimately decreasing survival rates (Folguieri et al., 2022; Assalin et al., 2019). It is reasonable to hypothesize that a maternal protein-deficient diet may restrict the availability of essential amino acids necessary for the proliferation and differentiation of stem cells. Such limitations in protein support may alter the mechanisms and processes by which these cells multiply and differentiate. Additionally, in response to nutrient scarcity, cardiac stem cells or developing cells may undergo apoptosis (programmed cell death) or autophagy (self-digestion of cellular components), thereby reallocating crucial nutrients to support the survival and differentiation of a diminished yet viable pool of cells. Furthermore, nutrient deprivation may diminish overall proliferation processes in these organisms, resulting in a reduced cell count. The present study seeks to investigate the complex interactions among growth factors, molecular expressions, and developmental mechanisms that impact heart development during the embryonic-fetal period. Additionally, this research will emphasize the potential detrimental effects of maternal malnutrition on the heart development of offspring.
Materials and methods
Animals and ethical procedures
The Institutional Ethics Committee approved the experimental protocol (#5481-1/2020 CEUA/UNICAMP). The Internal Biosafety Commission (CIBIO FCM n° 08/2019) granted permission to use transgenic animals. C57BL/6J and C57BL/6-Tg (CAG-RFP/EGFP/Map1lc3b)1Hill/J (CAG-RFP-EGFP-LC3) mice, aged 8–10 weeks, were sourced from the Multidisciplinary Center for Biological Research in Laboratory Animals at Unicamp (CEMIB). The animals were housed in a controlled environment with a temperature of 23 °C ± 2 °C, a relative humidity of 50% ± 10%, and a light-dark cycle from 6:00 p.m. to 6:00 a.m. CAG-RFP-EGFP-LC3 transgenic mice (C57BL/6-Tg (CAG-RFP/EGFP/Map1lc3b)1Hill/J; RRID: IMSR_JAX:027139) express a red fluorescent protein (RFP) that remains stable at an acidic pH (pKa 4.5), alongside an enhanced green fluorescent protein (EGFP; pKa 5.9) and a gene for the microtubule-associated protein 1 light chain 3 alpha (Map1lc3a or LC3) that serves as a marker for phagosomes. The combined fluorescence of GFP and RFP produces a yellow signal in alkaline conditions in phagophores and autophagosomes. Conversely, EGFP fluorescence is quenched in autolysosomes, leading to only an RFP signal emission. Notably, 14% of EGFP in the autolysosome (pH = 4–5) continues to emit weak green fluorescence; consequently, it is essential to employ a lysosomal marker such as Lamp 1 (Novus Biologicals - NB120-19294, 1:2000) to ensure accuracy (The Jackson Laboratory, Bar Harbor, ME, United States).
Experimental model
At 16 weeks of age, female CAG-RFP-EGFP-LC3 mice were carefully mated with male C57BL/6J mice for 2 hours during the dark cycle. Following mating, the females were transferred to individual cages and categorized into four groups based on dietary intake and gestational age for fetal collection. Some females received a standard protein diet (NP, 17% casein, n = 22), while others were administered a low-protein diet (LP, 6% casein, n = 20). Both diets were isocaloric and contained standard levels of sodium and calcium. The dams were maintained until either 14 or 18 days of gestation (GD). On the 14th or 18th gestational days (GD), the dams were anesthetized using 3% isoflurane, and the female and male fetuses were harvested promptly and weighted. Only male fetuses were utilized to eliminate potential effects of sexual programming. Some fetuses were fixed by immersion in 4% paraformaldehyde (PFA) for 4 h at 18 GD and for 3 h at 14 GD, subsequently stored in 70% alcohol. Additional fetuses were fixed in PFA for 8 h, subjected to 30% sucrose until saturation, and then frozen in N-Hexane in liquid nitrogen. After freezing, these fetuses were stored at −80 °C. Other fetuses were frozen in liquid nitrogen before being stored at −80 °C.
Sex determination
DNA extraction was performed from tail fragments using enzymatic lysis (NaOH 50 mM) at 100 °C, and the presence of the SRY gene was assessed through conventional PCR amplification. The GoTaq® G2 Green Master Mix (M7823, Promega, Madison, United States) was employed, with the reaction consisting of 35 cycles at 95 °C, 59 °C, and 72 °C, each for 1 min. The SRY product (Forward: GTGAGAGGCACAAGTTGGC, Reverse: CTCTGTGTAGGATCTTCAATC) is 147 bp, while the positive control (MYG; Forward: TTACGTCCATCGTGGACAGC, Reverse: TGGGCTGGGTGTTAGTCTTA) yields a product of 246 bp.
Genotyping
The investigator who provided the CAG-RFP-EGFP-LC3 did not aim to develop a homozygous colony. The Jackson Laboratory recommends mating CAG-RFP-EGFP-LC3 mice with wild-type (non-carrier - C57BL/6J). Consequently, verification of the transgene’s presence in the fetuses was essential. DNA was again extracted via enzymatic lysis (NaOH 50 mM), and genotyping was performed to confirm the presence of the transgene through conventional PCR amplification. The GoTaq® G2 Green Master Mix (M7823, Promega, Madison, United States) was utilized in a “touchdown” cycling protocol as recommended by The Jackson Laboratory. The transgene product (Forward: CAG GAC GAG CTG TAC AAG T, Reverse: CAC CGT GAT CAG GTA CAA GGA) is 208 bp, while the positive control (oIMR7338; Forward: TTACGTCCATCGTGGACAGC, oIMR7339; Reverse: TGGGCTGGGTGTTAGTCTTA) has a predicted product size of 324 bp.
Heart volume
The cardiac volume of fixed hearts from fetuses at 14 and 18 gestational days (GD) (n = 5 per group) was calculated using the following formula: volume = π × (½ × width)2 × length.
RT-qPCR
Heart tissues from fetuses at 14 GD (NP n = 3, LP n = 3) were dissected, and RNA was extracted utilizing the RNeasy Plus Micro kit (74,034—Qiagen, Hilden, Germany) according to the manufacturer’s guidelines. The NanoDrop 2000c (Thermo Fisher) was employed to evaluate the purity and concentration of the RNA, accepting samples that achieved 260/230 and 260/280 ratios of ≥1.8. For the heart from animals at 14 GD, complementary DNA (cDNA) was synthesized using 2000 ng of total RNA with the RT2 First Strand kit. For heart from animals at 18 GD, cDNA synthesis was conducted using the High Capacity cDNA Reverse Transcription kit. Primers were designed using the Primer-BLAST tool (NCBI) to span exon-exon junctions (see Table 1). The quantitative PCR (qPCR) cycle was performed with ReadyMix JumpStart™ Taq SYBR® (Cat. No. S4438 – Sigma Aldrich) on a StepOne Plus system under the following conditions: initial denaturation at 95 °C for 2 min, followed by 40 cycles of 95 °C for 15 s, and 60 °C (62 °C for Tgfβ at both 14 and 18 GD, and Calml3 and Myo10 at 18 GD) for 1 min. Data normalization was achieved by correcting Ct values based on the average Ct of the Gapdh.
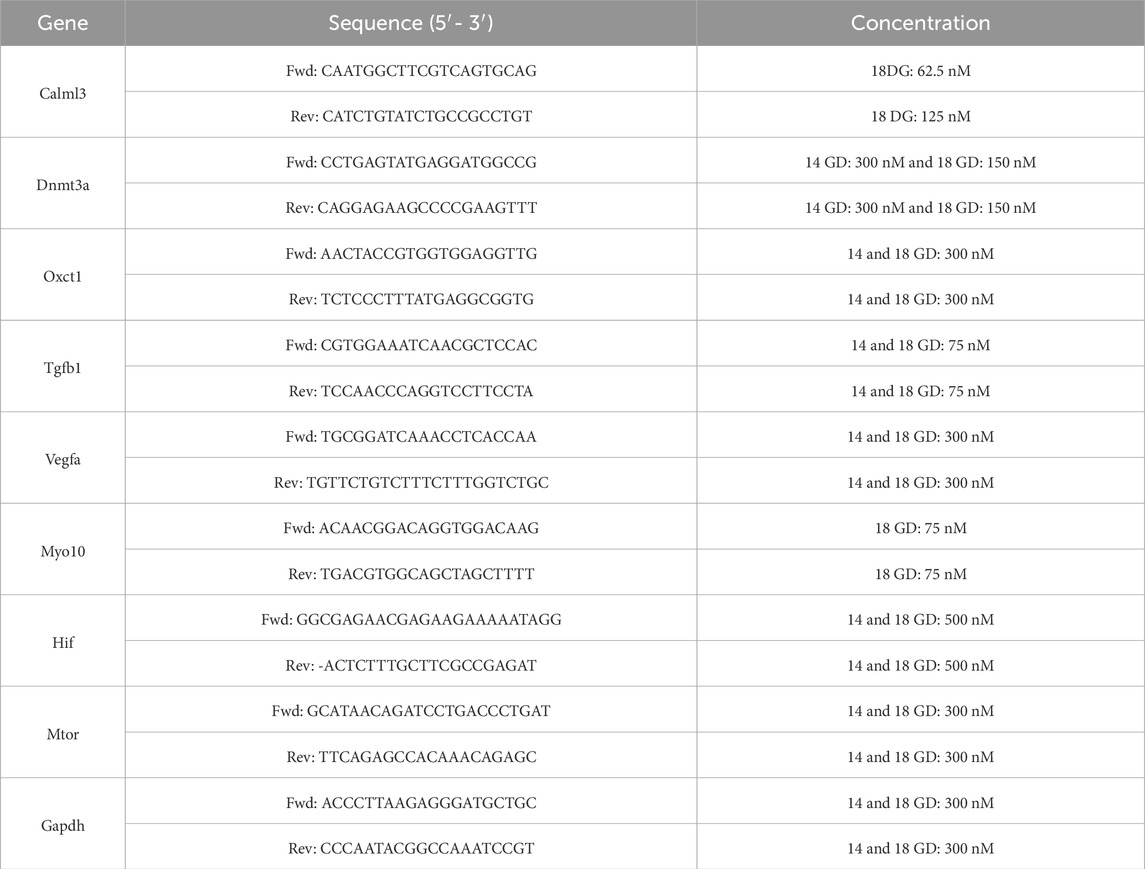
Table 1. Primer sequence used in RT-qPCR experiment.
Immunohistochemistry
Fetuses preserved in 70% alcohol underwent dehydration, clearing, and embedding in Paraplast (Sigma-Aldrich, United States). Five-micrometer-thick tissue sections were deparaffinized and prepared for both immunoperoxidase and immunofluorescence assays. The slides were treated with PBS (pH 7.2) for hydration and washing for 5 min. Antigen retrieval was conducted in a water bath using citrate buffer (pH 6.0) for 30 min. The slides were incubated with a blocking solution of 5% non-immune serum from the secondary antibody’s host species for 1 h for the immunoperoxidase method. Following re-washing with PBS, the sections were incubated overnight at 4 °C with a primary antibody diluted in 3% BSA. Endogenous peroxidase activity was subsequently inhibited with hydrogen peroxide, and the slides were treated with methanol for 10 min in the dark. After additional PBS washes, the sections were exposed to a specific secondary antibody, diluted in 1% BSA, for 2 h at room temperature and visualized using DAB (3.3′-diaminobenzidine tetrahydrochloride, Sigma-Aldrich CO®, United States). After a final wash with running water, the slides were dehydrated and mounted with a coverslip using Entellan®. For immunofluorescence, the slides were incubated with a blocking solution (containing 5% non-immune serum from the secondary antibody’s host species and 0.2% Triton in PBS). The heart sections were incubated with the primary antibody diluted in this blocking solution overnight at 4 °C. After washing with PBS, the sections were treated with the specific secondary antibody diluted in the blocking solution for 2 h and 30 min (Table 2). During the final PBS wash, DAPI (0.1 μg/mL, D9564-10 MG–Sigma) was added. Immunofluorescence images were obtained using an Airyscan Inverted Microscope at the National Institute of Science and Technology on Photonics Applied to Cell Biology (INFABIC) at the State University of Campinas. Images for the immunoperoxidase method were captured using an Axio Scope A1 microscope equipped with an Axio Cam MRc digital camera (Carl Zeiss, Oberkochen, Germany). No immunoreactivity was observed in negative control experiments in which one of the primary antibodies was excluded. Image analysis was performed utilizing ImageJ software.
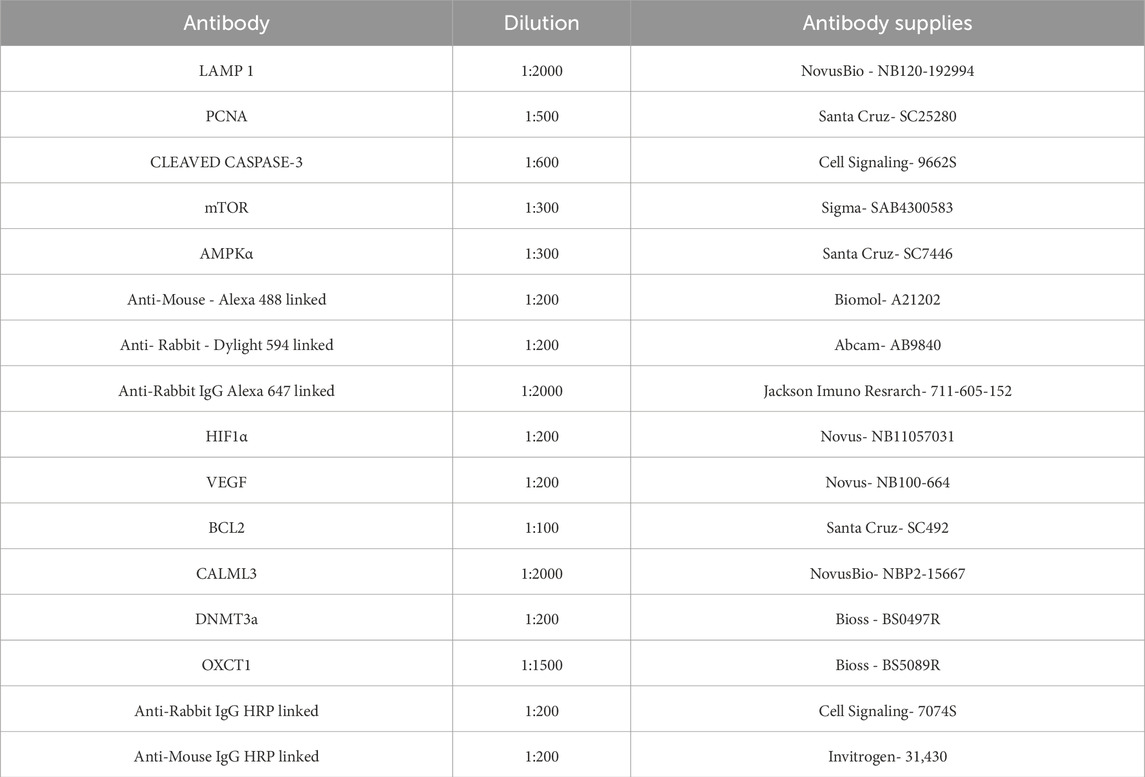
Table 2. Antibodies used with their appropriate concentrations and supplies.
Autophagic flux
Images of the hearts (n = 4 per group) were obtained using a confocal microscope with Airyscan (Carl Zeiss), which includes the following laser lines: 1. DAPI: 404 nm 2. eGFP (green): 488 nm 3. mRFP (red): 543 nm 4. Alexa 647 (blue): 633 nm. The images were captured using an EC Plan-Neofluar 40x/1.3 Oil DIC objective, accompanied by a 1.8x zoom. Automated selection of autophagic vesicles was executed in ImageJ software using the following command line: run (“8-bit”); run (“Gaussian Blur”, “sigma = 1″); run (“Subtract Background”, “rolling = 30″); run (“Auto Threshold,” “method = Default”); setOption (“BlackBackground,” false); run (“Convert to Mask”); run (“Watershed”); run (“Particle Remover” “size = 40-Infinity pixel show = Masks summarize overlay add”); The mean intensity of each vesicle was measured in the respective red, green, and blue channels (RGB), facilitating classification of vesicle color based on the HUE angle. The classification of vesicle colors, as delineated by Lee et al. (2019), included the following categories: Yellow vesicles (HUE 51–80), Orange (9–50), Red (0–8, 357–360), Purple (263–356), and Blue (190–262). For the total count of autophagic vesicles in the heart, those classified as yellow, orange, red, and purple were considered based on area (number of vesicles per mm2) (see Figure 1).
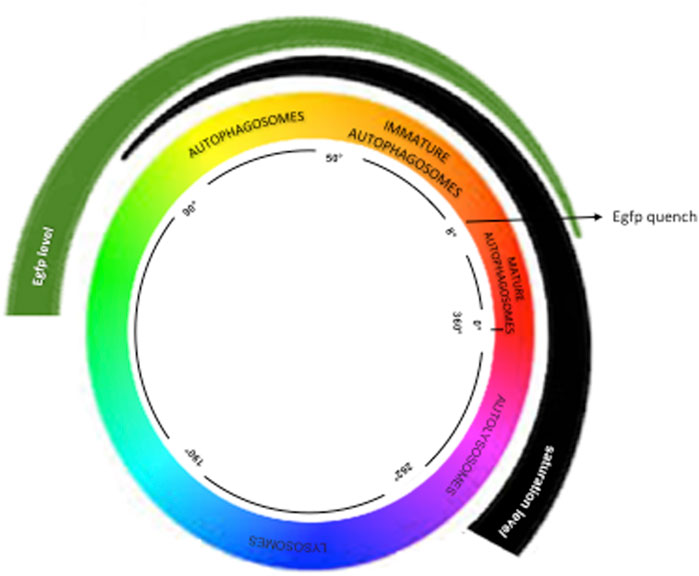
Figure 1. Hue Method—This method categorizes colors by angles, as described in https://www.mrexcel.com/forum/excel-questions/559852-rgb-hue-formula.html. Vesicles between 50° and 80° are yellow; autophagosomes between 9° and 50° are orange; immature autolysosomes (0°–8° and 356°–360°) are red; fused autolysosomes (263°–357°) are purple; lysosomes (190°–262°) are blue.
Data presentation and statistical analysis
All data were reported as mean ± standard deviation of the mean (SD). Student's t-tests were used to evaluate studies involving only two independent samples, within or between groups. Welch’s test was used to correct situations characterized by heteroscedasticity (different variances between groups). Statistical analyses for gene expression data were performed on the raw ΔΔCT values, with fold change values calculated as 2−ΔΔCT. GraphPad Prism 5.00 was used for data analysis (GraphPad et al., United States). The level of significance was set at p ≤ 0.05.
Results
Maternal parameters
At 14 days of gestation, dams in the control group (NP) demonstrated a greater weight gain (9.230 ± 0.8984 g; n = 11) in comparison to the low-protein group (LP), which exhibited a weight gain of 6.970 ± 0.7582 g (n = 9), with a statistically significant difference (p < 0.0001). Feed consumption was similar between the groups, with NP consuming 47.19 ± 2.728 g (n = 10) and LP consuming 48.63 ± 2.514 g (n = 9), resulting in a p-value of 0.125. However, feed efficiency was significantly diminished in the LP group (0.03690 ± 0.004894; n = 5) compared to the NP group (0.04894 ± 0.005461; n = 5), yielding a p-value of 0.0063. At 18 days of gestation, weight gain remained higher in the NP group (16.15 ± 1.680 g; n = 11) relative to the LP group (10.89 ± 1.423 g; n = 11), with p < 0.0001. Notably, feed consumption was greater among LP dams (67.13 ± 6.432 g; n = 11) than among NP dams (59.07 ± 8.575 g; n = 12), with a p-value of 0.0195. Nonetheless, feed efficiency remained lower in the LP group (0.04417 ± 0.01199; n = 5) compared to the NP group (0.06697 ± 0.01680; n = 5), with a p-value of 0.0387.
Fetal parameters
At 14 days of gestation, male fetuses in the LP group demonstrated a significantly higher body mass (0.211 ± 0.02 g; n = 40) than those in the NP group (0.199 ± 0.02 g; n = 46; p = 0.005). The placental mass did not exhibit a significant difference between the two groups (NP: 0.103 ± 0.03 g; n = 46; LP: 0.099 ± 0.02 g; n = 41; p = 0.5). The fetal-to-placental (f:p) ratio for male fetuses did not reveal a significant difference between the LP (2.286 ± 0.66; n = 40) and the NP (2.074 ± 0.67; n = 46) groups (p = 0.07). Among female fetuses, body mass was also higher in the LP group (0.206 ± 0.02 g; n = 35) in comparison to the NP group (0.189 ± 0.02 g; n = 41; p = 0.001), while placental mass remained comparable (NP: 0.097 ± 0.03 g; n = 40 vs. LP: 0.099 ± 0.03 g; n = 35; p = 0.7). The female f:p ratio exhibited no significant difference between the groups (NP: 2.049 ± 0.62; n = 41 vs. LP: 2.163 ± 0.59; n = 33; p = 0.2). At 18 days of gestation, male fetal body mass was slightly lower in the LP group (0.939 ± 0.09 g; n = 39) compared to the NP group (0.979 ± 0.085 g; n = 49; p = 0.03), while placental mass remained consistent between groups (NP: 0.115 ± 0.03 g; n = 49; LP: 0.116 ± 0.02 g; n = 39; p = 0.9). The f:p ratio in male fetuses did not show significant differences (NP: 8.983 ± 2.3; n = 39 vs. LP: 8.411 ± 1.772; n = 39; p = 0.2). Among female fetuses, body mass was significantly lower in the LP group (0.895 ± 0.08 g; n = 44) compared to the NP group (0.977 ± 0.107 g; n = 27; p = 0.0006). There was a non-significant reduction in placental mass in the LP group (0.099 ± 0.03 g; n = 44) when compared to NP (0.111 ± 0.03 g; n = 27; p = 0.09). The f:p ratio remained statistically similar between the groups (NP: 8.917 ± 2.1; n = 26 vs. LP: 9.52 ± 2.2; n = 44; p = 0.2).
Heart development
For the assessment of cardiac parameters, only male offspring were analyzed. At 14 days of gestation, the cardiac volume was greater, while the ventricular wall thickness was reduced in the LP group. By 18 days of gestation, no significant alterations were observed in cardiac volume or left ventricular thickness; however, myocyte area was smaller in the LP group compared to the control group at this gestational age, whereas it was increased at 14 days (Figure 2).
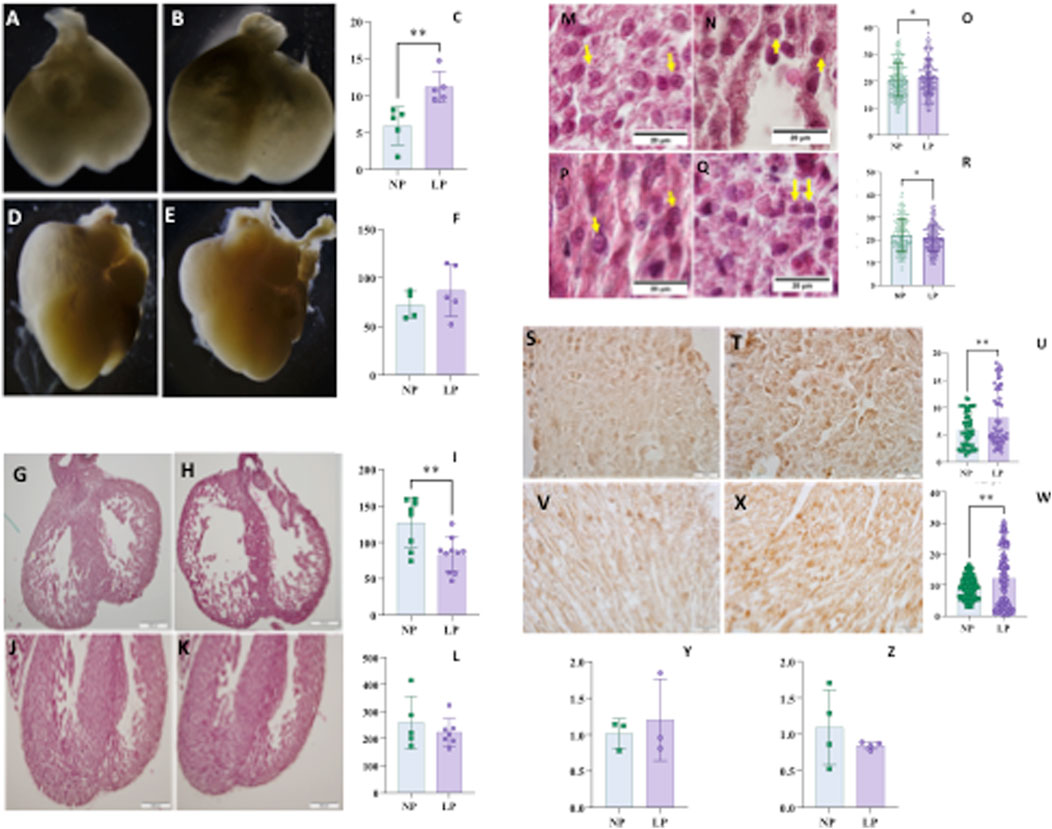
Figure 2. Heart volume normalized by body mass of fetuses at 14 days of gestation (panel C), NP: 28,26 ± 12,26 n = 5 vs. LP: 54,14 ± 8,102 n = 5, p = 0,0043, and NP illustrated picture (Panel A) and LP illustrated picture (Panel B). At 18 days of gestation (panel F), NP: 73,83 ± 21,15 n = 4 vs. LP: 84,29 ± 28,04 n = 4, p = 0,5728, and NP illustrated picture (panel D) and LP illustrated picture (panel E). Ventricle wall thickness at 14 GD (panel I), NP: 126,9±34,30 n = 8 vs. LP: 83,03±23,55 n = 10, p = 0,0053, and NP illustrated picture (panel G) and LP illustrated picture (panel H). At 18 gestational days (panel L), NP: 259642±96285 n = 5 vs. LP: 223422±50656 n = 7, p = 0.4132, and NP illustrated picture (panel J) and LP illustrated picture (panel K). Myocyte area at 14 GD (panel O), NP: 20,56±6,216 n = 352 vs. LP: 21,55±6,462 n = 306, p = 0,047, and NP illustrated picture (panel M) and LP illustrated picture (panel N). At 18 gestational days (panel R), NP: 22,24±7,248 n = 243 vs. LP: 20,85±5,866 n = 268, p = 0,0171, and NP illustrated picture (panel P) and LP illustrated picture (panel Q). TGFΒ1 in heart with 14 GD (panel U), NP: 5,892±3,111 n = 54 vs. LP: 8,152±5,215 n = 57 and p = 0,0069 and, NP illustrated picture (panel S) and LP illustrated picture (panel T); At 18 GD (panel W) NP: 9,227±3,464 n = 109 vs. LP: 12,09 ± 9,269 n = 108 and p = 0,0028 and, NP illustrated picture (panel V) and LP illustrated picture (panel X). Tgfb1 gene expression in heart at 14 GD (panel Y) to NP: 1,015 ± 0,2021 n = 3 compared to LP: 1,204 ± 0,5594 n = 3 and p = 0,3052. While the Tgfb1 gene expression in heart at 18 GD to NP: 1,096 ± 0,5118 n = 4 (panel Z) compared to LP: 0,8471 ± 0,05234 n = 4 and p = 0,3705. For gene expression data, statistical analyses were performed on the raw ΔΔCT values.
Gene expression
A significant difference in mTOR expression was observed at 14 days of gestation (14 GD), where an increase in mRNA levels was noted in the low-protein (LP) group. No significant differences were detected in the expression of other mRNAs, namely Oxc1, Dnmt3a, Vegfa, Hif1a, Tgfb1, Calml3, Myo10, at 18 GD, nor in mTOR expression at this gestational age (refer to Figures 5, 6).
Autophagy process
The progression of the autophagy process in the myocardial tissue of subjects subjected to gestational protein restriction did not demonstrate any significant changes at either 14 GD or 18 GD (as illustrated in Figure 3).
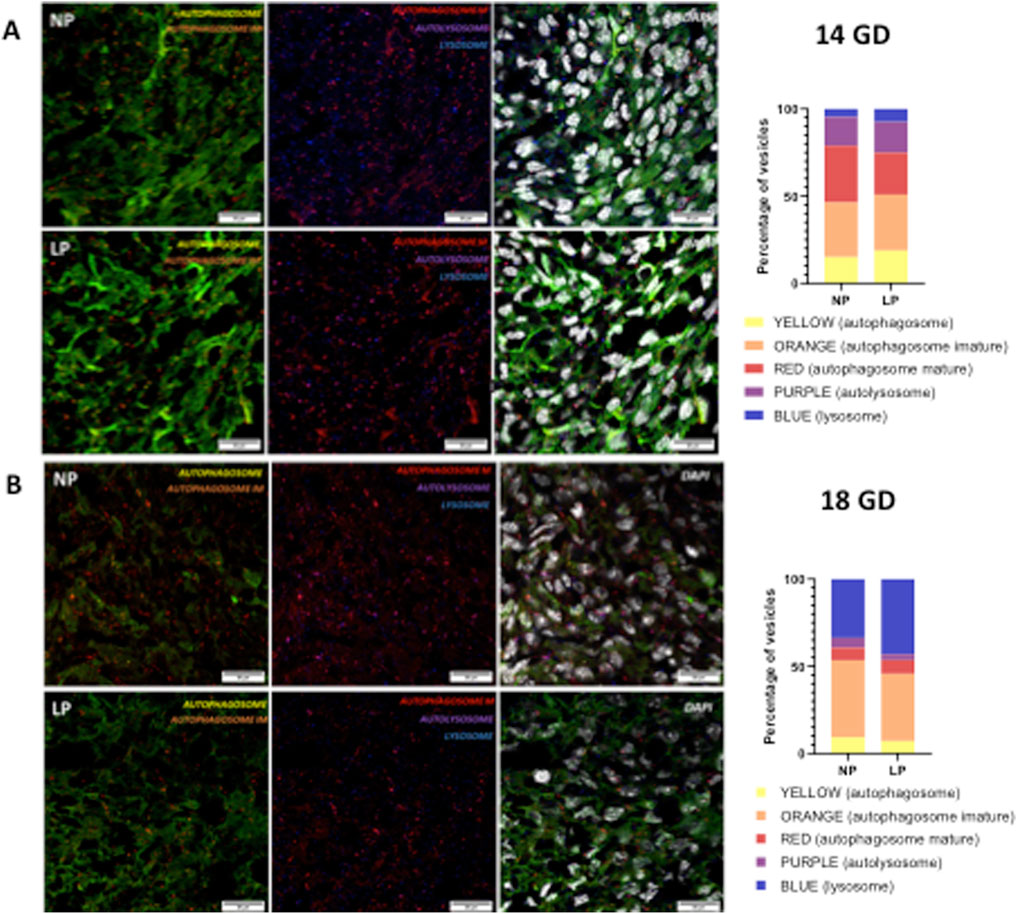
Figure 3. Illustrates the autophagy process at 14 gestational days (GD) (panels (A)) and at 18 GD (panels (B)). Both the NP and the LP offspring groups are shown. The combination of GFP (green fluorescent protein) and RFP (red fluorescent protein) fluorescence produces a yellow signal in phagophores and autophagosomes. In immature autophagosomes, EGFP is quenched, resulting in an orange signal, while mature autophagosomes emit only the RFP signal. Upon fusion with lysosomes, the autolysosome produces a purple signal (indicating RFP + LAMP1). No differences were observed in any of the autophagy vesicles between the two gestational ages.
Apoptosis and proliferation
At 14 GD, an increase in activated caspase 3, a key executor of apoptosis, was observed. However, no differences were identified regarding the cell proliferation marker, PCNA, at either 14 GD or 18 GD. Additionally, no changes were observed in activated caspase three levels at 18 GD (see Figure 4).
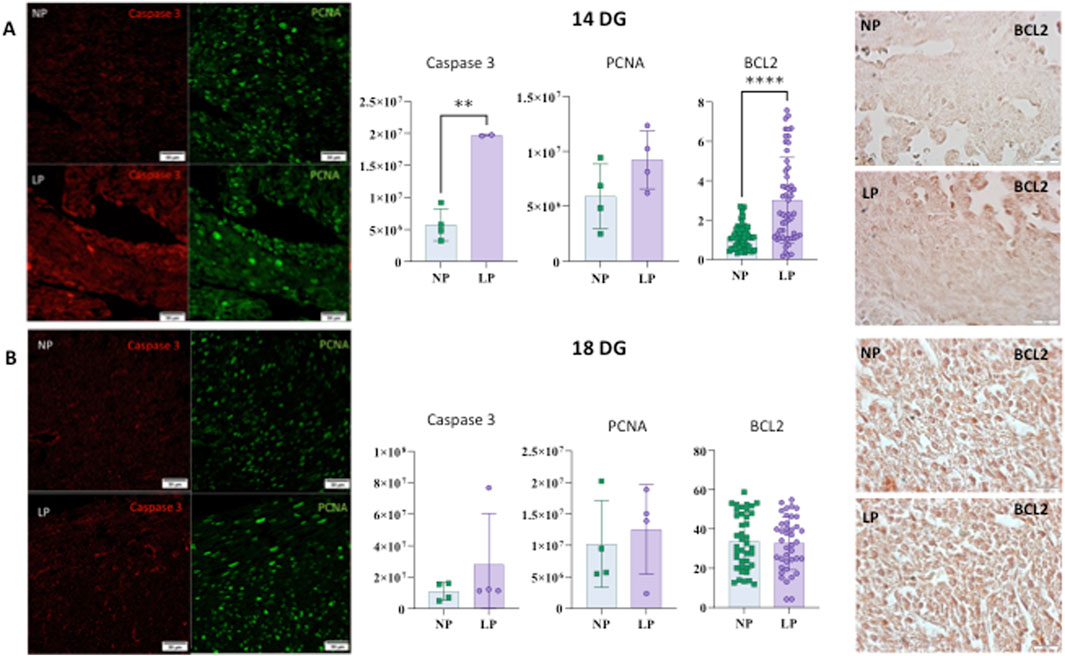
Figure 4. Illustrates the levels of Caspase, PCNA, and BCL2 in the heart at 14 gestational days (GD) (panel (A)). For Caspase-3: NP: 5,753,514 ± 2,511,538 (n = 4) and LP: 19,673,098 ± 121,515 (n = 3), p = 0.0018. For PCNA: NP: 5,899,701 ± 2,943,273 (n = 4) and LP: 9,228,202 ± 2,652,340 (n = 4), p = 0.1439. For BCL2: NP: 1.119 ± 0.6136 (N = 59) and LP: 3.014 ± 2.172 (N = 56), p < 0.0001. (panel (B)) shows the levels of Caspase, PCNA, and BCL2 in the heart at 18 gestational days (GD). For Caspase-3: NP: 10,932,348 ± 5,676,129 (n = 4) and LP: 28,005,548 ± 32,553,962 (n = 3), p = 0.3413. For PCNA: NP: 10,214,501 ± 6,904,684 (n = 4) and LP: 12,527,971 ± 7,116,435 (n = 4), p = 0.6572. For BCL2: NP: 33.86 ± 14.17 (n = 40) and LP: 32.75 ± 13.55 (n = 40) - p = 0.7228.
Autophagy controllers
At 14 GD, mTOR levels were elevated; however, no significant differences were found at 18 GD, nor were any differences noted in AMPKα at either gestational age (refer toFigure 5).
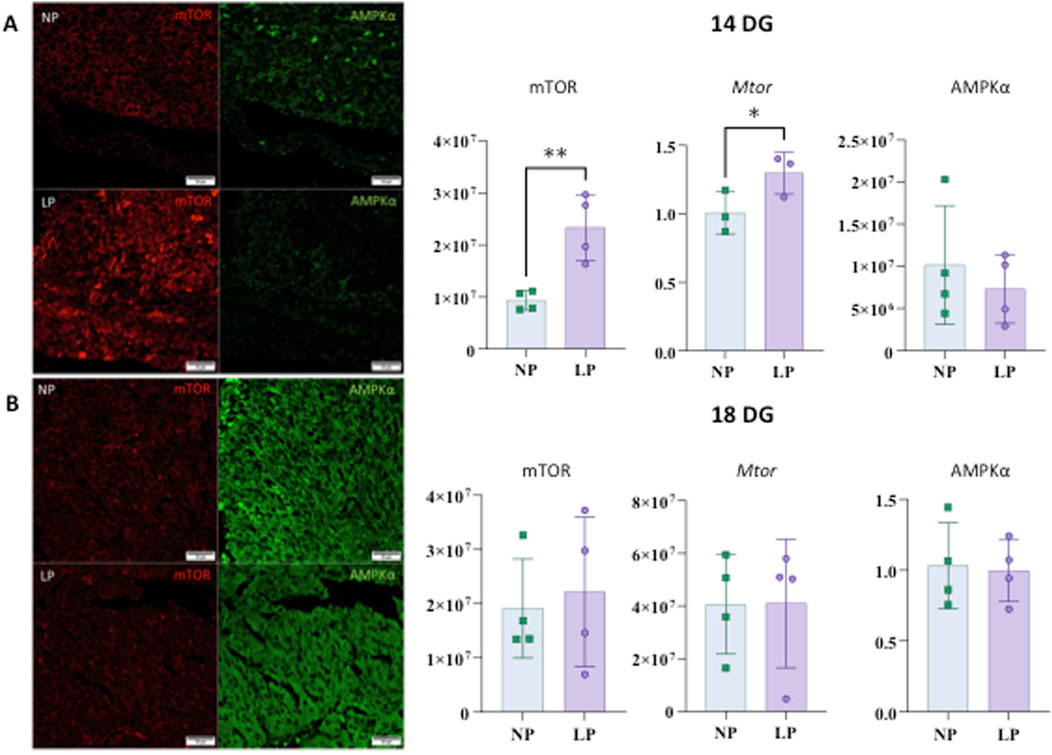
Figure 5. mTOR and AMPKα heart immunostaining at 14 gestational days (panels (A)). The results for mTOR are as follows: NP: 9,323,377 ± 1,848,170 n = 4, and LP: 23,337,483 ± 6,352,528 n = 4, p = 0.0055. For gene expression of Mtor: NP: 1,008 ± 0.1532 n = 3 and LP: 1,297 ± 0.1524 n = 3, p = 0.0407. The results for AMPKα are as follows: AMPKα: NP: 10,162,846 ± 7,037,267 n = 4 and LP: 7,332,373 ± 4,066,103 n = 4, p = 0.5122. Immunostaining to mTOR and AMPKα in the heart at 18 GD (panels (B)). mTOR: NP: 19,110,748 ± 9,139,961 n = 4 and LP: 22,152,485 ± 13,815,193 n = 4, p = 0.7260. Gene expression of Mtor shows NP: 1,031 ± 0.3035 n = 4 and LP: 0.9956 ± 0.2176 n = 4, p = 0.8547. For AMPKα: NP: 40630609 ± 18834851 n = 4 and LP: 41,010,226 ± 24,429,236 n = 4, p = 0.9812.
Cell death regulator
An increase in BCL-2 expression, which is part of a gene family comprising both pro-apoptotic and anti-apoptotic members, was observed at 14 GD. Conversely, no significant differences in BCL-2 expression were detected at 18 GD (see Figure 4).
Hypoxia regulator
Hypoxia-inducible factors (HIF-1 alpha) exhibited a decrease in the myocardial tissues of subjects subjected to gestational protein restriction at both 14 GD and 18 GD. Furthermore, the vascular endothelial growth factor (VEGF), which HIF-1α upregulates, was also found to be decreased at both gestational ages (illustrated in Figure 6, panels A–H).
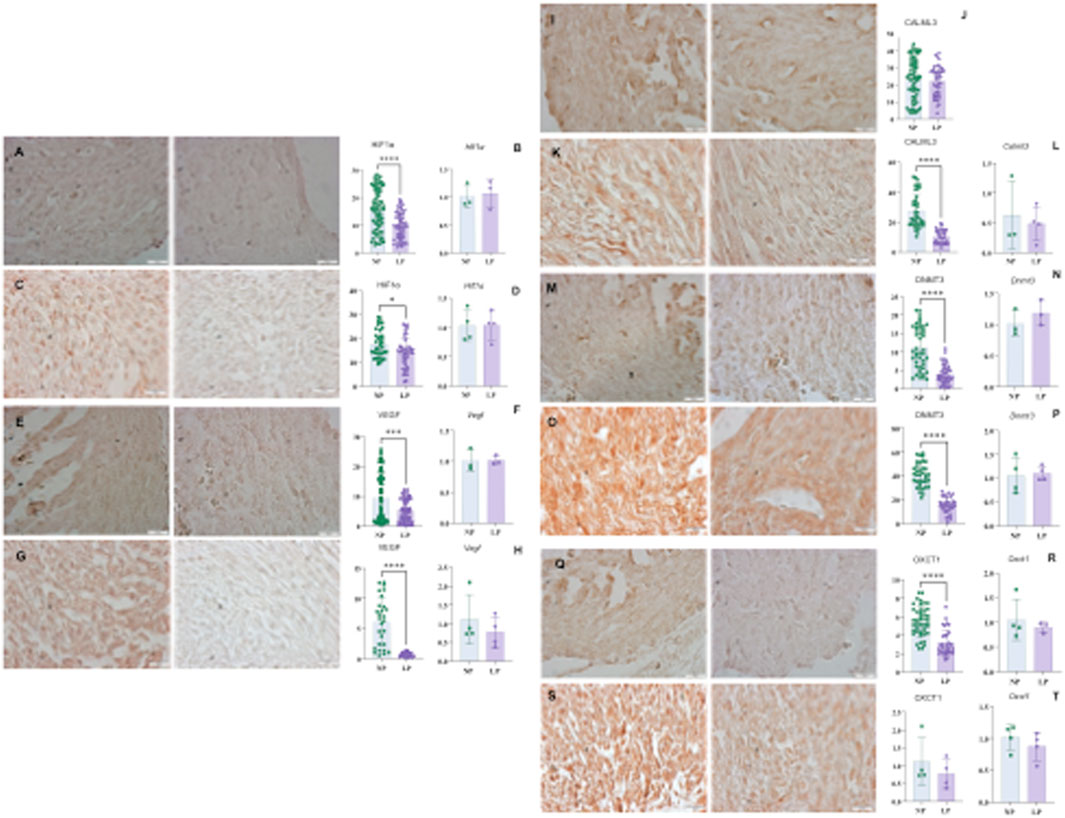
Figure 6. HIF1α immunohistochemistry in heart with 14 GD (panel (A)): NP: 15.80 ± 7.56, n = 90 and LP 9,978 ± 4,878, n = 73, p < 0.0001. And Hif1α gene expression (panel (B)) NP: 1,014 ± 0.2106, n = 3, and LP: 1,070 ± 0.2629, n = 3, p = 0.7872. For HIF1α in the Heart (panel (C)) at 18 GD: NP: 17.57 ± 5,834 n = 38, and LP: 13.88 ± 6,405 n = 39, p = 0.0101. And Hif1α gene expression (panel (D)) NP: 1,025 ± 0.2669 n = 4 and LP: 1,035 ± 0.2444 n = 4 and p = 0.9562. To VEGF (panel (E)) heart at 14 GD (panel (E)): NP: 9,489 ± 8,069, n = 91, LP- 5,381 ± 3,767, n = 70, p = 0.0001. And, to Vegf gene expression (panel (F)) NP: 1,010 ± 0.1799 n = 3 and LP- 1,020 ± 0.07310, n-3, p = 0.9306. For VEGF in the Heart at 18 GD (G): NP: 6,088 ± 4,021, n = 28, LP: 0.6854 ± 0.3730, n = 27, p < 0.0001. And, Vegf gene expression (H): NP: 1,113 ± 0.6625, n = 4, LP: 0.7750 ± 0.4086, n = 4, p = 0.4185. For CALML3 in Heart at 14 GD (panels (I,J)): NP: 23.54 ± 11.89 n = 72 and LP: 22.20 ± 8,627 n = 46, p = 0.5098. And heart CALML3 at 18 GD (K)NP- 27.64 ± 11.48, n = 40, LP: 10.49 ± 4,526 n = 30, p < 0.0001. For Calml3 gene expression (panel (L)), NP: 0.6275 ± 0.5688 n = 3 and LP: 0.4835 ± 0.2845 n = 4, p = 0.6736. DNMT3 immunohistochemistry in Heart at 14 GD (M): NP: 11.13 ± 5,794, n = 44 and LP-3,988 ± 22,615, n = 41, p < 0.0001. And Dnmt3a gene expression (panel (N)) to NP: 1,014 ± 0.2114 n = 3 and LP: 1,184 ± 0.2076, n = 3, p = 0.3760. Immunohistochemistry DNMT3 in Heart with 18 GD NP (panel (O)): 40.87 ± 9,965, n = 36, LP: 15.46 ± 6,535 n = 32, p < 0.0001. (panel (P)) shows Dnmt3a gene expression to NP: 1,049 ± 0.3745, n = 4 and LP - 1,099 ± 0.1523, n = 4, p = 0.8126. For OXCT1 immunohistochemistry in the Heart with 14 GD (panel (Q)) NP: 5,474 ± 1,586, n = 45 and LP– 3,175 ± 1,420, n = 31, p < 0.0001. And Oxct1 gene expression (panel (R)) NP: 1,053 ± 0.4190, n = 4 and LP: 0.8953 ± 0.1082 n = 3, p = 0.5612. And OXCT1 (panel (S)) in the Heart with 18 GD: NP: 34.22 ± 20.29 n = 40 and LP: 15.51 ± 12.46, n = 40, p < 0.0001. And, (panel (T)) shows Oxct1 gene expression: NP: 1,016 ± 0.1975 n = 4 and LP: 0.8762 ± 0.2221, n = 4, p = 0.3831.
Calcium signaling
In the LP group, CALM3 levels were reduced by 18 GD when compared to the normal protein (NP) group. However, no differences in CALM3 levels were observed at 14 GD (see Figure 6, panels I–L).
DNA methylation
A decrease in DNA methyltransferase 3 (DNMT3) levels was observed at both gestational ages, 14 GD and 18 GD (as shown in Figure 6, panels M–P).
Heart development metabolism marker
The levels of 3-oxoacid CoA-transferase 1 (OXCT1) were decreased at both 14 GD and 18 GD in the LP group in comparison with the control group (refer to Figures 6Q–T).
Transforming growth factor beta 1 (TGFβ1)
The level of TGFβ1 was found to be elevated in both 14 GD and 18 GD in the LP group when compared to the control group (illustrated in Figures 2U,W).
Discussion
In the present study, mothers assigned to the low-protein (LP) group showed increased food consumption at 18 days of gestation. Nonetheless, this increase did not yield sufficient caloric efficiency, resulting in inadequate weight gain compared to dams in the normal protein intake (NP) group. Similar observations were noted at 14 days of gestation, further supporting the conclusion that mothers on a low-protein (LP) diet experienced diminished weight gain. These findings are congruent with the existing literature, which indicates that gestational protein restriction is associated with reduced weight gain during pregnancy (Desai et al., 1996; Passos et al., 2000; Colombo et al., 1992; Toyomizu et al., 1991; França et al., 2009). Moreover, gestational protein restriction is frequently linked to intrauterine growth restriction and low birth weight (Mesquita et al., 2010a; Mesquita et al., 2010b; Sene et al., 2013; Lamana et al., 2021; Desai et al., 1996). However, our current research offers a novel perspective, illustrating that gestational protein restriction initially results in an increase in body weight, heart volume, and myocyte area in male mice at 14 days of gestation. Nevertheless, by 18 days of gestation, the male mouse offspring subjected to gestational protein restriction exhibit reduced body weights. The current data suggest that, in some instances, limiting maternal protein intake can result in an initial increase in fetal body weight during the early stages of gestation. However, as the pregnancy progresses, this trend frequently reverses, resulting in decreased fetal body weight among protein-restricted groups compared to control groups (Langley-Evans et al., 1996; L et al., 1998; Rees et al., 1999). Such alterations may affect the initial increase in fetal body mass within the placenta, influenced by the secretion of both fetal and maternal hormones. Although the phenotypic plasticity of the placenta may support fetal growth to some extent, its efficiency tends to decline as gestation advances, rendering the fetus more susceptible to the detrimental effects of a low-protein diet, which results in a diminished supply of essential amino acids (Fowden et al., 2009). This study exclusively examined placental mass and did not assess additional placental parameters. The increase in heart volume during development represents a complex and highly regulated process that encompasses various structural and functional adaptations essential for meeting the growing organism’s requirements. This growth primarily relies on an increase in the number of cardiomyocytes, resulting from vigorous cellular proliferation. Hypertrophy also occurs, particularly during intermediate and later developmental stages, in response to hemodynamic and metabolic demands. These processes work together, allowing the heart to expand and adapt functionally to the needs of the developing organism (Li et al., 1996; Porrello et al., 2011; Crispi et al., 2020). The increment in heart volume observed in the low-protein (LP) group of animals at 14 days of gestation may be attributed to hypertrophy, despite no corresponding increase in PCNA expression. The type of hypertrophy present in the heart is intricately linked to the hemodynamic conditions and physiological processes experienced during growth. The heart’s adaptive response can yield two distinct forms of hypertrophy: eccentric hypertrophy and concentric hypertrophy. Concentric hypertrophy occurs when the ventricular wall thickens, directly correlated with the increased load on the ventricle. This form of hypertrophy is more prevalent in scenarios of pressure overload, where the ventricle must exert greater effort to pump blood against increased pressure. Eccentric hypertrophy is predominantly observed during the initial stages of growth and is a physiological response to volume overload. This overload is characterized by an increase in circulating blood volume, particularly as a fetus develops and its metabolic demands escalate. The heart compensates for this elevated volume by undergoing enlargement. In the context of eccentric hypertrophy, ventricular dilation occurs to a greater extent than the thickening of the ventricular walls. This results in a significant increase in the size of the ventricular cavity, but fails to achieve a proportional increase in wall thickness. Furthermore, volume overload can stimulate hypertrophy in cardiomyocytes, subsequently enhancing the heart’s ability to generate force (Mihl et al., 2008; Eghbali et al., 2005). The augmentation of both heart volume and cardiomyocyte area, without a corresponding thickening of the ventricular wall, may facilitate an enhancement in circulating blood volume, thereby supporting fetal growth by approximately 14 days of gestation. Given that the heart is the first organ to develop and attain functionality (Berhrsin and Gibson, 2011; Finnemore and Groves, 2015; Morton and Brodsky, 2016; Tan and Adam, 2020), it is plausible that it completes its proliferative phase earlier than other organs, subsequently adapting through a process of remodeling. Hypertrophy serves as a compensatory mechanism that enables surrounding organs to adjust to their physiological requirements. Initially, cardiomyocyte hypertrophy empowers the heart to generate increased force, thereby meeting heightened demands for blood flow (Li et al., 1996; Porrello et al., 2011; Crispi et al., 2020). However, sustained volume overload can precipitate pathological changes, including fibrosis and compromised heart function. Transforming Growth Factor-beta (TGF-β) plays a crucial role in this transition. While it initially promotes cellular growth, excessive levels can lead to increased extracellular matrix deposition and fibrosis (Dobaczewski et al., 2011; Frangogiannis, 2017). Moreover, elevated levels of the mammalian target of rapamycin (mTOR) may further amplify the effects of TGF-β on fibrotic processes. This enhancement may occur through direct modulation of TGF-β signaling or by creating conditions conducive to the activation of fibrotic pathways, such as augmented oxidative stress or the activation of pro-inflammatory factors (Jiménez et al., 2021; Shin et al., 2025; Saadat et al., 2021; Igarashi et al., 2021; Li et al., 2023). Consequently, heart volume in the offspring LP group may resemble that of the control group, despite a loss of cellular integrity associated with heightened Caspase-3 activity resulting from extracellular matrix deposition and fibrosis. The selection of markers such as Caspase-3, PCNA, and mTOR is grounded in their established significance within the literature as indicators of specific cellular pathways: apoptosis, proliferation, and nutrient signaling, respectively. One of the primary functions of the mTOR pathway is to inhibit autophagy, a cellular process that can lead to programmed cell death. Notably, mTOR also modulates apoptosis independently of autophagy, thereby regulating cellular demise through both autophagy-dependent and autophagy-independent mechanisms. Empirical research has shown that mTOR can simultaneously inhibit autophagy while promoting apoptosis; however, the precise mechanisms underlying this dual effect remain only partially understood. Consequently, it is reasonable to conclude that mTOR exhibits bidirectional regulation of cell death (Xie et al., 2023; Xu et al., 2020; Wang and Wenchao, 2021). Furthermore, mTOR activates caspase-3 to induce apoptosis via the IRE/JNK signaling pathway (Kato et al., 2012). Bcl-2 is recognized as an anti-apoptotic protein that protects cells from programmed cell death and plays an integral role in development (Czabotar et al., 2014). Similar to AMPK, Bcl-2 is involved in regulating growth and is associated with pro-autophagy processes (Mihaylova and Shaw, 2011). Data collected on the 14th day of gestation revealed an increase in caspase-3, a marker for cell death, and independent of autophagy, suggesting an elevation in cell death. Nevertheless, in the present study, the concurrent increase in Bcl-2 indicates that the developing heart, under conditions of gestational protein restriction, is in a precarious balance between cell survival and apoptosis. This finding emphasizes the complexity of cellular responses to nutritional stress during pregnancy. Moreover, Bcl-2 may form a complex with Beclin 1 (Decuypere et al., 2012), which has the potential to inhibit autophagy. Such inhibition may impede the clearance of damaged cellular structures, thereby promoting cell death. In the current study, a decrease in the levels of DNA methyltransferase 3 (DNMT3) was observed on gestational days 14 and 18. Previous research suggests that maternal protein restriction can lead to epigenetic modifications, including alterations in DNA methylation patterns. Between embryonic days 11.5 and 14.5, the DNA methylation profile in the developing mouse heart remains predominantly stable, with changes detected in only a limited subset of genes linked to cardiac development. Additionally, undifferentiated cardiomyocytes, or primary cardiac myocytes derived from embryonic stem cells, exhibit elevated levels of methylation compared to the embryonic stem cells from which they are derived. This observation underscores the crucial role of DNA methylation in controlling the expression of genes that encode cardiac structural proteins. Notably, the knockdown of DNA (cytosine-5)-methyltransferase 3A (Dnmt3a) in mouse embryonic cardiomyocytes leads to disrupted sarcomere assembly, reduced beating frequency, and impaired contractile function (Lan and Evans, 2019; Chamberlain et al., 2014). The Calml3 protein functions as an intracellular calcium sensor and is critical for the expression and stability of Myosin 10 (Rogers and Strehler, 2001; Bennett et al., 2007; Bennett et al., 2008).
A reduction in Calml3 expression is associated with decreased levels of Myosin 10, which may contribute to cardiac abnormalities, including impaired calcium signaling, reduced myocyte contractile capacity, and abnormal cardiac morphology. Mice exhibiting a 20% reduction in Myosin 10 expression demonstrate significant cardiac functional impairments by the 14th embryonic day, including decreased fractional shortening, lower heart rate, and increased systolic diameter of the left ventricle (Ma and Adelstein, 2014). Consequently, reduced CALM3 levels in our model may contribute to long-term defects in excitation–contraction coupling and cardiac remodeling. Hypertrophy of the heart is characterized by a reduction in the number of cardiomyocytes at birth, accompanied by progressive myocyte hypertrophy, altered nuclear morphology, interstitial fibrosis, infiltration of inflammatory cells, an increase in the levels of cleaved CASPASE-3, a key marker of the cardiomyocyte apoptotic pathway, and compromised cardiac contractile function (Ma et al., 2009). Accordingly, the observed decline in Calml3 protein levels in fetuses at 18 gestational days subject to intrauterine protein restriction may be correlated with hypertrophy, diminished populations of diverse cardiomyocyte types, interstitial fibrosis, and other modifications noted in the hearts of animals affected by gestational protein restriction (Silva et al., 2013; Folguieri et al., 2022; Assalin et al., 2019). This phenomenon may lead to morphological changes in the left ventricle, comprising a decrease in the number of myocytes and binucleated myocytes, as well as an increase in fibrosis and apoptosis, as illustrated by studies utilizing this experimental model (Assalin et al., 2019). Throughout embryonic development, tissues frequently encounter low oxygen levels, or hypoxia. The hypoxia-inducible factor 1-alpha (HIF-1α) acts as a pivotal transcription factor activated under such conditions. HIF-1α facilitates the expression of adaptive genes that enhance cellular survival, regulates the proliferation and differentiation of cardiomyocytes and other cell types, and contributes to cardiac formation and the development of new blood vessels by directly activating the transcription of vascular endothelial growth factor (VEGF) (Knutson et al., 2021; Guimarães-Camboa et al., 2015; Compernolle et al., 2003; Ryan et al., 1998; Kotch et al., 1999). The decline in HIF-1α and its target gene, VEGFA, observed in animals from the low-protein (LP) group may be associated with inhibited cell proliferation and heightened cell death (Gomes et al., 2023). Such responses are adaptive mechanisms to ensure nutrient availability in a constrained environment, permitting only a limited number of viable cells to develop and thrive. Nonetheless, after an increase in nutrient availability post-birth, the alterations that initially supported development may predispose individuals to disease, as reported in various studies addressing the consequences of gestational protein restriction (Folguieri et al., 2022; Corstius et al., 2005; Morrison et al., 2007; Lim et al., 2006). Oxct1 (3-oxoacid CoA-transferase 1) is the rate-limiting enzyme in ketone body oxidation, enabling the heart to utilize ketones as an efficient energy substrate, particularly under stress conditions such as ischemia or nutrient deprivation (Cotter et al., 2013; Maalouf et al., 2007; Veech, 2004). Reduced OXCT1 expression during fetal development may therefore compromise the ability of cardiomyocytes to adapt metabolically, rendering them more vulnerable to energy deficits and oxidative stress later in life. Together, the reduction in OXCT1 and CALM3 observed in protein-restricted fetuses highlights an early metabolic and structural vulnerability that may predispose the heart to maladaptive remodeling and cardiovascular disease in later life. Therefore, the diminished expression of Oxct1 and HIF-1α observed in the low-protein (LP) group at gestational day 14 indicates that these animals are already exhibiting signs of metabolic stress that persist until day 18 of gestation. In conclusion, while placental adaptations may appear advantageous for specific organs and facilitate their development, the ramifications of protein restriction become increasingly pronounced in the later stages of gestation. In contrast, the heart undergoes remodeling earlier in the developmental timeline. Thus, these findings indicate that early gestational protein restriction significantly alters the expression profiles of genes involved in heart development, influencing cell proliferation and autophagy dynamics. This suggests a cascade of early cardiac remodeling responses aimed at accommodating fetal growth requirements. Notably, this process may lead to transient heart volume expansion accompanied by cardiomyocyte hypertrophy, which has the potential to progress towards fibrosis, metabolic stress, and a reduction in ventricular wall thickness. We must include a statement on study limitations, acknowledging that our findings lay a strong groundwork for future large-scale investigations. However, subsequent transcriptomics (RNA-Seq) or proteomics studies will yield a more comprehensive perspective and represent logical, necessary steps.
Data availability statement
The datasets presented in this study can be found in online repositories. The names of the repository/repositories and accession number(s) can be found in the article/supplementary material.
Ethics statement
The animal study was approved by The Institutional Ethics Committee (approval #5481-1/2020 CEUA/UNICAMP) authorized the use of transgenic animals, as confirmed by the Internal Biosafety Commission (CIBIO/FCM nº 08/2019). The study utilized C57BL/6J mice and C57BL/6-Tg (CAG-RFP/EGFP/Map1lc3b) 1Hill/J (CAG-RFP-EGFP-LC3). Throughout the investigation, we adhered to the general guidelines established by the Brazilian College of Animal Experimentation. The study was conducted in accordance with the local legislation and institutional requirements.
Author contributions
MF: Writing – original draft, Formal Analysis, Data curation, Investigation, Methodology, Validation, Visualization. BC: Validation, Formal Analysis, Writing – original draft, Data curation, Methodology, Investigation, Visualization. PB: Investigation, Writing – original draft, Validation, Visualization, Data curation, Methodology, Formal Analysis, Conceptualization. JG: Funding acquisition, Supervision, Conceptualization, Writing – review and editing, Formal Analysis, Investigation, Validation, Data curation.
Funding
The author(s) declare that financial support was received for the research and/or publication of this article. MF was the recipient of a PhD fellowship from Coordenação de Aperfeiçoamento de Pessoal de Nível Superior - CAPES. The work was financially supported by FAPESP (CEPID OCRC). Fundação de Amparo à Pesquisa do Estado de São Paulo (2013/12486-5), Coordenação de Aperfeiçoamento de Pessoal de Nível Superior (CAPES), and Conselho Nacional de Desenvolvimento Científico e Tecnológico (CNPq, 465699/2014-6).
Acknowledgments
The authors thank Ize Penha Lima for technical assistance.
Conflict of interest
The authors declare that the research was conducted in the absence of any commercial or financial relationships that could be construed as a potential conflict of interest.
Generative AI statement
The author(s) declare that no Generative AI was used in the creation of this manuscript.
Any alternative text (alt text) provided alongside figures in this article has been generated by Frontiers with the support of artificial intelligence and reasonable efforts have been made to ensure accuracy, including review by the authors wherever possible. If you identify any issues, please contact us.
Publisher’s note
All claims expressed in this article are solely those of the authors and do not necessarily represent those of their affiliated organizations, or those of the publisher, the editors and the reviewers. Any product that may be evaluated in this article, or claim that may be made by its manufacturer, is not guaranteed or endorsed by the publisher.
References
Assalin, H. B., Gontijo, J. A. R., and Boer, P. A. (2019). MiRNAs, target genes expression and morphological analysis on the heart in gestational protein-restricted offspring. PLoS One 14 (4), e0210454. doi:10.1371/journal.pone.0210454
Aye, C. Y. L., Lewandowski, A. J., Lamata, P., Ross, U., Davis, E., Ohuma, E. O., et al. (2017). Disproportionate cardiac hypertrophy during early postnatal development in infants born preterm. Pediatr. Res. 82 (1), 36–46. doi:10.1038/pr.2017.96
Barker, D. J. C., Osmond, C., Golding, J., Kuh, D., and Wadsworth, M. E. (1989a). Growth in utero, blood pressure in childhood and adult life, and mortality from cardiovascular disease. BMJ 298 (6673), 564–567. doi:10.1136/bmj.298.6673.564
Barker, D. J. P., Osmond, C., Winter, P. D., Margetts, B., and Simmonds, S. J. (1989b). Weight in infancy and death from ischaemic heart disease. Lancet 334 (8663), 577–580. doi:10.1016/S0140-6736(89)90710-1
Bennett, R. D., Mauer, A. S., and Strehler, E. E. (2007). Calmodulin-like protein increases filopodia-dependent cell motility via up-Regulation of Myosin-10. J. Biol. Chem. 282 (5), 3205–3212. doi:10.1074/jbc.M607174200
Bennett, R. D., and Strehler, E. E. (2008). Calmodulin-like protein enhances Myosin-10 translation. Biochem. Biophys. Res. Comm. 369 (2), 654–659. doi:10.1016/j.bbrc.2008.02.056
Berhrsin, J., and Gibson, A. (2011). Cardiovascular system adaptation at birth. Paed Child. Heal 21 (1), 1–6. doi:10.1016/j.paed.2010.08.016
Buijtendijk, M. F. J., Barnett, P., and van den Hoff, M. J. B. (2020). Development of the human heart. Am J Med Gen, Part C Seminars Med. Genet. 184 (1), 7–22. doi:10.1002/ajmg.c.31778
Chamberlain, A. A., Lin, M., Lister, R. L., Maslov, A. A., Wang, Y., Suzuki, M., et al. (2014). DNA methylation is developmentally regulated for genes essential for cardiogenesis. J. Am. Heart Assoc. 3 (3), e000976. doi:10.1161/JAHA.114.000976
Cohen, E., Wong, F. Y., Horne, R. S. C., and Yiallourou, S. R. (2016). Intrauterine growth restriction: impact on cardiovascular development and function throughout infancy. Pediatr Res 79(6), 821–830. doi:10.1038/pr.2016.24
Colombo, J. P., Cervantes, H., Kokorovic, M., Pfister, U., and Perritaz, R. (1992). Effect of different protein diets on the distribution of amino acids in plasma, liver and brain in the rat. Ann. Nutr. Metab. 4 (1), 23–33. doi:10.1159/000177695
Compernolle, V., Brusselmans, K., Franco, D., Moorman, A., Dewerchin, M., Collen, D., et al. (2003). Cardia bifida, defective heart development and abnormal neural crest migration in embryos lacking hypoxia-inducible factor-1alpha. Cardiovasc. Res. 60 (3), 569–579. doi:10.1016/j.cardiores.2003.07.003
Corstius, H. B., Zimanyi, M. A., Maka, N., Herath, T., Thomas, W., Der Laarse, A. V., et al. (2005). Effect of intrauterine growth restriction on the number of cardiomyocytes in rat hearts. Pediatr. Res. 57 (6), 796–800. doi:10.1203/01.PDR.0000157726.65492.CD
Cotter, D. G., Schugar, R. C., and Crawford, P. A. (2013). Ketone body metabolism and cardiovascular disease. Am. J. Physiol. Heart Circ. Physiol. 304, 1060–1076. doi:10.1152/ajpheart.00646.2012
Crispi, F., Sepúlveda-Martínez, A., Crovetto, F., Gómez, O., Bijnens, B., and Gratacós, E. (2020). Main patterns of fetal cardiac remodeling. Fetal Diagn Ther. 47, 337–344. doi:10.1159/000506047
Custódio, A. H., Lima, M. C., Vaccari, B., Boer, P. A., and Gontijo, J. A. R. (2017). Renal sodium handling and blood pressure changes in gestational protein-restricted offspring: role of renal nerves and ganglia neurokinin expression. PLoS One 12 (6), e0179499. doi:10.1371/journal.pone.0179499
Czabotar, P. E., Lessene, G., Strasser, A., and Adams, J. M. (2014). Control of apoptosis by the BCL-2 protein family: implications for physiology and therapy. Nat. Rev. Mol. Cell Biol. 15, 49–63. doi:10.1038/nrm3722
Decuypere, J. P., Parys, J. B., and Bultynck, G. (2012). Regulation of the autophagic Bcl-2/Beclin 1 interaction. Cells 1(3), 284–312. doi:10.3390/cells1030284
Desai, M., Crowther, N. J., Lucas, A., and Hales, C. N. (1996). Organ-selective growth in the offspring of protein-restricted mothers. Br. J Nutr 76 (4), 591–603. doi:10.1079/bjn19960065
Dobaczewski, M., Chen, W., and Frangogiannis, N. G. (2011). Transforming growth factor (TGF)-β signaling in cardiac remodeling. J. Mol. Cell Cardiol. 51, 600–606. doi:10.1016/j.yjmcc.2010.10.033
Eghbali, M., Deva, R., Alioua, A., Minosyan, T. Y., Ruan, H., Wang, Y., et al. (2005). Molecular and functional signature of heart hypertrophy during pregnancy. Circ. Res. 96 (11), 1208–1216. doi:10.1161/01.RES.0000170652.71414.16
Finnemore, A., and Groves, A. (2015). Physiology of the fetal and transitional circulation. Semin Fetal Neonatal Med 20(4), 210–216. doi:10.1016/j.siny.2015.04.003
Folguieri, M. S., Franco, A. T. B., Vieira, A. S., Gontijo, J. A. R., and Boer, P. A. (2022). Transcriptome and morphological analysis on the heart in gestational protein-restricted aging Male rat offspring. Front. Cell Devel Biol. 10 (October), 892322. doi:10.3389/fcell.2022.892322
Fowden, A. L., Sferruzzi-Perri, A. N., Coan, P. M., Constancia, M., and Burton, G. J. (2009). Placental efficiency and adaptation: endocrine regulation. J. Physiol. 587, 3459–3472. doi:10.1113/jphysiol.2009.173013
França, A. S., Santos, M. P., Garófalo, M. A. R., Navegantes, L. C., Kettelhut, I. C., Lopes, C. F., et al. (2009). Low protein diet changes the energetic balance and sympathetic activity in brown adipose tissue of growing rats. Nutrition 25 (11–12), 1186–1192. doi:10.1016/j.nut.2009.03.011
Frangogiannis, N. G. (2017). The role of transforming growth factor (TGF)-β in the infarcted myocardium. J. Thor Dis. 9, S52–S63. doi:10.21037/jtd.2016.11.19
Gomes, J. S., Sene, L. B., Lamana, G. L., Boer, P. A., and Gontijo, J. A. R. (2023). Impact of maternal protein restriction on hypoxia-inducible factor (HIF) expression in male fetal kidney development. PLoS One 18 (5), e0266293. doi:10.1371/journal.pone.0266293
Guimarães-Camboa, N., Stowe, J., Aneas, I., Sakabe, N., Cattaneo, P., Henderson, L., et al. (2015). HIF1α represses cell stress pathways to allow proliferation of hypoxic fetal cardiomyocytes. Dev. Cell 33 (5), 507–521. doi:10.1016/j.devcel.2015.04.021
Igarashi, N., Honjo, M., and Aihara, M. (2021). MTOR inhibitors potentially reduce TGF-Β2-Induced fibrogenic changes in trabecular meshwork cells. Sci. Rep. 11 (1), 14111. doi:10.1038/s41598-021-93580-3
Jiménez, U., Paulina, A., Gómez-Sierra, T., Aparicio-Trejo, O. M., Orozco-Ibarra, M., and Pedraza-Chaverri, J. (2021). Backstage players of fibrosis: NOX4, MTOR, HDAC, and S1P; companions of TGF-β. Cell Signal 87, 110123. doi:10.1016/j.cellsig.2021.110123
Kato, H., Nakajima, S., Saito, Y., Takahashi, S., Katoh, R., and Kitamura, M. (2012). MTORC1 serves ER stress-triggered apoptosis via selective activation of the IRE1-JNK pathway. Cell Death Differ. 19 (2), 310–320. doi:10.1038/cdd.2011.98
Knutson, A. K., Williams, A. L., Boisvert, W. A., and Shohet, R. V. (2021). HIF in the heart: development, metabolism, ischemia, and atherosclerosis. J. Clin. Invest 131 (17), e137557. doi:10.1172/JCI137557
Kotch, L. E., Iyer, N. V., Laughner, E., and Semenza, G. L. (1999). Defective vascularization of HIF-1alpha-null embryos is not associated with VEGF deficiency but with mesenchymal cell death. Dev. Biol. 209 (2), 254–267. doi:10.1006/dbio.1999.9253
Langley-Evans, S. C., Gardner, D. S., and Welham, S. J. M. (1998). Intrauterine programming of cardiovascular disease by maternal nutritional status. Nutrition 14 (1), 39–47. doi:10.1016/s0899-9007(97)00391-2
Lamana, G. L., Ferrari, A. L. L., Gontijo, J. A. R., and Boer, P. A. (2021). Gestational and breastfeeding low-protein intake on blood pressure, kidney structure, and renal function in Male rat offspring in adulthood. Front. Physiol. 12 (April), 658431. doi:10.3389/fphys.2021.658431
Lan, Y., and Evans, T. (2019). Epigenetic regulation of cardiac development and disease through DNA methylation. J. Life Sci. (Westlake Village) 1 (2), 1–10.
Langley-Evans, S. C., Gardner, D. S., and Jackson, A. A. (1996). Association of disproportionate growth of fetal rats in late gestation with raised systolic blood pressure in later life. Reproduction 106 (2), 307–312. doi:10.1530/jrf.0.1060307
Li, F. X. W., Capasso, J. M., and Gerdes, A. M. (1996). Rapid transition of cardiac myocytes from hyperplasia to hypertrophy during postnatal development. J. Mol. Cell Cardiol. 28 (8), 1737–1746. doi:10.1006/jmcc.1996.0163
Li, Z. Y., Lv, S., Qiao, J., Wang, S. Q., Fang, J. F., Li, D., et al. (2023). Acacetin alleviates cardiac fibrosis via TGF-Β1/Smad and AKT/MTOR signal pathways in spontaneous hypertensive rats. Gerontology 69 (9), 1076–1094. doi:10.1159/000531596
Lim, K., Monika, A., Zimanyi, M. A., and Black Mj, M. (2006). Effect of maternal protein restriction in rats on cardiac fibrosis and capillarization in adulthood. Ped Res. 60 (1), 83–87. doi:10.1109/FCST.2010.103
Ma, X., and Adelstein, R. S. (2014). A point mutation in Myh10 causes major defects in heart development and body wall closure. Circ. Card. Gen. 7 (3), 257–265. doi:10.1161/CIRCGENETICS.113.000455
Ma, X., Takeda, K., Singh, A., Yu, Z. X., Zerfas, P., Blount, A., et al. (2009). Conditional ablation of nonmuscle myosin II-B delineates heart defects in adult mice. Cir. Res. 105 (11), 1102–1109. doi:10.1161/CIRCRESAHA.109.200303
Maalouf, M., Sullivan, P. G., Davis, L., Kim, D. Y., and Rho, J. M. (2007). Ketones inhibit mitochondrial production of reactive oxygen species production following glutamate excitotoxicity by increasing NADH oxidation. Neuroscience 145 (1), 256–264. doi:10.1016/j.neuroscience.2006.11.065
Mariano, V. S., Boer, P. A., and Gontijo, J. A. R. (2021). Fetal undernutrition programming, sympathetic nerve activity, and arterial hypertension development. Front. Physio 12, 704819. doi:10.3389/fphys.2021.704819
Mesquita, F. F., Gontijo, J. A. R., and Boer, P. A. (2010a). Expression of renin–angiotensin system signalling compounds in maternal protein-restricted rats: effect on renal sodium excretion and blood pressure. Nephrol. Dial. Transpl. 25 (2), 380–388. doi:10.1093/ndt/gfp505
Mesquita, F. F., Gontijo, J. A. R., and Boer, P. A. (2010b). Maternal undernutrition and the offspring kidney: from fetal to adult life. Braz J. Med. Biol. Res. 43 (11), 1010–1018. doi:10.1590/S0100-879X2010007500113
Mihaylova, M. M., and Shaw, R. J. (2011). The AMPK signalling pathway coordinates cell growth, autophagy and metabolism. Nat. Cell Biol. 13, 1016–1023. doi:10.1038/ncb2329
Mihl, C., Dassen, W., and Kuipers, H. (2008). Cardiac remodelling: concentric versus eccentric hypertrophy in strength and endurance athletes. Neth. Heart J. 16, 129–133. doi:10.1007/BF03086131
Morrison, J. L., Botting, K. J., Dyer, J. L., Williams, S. J., Thornburg, K. L., and McMillen, I. C. (2007). Restriction of placental function alters heart development in the sheep fetus. Am J Physiol-Regulatory, Integr. Comp. Physiology 293 (1), R306–R313. doi:10.1152/ajpregu.00798.2006
Morton, S. U., and Brodsky, D. (2016). Fetal physiology and the transition to extrauterine life. Clin. Perinatol. 43, 395–407. doi:10.1016/j.clp.2016.04.001
Passos, M. C. F., Ramos, C. F., and Moura, E. G. (2000). Short and long term effects of malnutrition in rats during lactation on the body weight of offspring. Nutr. Res. 20 (I), 1603–1612. doi:10.1016/s0271-5317(00)00246-3
Porrello, E. R., Mahmoud, A. I., Simpson, E., Hill, J. A., Richardson, J. A., Olson, E. N., et al. (2011). Transient regenerative potential of the neonatal mouse heart. Science 331 (6020), 1078–1080. doi:10.1126/science.1200708
Rees, W. D., Hay, S. M., Buchan, V., Antipatis, C., and Palmer, R. M. (1999). The effects of maternal protein restriction on the growth of the rat fetus and its amino acid supply. Brit J. Nutr. 81 (3), 243–250. doi:10.1017/s0007114599000446
Rogers, M. S., and Strehler, E. E. (2001). The tumor-sensitive calmodulin-like protein is a specific light chain of human unconventional myosin X. JBC 276 (15), 12182–12189. doi:10.1074/jbc.M010056200
Roseboom, T. J., van der Meulen, J. H., Osmond, C., Barker, D. J., Ravelli, A. C., Schroeder-Tanka, J. M., et al. (2000). Coronary heart disease after prenatal exposure to the Dutch famine, 1944-45. Heart 84 (6), 595–598. doi:10.1136/heart.84.6.595
Ryan, H. E., Lo, J., and Johnson, R. S. (1998). HIF-1α is required for solid tumor formation and embryonic vascularization. EMBO J. 17, 3005–3015. doi:10.1093/emboj/17.11.3005
Saadat, S., Noureddini, M., Mahjoubin-Tehran, M., Nazemi, S., Shojaie, L., Aschner, M., et al. (2021). Pivotal role of TGF-β/Smad signaling in cardiac fibrosis: non-coding RNAs as effectual players. Front. Card. Med. 7, 588347. doi:10.3389/fcvm.2020.588347
Sene, B., Mesquita, F. F., Santos, D. C., Carvalho, R., Gontijo, J. A. R., Boer, P. A., et al. (2013). Involvement of renal corpuscle microRNA expression on epithelial-to-mesenchymal transition in maternal low protein diet in adult programmed rats. PLos One 8 (8), e71310. doi:10.1371/journal.pone.0071310
Sene, L. B., Scarano, W. R., Zapparoli, A., Gontijo, J. A. R., and Boer, P. A. (2021). Impact of gestational low-protein intake on embryonic kidney MicroRNA expression and in nephron progenitor cells of the Male fetus. PLoS One 16 (2 February), e0246289. doi:10.1371/journal.pone.0246289
Shin, K. W. D., Atalay, M. V., Cetin-Atalay, R., O’Leary, E. M., Glass, M. E., Szafran, J. C. H., et al. (2025). mTOR signaling regulates multiple metabolic pathways in human lung fibroblasts after TGF-β and in pulmonary fibrosis. Am J Physiol 328 (2), L215–L228. doi:10.1152/ajplung.00189.2024
Silva, R. B., Mesquita, F. F., Andreo, M., Assalin, H. B., Gontijo, J. A. R., and Boer, P. A. (2013). Effect of gestational protein restriction on left ventricle hypertrophy and heart angiotensin II signaling pathway in adult offspring rats. Health (Irvine) 5 (4), 78–84. doi:10.4236/health.2013.54a011
Tan, C. M. J., and Adam, J. L. (2020). The transitional heart: from early embryonic and fetal development to neonatal life. Fetal Diagn Ther. S. doi:10.1159/000501906
Toyomizu, M., Matsukubo, M., Hayashi, K., and Tomita, Y. (1991). Response surface analyses of the effects of dietary fat on feeding and growth pattern in mice from weaning to maturity. Anim. Prod. 52 (1), 207–214. doi:10.1017/S0003356100005857
Veech, R. L. (2004). The therapeutic implications of ketone bodies: the effects of ketone bodies in pathological conditions: Ketosis, ketogenic diet, redox states, insulin resistance, and mitochondrial metabolism. Prost. Leuk. Esse Fat. Acids 70 (3), 309–319. doi:10.1016/j.plefa.2003.09.007
Wang, R., and Wenchao, H. (2021). Asprosin promotes β-Cell apoptosis by inhibiting the autophagy of β-Cell via AMPK-MTOR pathway. J. Cell Physiol. 236 (1), 215–221. doi:10.1002/jcp.29835
WHO (2024). WHO/Cardiovascular Diseases (CVDs). Geneva, Switzerland: WHO. Available online at: https://www.who.int/news-room/fact-sheets/detail/cardiovascular (Accessed July 14, 2024).
Wu, T. W., Timur, A., and Istvan, S. (2016). Transitional hemodynamics in preterm neonates: clinical relevance. Pediat Neonatol. 57, 7–18. doi:10.1016/j.pedneo.2015.07.002
Xie, Y., Xianli, L., Guoyu, Z., Ran, G., and Na, C. (2023). MTOR in programmed cell death and its therapeutic implications. Cytok Grow. Fact. Rev. 71-72, 66–81. doi:10.1016/j.cytogfr.2023.06.002
Keywords: maternal protein restriction, cardiogenesis, fetal programming, apoptosis, autophagy, heart gene expression, DOHAD
Citation: Folguieri MS, Calsa B, Boer PA and Gontijo JAR (2025) The earliest impact of restricted protein intake during pregnancy on heart development in male mouse offspring. Front. Cell Dev. Biol. 13:1678126. doi: 10.3389/fcell.2025.1678126
Received: 01 August 2025; Accepted: 13 October 2025;
Published: 30 October 2025.
Edited by:
Olga V. Anatskaya, Russian Academy of Sciences (RAS), RussiaReviewed by:
Yiming Meng, China Medical University, ChinaMatthew Durbin, Indiana University Bloomington, United States
Copyright © 2025 Folguieri, Calsa, Boer and Gontijo. This is an open-access article distributed under the terms of the Creative Commons Attribution License (CC BY). The use, distribution or reproduction in other forums is permitted, provided the original author(s) and the copyright owner(s) are credited and that the original publication in this journal is cited, in accordance with accepted academic practice. No use, distribution or reproduction is permitted which does not comply with these terms.
*Correspondence: José Antonio Rocha Gontijo, amdvbnRpam9AdW5pY2FtcC5icg==