Abstract
Introduction:
In Atlantic halibut (Hippoglossus hippoglossus) aquaculture, egg and larval quality remain major bottlenecks. Most transcriptomic and proteomic studies compare freshly fertilized eggs of good versus poor quality, assuming early molecular differences explain hatching success. However, many lethal phenotypes arise only after the mid-blastula transition (MBT), suggesting that early comparisons may overlook key developmental processes.
Methods:
We performed stage-resolved RNA sequencing of Atlantic halibut embryos spanning unfertilized egg (UF), cleavage (8C, 16C), blastula (BL), 25% epiboly (25 EB), and blastopore closure (50 degree-days, 50 dd). Differential expression analysis (DESeq2 with LFC shrinkage), Gene Ontology (GO) overrepresentation (PANTHER, REVIGO), and curated axis-patterning gene sets from zebrafish orthologs were used to map transcriptional dynamics.
Results:
Minimal transcriptional change occurred during cleavage (UF–16C), dominated by maternal transcripts. A pronounced transcriptional shift emerged at MBT (16C→BL), marked by upregulation of canonical developmental pathways (Wnt, BMP, Notch) and axis-specification genes (e.g., bmp2b, chrd, wnt8b, fgf8a). These pathways remained active through gastrulation (BL→25 EB), alongside enrichment of morphogenetic processes such as mesoderm formation and left–right symmetry. By 50 dd, expression shifted toward lineage differentiation programs involving neurons, muscle, and cranial skeleton. Axis-regulator dynamics showed that dorso–ventral (D–V) patterning is initiated by maternal factors but reinforced by zygotic cascades, whereas anterior–posterior (A–P) patterning is primarily zygotic.
Discussion:
Our results demonstrate that the decisive transcriptional programs underlying axis formation and organogenesis are activated from MBT onward. These findings imply that comparisons limited to unfertilized or early cleavage stages cannot capture the biology determining embryo viability. Stage-resolved analyses encompassing MBT and gastrulation are therefore essential for identifying transcriptomic markers of egg and larval quality in halibut.
1 Introduction
Atlantic halibut (Hippoglossus hippoglossus) farming began in the 1990s in Norway, Scotland, and Iceland; today, Norway is the only country reporting substantial production (FAO, 2023). Yet major bottlenecks persist, especially inconsistent hatching success and high, variable rates of larval and juvenile deformities, which limit reliable supply of juveniles for grow-out (Brown, 2010; Engelsen et al., 2004; Lewis et al., 2004). These constraints echo observations across marine aquaculture species, where early developmental competence remains a key determinant of production efficiency. In Atlantic halibut specifically, Niepagen et al. (2025) showed that abnormalities observed before the mid-blastula transition (MBT) were only moderately predictive of hatching success, whereas defects emerging after MBT (e.g., absence of head structures, failed symmetry, impaired cell specification) were much stronger correlates of poor hatch outcomes.
At the molecular level, early vertebrate embryos undergo a major developmental shift during the MBT, when control of development passes from maternally provided transcripts and proteins to the newly activated zygotic genome. During this period, zygotic genome activation (ZGA) peaks as widespread transcription begins, cell cycles lengthen, and chromatin becomes more permissive to transcription. Understanding when specific developmental pathways are initiated is therefore crucial for interpreting phenotypes and designing informative sampling schemes (Lee et al., 2014; Vastenhouw et al., 2019).
In fish, stage-resolved transcriptomics has mapped these dynamics in several species, revealing modest transcriptional change during very early cleavages and extensive activation at or after MBT. Examples include zebrafish developmental series that confirmed limited pre-MBT transcription and sharp post-MBT activation, as well as carps and flatfishes where pathway-level reprogramming surrounds blastula/gastrulation (Duan et al., 2022; Fu et al., 2019; Vesterlund et al., 2011). Together, these studies underscore that many axis-setting and patterning genes are zygotically expressed.
Much of the aquaculture literature on finfish egg quality has focused primarily on differences assessed at fertilization or during early cleavage, and on transcript or protein abundance in unfertilized/freshly fertilized eggs (Mommens et al., 2010; Mommens et al., 2014; Yilmaz et al., 2022; Żarski et al., 2017). While these studies have been valuable, the Atlantic halibut case highlights a timing mismatch: Niepagen et al. (2025) found that post-MBT deformities, rather than pre-MBT variation, explained hatching success most effectively. If the decisive developmental programs only emerge around MBT, then transcriptomic contrasts among freshly fertilized eggs are poorly positioned to capture the biology most relevant for competence.
Here, we provide a stage-resolved transcriptomic atlas for early Atlantic halibut development, spanning unfertilized egg through cleavage to blastula and early gastrulation. The objectives of this study were to (i) map when major developmental pathways (e.g., Wnt/Notch/BMP, axis specification, morphogenesis) become over-represented, (ii) identify exemplar genes that define these windows, and (iii) supply a halibut-specific baseline that clarifies which comparisons are biologically meaningful. In doing so, we aim to place Atlantic halibut within the broader vertebrate framework of MZT/MBT timing and offer a rationale for stage-matched designs in future mechanistic and applied studies.
2 Materials and methods
2.1 Ethical statement
Fertilized eggs are developmental stages outside the scope of the Guidelines of the European Union on the protection of animals used for scientific purposes (Directive 2010/63/EU), and approval from the Norwegian Food Safety Authority was not needed. Broodstock handling was performed as part of common hatchery practice.
2.2 Sampling protocol
Sampling occurred in the commercial hatchery at Nordic Halibut AS (Midsund, Norway), where good-quality egg batches from four females were collected at six developmental stages (Figure 1): unfertilized egg (UF), eight-cell (8C, 14 h post-fertilization, hpf), sixteen-cell (16C, 18 hpf), blastodisc (BL, 50 hpf), 25% epiboly (25% EB, 96 hpf), and blastopore closure (50 dd, 200 hpf). All developmental times are given in hours post-fertilization at 6 °C. For each developmental stage, three biological replicates were sampled, each derived from a distinct female. Female identities for all samples are provided in Supplementary Table S1. Egg batches were considered to be of good quality if they exhibited fertilization success >90% or hatching success >80%. Individual eggs were not assessed independently. The hatchery used a flow-through seawater system at 34 ppt salinity, cooled to 6 °C during the spawning season. Eggs were hand-stripped and immediately fertilized using cryopreserved milt (Cryogenetics AS, Norway), then incubated in commercial 250 L cylindro-conical incubators with light aeration and an upwelling flow of 6 °C seawater. For sampling, unfertilized eggs were collected immediately after being stripped from the females, and fertilized eggs were scooped out of the commercial incubators. All sampled eggs were transferred into 1.8 mL cryo-vials and immediately snap frozen in liquid nitrogen to preserve RNA integrity and stored at −80 °C until RNA extraction.
FIGURE 1
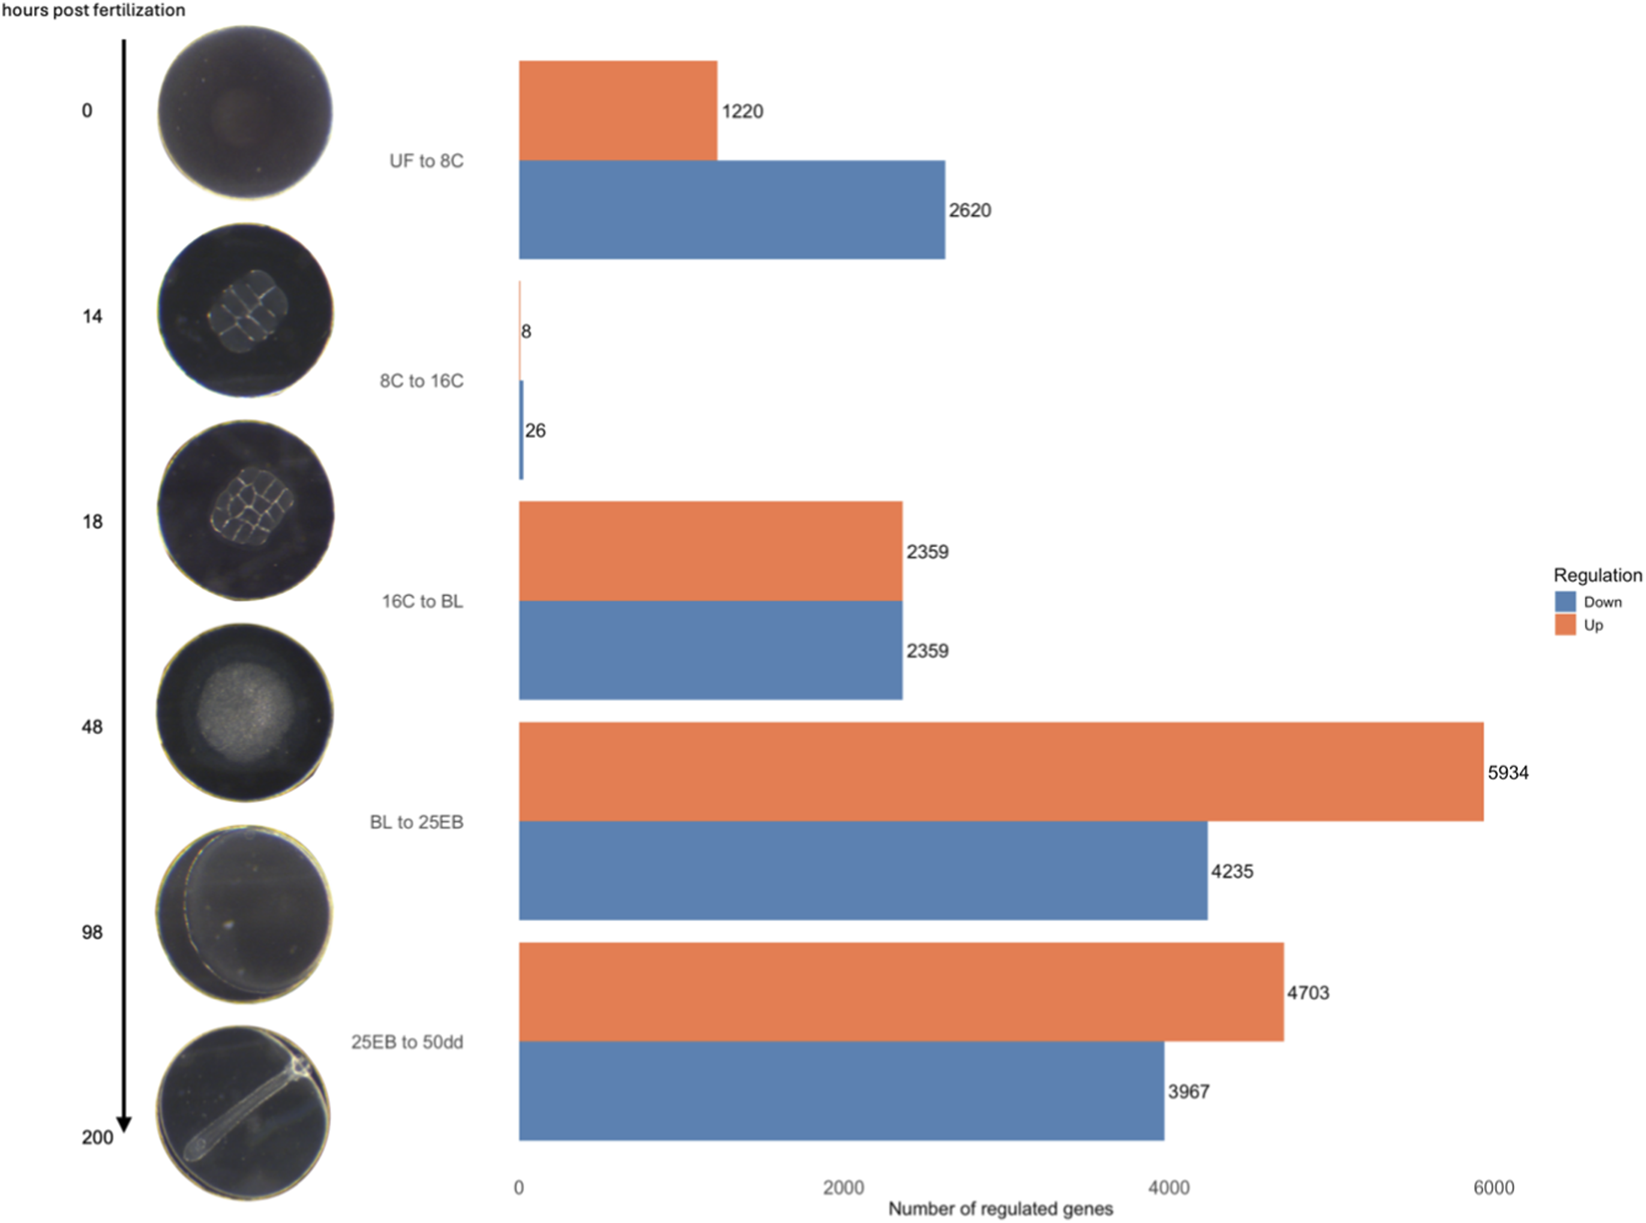
Overview of the Atlantic halibut (Hippoglossus hippoglossus) developmental stages and the number of differentially expressed genes (DEGs) across five developmental transitions spanning six stages. The representative images on the left illustrate these transitions chronologically, while the bar chart on the right displays the total number of significantly up- and downregulated genes for each transition. Blue bars indicate genes with higher expression changes in the less advanced developmental stage (downregulation), whereas orange bars represent genes with higher expression changes in the more advanced stage (upregulation). UF = unfertilized eggs, 8C = 8 cell stage, 16C = 16 cell stage, BL = blastula stage, 25 EB = 25% epiboly, 50 dd = 50-degree day stage. Developmental time at 6 °C.
2.3 RNA extraction and sequencing
Total RNA was extracted from pools of ten eggs per sample using the RNeasy Universal Plus Mini Kit (Qiagen) according to the manufacturer’s protocol. RNA concentrations were quantified using NanoDrop spectrophotometer (NanoDrop Technologies, Santa Clara, CA). Samples were diluted to total RNA concentration of 200 ng/sample until estimation of RNA integrity numbers (RIN) for each sample that was calculated with the Bioanalyzer (Agilent Technologies, Santa Clara, CA). The average RIN value was 9.8 ± 0.24. Paired-end 150bp mRNA sequencing was then performed by the same company using Illumina HiSeq 2,500 platform (Illumina Inc., USA) following the manufacturer’s instruction at Novogene co (Beijing, China).
2.4 Data generation, data curation and differential expression
Read quality was assessed using FastQC (Andrews, 2010). Raw reads were inspected with FastQC on a representative subset of libraries, which consistently showed depressed per-base quality and/or primer/adapter carryover in the first 10 nucleotides (nt) at the 5′end. To mitigate this systematic artifact, we applied a fixed 10-nt 5′hard trim to all reads prior to alignment (no additional quality/adaptor trimming was performed) using Trimmomatic v0.38 (Bolger et al., 2014). TopHat2 v2.0.13 (Kim et al., 2013) was used to map the trimmed reads to the most recent Atlantic halibut reference genome and corresponding known transcripts (NCBI, fHipHip1. pri; GCF_009819705.1). Uniquely mapped reads were retained and sorted by name using Samtools v1.10 (Li et al., 2009). HTSeq-count (Anders et al., 2015) was used to generate read counts for each annotated gene in every sample, using the intersection-strict mode to exclude ambiguously mapped reads and assuming unstranded RNA-seq data. All 18 samples (three biological replicates per developmental stage) yielded complete count data with no missing values, and all libraries passed quality control and were included in the final DESeq2 analysis. The differential gene expression was performed using the DESeq2 package for R (Love et al., 2014) using all sample counts for data normalization. Differential expression analysis was performed by comparing each developmental stage with its subsequent stage (UF vs. 8C, 8C vs. 16C, 16C vs. BL, BL vs. 25 EB, and 25 EB vs. 50 dd). P-values were adjusted for multiple testing using the Benjamini–Hochberg method to control the false discovery rate (FDR), and genes with FDR < 0.05 were considered significantly differentially expressed and included in the gene overrepresentation analysis (Benjamini and Hochberg, 1995). Each transition was divided into up- and downregulated genes based on the sign of the shrunken log2 fold change (LFC), where positive values indicate higher expression in the more developed stage and negative values indicate higher expression in the less developed stage. Statistical significance was assessed with DESeq2 Wald tests and p-values were adjusted for multiple testing using the Benjamini–Hochberg procedure (FDR); genes with FDR (padj) < 0.05 were considered differentially expressed. Log2 fold changes were then shrunk after model fitting using lfcShrink with the ashr method to reduce the influence of technical noise and improve effect-size stability (Stephens, 2017).
2.5 Statistical overrepresentation analysis (ORA) and relevant GO terms
For each pairwise comparison, overrepresentation analysis (ORA) was performed with the differentially expressed genes, divided in upregulated and downregulated using Panther (http://www.pantherdb.org/) and Danio rerio as reference species. Here, GO term biological processes were considered, with False discovery rate FDR (padj) < 0.05. Redundant GO terms were eliminated using REVIGO (Supek et al., 2011) with the D. rerio database. Redundant GO terms are defined as terms that convey similar biological meaning to another term in the result list, usually because they share many of the same genes and exist in a hierarchical structure. The removal process involved SimRel as the semantic similarity measure with a cut-off value of 0.5. To refine the overrepresentation analysis, a cut-off was applied to exclude overly general GO terms that were present in more than 10% of the annotated genes.
Based on the overrepresentation results, the following curated subset of Gene Ontology (GO) terms was highlighted as regulators of embryonic development: GO:0050793 (regulation of developmental process), GO:0048598 (embryonic morphogenesis), GO:0030510 (regulation of BMP signaling pathway), GO:0016055 (Wnt signaling pathway), GO:0009790 (embryo development), GO:0007498 (mesoderm development), GO:0007389 (pattern specification process), GO:0007368 (determination of left/right symmetry), GO:0007219 (Notch signaling pathway), and GO:0007186 (G protein-coupled receptor signaling pathway). These terms reflect core developmental pathways broadly implicated in vertebrate embryogenesis (Gilbert and Michael, 2019) and were selected for their repeated overrepresentation across developmental transitions and their established roles in embryonic patterning and axis specification during early vertebrate development. To visualize the temporal dynamics of transcriptional activation of these processes, –log10 (p-value) scores from overrepresentation analysis were plotted across developmental transitions (UF to 8C, 8C–16C, 16C to BL, BL to 25 EB, and 25 EB to 50 dd), reflecting the statistical significance of GO term overrepresentation for the selected GO terms at each transition. This approach provided insight into the developmental timing of significant overrepresentation for each selected pathway, serving as a proxy for the onset of transcriptional activity.
A curated list of 109 developmental genes with known functions in vertebrate embryogenesis was compiled from zebrafish (D. rerio) developmental reviews (Fuentes et al., 2020; Schier and Talbot, 2005). Genes were grouped into two categories: dorso–ventral (D–V) patterning and anterior–posterior (A–P) patterning (Table 1). Atlantic halibut orthologs were identified by manual searches of the NCBI database (BLAST and gene annotations). Gene expression dynamics across developmental stages were visualized as heatmaps using log10-transformed, variance-stabilized counts from DESeq2, standardized to z-scores across samples and plotted with the ComplexHeatmap R package. (Gu, 2022).
TABLE 1
| Gene name | Function | Phenotype | References |
|---|---|---|---|
| D-V patterning | |||
| bmp2b | Bmp signal | Severely dorsalized | Kishimoto et al. (1997), Schmid et al. (2000) |
| bmp7b | Bmp signal | Severely dorsalized | Dick et al. (2000), Schmid et al. (2000) |
| acvr1l | Type I Bmp receptor | Severely dorsalized | Bauer et al. (2001), Mintzer et al. (2001), Mullins et al. (1996) |
| smad5 | Transcription factor | Weakly (zyg.) or strongly (mat.) dorsalized | Hild et al. (1999) |
| twsg1a | Bmp agonist | Dorsalized | Little and Mullins (2004), Xiao et al. (2005) |
| neto1l | Metalloprotease for Chordin | Weakly dorsalized | Connors et al. (1999) |
| chrd | Bmp inhibitor | Ventralized | Langdon and Mullins (2011), Schulte-Merker et al. (1997), Zinski et al. (2018) |
| szl | Bmp inhibitor | Ventralized | Martyn and Schulte-Merker (2003), Yabe et al. (2003) |
| gdf6a | Bmp signal | Dorsalized | Sidi et al. (2003) |
| admp | Divergent Bmp signal | Dorsalized | Lele et al. (2001), Willot et al. (2002) |
| sp5a | SP1 Zn Finger | Anteriorized and dorsalized | Weidinger et al. (2005) |
| sp5l | SP1 Zn Finger | Anteriorized and dorsalized | Weidinger et al. (2005) |
| ctnnb1 | B-catenin localization | Variably ventralized | Kelly et al. (2000), Valenti et al. (2015) |
| sybu | B-catenin stability? | Variably ventralized | Mei et al. (2009), Nojima et al. (2010), Nojima et al. (2004) |
| wnt8b | Wnt signal | No ventral and posterior structures | Erter et al. (2001), Hino et al. (2018), Lekven et al. (2001) |
| fgf8a | FGF signal | Ventralized with loss of chordin | Fürthauer et al. (2004), Reifers et al. (1998) |
| il17rd | Antagonist of FGF signaling | Dorsalized | Fürthauer et al. (2002), Tsang et al. (2002) |
| spry2 | Antagonist of FGF signaling | Dorsalized | Fürthauer et al. (2004) |
| dusp6 | Antagonist of FGF signaling | Dorsalized | Tsang et al. (2004) |
| vox | Transcriptional repressor | Severely doralized in double mutants | Imai et al. (2001), Ramel and Lekven (2004), Shimizu et al. (2002) |
| vent | Transcriptional repressor | Severely doralized in double mutants | Imai et al. (2001), Ramel and Lekven (2004), Shimizu et al. (2002) |
| ved | Transcriptional repressor | Severely dorsalized with vox/vent | Imai et al. (2001), Ramel and Lekven (2004), Shimizu et al. (2002) |
| prdm1a | Transcriptional repressor | Dorsalized | Wilm and Solnica-Krezel (2005) |
| ptbp1a | Intracellular Ca2+ regulation | Dorsoventral axis formation defect | Mei et al. (2009) |
| hwa | transmembrane protein, mediated by Syntabulin | no dorsal organizer, strongly ventralized, huluwa can induce a dorsal axis | Shinya et al. (2000), Yan et al. (2018) |
| cav1 | β-catenin regulation | Ventralized | Mo et al. (2010) |
| wnt6b | Dorsal determinant candidate - similar protein architecture | overexpression: dorsalization | Hino et al. (2018) |
| tob1a | β-catenin regulation | inhibits dorsal cell fate induction | Mo et al. (2010), Xiong et al. (2006) |
| ccr7 | β-catenin regulation | Ventralized | Wu et al. (2012) |
| rspo3 | Wnt signal | inhibits ventralizing zygotic Wnt signaling | Rong et al. (2014) |
| ints6 | Bmp signal | strongly dorsalized, with secondary dorsal axes | Kapp et al. (2013) |
| foxo3b | bind to maternal β-catenin | dorsalized | Li et al. (2011), Liu et al. (2018), Xie et al. (2011) |
| eaf1 | bind to maternal β-catenin | dorsalized | Li et al. (2011), Liu et al. (2018), Xie et al. (2011) |
| eaf2 | bind to maternal β-catenin | dorsalized | Li et al. (2011), Liu et al. (2018), Xie et al. (2011) |
| ctsba | endopeptidase, regulates DV patterning | dorsalized | Langdon et al. (2016) |
| spry4 | FGF antagonists | weak dorsalization | Fürthauer et al. (2001) |
| fsta | BMP antagonists | Ventralized if kock out together with noggin | Langdon and Mullins (2011), Zinski et al. (2018) |
| gsc | BMP antagonists | Ventralized | Joore et al. (1996), Kawahara et al. (2000), Kuo et al. (2013), Langdon and Mullins (2011), Maegawa et al. (2006), Zinski et al. (2018) |
| zbtb4 | transcription factor, maternally- deposeted, initiates wnt8a transcription | strongly dorsalized | Yao et al. (2010) |
| fgfr2 | FGF signal | anteriorized and dorsalized embryo | Challa and Chatti (2013), Rohner et al. (2009), White et al. (2017) |
| dazl | Germline transcript | DV defects | Welch and Pelegri (2015) |
| bmpr1ba | Bmp signal | interrupted DV patterning | Little and Mullins (2009), Smith et al. (2011) |
| bmpr1bb | Bmp signal | interrupted DV patterning | Little and Mullins (2009), Smith et al. (2011) |
| bmp1a | BMP antagonist | non-DV patterning embryo | Connors et al. (1999), Van Eeden et al. (1996) |
| A-P and R-L Patterning | |||
| wnt8b | Wnt signal | No ventral and posterior structures | Erter et al. (2001), Hino et al. (2018), Lekven et al. (2001) |
| sp5a | SP1 Zn Finger | Anteriorized and dorsalized | Weidinger et al. (2005) |
| sp5l | SP1 Zn Finger | Anteriorized and dorsalized | Weidinger et al. (2005) |
| fgf24 | FGF signal | Loss of posterior structures with loss of fgf8 | Draper et al. (2003) |
| gsk3ba | required for vegetal pole microtubule organization | AP patterning | Schneider et al. (2012) |
| dvl2 | required in AP-patterning | anteriorized, cyclopic embryos | Xing et al. (2018) |
| fgfr1a | FGF signal | anteriorized | Challa and Chatti (2013), Rohner et al. (2009), White et al. (2017) |
| fgfr1b | FGF signal | anteriorized | Challa and Chatti (2013), Rohner et al. (2009), White et al. (2017) |
| fgfr2 | FGF signal | anteriorized and dorsalized embryo | Challa and Chatti (2013), Rohner et al. (2009), White et al. (2017) |
| fgfr3 | FGF signal | anteriorized | Challa and Chatti (2013), Rohner et al. (2009), White et al. (2017) |
| fgfr4 | FGF signal | anteriorized | Challa and Chatti (2013), Rohner et al. (2009), White et al. (2017) |
| smad4a | Transcription factor | Interrupted AP patterning | Hata and Chen, 2016; Hill (2016) |
| dand5 | Antagonist of Nodal signaling | Loss of LR asymmetry | Hashimoto et al. (2004) |
| spaw | Nodal signal | Loss or randomization of LR asymmetry | Long et al. (2003) |
Atlantic halibut (Hippoglossus hippoglossus) genes with orthologs involved in zebrafish embryonic development. D–V patterning includes genes with known functions in dorso–ventral patterning, and A–P patterning includes genes with known functions in anterior–posterior patterning and left–right symmetry. The gene listed corresponds to the zebrafish ortholog identified in the NCBI Gene database. Function provides a brief description of each gene’s mode of action, and Phenotype summarizes the zebrafish (Danio rerio) knockout mutant phenotype. References indicate key studies describing each gene’s developmental role in zebrafish. Genes and references are based on two reviews of zebrafish development (Fuentes et al., 2020; Schier and Talbot, 2005).
Atlantic halibut orthologs of known zebrafish zygotic genome activators (nanog, pou5f3, sox19b, sox2, sox3) were identified and their rlog-normalized expression values extracted across all developmental stages. Mean expression and standard error were calculated per stage (n = 3 biological replicates). Maternal versus zygotic expression classification. The 58 unique developmental patterning genes from Table 1 were classified based on their expression dynamics. Genes were considered maternally provided if rlog-normalized expression in unfertilized eggs exceeded six and did not increase >2 units at later stages. Genes were classified as zygotically activated if expression increased >2 units from unfertilized to any post-MBT stage (BL, 25 EB, or 50dd). Genes meeting both criteria were classified as maternal + zygotic. Peak expression stage was determined as the developmental stage with maximum rlog-normalized expression.
3 Results
After producing and trimming the RNA-seq data, 25374672 ± 2216047 high quality reads per sample remained and were used for mapping. Approximately 88.8% ± 0.8% reads were successfully aligned against the Atlantic halibut reference genome and annotated genes (see Supplementary Table S1 for sample-specific alignment success). An overview of the developmental stages and the corresponding number of differentially expressed genes (DEGs) between transitions is shown in Figure 1. The distributions of the DEGs, including their -log10 transformed p-values and their log2 fold change is shown in Figure 2.
FIGURE 2
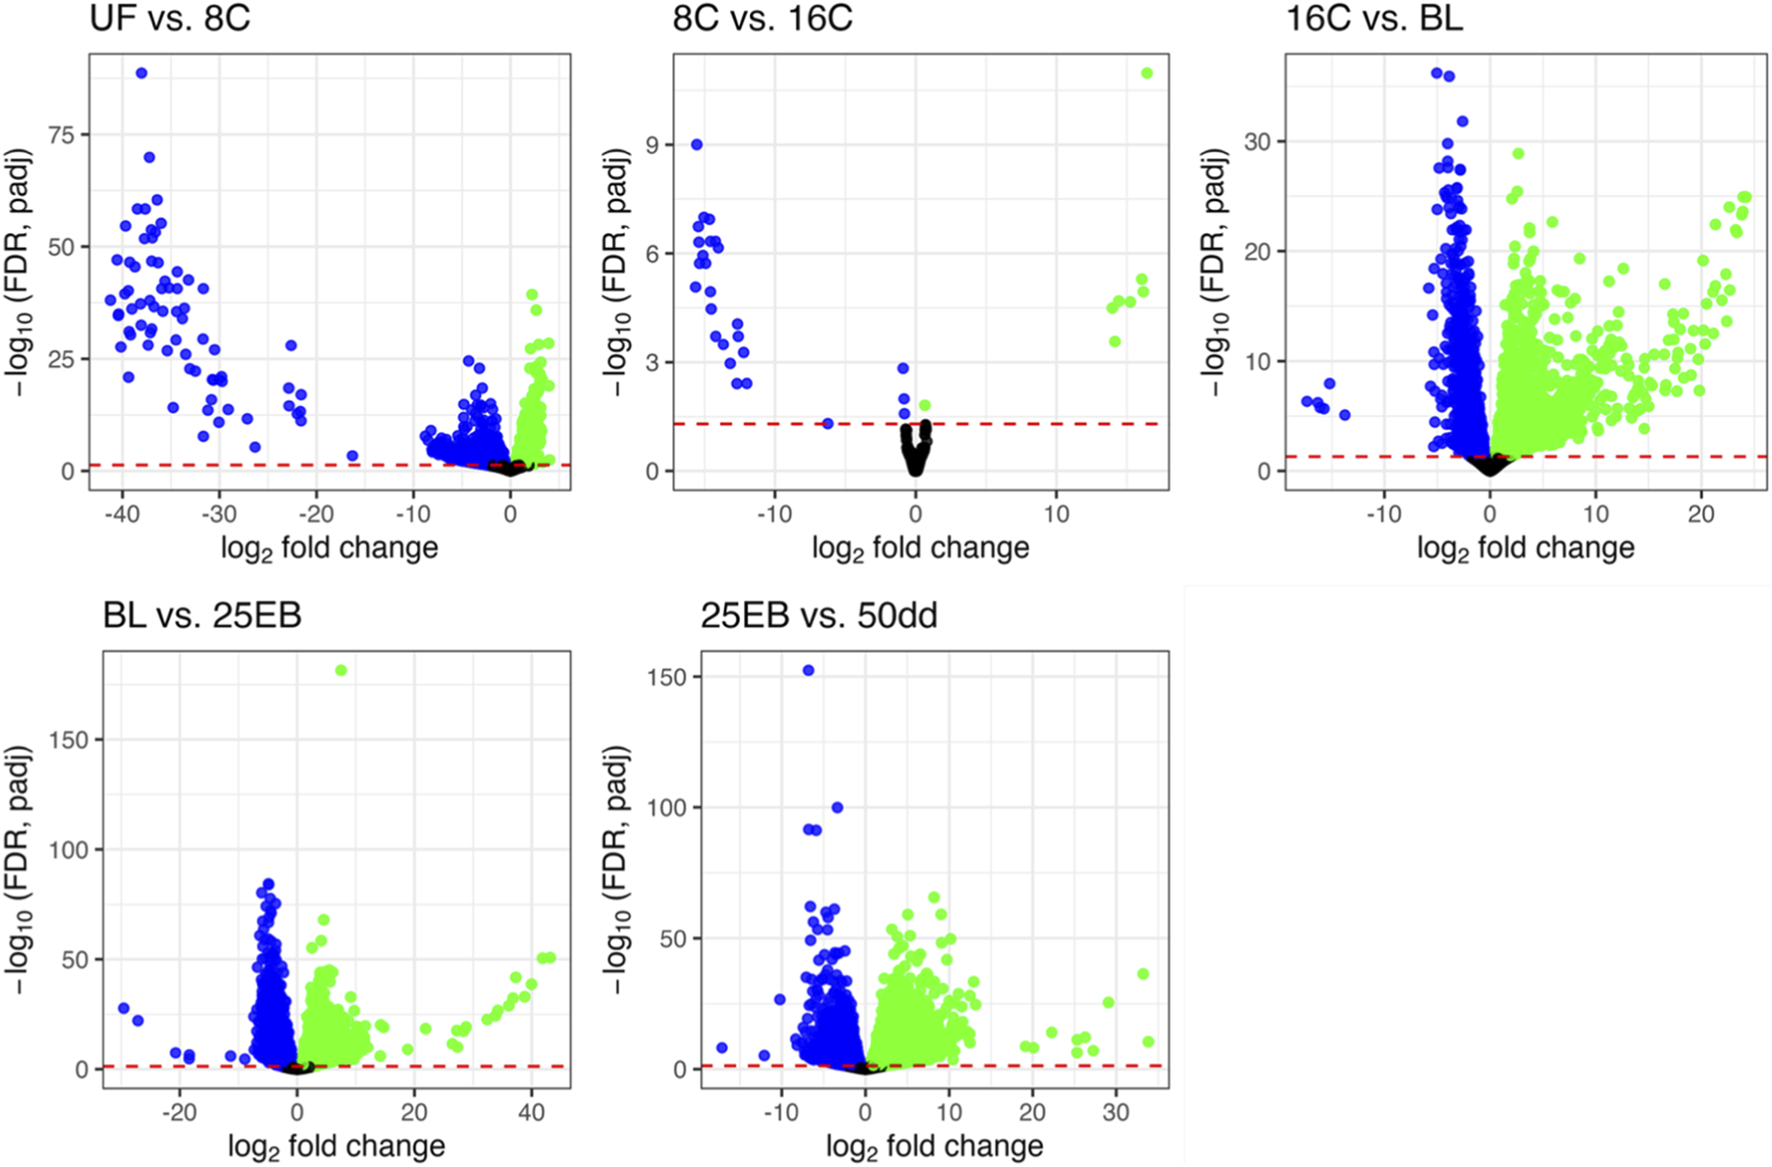
Distribution of differentially expressed genes. Each plot illustrates the transition from one sampled developmental stage to the next. Non-significant genes (padj ≥0.05) are shown in black; genes with higher expression in the more advanced stage are shown in green; and genes with higher expression in the earlier stage are shown in blue. The y-axis shows–log10(FDR, padj), and the x-axis shows log2 fold change between stages. UF = unfertilized eggs, 8C = 8 cell stage, 16C = 16 cell stage, BL = blastula stage, 25 EB = 25% epiboly, 50 dd = 50-degree day stage.
A total of 28793 significantly differentially expressed genes (FDR (padj) < 0.05) were retained across all pairwise stage comparisons (Figure 1). This number represents the sum of significant genes across transitions, and individual genes may appear in more than one comparison (Supplementary Table S2). The distribution of differentially expressed genes was as follows: 3,840 in the first transition (UF vs. 8C), 34 in the second (8C vs. 16C), 6,080 in the third (16C vs. BL), 10169 in the fourth (BL vs. 25 EB), and 8,670 in the final transition (25 EB vs. 50 dd). Hereafter, upregulation refers to genes with higher expression in the more advanced developmental stage, and downregulation to genes with higher expression at the earlier stage. Among these, 1,220 genes were upregulated (31.8%) and 2,620 downregulated (68.2%) in the first transition (UF vs. 8C). In the second transition (8C vs. 16C), only 8 genes (23.5%) were upregulated, while 26 (76.5%) were downregulated. The third transition (16C vs. BL) showed a balanced distribution of 2,359 upregulated (50%) and 2,359 downregulated (50%) genes. In the fourth transition (BL vs. 25 EB), 5,934 genes were upregulated (58.3%) and 4,235 downregulated (41.7%). In the final transition (25 EB vs. 50 dd), 4,703 genes were upregulated (54.2%) and 3,967 downregulated (45.8%). This distribution indicates a generally balanced pattern, with some transitions skewed toward greater up- or downregulation. Minimal gene expression changes were observed between the earliest cleavage stages, which are governed primarily by maternally derived transcripts. A marked increase in differential expression begins at the blastula stage, coinciding with the onset of the mid-blastula transition (MBT).
Principal component analysis (PCA) of the variance-stabilized gene expression data across developmental stages, as computed in DESeq2, is shown in Figure 3. Unfertilized eggs and the blastula stage did not show clear groupings, whereas 8 and 16 cell stage formed two clusters, both close within and towards each other. Both the 25% epiboly stage and the subsequent 50 dd stage formed distinct and distant clusters. Hence, despite some variability within the groups, the developmental stage of the samples played a pivotal role in the clustering and variance of the transcriptomic profile.
FIGURE 3
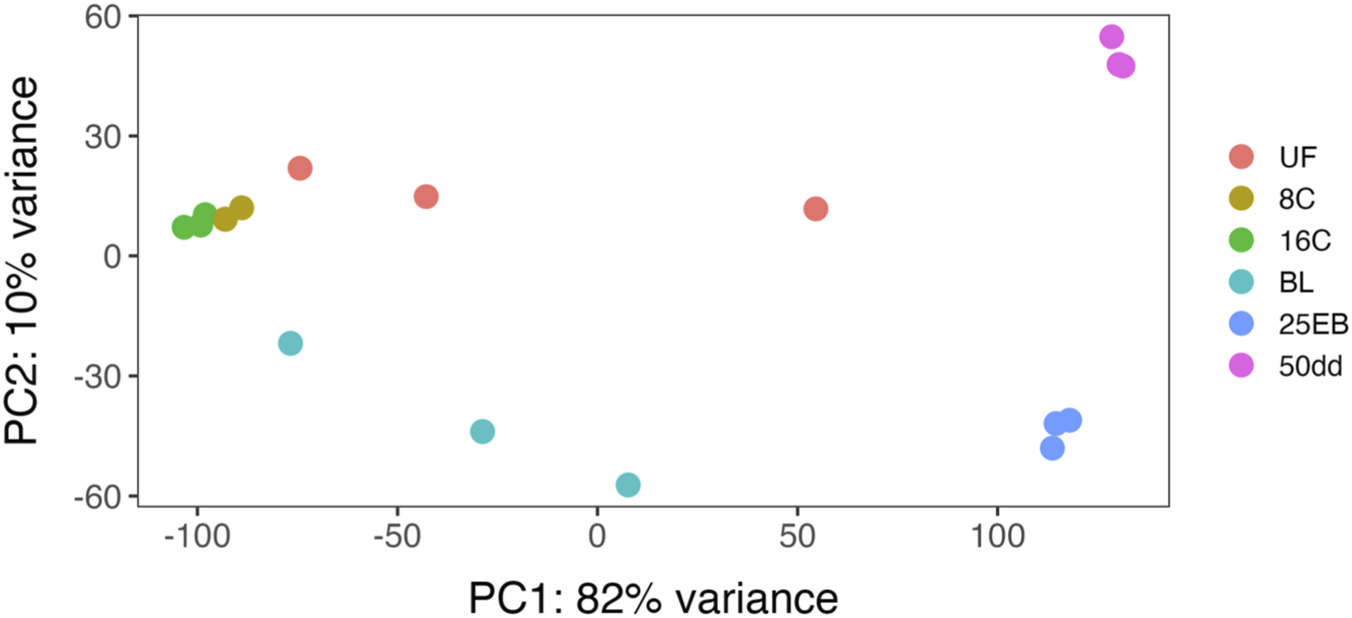
Principal component analysis (PCA) of the samples from several Atlantic halibut (Hippoglossus hippoglossus) developmental stages based on log2 transformed transcriptomic values by developmental stage. UF = unfertilized eggs, 8C = 8 cell stage, 16C = 16 cell stage, BL = blastula stage, 25 EB = 25% epiboly, 50 dd = 50-degree day stage.
3.1 Gene set enrichment analysis
The fold enrichment values for selected developmental Gene Ontology (GO) terms across the five developmental transitions are shown in Figure 4. No biological processes were enriched in the transition from 8C to 16C, reflecting the overall similarity in gene expression profiles during the early cleavage stages. In contrast, a pronounced increase in the enrichment of key developmental processes was observed from the blastula stage onward, particularly in the transition from 16C to BL and continuing through to 25 EB. During this window, pathways such as Wnt, BMP, Notch signaling, and pattern specification became significantly enriched, consistent with activation of the zygotic genome and the onset of embryonic patterning. In the last transition (25 EB to 50 dd), only more general developmental terms remained significantly enriched, indicating that the peak transcriptional engagement of canonical developmental pathways likely occurs during or immediately following the mid-blastula transition (MBT). This enrichment pattern suggests that, in the present analysis, maternal transcripts contributed only minimally to the expression of these selected developmental pathways. This interpretation is supported by the absence of enriched developmental GO terms during the early cleavage stages, when maternal mRNAs dominate, and the strong enrichment of such terms beginning at the blastula stage, coinciding with zygotic genome activation.
FIGURE 4
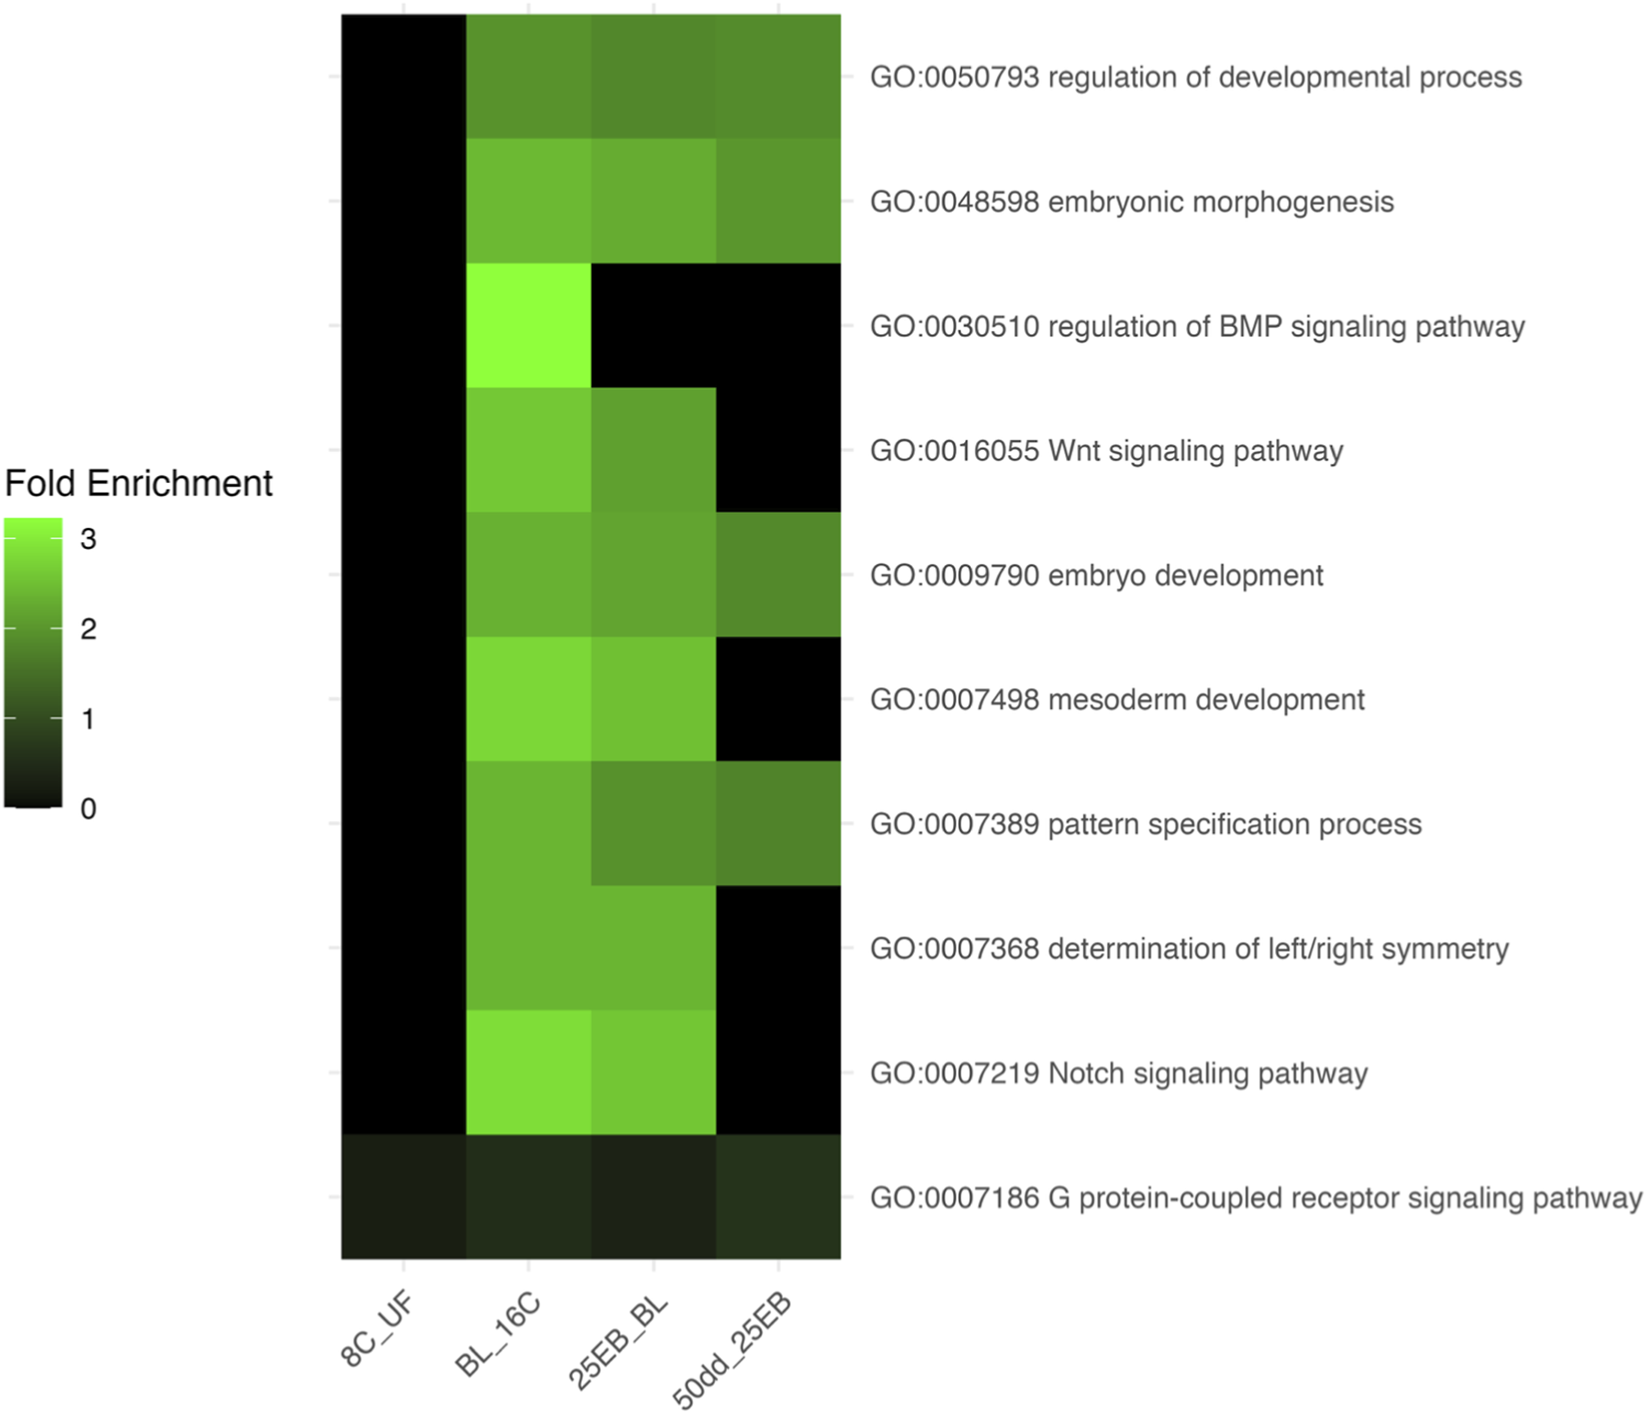
Heatmap of fold enrichment values for selected developmental Gene Ontology (GO) terms across transitions in Atlantic halibut (Hippoglossus hippoglossus) embryonic development. Each row represents a GO term, labeled as “Term ID – Name,” and each column corresponds to a developmental transition. The color gradient indicates the degree of GO-term enrichment (blue = low, green = moderate, black = baseline). UF = unfertilized eggs, 8C = eight-cell stage, 16C = sixteen-cell stage, BL = blastula stage, 25 EB = 25% epiboly, 50 dd = 50-degree-day stage.
3.2 GO term overrepresentation in developmental transitions
The overrepresentation analysis identified a total of 2,911 overrepresented Gene Ontology (GO) biological terms across the various developmental transitions (see Supplementary Table S3 for GO terms and associated genes). ORA tests whether certain biological functions are represented more frequently in a list of differentially expressed genes than would be expected by chance, helping to reveal underlying biological themes. GO terms were filtered using REVIGO to reduce redundancy and improve interpretability, and all results reported here refer to this redundancy-reduced set. After filtering, 729 non-redundant terms were retained for further analysis: 341 were associated with upregulated genes (i.e., higher expression in the later developmental stage), and 388 with downregulated genes (i.e., higher expression in the earlier developmental stage) (Supplementary Table S4; Figure 5). While both up- and downregulated GO terms were identified through overrepresentation analysis, only upregulated terms, those that are overrepresented in the more developed embryonic stages, were further analyzed in detail, as the focus was on the activation of developmental pathways during embryogenesis. The number of downregulated terms per transition is reported for completeness.
FIGURE 5
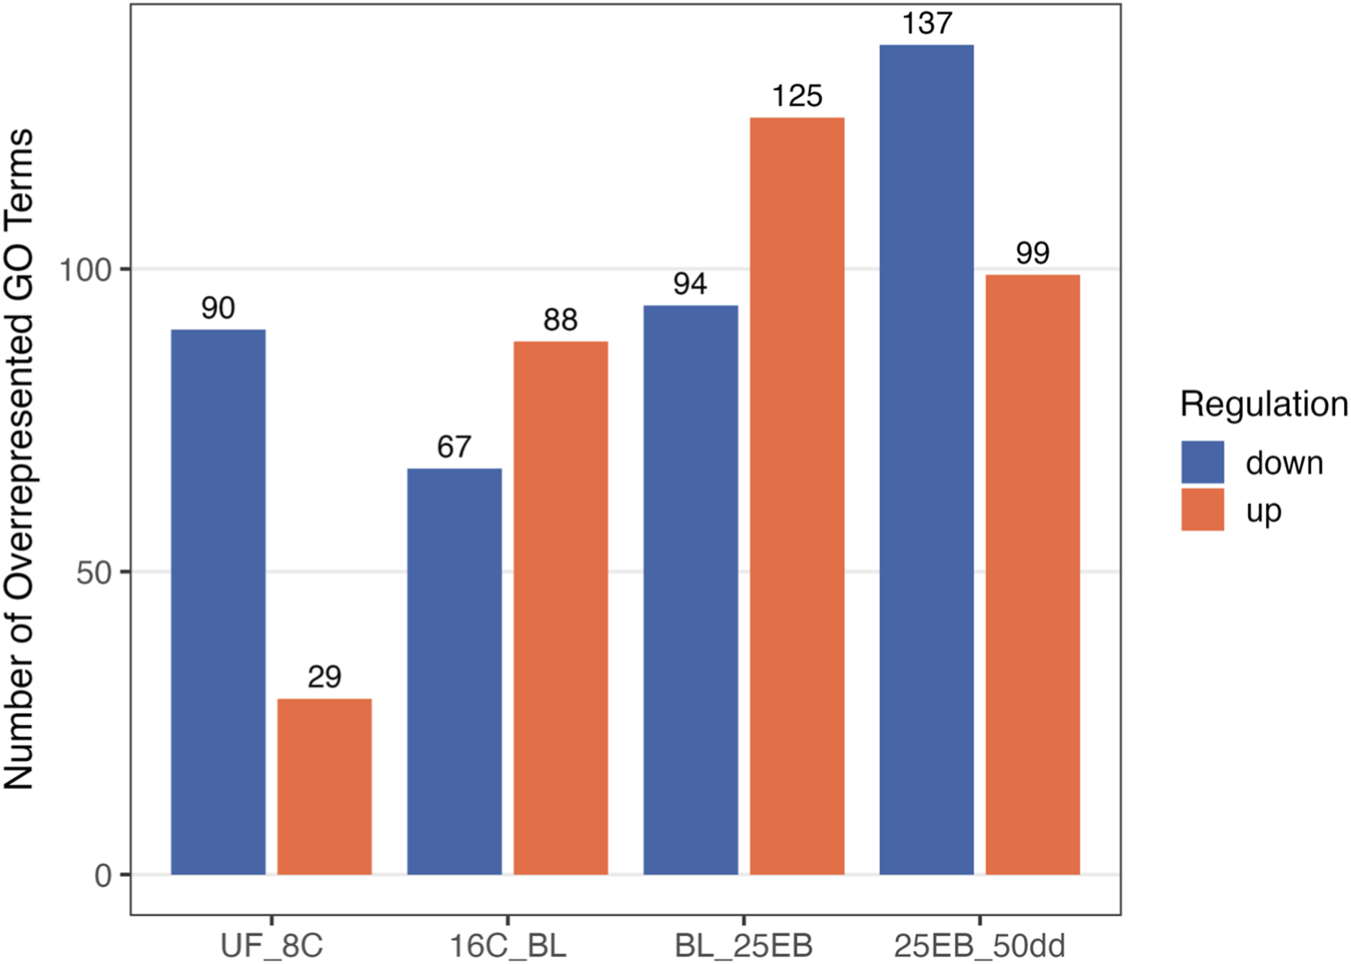
Number of significantly overrepresented Gene Ontology (GO) biological processes across developmental transitions in Atlantic halibut (Hippoglossus hippoglossus). Bars represent GO terms enriched among upregulated (coral) and downregulated (steelblue) genes in each pairwise stage comparison. Upregulated refers to GO terms that are expressed in the more advanced developmental transition, whereas downregulated refers to GO terms with higher expression in the earlier embryonic stage. Transitions are ordered developmentally from unfertilized egg (UF) to 50-degree days (50dd). UF = unfertilized eggs, 8C = 8 cell stage, 16C = 16 cell stage, BL = blastula stage, 25 EB = 25% epiboly, 50 dd = 50-degree day stage.
3.2.1 Unfertilized eggs to eight and 16 cell stages
The first transition (UF→8C) revealed 29 upregulated GO terms (Figure 6; Supplementary Table S4). These were dominated by stress- and signaling-related categories such as response to stress (GO:0006950), G protein–coupled receptor signaling pathway (GO:0007186), and chromatin organization (GO:0006325). In contrast, 90 terms had higher expression in unfertilized eggs, including several developmental processes such as embryo development (GO:0009790), mesoderm development (GO:0007498), and regulation of developmental process (GO:0050793). No significant overrepresentation was observed in the subsequent 8C→16C transition, consistent with the overall stability of the cleavage stages.
FIGURE 6
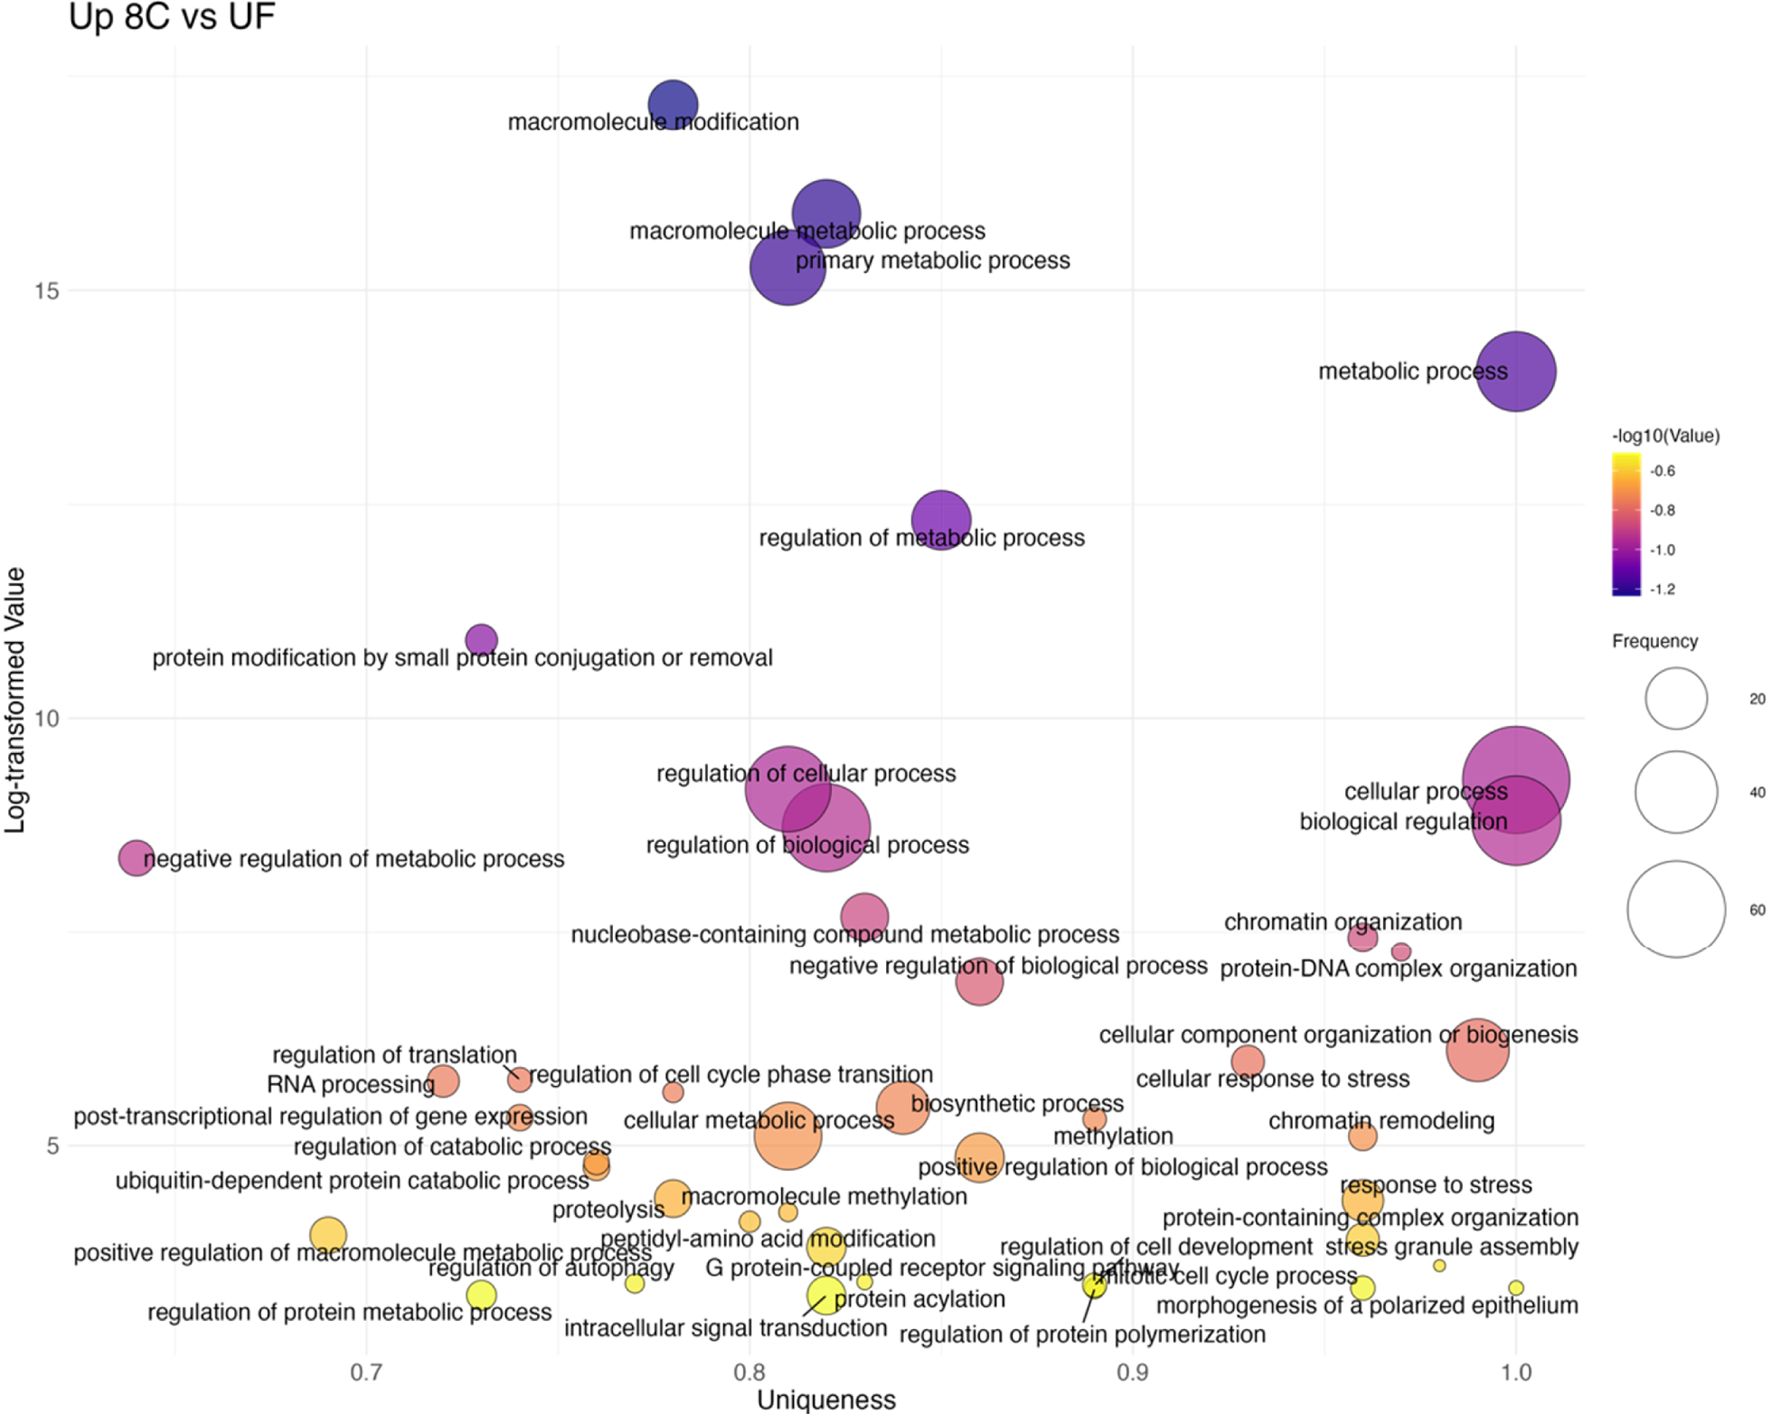
Bubble plot of non-redundant GO terms with higher expression in 8C stage eggs compared to UF eggs of Atlantic halibut (Hippoglossus hippoglossus). Frequency refers to the number of genes with signficant changes in expression, associated with each GO term, uniqueness assesses how distinct a term is in relation to the entire list, based on semantic comparison. Terms with higher uniqueness values are typically less likely to be redundant or dispensable. Log-transformed values are reversed (-log10 transformed) p-values, where larger values indicate higher significance. UF = unfertilized eggs, 8C = 8 cell stage.
3.2.2 16 cell stage to blastula stage
The transition from 16C to BL marked the first strong transcriptional shift, with 88 non-redundant GO terms upregulated (Figure 7; Supplementary Table S4). Key processes included embryo development (GO:0009790), embryonic morphogenesis (GO:0048598), and axis-patterning pathways such as Wnt signaling (GO:0016055) and Notch signaling (GO:0007219), consistent with the onset of zygotic transcription at MBT. Several stress- and signaling-related terms were also overrepresented, reflecting broad cellular reprogramming. In contrast, processes related to cell cycle (GO:0007049) and cellular localization (GO:0051641) were downregulated, indicating a shift from cleavage divisions toward morphogenetic patterning.
FIGURE 7
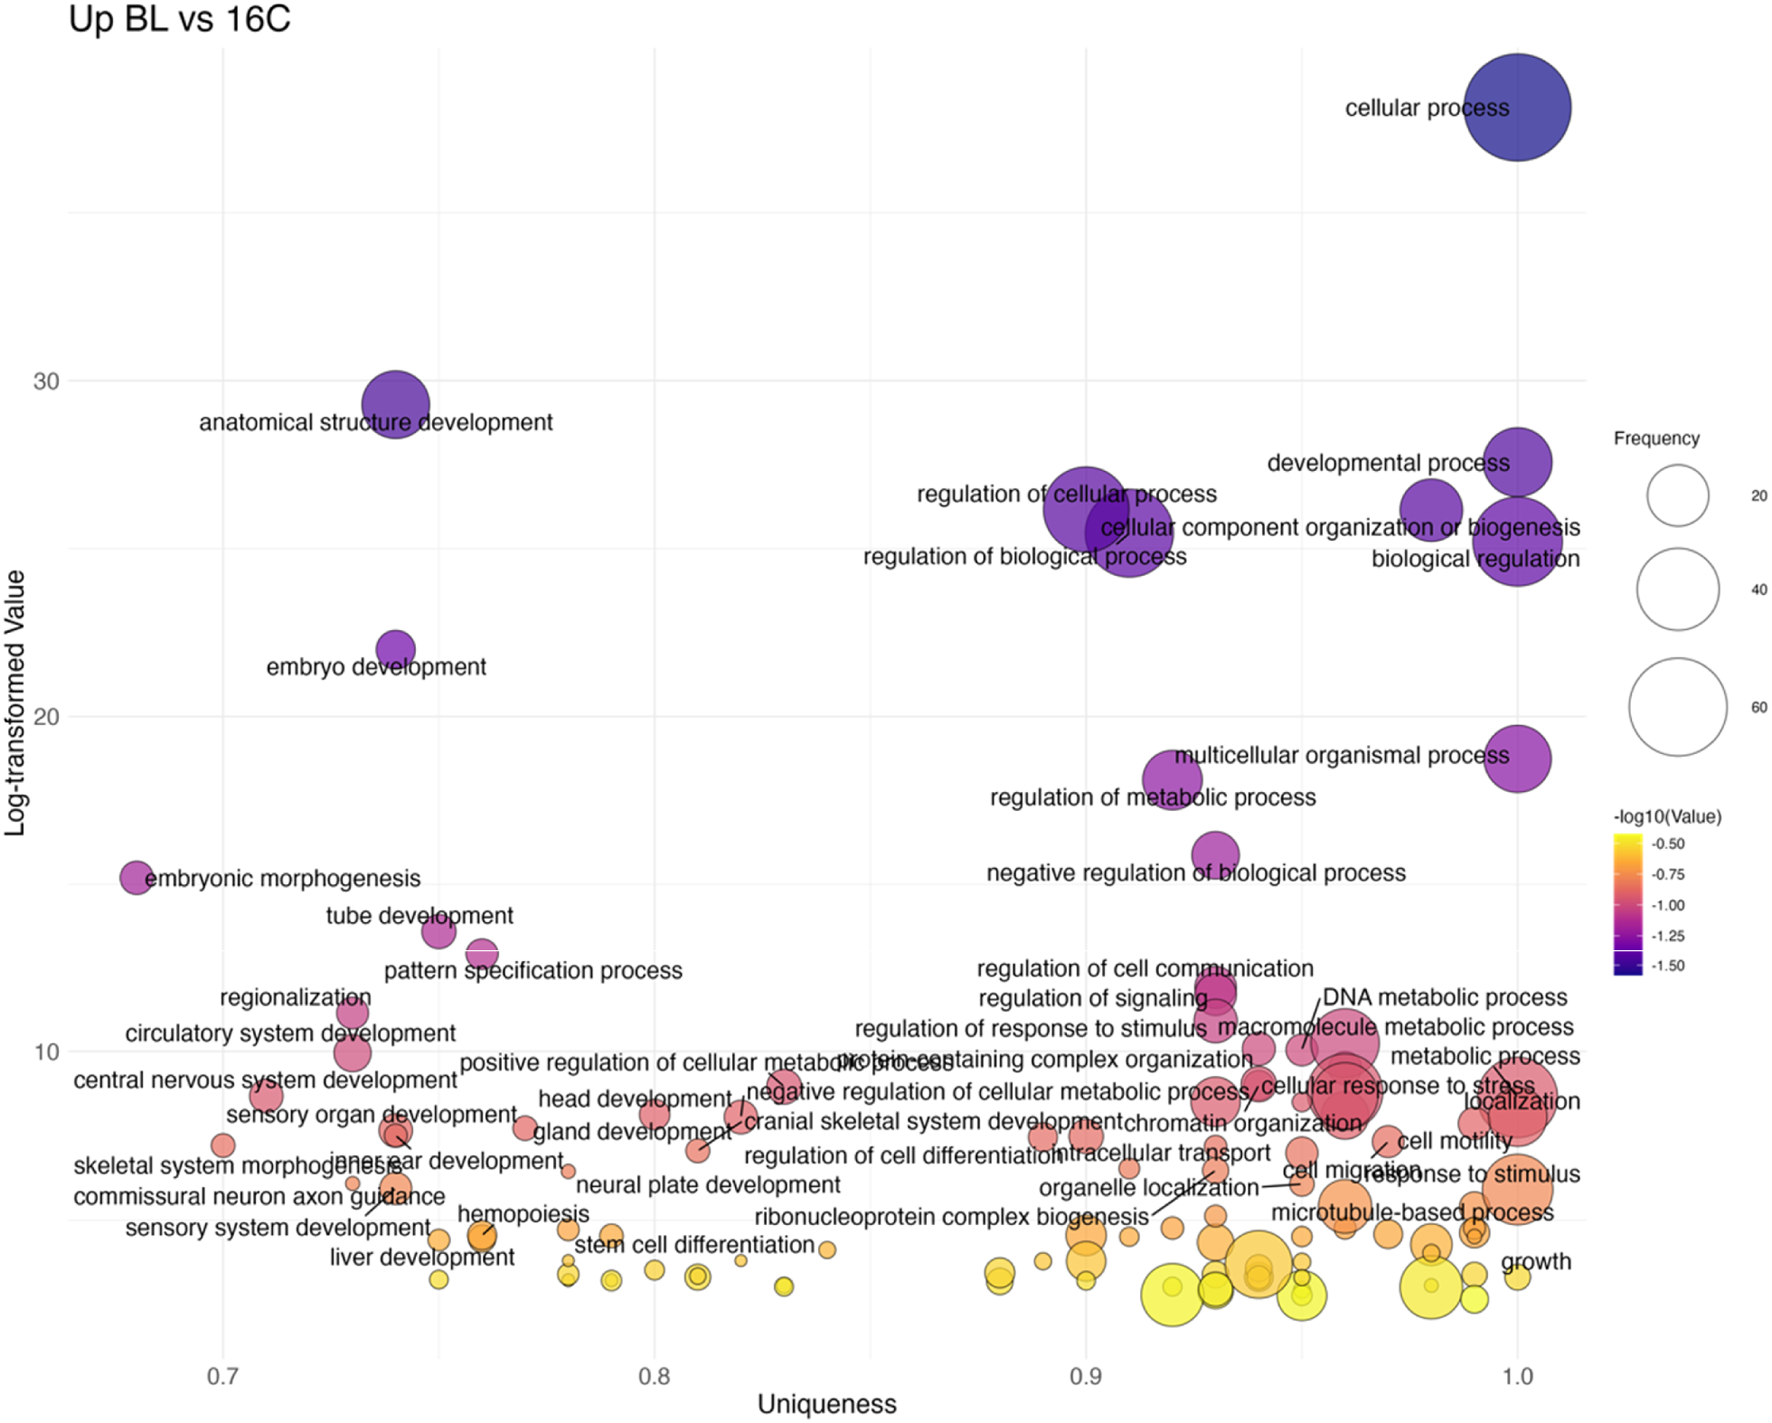
Bubble plot of non-redundant GO terms with higher expression in BL stage eggs compared to 16C eggs of Atlantic halibut (Hippoglossus hippoglossus). Frequency refers to the number of genes with signficant changes in expression, associated with each GO term, uniqueness assesses how distinct a term is in relation to the entire list, based on semantic comparison. Terms with higher uniqueness values are typically less likely to be redundant or dispensable. Log-transformed values are reversed p-values, where larger values indicate higher significance. 16C = 16 cell stage, BL = blastula stage.
3.2.3 Blastula stage to 25% epiboly
The BL→25 EB transition showed the largest number of upregulated terms (125 total; Figure 8; Supplementary Table S4). Overrepresented categories included broad developmental processes such as embryo development (GO:0009790), embryonic morphogenesis (GO:0048598), and pattern specification (GO:0007389). More specialized terms were also prominent, including determination of left/right symmetry (GO:0007368) and mesoderm development (GO:0007498), alongside continued overrepresentation of Wnt signaling (GO:0016055). These results indicate that gastrulation is accompanied by both general morphogenetic activity and the specification of body axes.
FIGURE 8
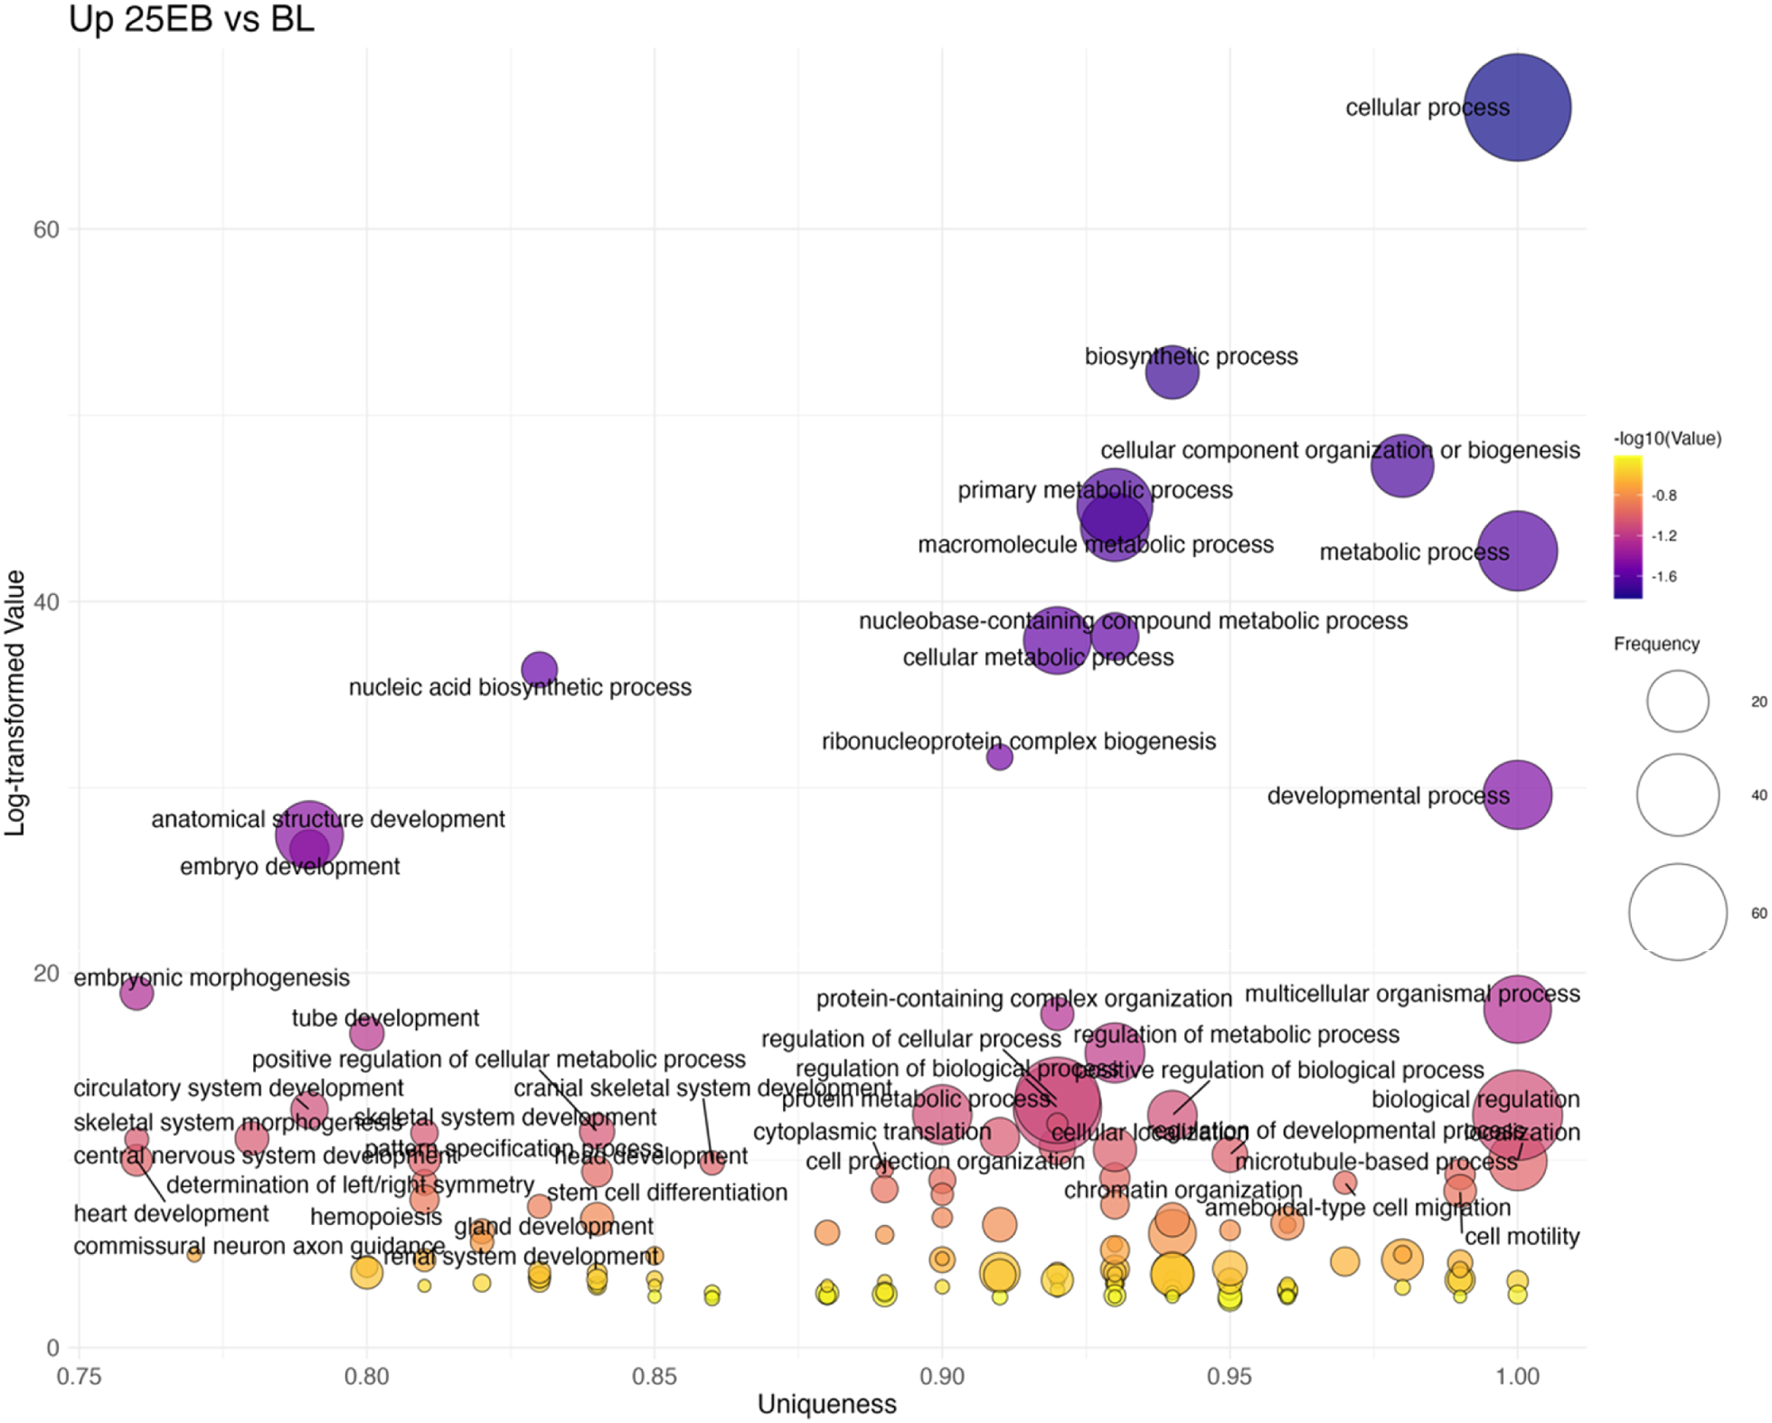
Bubble plot of non-redundant GO terms with higher expression in 25 EB stage eggs compared to BL stage eggs of Atlantic halibut (Hippoglossus hippoglossus). Frequency refers to the number of genes with signficant changes in expression, associated with each GO term, uniqueness assesses how distinct a term is in relation to the entire list, based on semantic comparison. Terms with higher uniqueness values are typically less likely to be redundant or dispensable. Log-transformed values are reversed p-values, where larger values indicate higher significance. BL = blastula stage, 25 EB = 25% epiboly.
3.2.4 25% epiboly to 50 dd stage
The final transition (25 EB→50 dd) was characterized by 99 upregulated GO terms (Figure 9; Supplementary Table S4). These included more general developmental categories such as tissue development (GO:0009888), animal organ morphogenesis (GO:0009887), and pattern specification (GO:0007389). Several lineage-specific processes also emerged, including neuron differentiation (GO:0030182), muscle structure development (GO:0061061), and cranial skeletal system development (GO:1904888). Some categories, including head development (GO:0060322) and regionalization (GO:0003002), appeared as both up- and downregulated terms, reflecting the dynamic refinement of transcriptional programs at this stage. Overall, these data suggest that while early patterning pathways peak at MBT and gastrulation, later stages shift toward differentiation and organogenesis.
FIGURE 9
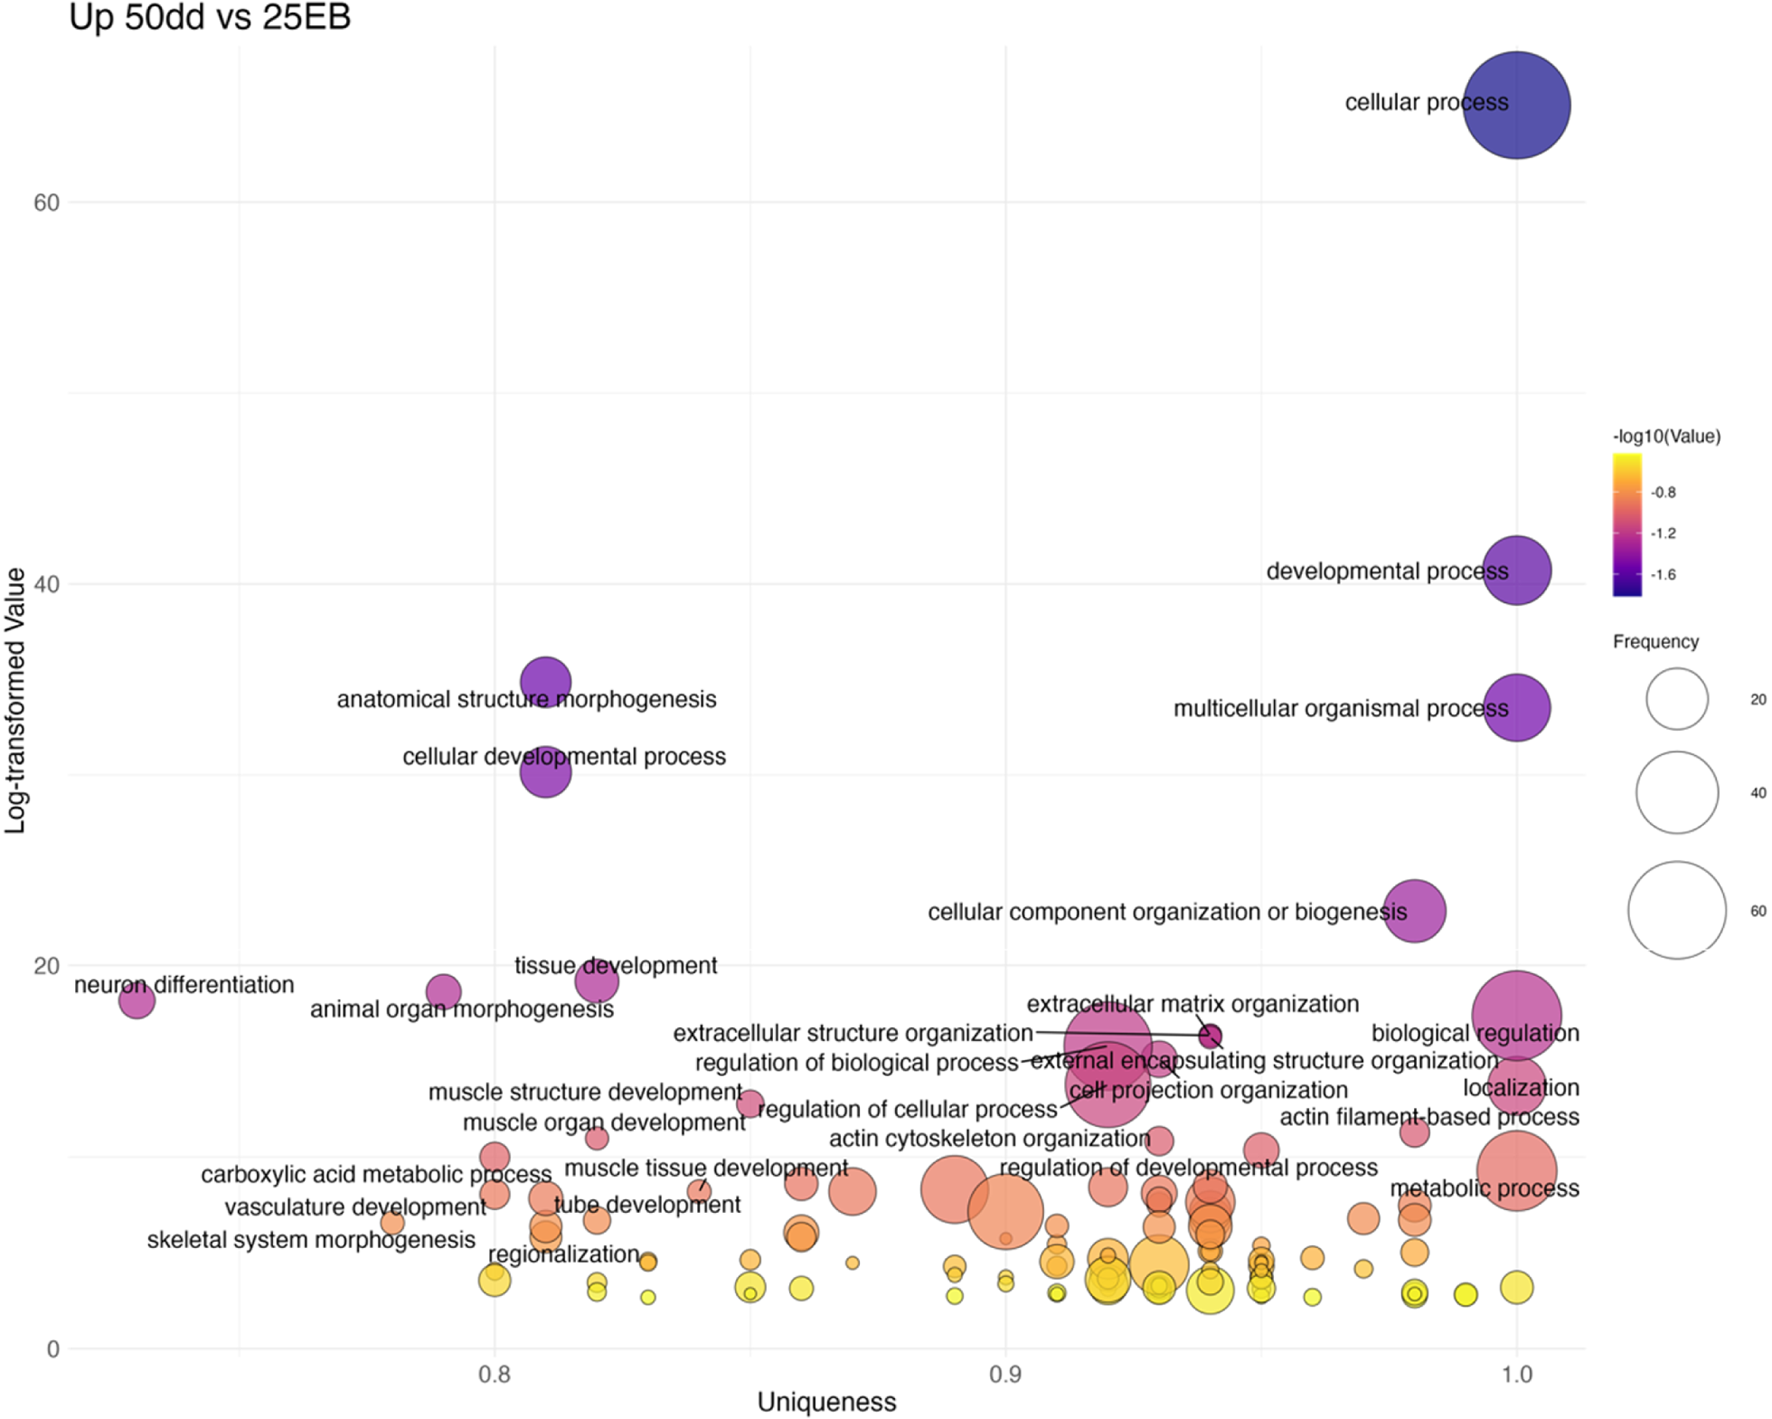
Bubble plot of non-redundant GO terms with higher expression in 50dd stage eggs compared to 25 EB stage eggs of Atlantic halibut (Hippoglossus hippoglossus). Frequency refers to the number of genes with signficant changes in expression, associated with each GO term, uniqueness assesses how distinct a term is in relation to the entire list, based on semantic comparison. Terms with higher uniqueness values are typically less likely to be redundant or dispensable. Log-transformed values are reversed p-values, where larger values indicate higher significance. 25EB = 25% epiboly, 50 dd = 50° day stage.
3.3 Overrepresentation of key developmental GO terms
No developmental GO terms were significantly overrepresented before MBT (UF→8C, 8C→16C). From the 16C→BL transition onward, broad developmental categories such as embryonic morphogenesis, embryo development, and pattern specification process became significantly overrepresented and remained overrepresented through gastrulation. Canonical signaling pathways including Wnt, Notch, and BMP were specifically overrepresented in the 16C→BL and BL→25 EB transitions, coinciding with the onset of zygotic transcription. By 50 dd, developmental GO terms were no longer significantly overrepresented, consistent with a shift toward later differentiation programs. Of the curated developmental genes analyzed in Section 3.3, 18 mapped directly to these GO terms (Table 2), linking pathway-level changes to individual gene dynamics.
TABLE 2
| GO term | Associated genes |
|---|---|
| GO:0007368 - determination of left/right symmetry | bmp2b, chrd, fgf8a, fgfr2, foxh1, spaw, tbxta, wnt11 |
| GO:0007498 - mesoderm development | bmp2b, dact2, fgf8a, fgfr1a, fgfr1b, fgfr2, foxh1, spaw, tbxta |
| GO:0016055 - Wnt signaling pathway | ctnnb1, dact2, sfrp2l, tbxta, tcf3a, tcf3b, vangl2, wnt11, wnt8b |
| GO:0030510 - regulation of BMP signaling pathway | bmp2b, chrd, smad4a, tbxta |
Developmental Gene Ontology (GO) terms and their associated Atlantic halibut (Hippoglossus hippoglossus) gene sets used for gene set enrichment analysis (GSEA). Each term represents a curated developmental process, with associated genes extracted from the Atlantic halibut (Hippoglossus hippoglossus) dataset based on zebrafish orthologs.
3.4 Genes with known developmental function in vertebrate embryonic development
In contrast to the genome-wide GO overrepresentation analysis in Section 3.1, we next focused on stage-wise expression trajectories for two canonical developmental gene sets, dorso–ventral (D–V) and anterior–posterior (A–P) axis regulators, curated from the literature (Table 1; Figure 10). Across these genes we observed three recurrent temporal profiles: (i) UF→16C biased (“maternal”) expression followed by decline after MBT, (ii) activation at BL and/or 25% EB (MBT/early gastrulation), and (iii) biphasic patterns with BL activation, a dip at 25% EB, and reactivation toward 50 dd. These trajectories mirror the GO results (Section 3.1), where early patterning terms rise at BL/25% EB and differentiation terms dominate by 50 dd.
FIGURE 10
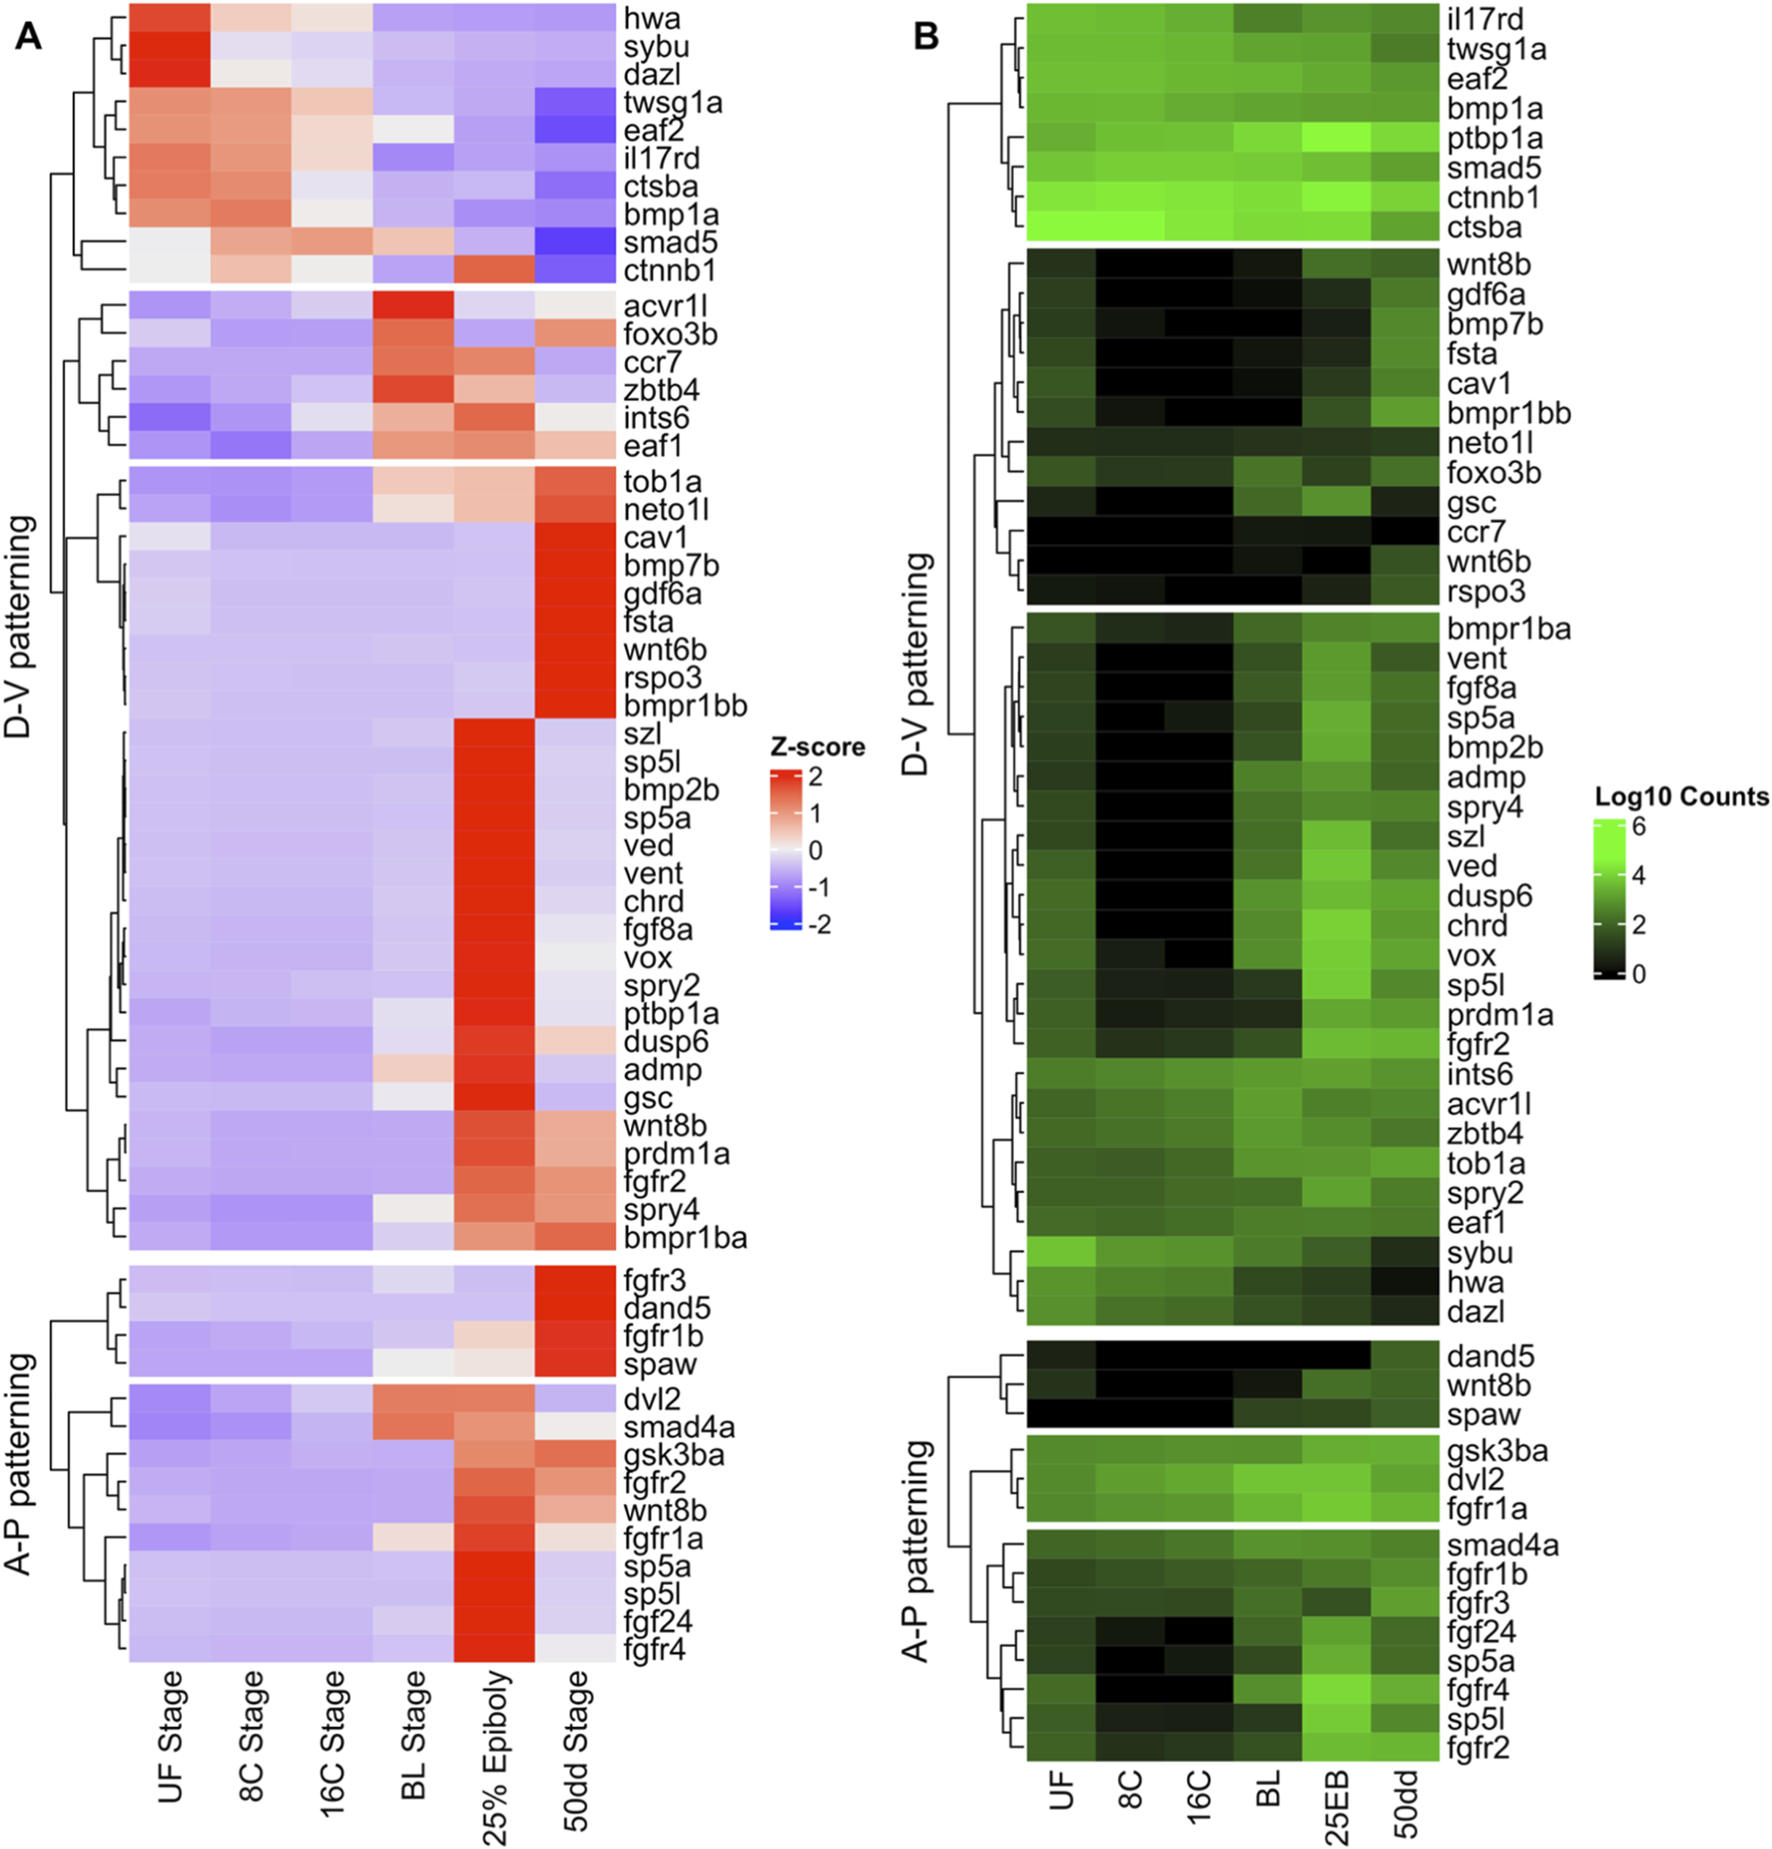
Differential expression of developmental genes during Atlantic halibut (Hippoglossus hippoglossus) embryonic development. (A) Z-score–transformed normalized gene counts for each sample. A positive Z-score indicates high expression relative to stages with lower Z-scores, illustrating transcriptional differences across developmental stages. (B) Log10-transformed normalized counts demonstrating each gene’s expression magnitude relative to other genes. D–V patterning genes function in the establishment of the dorso–ventral axis, while A–P patterning genes control determination of the anterior–posterior axis and left/right asymmetry. UF = unfertilized eggs; 8C = eight-cell stage; 16C = sixteen-cell stage; BL = blastula stage; 25 EB = 25% epiboly; 50 dd = 50-degree-day stage (blastopore closure).
3.4.1 Dorso-ventral patterning
Many D–V regulators (e.g., ctnnb1, hwa, sybu) are highly expressed in unfertilized eggs and cleavage-stage embryos and decline after MBT, consistent with maternal provisioning (Figure 10A). A larger group (e.g., bmp2b, sp5a, chrd, fgf8a) is low pre-MBT but switches on at BL/25% EB, reflecting zygotic activation of morphogenetic signaling. A smaller subset (e.g., wnt8b, prdm1a) shows biphasic behavior, activation at BL, attenuation at 25% EB, and renewed expression at 50 dd, suggesting later roles during differentiation. Overall, D–V specification appears to be initiated by maternal factors and reinforced by zygotic BMP/FGF/Wnt cascades after MBT (Figures 10A,B).
3.4.2 Anterior-posterior patterning
In contrast, most A–P regulators were transcriptionally silent before MBT and were activated only at BL (e.g., sp5a, sp5l, wnt8b, fgf24). Some, such as dvl2 and smad4a, peaked at BL and persisted into 25 EB, while others (e.g., fgfr3, spaw) were activated only later at 50 dd. This indicates that A–P axis establishment in halibut is primarily a zygotic process, initiated during MBT and refined through gastrulation into later organogenesis (Figures 10A,B).
3.5 Maternal-zygotic dynamics of key developmental regulators
Atlantic halibut orthologs of the zebrafish zygotic genome activators nanog, pou5f3 (pou5f1), and the SoxB1 genes (sox19b, sox2, sox3) showed distinct maternal versus zygotic expression profiles across the six developmental stages (Supplementary Figure S1; Supplementary Table S5). nanog was highly abundant in unfertilized eggs and declined from blastula onwards, whereas pou5f3 and sox19b were strongly expressed maternally and remained elevated through blastula and 25% epiboly before decreasing at 50 dd. sox3 maintained stable high expression throughout development. In contrast, sox2 showed low expression in unfertilized and cleavage-stage embryos and increased strongly from blastula to 50 dd, consistent with zygotic activation.
To place these dynamics in a broader developmental context, we examined maternal versus zygotic expression patterns for the 58 developmental patterning genes included in Table 1; Figure 10. Of these, 62% were classified as zygotically activated (low expression in unfertilized eggs with strong induction post-MBT), 14% showed both maternal provisioning and zygotic enhancement, and 21% were primarily maternally provided. Peak-expression timing showed a similar trend: 84% of genes reached maximal expression at or after the mid-blastula transition (BL, 25 EB, or 50dd), with nearly half (48%) peaking at 25% epiboly.
4 Discussion
Transcriptomic analysis of Atlantic halibut eggs is a valuable tool for identifying biological processes, single genes, and gene sets responsible for critical developmental events such as localization, body axis formation, and patterning of the developing embryo. This study provides the first comprehensive transcriptomic overview of early embryonic development in Atlantic halibut, addressing the previously unexplored temporal expression patterns of genes involved in these processes. These findings provide essential reference points for transcriptomic comparisons, such as in egg quality studies, by helping researchers select the developmental stages in which genes linked to poor phenotypes exhibit their highest activity.
Our analysis revealed distinct phases of transcriptional activity across early halibut development. Between UF and 16C, only limited transcriptional differences were observed, consistent with the dominance of maternal transcripts during early cleavage divisions (Lee et al., 2013; Vesterlund et al., 2011). Some developmental GO terms appeared higher in UF eggs, possibly reflecting ovarian fluid contamination or maternal transcripts associated with ongoing oogenesis, as reported in salmonids (Guzmán et al., 2014).
The most dramatic changes occurred during the 16C→BL transition, corresponding to the mid-blastula transition (MBT). At this stage, PCA revealed the largest spread among samples. This likely reflects both the rapid and heterogeneous transcriptional reprogramming that occurs during MBT and the practical difficulty of perfectly synchronizing sampling at this fast-changing stage, where small timing differences can translate into large transcriptomic differences. Canonical developmental pathways such as Wnt (GO:0016055), Notch (GO:0007219), and BMP signaling (GO:0030510) were strongly overrepresented, together with broad categories such as embryo development (GO:0009790) and embryonic morphogenesis (GO:0048598). This shift reflects the onset of zygotic genome activation (MZT) and is consistent with studies in zebrafish and other vertebrates showing sharp transcriptional activation at MBT (Kane and Kimmel, 1993; Vastenhouw et al., 2019).
From BL→25 EB, gastrulation was accompanied by overrepresentation of additional developmental processes such as pattern specification (GO:0007389), mesoderm development (GO:0007498), and left/right symmetry (GO:0007368), in line with morphogenetic reorganization of the embryo (Feldman et al., 1998). By the 25 EB→50 dd transition, transcriptional activity shifted toward later differentiation processes, including neuron differentiation (GO:0030182), muscle structure development (GO:0061061), and cranial skeletal development (GO:1904888), consistent with the onset of organogenesis after gastrulation in teleosts and lineage-specific maturation programs (Keenan and Currie, 2019). Collectively, these results show that while maternal transcripts support cleavage divisions, the decisive transcriptional engagement of axis and patterning programs is zygotically driven from MBT onwards.
The temporal profiles of zygotic genome activators and developmental patterning genes highlight the central role of the mid-blastula transition in Atlantic halibut development. Halibut orthologs of nanog, pou5f3, and several SoxB1 factors showed expression dynamics broadly consistent with zebrafish (Lee et al., 2013), with strong maternal provisioning and maintenance through early gastrulation, whereas sox2 was predominantly zygotically activated, indicating functional divergence within the SoxB1 family. In zebrafish, large-scale surveys have classified transcripts into maternal, zygotic, and maternal-zygotic categories and tracked their decay or activation across the MZT (Baia Amaral et al., 2024; Harvey et al., 2013). Although our focus here is not to mechanistically assign transcript origin, but rather to determine when key developmental regulators become transcriptionally active in Atlantic halibut, the timing we observe, where most patterning genes rise sharply after the mid-blastula transition, is broadly consistent with these generalized dynamics. Across the 58 developmental patterning genes examined, 84 percent reached peak expression at or after the blastula stage, and 62 percent showed clear zygotic activation rather than maternal provisioning. This predominance of zygotic control helps explain why unfertilized-egg transcriptomes provide limited insight into developmental competence: most genes that pattern the embryo are not yet transcriptionally engaged, reinforcing that post-MBT stages represent the biologically informative window for assessing early developmental potential in Atlantic halibut.
Analysis of curated developmental genes further clarified the timing of axis specification. Maternal expression of ctnnb1, hwa, and sybu supported early dorsal organizer formation, consistent with Wnt/β-catenin–driven dorsalization in zebrafish (Kelly et al., 2000; Nojima et al., 2010; Yan et al., 2018). However, most DV and AP regulators, including bmp2b, wnt8b, fgf8a, sp5a, and sp5l, were transcriptionally silent before MBT and sharply upregulated at BL, highlighting that axis establishment is primarily a zygotic process (Challa and Chatti, 2013; Langdon and Mullins, 2011; Weidinger et al., 2005). A few later-expressed genes (spaw, dand5) marked the onset of left–right asymmetry at 50 dd (Hashimoto et al., 2004; Long et al., 2003). Taken together, these dynamics indicate a conserved division of labor where a handful of maternal Wnt regulators initiate dorsal identity, but zygotic activation of Wnt, BMP, FGF, and Notch cascades drives the establishment of DV and AP axes and organizes gastrulation movements. This echoes findings in zebrafish and other teleosts, underscoring the evolutionary conservation of MZT as the true onset of developmental patterning (Dorey and Amaya, 2010; Fürthauer et al., 2004).
Many aquaculture studies of egg quality have relied on transcriptomic or proteomic comparisons of unfertilized or very early cleavage-stage eggs (Bonnet et al., 2007; Mommens et al., 2010; Mommens et al., 2014; Yilmaz et al., 2022; Żarski et al., 2017). While these approaches have identified differences in maternal transcript or protein abundance, our data show that the core developmental programs governing axis formation and morphogenesis are not yet active at these stages. Instead, the decisive transcriptional activity begins at MBT and gastrulation. This conclusion aligns with findings in channel catfish, where Myers et al. (2020) tracked gene expression across multiple developmental stages and reported that differences between good- and poor-quality eggs were minimal in unfertilized and cleavage stages but became pronounced at neurulation (48 hpf). These results and the present study highlight that transcriptomic signatures of egg quality may only emerge at specific developmental transitions, rather than at the earliest stages.
While large-scale transcriptional activation in Atlantic halibut begins during the MBT, maternal transcripts likely exert important preparatory roles that influence how zygotic programs unfold. Maternal factors are known to shape early chromatin landscapes and establish transcriptional competence prior to zygotic genome activation, for example, through chromatin remodeling and pioneer factor activity (Gentsch et al., 2019; Hontelez et al., 2015). In other vertebrates, maternally deposited enzymes such as histone demethylases and other epigenetic regulators also contribute to proper reprogramming of the embryonic genome (Ancelin et al., 2016). Such maternal provisioning may therefore pattern the molecular environment that enables robust zygotic activation. From an applied perspective, this suggests that while later developmental stages offer clearer transcriptomic signatures for assessing egg or embryo quality, variation in maternal inputs could still influence these outcomes indirectly through early epigenetic or regulatory priming.
5 Conclusion
This study provides a stage-resolved transcriptomic overview of early Atlantic halibut development, from unfertilized eggs through blastopore closure. We identified critical temporal expression patterns and stage-specific activation of canonical developmental pathways, including Wnt, BMP, and FGF signaling, which underlie axis formation, germ layer specification, and morphogenetic reorganization. Maternal transcripts dominated cleavage stages and contributed to dorsal organizer establishment, but the decisive activation of body axis and patterning programs occurred after the mid-blastula transition. These findings underscore that transcriptomic differences relevant to egg quality may not be detectable in unfertilized or very early cleavage stages but instead emerge during and after MBT, when the embryo assumes transcriptional control. By resolving when key developmental programs are active, this dataset provides a reference framework for future egg quality studies and highlights candidate windows where transcriptomic biomarkers of embryonic competence and deformity risk could be most informative. While our study provides comprehensive temporal resolution of transcript abundance, spatial localization data through techniques such as RNA in situ hybridization would further validate regional expression of axis patterning genes. Future studies combining this transcriptomic baseline with spatial techniques would provide a complete picture of halibut embryonic patterning.
Statements
Data availability statement
The data presented in the study are deposited in the BioStudies repository, accession number E-MTAB-15858.
Ethics statement
Ethical approval was not required for the studies involving animals in accordance with the local legislation and institutional requirements because Fertilized eggs are developmental stages outside the scope of the Guidelines of the European Union on the protection of animals used for scientific purposes (Directive 2010/63/EU), and approval from the Norwegian Food Safety Authority was not needed. Broodstock handling was performed as part of common hatchery practise. Written informed consent was not required because fertilized eggs are developmental stages outside the scope of the EU Directive 2010/63/EU on the protection of animals used for scientific purposes. Therefore, ethical approval and owner consent were not applicable.
Author contributions
NN: Supervision, Writing – review and editing, Writing – original draft, Formal Analysis, Visualization, Investigation, Conceptualization. FB: Writing – review and editing, Investigation, Data curation. LB: Project administration, Writing – review and editing, Funding acquisition. JT: Writing – review and editing. EK: Supervision, Funding acquisition, Writing – review and editing, Conceptualization, Writing – original draft.
Funding
The authors declare that financial support was received for the research and/or publication of this article. This work and PhD scholarship were fully funded by the Research Council of Norway (project “Juvenile production in Atlantic halibut aquaculture” project number: 281802), Nordic Halibut AS, Norway and NTNU. NTNU funded a 5-month salary grant to N. N., due to delays during the COVID-19 restrictions. The authors declare that this study received funding from Nordic Halibut AS. The funder was not involved in the study design, collection, analysis, interpretation of data, the writing of this article, or the decision to submit it for publication.
Acknowledgments
We would like to thank Nordic Halibut AS in Midsund, Norway, for accommodating the authors’ research stay, for allowing access to the facilities and for providing technical support whenever needed. Further acknowledgement goes to Tora Bardal (Department of Biology, NTNU) for her support and technical expertise.
Conflict of interest
Author LB was employed by the company Nordic Halibut AS.
The remaining authors declare that the research was conducted in the absence of any commercial or financial relationships that could be construed as a potential conflict of interest.
Generative AI statement
The authors declare that Generative AI was used in the creation of this manuscript. The authors used ChatGPT 5 (OpenAI) to assist with language and readability editing during manuscript preparation. All content was reviewed, verified, and edited by the authors, who take full responsibility for the accuracy and integrity of the manuscript.
Any alternative text (alt text) provided alongside figures in this article has been generated by Frontiers with the support of artificial intelligence and reasonable efforts have been made to ensure accuracy, including review by the authors wherever possible. If you identify any issues, please contact us.
Publisher’s note
All claims expressed in this article are solely those of the authors and do not necessarily represent those of their affiliated organizations, or those of the publisher, the editors and the reviewers. Any product that may be evaluated in this article, or claim that may be made by its manufacturer, is not guaranteed or endorsed by the publisher.
Supplementary material
The Supplementary Material for this article can be found online at: https://www.frontiersin.org/articles/10.3389/fcell.2025.1723170/full#supplementary-material
References
1
Ancelin K. Syx L. Borensztein M. Ranisavljevic N. Vassilev I. Briseno-Roa L. et al (2016). Maternal LSD1/KDM1A is an essential regulator of chromatin and transcription landscapes during zygotic genome activation. Elife5, e08851. 10.7554/eLife.08851
2
Anders S. Pyl P. T. Huber W. (2015). HTSeq—a python framework to work with high-throughput sequencing data. Bioinformatics31 (2), 166–169. 10.1093/bioinformatics/btu638
3
Andrews S. (2010). “FastQC: a quality control tool for high throughput sequence data,” in Babraham bioinformatics (Cambridge, United Kingdom: Babraham Institute).
4
Baia Amaral D. Egidy R. Perera A. Bazzini A. A. (2024). miR-430 regulates zygotic mRNA during zebrafish embryogenesis. Genome Biol.25 (1), 74. 10.1186/s13059-024-03197-8
5
Bauer H. Lele Z. Rauch G.-J. Geisler R. Hammerschmidt M. (2001). The type I serine/threonine kinase receptor Alk8/Lost-a-fin is required for Bmp2b/7 signal transduction during dorsoventral patterning of the zebrafish embryo. Development128 (6), 849–858. 10.1242/dev.128.6.849
6
Benjamini Y. Hochberg Y. (1995). Controlling the false discovery rate: a practical and powerful approach to multiple testing. J. R. Statistical Society Series B Methodol.57 (1), 289–300. 10.1111/j.2517-6161.1995.tb02031.x
7
Bolger A. M. Lohse M. Usadel B. (2014). Trimmomatic: a flexible trimmer for illumina sequence data. Bioinformatics30 (15), 2114–2120. 10.1093/bioinformatics/btu170
8
Bonnet E. Fostier A. Bobe J. (2007). Microarray-based analysis of fish egg quality after natural or controlled ovulation. BMC Genomics8, 55. 10.1186/1471-2164-8-55
9
Brown N. P. (2010). “Halibut aquaculture in North America,” in Practical flatfish culture and stock enhancement, 1–29.
10
Challa A. K. Chatti K. (2013). Conservation and early expression of zebrafish tyrosine kinases support the utility of zebrafish as a model for tyrosine kinase biology. Zebrafish10 (3), 264–274. 10.1089/zeb.2012.0781
11
Connors S. A. Trout J. Ekker M. Mullins M. C. (1999). The role of tolloid/mini fin in dorsoventral pattern formation of the zebrafish embryo. Development126 (14), 3119–3130. 10.1242/dev.126.14.3119
12
Dick A. Hild M. Bauer H. Imai Y. Maifeld H. Schier A. F. et al (2000). Essential role of Bmp7 (snailhouse) and its prodomain in dorsoventral patterning of the zebrafish embryo. Development127 (2), 343–354. 10.1242/dev.127.2.343
13
Dorey K. Amaya E. (2010). FGF signalling: diverse roles during early vertebrate embryogenesis. Development137 (22), 3731–3742. 10.1242/dev.037689
14
Draper B. W. Stock D. W. Kimmel C. B. (2003). Zebrafish fgf24 functions with fgf8 to promote posterior mesodermal development, 130, 4639, 4654. 10.1242/dev.00671
15
Duan Y. Zhang Q. Jiang Y. Zhang W. Cheng Y. Shi M. et al (2022). Dynamic transcriptional landscape of grass carp (Ctenopharyngodon idella) reveals key transcriptional features involved in fish development. Int. Journal Molecular Sciences23 (19), 11547. 10.3390/ijms231911547
16
Engelsen R. Asche F. Skjennum F. Adoff G. (2004). New species in aquaculture: some basic economic aspects. Cult. Cold‐Water Mar. Fish, 487–515. 10.1002/9780470995617.ch12
17
Erter C. E. Wilm T. P. Basler N. Wright C. V. Solnica-Krezel L. (2001). Wnt8 is required in lateral mesendodermal precursors for neural posteriorization in vivo, 128, 3571, 3583. 10.1242/dev.128.18.3571
18
FAO (2023). “Global aquaculture production 1950-2020 (FishStatJ),” in FAO Fisheries and Aquaculture Division [online] (Rome: Fishery and Aquaculture Statistics). Available online at: www.fao.org/fishery/statistics/software/fishstatj/en.
19
Fu J. Zhu W. Wang L. Luo M. Song F. Dong Z. (2019). Dynamic transcriptome sequencing and analysis during early development in the bighead carp (Hypophthalmichthys nobilis). BMC Genomics20 (1), 781. 10.1186/s12864-019-6181-4
20
Fuentes R. Tajer B. Kobayashi M. Pelliccia J. L. Langdon Y. Abrams E. W. et al (2020). The maternal coordinate system: Molecular-genetics of embryonic axis formation and patterning in the zebrafish. Curr. Top. Dev. Biol.140, 341–389. 10.1016/bs.ctdb.2020.05.002
21
Fürthauer M. Lin W. Ang S.-L. Thisse B. Thisse C. (2002). Sef is a feedback-induced antagonist of Ras/MAPK-mediated FGF signalling. Nat. Cell Biology4 (2), 170–174. 10.1038/ncb750
22
Fürthauer M. Reifers F. Brand M. Thisse B. Thisse C. (2001). sprouty4 acts in vivo as a feedback-induced antagonist of FGF signaling in zebrafish, 128, 2175, 2186. 10.1242/dev.128.12.2175
23
Fürthauer M. Van Celst J. Thisse C. Thisse B. (2004). Fgf signalling controls the dorsoventral patterning of the zebrafish embryo, 131, 2853, 2864. 10.1242/dev.01156
24
Gentsch G. E. Spruce T. Owens N. D. Smith J. C. (2019). Maternal pluripotency factors initiate extensive chromatin remodelling to predefine first response to inductive signals. Nat. Communications10 (1), 4269. 10.1038/s41467-019-12263-w
25
Gilbert S. F. Michael M. J. F. (2019). Developmental biology. 12th ed.Sunderland, MA: Sinauer Associates (Oxford University Press).
26
Gu Z. (2022). Complex heatmap visualization. Imeta1 (3), e43. 10.1002/imt2.43
27
Guzmán J. M. Luckenbach J. A. Yamamoto Y. Swanson P. (2014). Expression profiles of fsh-regulated ovarian genes during oogenesis in coho salmon. PLoS One9 (12), e114176. 10.1371/journal.pone.0114176
28
Harvey S. A. Sealy I. Kettleborough R. Fenyes F. White R. Stemple D. et al (2013). Identification of the zebrafish maternal and paternal transcriptomes. Development140 (13), 2703–2710. 10.1242/dev.095091
29
Hashimoto H. Rebagliati M. Ahmad N. Muraoka O. Kurokawa T. Hibi M. et al (2004). The Cerberus/Dan-family protein Charon is a negative regulator of Nodal signaling during left-right patterning in zebrafish, 131, 1741, 1753. 10.1242/dev.01070
30
Hata A. Chen Y.-G. (2016). TGF-β signaling from receptors to Smads. Cold Spring Harb. Perspectives Biology8 (9), a022061. 10.1101/cshperspect.a022061
31
Hild M. Dick A. Rauch G.-J. Meier A. Bouwmeester T. Haffter P. et al (1999). The smad5 mutation somitabun blocks Bmp2b signaling during early dorsoventral patterning of the zebrafish embryo. Development126 (10), 2149–2159. 10.1242/dev.126.10.2149
32
Hill C. S. (2016). Transcriptional control by the SMADs. Cold Spring Harb. Perspectives Biology8 (10), a022079. 10.1101/cshperspect.a022079
33
Hino H. Nakanishi A. Seki R. Aoki T. Yamaha E. Kawahara A. et al (2018). Roles of maternal wnt8a transcripts in axis formation in zebrafish. Dev. Biology434 (1), 96–107. 10.1016/j.ydbio.2017.11.016
34
Hontelez S. Van Kruijsbergen I. Georgiou G. Van Heeringen S. J. Bogdanovic O. Lister R. et al (2015). Embryonic transcription is controlled by maternally defined chromatin state. Nat. Communications6 (1), 10148. 10.1038/ncomms10148
35
Imai Y. Gates M. A. Melby A. E. Kimelman D. Schier A. F. Talbot W. S. (2001). The homeobox genes vox and vent are redundant repressors of dorsal fates in zebrafish, 128, 2407, 2420. 10.1242/dev.128.12.2407
36
Joore J. Fasciana C. Speksnijder J. E. Kruijer W. Destrée O. H. van den Eijnden-van A. J. et al (1996). Regulation of the zebrafish goosecoid promoter by mesoderm inducing factors and Xwnt1. Mech. Development55 (1), 3–18. 10.1016/0925-4773(95)00481-5
37
Kane D. A. Kimmel C. B. (1993). The zebrafish midblastula transition. Development119 (2), 447–456. 10.1242/dev.119.2.447
38
Kapp L. D. Abrams E. W. Marlow F. L. Mullins M. C. (2013). The integrator complex subunit 6 (Ints6) confines the dorsal organizer in vertebrate embryogenesis. Plos Genet.9 (10), e1003822. 10.1371/journal.pgen.1003822
39
Kawahara A. Wilm T. Solnica‐Krezel L. Dawid I. B. (2000). Functional interaction of vega2 and goosecoid homeobox genes in zebrafish. Genesis28 (2), 58–67. 10.1002/1526-968x(200010)28:2<58::aid-gene30>3.0.co;2-n
40
Keenan S. R. Currie P. D. (2019). The developmental phases of zebrafish myogenesis. J. Developmental Biology7 (2), 12. 10.3390/jdb7020012
41
Kelly C. Chin A. J. Leatherman J. L. Weinberg E. S. (2000). Maternally controlled β-catenin-mediated signaling is required for organizer formation in the zebrafish. Development127 (18), 3899–3911. 10.1242/dev.127.18.3899
42
Kim D. Pertea G. Trapnell C. Pimentel H. Kelley R. Salzberg S. L. (2013). TopHat2: accurate alignment of transcriptomes in the presence of insertions, deletions and gene fusions. Genome Biol.14 (4), R36. 10.1186/gb-2013-14-4-r36
43
Kishimoto Y. Lee K.-H. Zon L. Hammerschmidt M. Schulte-Merker S. (1997). The molecular nature of zebrafish swirl: BMP2 function is essential during early dorsoventral patterning. Development124 (22), 4457–4466. 10.1242/dev.124.22.4457
44
Kuo C.-L. Lam C. M. Hewitt J. E. Scotting P. J. (2013). Formation of the embryonic organizer is restricted by the competitive influences of Fgf signaling and the SoxB1 transcription factors. PLoS One8 (2), e57698. 10.1371/journal.pone.0057698
45
Langdon Y. G. Mullins M. C. (2011). Maternal and zygotic control of zebrafish dorsoventral axial patterning. Annu. Review Genetics45, 357–377. 10.1146/annurev-genet-110410-132517
46
Langdon Y. G. Fuentes R. Zhang H. Abrams E. W. Marlow F. L. Mullins M. C. (2016). Split top: a maternal cathepsin B that regulates dorsoventral patterning and morphogenesis. Development143 (6), 1016–1028. 10.1242/dev.128900
47
Lee M. T. Bonneau A. R. Takacs C. M. Bazzini A. A. DiVito K. R. Fleming E. S. et al (2013). Nanog, Pou5f1 and SoxB1 activate zygotic gene expression during the maternal-to-zygotic transition. Nature503 (7476), 360–364. 10.1038/nature12632
48
Lee M. T. Bonneau A. R. Giraldez A. J. (2014). Zygotic genome activation during the maternal-to-zygotic transition. Annu. Review Cell Developmental Biology30 (1), 581–613. 10.1146/annurev-cellbio-100913-013027
49
Lekven A. C. Thorpe C. J. Waxman J. S. Moon R. T. (2001). Zebrafish wnt8 encodes two wnt8 proteins on a bicistronic transcript and is required for mesoderm and neurectoderm patterning. Dev. Cell1 (1), 103–114. 10.1016/s1534-5807(01)00007-7
50
Lele Z. Nowak M. Hammerschmidt M. (2001). Zebrafish admp is required to restrict the size of the organizer and to promote posterior and ventral development. Dev. Dynamics An Official Publication Am. Assoc. Anatomists222 (4), 681–687. 10.1002/dvdy.1222
51
Lewis L. M. Lall S. P. Witten P. E. (2004). Morphological descriptions of the early stages of spine and vertebral development in hatchery-reared larval and juvenile Atlantic halibut (Hippoglossus hippoglossus). Aquaculture241 (1-4), 47–59. 10.1016/j.aquaculture.2004.08.018
52
Li H. Handsaker B. Wysoker A. Fennell T. Ruan J. Homer N. et al (2009). The sequence alignment/map format and SAMtools. Bioinformatics25 (16), 2078–2079. 10.1093/bioinformatics/btp352
53
Li Y. Li Q. Long Y. Cui Z. (2011). Lzts2 regulates embryonic cell movements and dorsoventral patterning through interaction with and export of nuclear β-catenin in zebrafish. J. Biol. Chem.286 (52), 45116–45130. 10.1074/jbc.M111.267328
54
Little S. C. Mullins M. C. (2004). Twisted gastrulation promotes BMP signaling in zebrafish dorsal-ventral axial patterning, 131, 5825–5835. 10.1242/dev.01464
55
Little S. C. Mullins M. C. (2009). Bone morphogenetic protein heterodimers assemble heteromeric type I receptor complexes to pattern the dorsoventral axis. Nat. Cell Biology11 (5), 637–643. 10.1038/ncb1870
56
Liu J.-X. Xu Q.-H. Yu X. Zhang T. Xie X. Ouyang G. (2018). Eaf1 and Eaf2 mediate zebrafish dorsal-ventral axis patterning via suppressing Wnt/β-Catenin activity. Int. J. Biol. Sci.14 (7), 705–716. 10.7150/ijbs.18997
57
Long S. Ahmad N. Rebagliati M. (2003). The zebrafish nodal-related gene southpaw is required for visceral and diencephalic left-right asymmetry, 130, 2303–2316. 10.1242/dev.00436
58
Love M. Anders S. Huber W. (2014). Differential analysis of count data–the DESeq2 package. Genome Biol.15 (550), 10–1186. 10.1186/s13059-014-0550-8
59
Maegawa S. Varga M. Weinberg E. S. (2006). FGF signaling is required for β-catenin-mediated induction of the zebrafish organizer, 133, 3265, 3276. 10.1242/dev.02483
60
Martyn U. Schulte-Merker S. (2003). The ventralized ogon mutant phenotype is caused by a mutation in the zebrafish homologue of Sizzled, a secreted Frizzled-related protein. Dev. Biology260 (1), 58–67. 10.1016/s0012-1606(03)00221-5
61
Mei W. Lee K. W. Marlow F. L. Miller A. L. Mullins M. C. (2009). hnRNP I is required to generate the Ca2+ signal that causes egg activation in zebrafish. Development136 (17), 3007–3017. 10.1242/dev.037879
62
Mintzer K. A. Lee M. A. Runke G. Trout J. Whitman M. Mullins M. C. (2001). Lost-a-fin encodes a type I BMP receptor, Alk8, acting maternally and zygotically in dorsoventral pattern formation. Development128 (6), 859–869. 10.1242/dev.128.6.859
63
Mo S. Wang L. Li Q. Li J. Li Y. Thannickal V. J. et al (2010). Caveolin-1 regulates dorsoventral patterning through direct interaction with β-catenin in zebrafish. Dev. Biology344 (1), 210–223. 10.1016/j.ydbio.2010.04.033
64
Mommens M. Fernandes J. M. Bizuayehu T. T. Bolla S. L. Johnston I. A. Babiak I. (2010). Maternal gene expression in Atlantic halibut (Hippoglossus hippoglossus L.) and its relation to egg quality. BMC Research Notes3 (1), 138. 10.1186/1756-0500-3-138
65
Mommens M. Fernandes J. M. Tollefsen K. E. Johnston I. A. Babiak I. (2014). Profiling of the embryonic Atlantic halibut (Hippoglossus hippoglossus L.) transcriptome reveals maternal transcripts as potential markers of embryo quality. BMC Genomics15 (1), 829. 10.1186/1471-2164-15-829
66
Mullins M. C. Hammerschmidt M. Kane D. A. Odenthal J. Brand M. Van Eeden F. et al (1996). Genes establishing dorsoventral pattern formation in the zebrafish embryo: the ventral specifying genes. Development123 (1), 81–93. 10.1242/dev.123.1.81
67
Myers J. N. Dyce P. W. Chatakondi N. G. Gorman S. A. Quiniou S. M. Su B. et al (2020). Analysis of specific mRNA gene expression profiles as markers of egg and embryo quality for hybrid catfish aquaculture. Comp. Biochem. Physiology Part A Mol. and Integr. Physiology243, 110675. 10.1016/j.cbpa.2020.110675
68
Niepagen N. Vidal M. F. Berg L. Kjørsvik E. (2025). Egg quality markers in domesticated broodstock of Atlantic halibut (Hippoglossus hippoglossus) with relevance for optimization of hatchery protocols. Front. Aquac.4, 1673217. 10.3389/faquc.2025.1673217
69
Nojima H. Shimizu T. Kim C.-H. Yabe T. Bae Y.-K. Muraoka O. et al (2004). Genetic evidence for involvement of maternally derived Wnt canonical signaling in dorsal determination in zebrafish. Mech. Development121 (4), 371–386. 10.1016/j.mod.2004.02.003
70
Nojima H. Rothhämel S. Shimizu T. Kim C.-H. Yonemura S. Marlow F. L. et al (2010). Syntabulin, a motor protein linker, controls dorsal determination. Development137 (6), 923–933. 10.1242/dev.046425
71
Ramel M.-C. Lekven A. C. (2004). Repression of the vertebrate organizer by Wnt8 is mediated by Vent and Vox, 131, 3991, 4000. 10.1242/dev.01277
72
Reifers F. Böhli H. Walsh E. C. Crossley P. H. Stainier D. Y. Brand M. (1998). Fgf8 is mutated in zebrafish acerebellar (ace) mutants and is required for maintenance of midbrain-hindbrain boundary development and somitogenesis. Development125 (13), 2381–2395. 10.1242/dev.125.13.2381
73
Rohner N. Bercsényi M. Orbán L. Kolanczyk M. E. Linke D. Brand M. et al (2009). Duplication of fgfr1 permits fgf signaling to serve as a target for selection during domestication. Curr. Biol.19 (19), 1642–1647. 10.1016/j.cub.2009.07.065
74
Rong X. Chen C. Zhou P. Zhou Y. Li Y. Lu L. et al (2014). R-spondin 3 regulates dorsoventral and anteroposterior patterning by antagonizing Wnt/β-catenin signaling in zebrafish embryos. PLoS One9 (6), e99514. 10.1371/journal.pone.0099514
75
Schier A. F. Talbot W. S. (2005). Molecular genetics of axis formation in zebrafish. Annu. Rev. Genet.39, 561–613. 10.1146/annurev.genet.37.110801.143752
76
Schmid B. Fürthauer M. Connors S. A. Trout J. Thisse B. Thisse C. et al (2000). Equivalent genetic roles for bmp7/snailhouse and bmp2b/swirl in dorsoventral pattern formation. Development127, 957–967. 10.1242/dev.127.5.957
77
Schneider P. N. Slusarski D. C. Houston D. W. (2012). Differential role of Axin RGS domain function in Wnt signaling during anteroposterior patterning and maternal axis formation. PLoS One7, e44096. 10.1371/journal.pone.0044096
78
Schulte-Merker S. Lee K. J. McMahon A. P. Hammerschmidt M. (1997). The zebrafish organizer requires chordino. Nature387 (6636), 862–863. 10.1038/43092
79
Shimizu T. Yamanaka Y. Nojima H. Yabe T. Hibi M. Hirano T. (2002). A novel repressor-type homeobox gene, ved, is involved in dharma/bozozok-mediated dorsal organizer formation in zebrafish. Mech. Development118 (1-2), 125–138. 10.1016/s0925-4773(02)00243-5
80
Shinya M. Eschbach C. Clark M. Lehrach H. Furutani-Seiki M. (2000). Zebrafish Dkk1, induced by the pre-MBT Wnt signaling, is secreted from the prechordal plate and patterns the anterior neural plate. Mech. Development98 (1-2), 3–17. 10.1016/s0925-4773(00)00433-0
81
Sidi S. Goutel C. Peyriéras N. Rosa F. M. (2003). Maternal induction of ventral fate by zebrafish radar. Proc. Natl. Acad. Sci.100 (6), 3315–3320. 10.1073/pnas.0530115100
82
Smith K. A. Noël E. Thurlings I. Rehmann H. Chocron S. Bakkers J. (2011). Bmp and nodal independently regulate lefty1 expression to maintain unilateral nodal activity during left-right axis specification in zebrafish. Plos Genet.7 (9), e1002289. 10.1371/journal.pgen.1002289
83
Stephens M. (2017). False discovery rates: a new deal. Biostatistics18 (2), 275–294. 10.1093/biostatistics/kxw041
84
Supek F. Bošnjak M. Škunca N. Šmuc T. (2011). REVIGO summarizes and visualizes long lists of gene ontology terms. PLoS One6 (7), e21800. 10.1371/journal.pone.0021800
85
Tsang M. Friesel R. Kudoh T. Dawid I. B. (2002). Identification of Sef, a novel modulator of FGF signalling. Nat. Cell Biology4 (2), 165–169. 10.1038/ncb749
86
Tsang M. Maegawa S. Kiang A. Habas R. Weinberg E. Dawid I. B. (2004). A role for MKP3 in axial patterning of the zebrafish embryo, 131, 2769, 2779. 10.1242/dev.01157
87
Valenti F. Ibetti J. Komiya Y. Baxter M. Lucchese A. M. Derstine L. et al (2015). The increase in maternal expression of axin1 and axin2 contribute to the zebrafish mutant ichabod ventralized phenotype. J. Cellular Biochemistry116 (3), 418–430. 10.1002/jcb.24993
88
Van Eeden F. Granato M. Schach U. Brand M. Furutani-Seiki M. Haffter P. et al (1996). Genetic analysis of fin formation in the zebrafish, Danio rerio. Development123 (1), 255–262. 10.1242/dev.123.1.255
89
Vastenhouw N. L. Cao W. X. Lipshitz H. D. (2019). The maternal-to-zygotic transition revisited. Development146 (11), dev161471. 10.1242/dev.161471
90
Vesterlund L. Jiao H. Unneberg P. Hovatta O. Kere J. (2011). The zebrafish transcriptome during early development. BMC Developmental Biology11, 30. 10.1186/1471-213x-11-30
91
Weidinger G. Thorpe C. J. Wuennenberg-Stapleton K. Ngai J. Moon R. T. (2005). The Sp1-related transcription factors sp5 and sp5-like act downstream of Wnt/beta-catenin signaling in mesoderm and neuroectoderm patterning. Curr. Biology15 (6), 489–500. 10.1016/j.cub.2005.01.041
92
Welch E. Pelegri F. (2015). Cortical depth and differential transport of vegetally localized dorsal and germ line determinants in the zebrafish embryo. Bioarchitecture5 (1-2), 13–26. 10.1080/19490992.2015.1080891
93
White R. J. Collins J. E. Sealy I. M. Wali N. Dooley C. M. Digby Z. et al (2017). A high-resolution mRNA expression time course of embryonic development in zebrafish. Elife6, e30860. 10.7554/eLife.30860
94
Willot V. Mathieu J. Lu Y. Schmid B. Sidi S. Yan Y.-L. et al (2002). Cooperative action of ADMP-and BMP-mediated pathways in regulating cell fates in the zebrafish gastrula. Dev. Biology241 (1), 59–78. 10.1006/dbio.2001.0494
95
Wilm T. P. Solnica-Krezel L. (2005). Essential roles of a zebrafish prdm1/blimp1 homolog in embryo patterning and organogenesis, 132, 393–404. 10.1242/dev.01572
96
Wu S.-Y. Shin J. Sepich D. S. Solnica-Krezel L. (2012). Chemokine GPCR signaling inhibits β-catenin during zebrafish axis formation. PLoS Biol.10, e1001403. 10.1371/journal.pbio.1001403
97
Xiao T. Roeser T. Staub W. Baier H. (2005). A GFP-based genetic screen reveals mutations that disrupt the architecture of the zebrafish retinotectal projection, 132, 2955, 2967. 10.1242/dev.01861
98
Xie X.-w. Liu J.-X. Hu B. Xiao W. (2011). Zebrafish foxo3b negatively regulates canonical Wnt signaling to affect early embryogenesis. PLoS One6 (9), e24469. 10.1371/journal.pone.0024469
99
Xing Y.-Y. Cheng X.-N. Li Y.-L. Zhang C. Saquet A. Liu Y.-Y. et al (2018). Mutational analysis of dishevelled genes in zebrafish reveals distinct functions in embryonic patterning and gastrulation cell movements. Plos Genet.14 (8), e1007551. 10.1371/journal.pgen.1007551
100
Xiong B. Rui Y. Zhang M. Shi K. Jia S. Tian T. et al (2006). Tob1 controls dorsal development of zebrafish embryos by antagonizing maternal β-catenin transcriptional activity. Dev. Cell11 (2), 225–238. 10.1016/j.devcel.2006.06.012
101
Yabe T. Shimizu T. Muraoka O. Bae Y.-K. Hirata T. Nojima H. et al (2003). Ogon/Secreted Frizzled functions as a negative feedback regulator of Bmp signaling, 130, 2705–2716. 10.1242/dev.00506
102
Yan L. Chen J. Zhu X. Sun J. Wu X. Shen W. et al (2018). Maternal Huluwa dictates the embryonic body axis through β-catenin in vertebrates. Science362 (6417), eaat1045. 10.1126/science.aat1045
103
Yao S. Qian M. Deng S. Xie L. Yang H. Xiao C. et al (2010). Kzp controls canonical Wnt8 signaling to modulate dorsoventral patterning during zebrafish gastrulation. J. Biol. Chem.285 (53), 42086–42096. 10.1074/jbc.M110.161554
104
Yilmaz O. Jensen A. M. Harboe T. Mogster M. Jensen R. M. Mjaavatten O. et al (2022). Quantitative proteome profiling reveals molecular hallmarks of egg quality in Atlantic halibut: impairments of transcription and protein folding impede protein and energy homeostasis during early development. BMC Genomics23 (1), 635. 10.1186/s12864-022-08859-0
105
Żarski D. Nguyen T. Le Cam A. Montfort J. Dutto G. Vidal M. O. et al (2017). Transcriptomic profiling of egg quality in sea bass (Dicentrarchus labrax) sheds light on genes involved in ubiquitination and translation. Mar. Biotechnol.19, 102–115. 10.1007/s10126-017-9732-1
106
Zinski J. Tajer B. Mullins M. C. (2018). TGF-β family signaling in early vertebrate development. Cold Spring Harb. Perspectives Biology10 (6), a033274. 10.1101/cshperspect.a033274
Summary
Keywords
atlantic halibut, embryonic development, transcriptomics, egg quality, maternal zygotic transition
Citation
Niepagen N, Bertolini F, Berg L, Tomkiewicz J and Kjørsvik E (2025) Maternal provisioning and zygotic activation: transcriptomic dynamics of early atlantic halibut (Hippoglossus hippoglossus) embryogenesis. Front. Cell Dev. Biol. 13:1723170. doi: 10.3389/fcell.2025.1723170
Received
11 October 2025
Revised
15 November 2025
Accepted
20 November 2025
Published
08 December 2025
Volume
13 - 2025
Edited by
Michael Schubert, UMR7009 Laboratoire de Biologie du Développement de Villefranche sur Mer, France
Reviewed by
Fei Fang, Michigan State University, United States
Gopal Kushawah, Stowers Institute for Medical Research, United States
Updates
Copyright
© 2025 Niepagen, Bertolini, Berg, Tomkiewicz and Kjørsvik.
This is an open-access article distributed under the terms of the Creative Commons Attribution License (CC BY). The use, distribution or reproduction in other forums is permitted, provided the original author(s) and the copyright owner(s) are credited and that the original publication in this journal is cited, in accordance with accepted academic practice. No use, distribution or reproduction is permitted which does not comply with these terms.
*Correspondence: Nils Niepagen, nils.niepagen@ntnu.no
Disclaimer
All claims expressed in this article are solely those of the authors and do not necessarily represent those of their affiliated organizations, or those of the publisher, the editors and the reviewers. Any product that may be evaluated in this article or claim that may be made by its manufacturer is not guaranteed or endorsed by the publisher.