 Tao Shi1,2
 Yuanjian Yang
- 1Meteorological Service Centre, Wuhu Meteorological Bureau, Wuhu, China
- 2Key Laboratory of Atmospheric Sciences and Satellite Remote Sensing of Anhui Province, Anhui Institute of Meteorological Sciences, Hefei, China
- 3Collaborative Innovation Centre on Forecast and Evaluation of Meteorological Disasters, School of Atmospheric Physics, Nanjing University of Information Science and Technology, Nanjing, China
It is important to quantify changes in the local meteorological observational environment (MOE) around weather stations if we are to obtain accurate assessments of the regional warming of the surface air temperature (SAT) in relation to urbanization bias. Current studies often use two-dimensional parameters (e.g., the land surface temperature, land use/land cover and the normalized difference vegetation index) to characterize the local MOE. Most of the existing models of the relationship between urbanization bias in SAT series and MOE parameters are linear regression models, which ignore the non-linear driving effect of MOE changes on SAT series. By contrast, there is a lack of three-dimensional parameters in the characterization of the morphological features of the MOE. Changes in the MOE related to urbanization lead to uncertainties in the contribution of SAT series on different scales and we need to introduce vertical structure indexes to enrich the three-dimensional spatial morphology of MOE parameters. The non-linear response of urbanization bias in SAT series to three-dimensional changes in the MOE and its scale dependence should be explored by coupling computational fluid dynamics model simulations with machine learning.
Introduction
The meteorological observational environment (MOE) around weather stations is fundamental to the accurate and continuous recording of the meteorological elements used for disaster prevention and mitigation, economic development, public health decision-making and climate change adaptation (Ren et al., 2007, 2015; Luo and Lau, 2018, 2019; Zheng et al., 2021). The MOE of stations changes with rapid urbanization, which leads to inhomogeneities in the surface air temperature (SAT) series (Li, 2011; Yan et al., 2014; Cao et al., 2016; Du et al., 2020). For example, local changes in the microclimate immediately surrounding the thermometer shelter mean that the temperature records of poorly exposed stations are likely to contain non-climate biases that are not representative of the climate in the surrounding area (Davey and Pielke, 2005; Yilmaz et al., 2008). We refer to these non-climate biases as urbanization bias (Zhang, 2009; Connolly and Connolly, 2014). Urbanization bias has become an important cause of systematic bias in the SAT in China, leading to uncertainties in regional and even global climate change predictions (Mahmood et al., 2006; Ren et al., 2017; Tysa et al., 2019; Wen et al., 2019). Quantitative analysis of the effects of environmental change on urbanization bias in the SAT is fundamental work at the forefront of climate change research.
According to the World Meteorological Organization, the observational biases caused by changes and disruptions in the MOE are usually greater than instrumental errors and may even completely drown out signals of climate change (Watts, 2009). The impact of changes in the local MOE related to urbanization bias on the SAT should therefore be quantified in large-scale studies of climate change (Brohan et al., 2006; Zhang, 2009; Soon et al., 2018). The spatial morphological characteristics of the MOE around a weather station are important in driving urbanization bias in the SAT (Erell et al., 2011; Shi et al., 2021). Previous studies have attempted to quantify the contribution of this urbanization bias to regional warming by using the results from surface stations (Jones et al., 2007; Menne et al., 2010; Ren et al., 2010a; Fall et al., 2011; Stewart and Oke, 2012; Estoque et al., 2017; Scarano and Mancini, 2017), although this is still controversial as a result of uncertainties in quantifying the impact of the MOE on urbanization bias.
This paper summarizes and reviews recent progress in the characterization of the spatial morphology of the MOE, the relationship between changes in the MOE and the urbanization bias in SAT series, and considers future research directions.
Research Progress on the Characterization of the Spatial Morphology of the MOE
An undisturbed MOE with long-term stability is required to obtain valuable, continuous, uniform and accurate observational data. Quantitative representation of the spatial morphology of the local MOE around weather stations is an important prerequisite in studies of urbanization bias. Figure 1 shows that weather stations are usually sited far away from cities in the early stages of station construction and therefore their observed temperature series represents the local climate background (Figure 1A). The representation of the MOE continues to be damaged as urban sprawl encroaches the weather station (Figure 1B). The thermal properties of the underlying surface are changed by the addition of impervious surfaces and buildings around the station (Figure 1B) and the built-up area warms faster than the natural underlying surface under the same amount of solar radiation (Ren, 2015; Yang and Bou-Zeid, 2019).
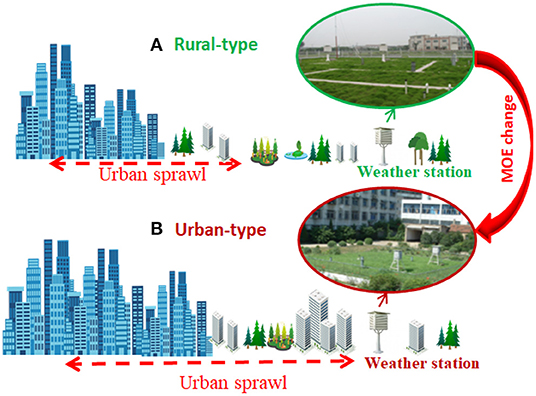
Figure 1. Schematic diagram of urbanization-induced changes in the local MOE. (A) Rural environment and (B) environment affected by urban sprawl.
Further, we take the Hefei station in eastern China as an example to discuss the changes of MOE from 1979 to 2018. Figure 2 gives the distribution of land use within the 20-km buffer zone around the center of Hefei (Shi et al., 2021). In the last 40 years, the built-up area within 20 km of Hefei in 2018 is about 20 times larger than that in 1979, leading to the continuous deterioration of MOE. In 1979, the Hefei station was relocated to the outskirts of the city (Figure 2A). As time went by, the residential and industrial land around the observation site was increasing, and by 1998 the urban sprawl had affected the MOE of Hefei station (Figure 2C). As a result, the site was relocated to the suburban area in 2004 (Figure 2D). 2018, when the MOE of the site was again destroyed (Figure 2F).
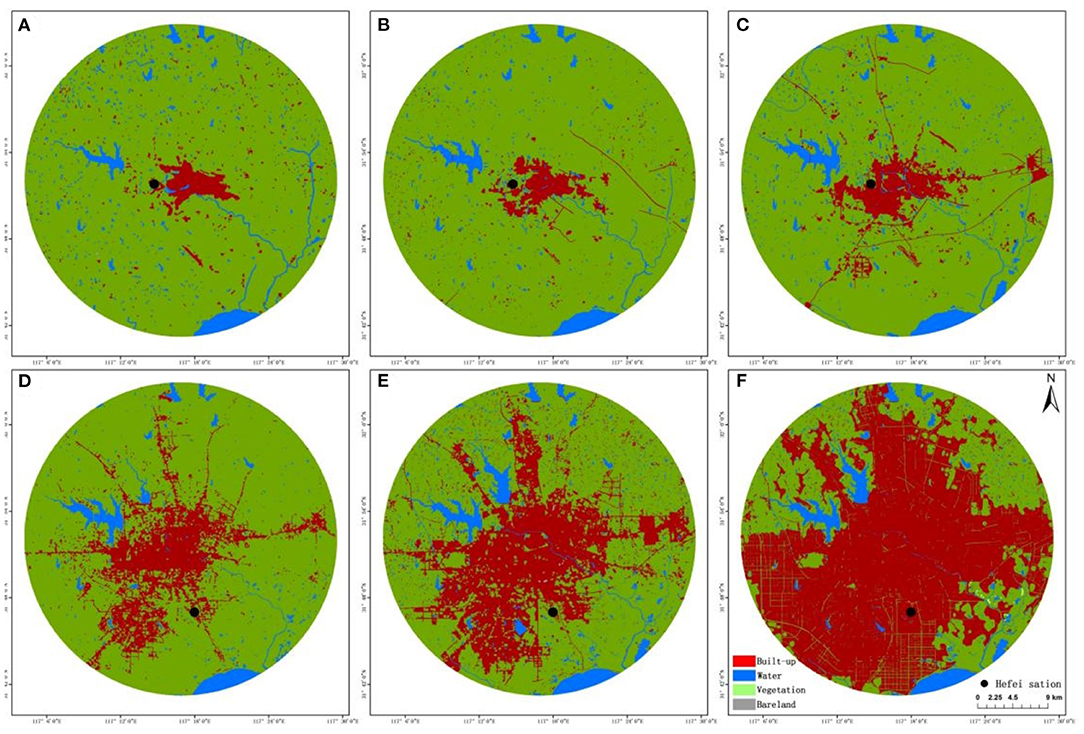
Figure 2. Land use of Hefei city in the 20-km buffer zone and the location of Hefei station: (A) 1979; (B) 1987; (C) 1998; (D) 2004; (E) 2009; (F) 2018 (this figure was cited from Shi et al., 2021).
In addition, anthropogenic heat released from boilers, air conditioners and motor vehicles within the city is transferred via the urban boundary layer (Zhang et al., 2016, 2021; Yang et al., 2020a). The pollutants emitted exacerbate the urban heat island effect at night through the interaction of aerosols with solar radiation (Zheng et al., 2018). Greater air pollution can generate more intense nocturnal heat islands, for example, Yang et al. (2020b) suggested that the UHII at the time of daily maximum/minimum temperature (UHIImax/UHIImin) exhibits a decreasing/increasing tendency as PM2.5 concentration increases, causing a continuous decrease in the diurnal temperature range (DTR), and these effects are mediated via aerosol-radiation interaction (aerosol-cloud interaction) under clear-sky (cloudy) condition.
Characterization Indexes of the Two-Dimensional Morphology of the MOE
Microclimate observation networks and high-density automated meteorological observation networks have been used to study the changing characteristics of meteorological observation sequences and to analyze the extent to which the MOE is affected by urbanization (Stewart and Oke, 2012; Liu et al., 2013). However, these methods are not suitable for large-scale use as a result of their high impact on natural conditions and social activities and the relatively high cost of construction and maintenance. The use of satellite data to study the representation of the MOE has become more common with the rapid development of remote sensing technology (Ren et al., 2010b; Ren and Ren, 2011; Yang et al., 2013; Li Y. et al., 2015; Shi et al., 2015, 2021). Satellite remote sensing data cover a wide area and are periodic; they can therefore provide multi-temporal and large-scale information for the study of dynamic changes in the MOE. Computer image processing and pattern recognition technology can be used to effectively reproduce historical information about environmental changes, such as land use/cover types around a weather station (Yang et al., 2013; Zhang, 2014; Li Y. et al., 2015; Shi et al., 2021).
Many studies have used horizontal parameters [e.g., the land surface temperature (LST), land use/land cover (LULC), impervious surface area (ISA), the normalized difference vegetation index and the night-time light intensity] in the remote sensing monitoring and simulation of the MOE (Gallo et al., 1993; Imhoff et al., 1997, 2010; Schneider et al., 2009; Yang et al., 2011b,c, 2013; Yang X. et al., 2019; Li et al., 2021; Yu et al., 2021). For instance, Yang et al. (2011a) classified the urban and rural types of stations in different buffer areas by using night light intensity data in eastern China. Li Y. et al. (2015) found that stations can be regarded as rural type when the area ratio of the high-temperature in the 2-km buffer zone is <30%. Luo and Lau (2019) used land use/land cover to classify stations as urban and rural types to explore the urban dry island effect. In addition, a strong positive correlation between percentage of ISA and LST suggests that percentage of ISA can quantitatively describe the spatial distribution and temporal variation of urban thermal patterns/and associated LULC and UHI intensity changes (Weng et al., 2011; Zhang et al., 2019).
The anthropogenic heat flux is closely related to changes in the built-up area around stations (Yang X. et al., 2019; Yang et al., 2020a; Chen G. et al., 2021; Zhang et al., 2021) and can reliably reflect the effects of both anthropogenic emissions and changes in land use related to the latent heat flux and the sensible heat flux. A characterization system of the MOE (the surface thermal environment class and the anthropogenic heat flux) centered on the thermal environment around a station has been developed based on remote sensing images and geographical information systems technology (Shi et al., 2015; Yang X. et al., 2019; Yang et al., 2020a,b; Zhang et al., 2021). This system solves the problem of the quantitative characterization of the influence of anthropogenic heat emissions on the SAT series under the effects of turbulent and horizontal advection.
However, the two-dimensional morphological indexes are limited to a single scientific discipline, which may not completely characterize the MOE and its impacts on observation. For example, in 2013, the national meteorological observational station in Anqing was surrounded by a high-density built-up area (Figure 3A), and the built-up area ratio within a of 5-km radius buffer zone around station can reach 71.3%. Anqing station was therefore moved 12.5 km to the northwest of the old station, with an elevation difference of 6.0 m. Within a radius of 5 km, the proportion of buildings around the station decreased to 15.4%, and the MOE assessment score increased from 75 to 95 (MOE assessment conducted by the meteorological administration can be scored by 0–100, the high the score is, the better the MOE is). However, when comparing the synchronous observational data, we found that the daily average temperature of the new station was higher than that of the old station for 348 days after relocation and the annual average temperature was 0.76°C higher than that of the old station with a warming of 4.4% (Figure 3B). According to the current remote sensing assessment method, the MOE of the relocated Anqing station is greatly improved, but the SAT series is more significantly influenced by urbanization. Although the urban area within the MOE was significantly reduced after relocation, the new buildings to the east and northwest of the station were much taller than the old buildings. The structural layout of the planting, water bodies and buildings around the old station was well planned and effectively mitigated the impact of urbanization on the thermal environment around the station.
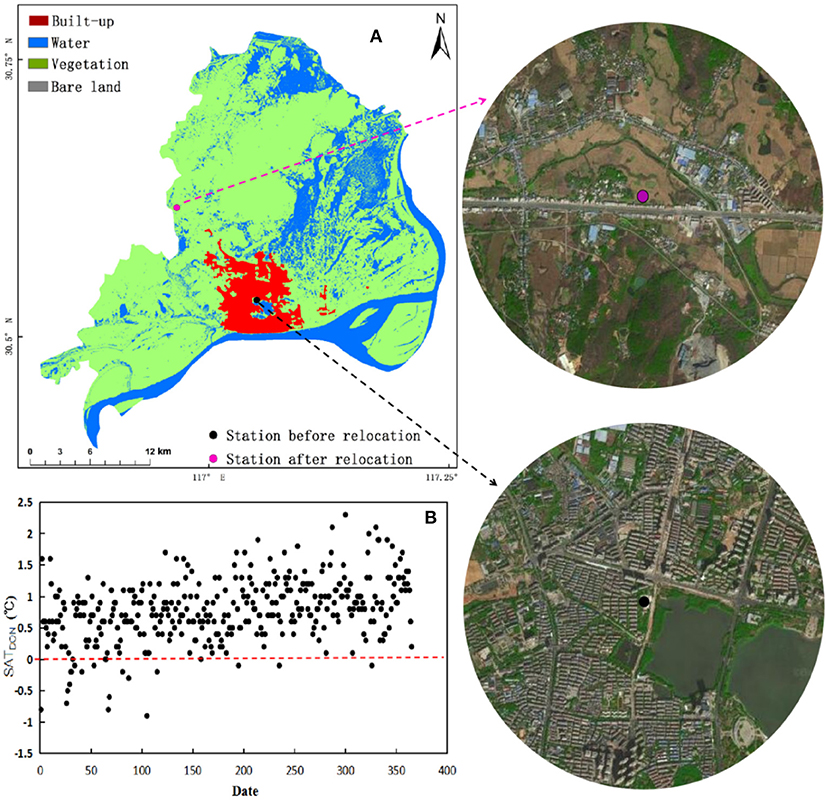
Figure 3. (A) Changes in the MOE before and after the relocation of Anqing station in 2013, (B) difference in daily-averaged surface air temperature between new and old location (SATDON) of Anqing station in 2013.
Three-Dimensional Morphological Index System for the MOE
The spatial morphology within the MOE can be divided into horizontal and vertical morphologies, where the vertical morphology is characterized using indexes related to the heights of buildings (Shi et al., 2021).
The vertical geometry of buildings has a much greater impact on the local microclimate than other factors (Oke, 2004). Changes in the three-dimensional MOE, which consists of the horizontal structure and vertical morphology of buildings, may have a pronounced effect on both the SAT series and high-temperature heat wave events (Luo and Lau, 2018; Ngarambe et al., 2020; Zong et al., 2021). Tian et al. (2019) showed that the ratio of vegetation to building volume showed a significant negative correlation with temperature. The sprawl of urban buildings within the vertical space around a station affects the surface energy balance and air flow on the local scale, leading to changes in the thermal environment (Wang et al., 2016). Particularly, the multi-reflections of sunlight among high-rise buildings are important as well to capture more solar radiation, which significantly increase the absorptivity of heat in the urban canopy to warm the urban (Ren, 2015), especially in the heat wave periods (Zong et al., 2021). Stewart and Oke (2012) defined the concept of a local climate zone using characteristic parameters (e.g., the sky view coefficient, the aspect ratio and the average building height). This is mainly applicable to urban heat island studies at large scales (Yang Y. et al., 2019; Zhang et al., 2019), whereas the micro-scale MOE cannot be finely depicted by a separate local climate zone unit.
Existing methods for three-dimensional morphological assessment of MOE are at an early stage and can not be ignored (Voogt and Oke, 2004; Davis et al., 2016; Zong et al., 2021). For instance, Davis et al. (2016) investigated the effect of three-dimensional morphology on nighttime air temperature at five spatial scales and found that building volume had the strongest ability to explain air temperature change within a 100 m radius from the meteorological stations. With the development of remote sensing and LiDAR technology, it is no longer difficult to obtain quantitative information on the vertical structure or height of the urban canopy (Amfield, 2003; Berger et al., 2013; Freitas et al., 2015; Yan et al., 2015; Jamei et al., 2016), which provides an important technical support for us to enrich and improve the three-dimensional morphological characterization index system of the MOE.
Influence of Spatial Patterns of the MOE on Urbanization Bias in SAT Series
The rapid urbanization seen in recent years has meant that many meteorological stations previously located on the outskirts of cities with good observational environments have gradually moved into urban centers or are now surrounded by built-up areas. This has created biases in the SAT series, which cannot be ignored to regional warming in China (Ren et al., 2017). Other possible factors affecting the variation of SAT series mainly include station relocation, instrument height change, upgraded observation instrument, observation time and frequency changes, statistical method change, and so on (Xu et al., 2013; Yan et al., 2014; Li L. et al., 2015; Soon et al., 2018; Shi et al., 2021).
Station Relocation, Observational Environment Change and Inhomogeneity in Urbanization Context
Station relocation significantly influence on observational environment change. Taking Hefei station in eastern China as example (Shi et al., 2021), due to the process of urbanization in recent years, Hefei station had been completely surrounded by built-up land before relocation, and the observational environment score of Hefei Station was only 63.2. Hefei station was relocated in 2018, which moved 30.2 km to the northwest of the old site, with an altitude difference of 6.0 m. The observation environment of Hefei station greatly improved, and the score increased to 99.3. As a result, it is obvious different that MOE factors (including land-use parameters, landscape parameters and geometric parameters) between the old and the new stations in the 5-km buffer zone (Shi et al., 2021). For instance, after relocation, area ration of built-up decreased from 42.17 to 4.23%; the mean fractal dimension of built-up declined to a certain extent; and distance between the station and the gravity center of various land of built-up increased from 0.53 km to 3.13 km.
Previous studies have shown that the errors caused by MOE changes and destructions are usually greater than the instrumental observation errors, which can completely submerge the signal of climate change (Gallo et al., 1996; Peterson, 2003; Vose and Menne, 2004; Soon et al., 2018; Zhang et al., 2021). For example, Peterson (2003) proposed that the micro-scale and local-scale environments have greater influence on the observation data of stations than the meso-scale environments. Taking temperature observation as an example, the local environment within a few hundred meters of the observation station will form an unusual “microclimate,” which cannot represent the environmental climate of the background area in which it is located. For another example, tall buildings and trees near the station will reduce sunlight, radiation and wind, and the temperature measured by the temperature station on the asphalt pavement will be higher than that on the soil and grass. Therefore, the temperature records of “hidden” sites with poor exposure include non-climatic biases caused by local “microclimate” changes, namely siting biases or inadequate station exposure biases (Connolly and Connolly, 2014). This kind of siting bias is a bit different from urbanization bias. That is, urbanization bias can impact the local climate in a wide range, while siting bias are strictly represented by the local microclimate in the area near the site. Similarly, both biases can be produced through regional modernization and urbanization. Therefore, these two biases can occur independently. For example, an urban site with a significant urbanization bias may have a good degree of environmental exposure, while a rural site that is not affected by the urbanization bias may have a siting bias due to insufficient environmental exposure (Davey and Pielke, 2005; Menne et al., 2010; Ren et al., 2015; Zhang et al., 2021). It can be seen that changes in meteorological elements are not only extremely sensitive to local MOE changes around the station but also to urbanization bias.
Generally speaking, in the past 30 years, with the rapid economy development and urbanization in China, MOE of national meteorological stations in mainland China has been seriously damaged, and a large number of stations have been forcedly and frequently relocated. Although the relocation of stations has improved the regional representation of meteorological observations, it has made the issue of non-uniformity of climate data in China increasingly prominent (Li et al., 2004, 2009; Yang et al., 2013; Yan et al., 2014). Therefore, the meteorological observation data adjusted by the homogenization should be employed to accurately reveal the facts of regional climate change in China (Li L. et al., 2015; Cao et al., 2016; Ren et al., 2017; Li et al., 2020).
Detection and Revision of Urbanization Bias
Current research on urbanization bias has focused on the detection and revision of inhomogeneities in the SAT series (Hansen et al., 2001; Fujibe, 2009; Xu et al., 2013; Yan et al., 2014; Li Q. et al., 2015). The reference station comparison method is often used to calculate urbanization bias. This method is used to select target stations and their surrounding reference stations for comparative analysis and uses the difference between them to characterize the degree of homogeneity of the SAT series affected by urbanization (Stewart and Oke, 2012; Liu et al., 2013). Fujibe (2009) divided the meteorological stations in Japan into six categories in terms of the population density within a certain radius around city stations and corrected the urbanization bias at the sites in the third to sixth categories using the first and second types of station as reference stations. Hansen et al. (2001) assumed a linear increase in urbanization warming over two time periods and then used this linear trend to revise the urbanization bias in the SAT series. Wen et al. (2019) used the difference in the SAT series trends between urban and reference stations as the total revised value and then divided this by the number of years in the time series to obtain the multi-year average urbanization bias.
However, the technical solutions for studying urbanization bias are not yet complete as a result of a lack of in-depth analysis of the drivers (Shi et al., 2021). Many studies have utilized the population density or city size as the criteria for classifying meteorological stations to explore urbanization bias (Bai and Ren, 2006; Liu, 2006; Ren et al., 2017; Soon et al., 2018), for example, Bai and Ren (2006) chose meteorological stations in a city with a population of more than 100,000 as urban stations, but Liu (2006) divided the stations in city with a population of more than 40,000 and the stations that were not described as “rural” into urban stations. In fact, it is difficult to find a pure reference station near the urban station as reference stations are inevitably affected by urbanization, especially in high-density urban agglomeration areas (Chao et al., 2020; Yang et al., 2020a), so the urbanization bias in the SAT series exhibit minimum estimation (Wen et al., 2019). In addition, some studies corrected SAT series based on the assumption that the urbanization bias increases linearly year on year (Hansen et al., 2001; Shi et al., 2021). However, the urbanization process at different times and in different regions is variable, so it is impossible to subdivide the specific degree of contribution of the urbanization bias to the SAT series on temporal and spatial scales. In particular, there are considerable differences in the mechanisms and magnitudes of the impact of urbanization on different temperature elements (Li et al., 2014) insofar as, despite the possibly limited contribution to regional warming (Chao et al., 2020), the impact of urbanization on extreme temperatures can usually be very large (Li and Huang, 2013; Li et al., 2014; Yang et al., 2017).
Table 1 shows that Hefei city developed relatively slowly before 2004, whereas the total GDP increased by $4.23 billion during the time period 2004–2018, with an average annual growth rate of 81.77%, ranking first in the economic growth rate of the Yangtze River Delta region. The proportion of built-up land around the station increased significantly after 2004, but the results obtained from traditional research methods show that the urbanization bias of Hefei station has remained consistent over the last three decades (multi-year average 0.0651°C/decade). The assumption that the urbanization bias increases linearly from year to year in the traditional approach is therefore questionable (Shi et al., 2021) and the contribution of the urbanization bias to the SAT series cannot be finely quantified in time and space. In addition, with urban sprawl, rural stations in suburban areas will also be gradually affected by urbanization and there is much uncertainty about whether rural reference stations can continuously represent the climate background of the area in which urban stations are located (Wang et al., 1990; Portman, 1993; Soon et al., 2018). This will require a lot of time and effort for the dynamic monitoring and evaluation of reference stations.

Table 1. Calculation results of urbanization bias of Hefei station based on the traditional linear trend method (cited from Shi et al., 2021).
Drivers of the Spatial Morphology of the MOE on Urbanization Bias in SAT Series
Current research methods on the relationship between the three-dimensional morphology and surface air temperature series are divided into two main categories (i.e., statistical modeling and numerical modeling).
Statistical modeling method includes correlation analysis and regression equations, where the independent variable is the morphological parameter and the dependent variable is the temperature series obtained from station observations. For instance, by using remote sensing technology, spatial datasets of land-use, landscape and geometric parameters of the underlying surface in the 5-km buffer zone around the station were established as the MOE factors, and the differences in these MOE factors (DOEFs) between the old and the new stations were calculated to indicate the change induced by urbanization (Shi et al., 2021). Then, multiple linear regression models of differences in site-relocation SAT series between the old and the new stations and DOEFs can be constructed, which could reveal clear contributions of the rapid and slow stages of the urbanization process and resultant environmental changes around the stations to the observed SAT (Shi et al., 2021). However, in reality, it is usually neglected that the complex non-linear driving effect of the influencing factors on the SAT series (Shashua and Hoffman, 2000). For instance, the shading effect of buildings within the micro-scale area of the station during the day may result in a lower SAT series than for stations with an open topography, whereas the longwave radiation from buildings at night may result in a higher SAT series (Liu et al., 2018). Wang et al. (2019) conducted a correlation analysis between information about obstacles within the MOE and the SAT series and showed that the spatial morphology of the MOE has a more complex and non-simple linear relationship with the SAT. These studies show that it is not possible to finely quantify the effects of the three-dimensional morphology of the MOE on urbanization bias through linear statistics.
Another approach is numerical modeling, in which numerical simulations are used to study the impact of changes in the MOE caused by urbanization on the meteorological observational elements (Zhang et al., 2002, 2016; Liu and Zhou, 2007; Yang et al., 2016; Chen, 2021; Chen G. et al., 2021; Yu et al., 2021). The simulations include physical equations and the laws of atmospheric radiation related to energy and mass and therefore explain the changes in terms of the mechanism of influence. These models are often used for scenario simulation—that is, different three-dimensional morphological scenarios are set and the climate parameters in each scenario are obtained by numerical model simulation. The impact of the three-dimensional morphology on the microclimate is then obtained by comparing the simulation results. Common numerical models include energy consumption models and regionalized models, such as the Weather Forecasting and Research, ENVI-met, computational fluid dynamics and EnergyPlus models (Liang et al., 2018). The simulation results often lack validation by fine-resolution observations.
Scale Dependence of the Response of the SAT Series to Changes in the MOE
An appropriate buffer scale is essential for studying the relationship between the SAT series and the three-dimensional morphological characteristics of the MOE. The contribution of the observational bias caused by environmental damage in the surrounding area to the regional climate change signal has large uncertainties at different scales. For example, Gallo et al. (1996) studied the effect of nine land cover types within three scaled buffers (circles with radii of 100, 1,000 and 10,000 m) around stations on the diurnal temperature range and concluded that urban land use types have a large effect on the local temperature. Peterson (2003) suggested that the micro-scale and local-scale environments have a greater impact on observations of meteorological elements than meso-scale environments. In eastern China, rapidly increasing urban sprawl impacted on the MOE, showing that the maximum range of influence affecting observational data under advection and turbulence transport conditions does not usually exceed 5 km (Ren and Ren, 2011; Tysa et al., 2019; Yang et al., 2020a; Zhang et al., 2021).
In the case of the SAT series, the local environment within a few hundred meters of stations can create an unusual microclimate that is not representative of the climate background of the region in which it is located. Other examples are nearby trees reducing the amount of sunlight and wind and stations located on asphalt roads observing a higher SAT than those located on soil and grass. It is therefore crucial to determine the sensitive area of the MOE around a station (Gallo et al., 1996; Peterson, 2003; Ren et al., 2010b; Stewart and Oke, 2012; Yang et al., 2013; Li Y. et al., 2015). Different response relationships are seen between the local microclimate and the urban spatial morphology at different scales (Chun and Guldmann, 2014; Chen et al., 2020), which may be related to the physical characteristics of the MOE (e.g., the block size, building density or infrastructure) and the background climate (Oke, 2004; Qian et al., 2018). While for regional-scale urbanization context, taking the Guangdong-Hong Kong-Macau region (GHMR) as case study, recent study show that the warming due to urbanization tends to be smaller as the spatial scale increases: the contribution to the local warming can reach as high as 50% in the metropolis, remains high (~25%) in GBA, and decreases to about 10% in GHMR (Chao et al., 2020). A lack of in-depth consideration of the dependence on spatial scale increases the uncertainty in the impact of changes in the MOE on the urbanization bias in SAT series.
Discussion
Two important scientific questions need to be addressed in current researches on the effects of changes in the MOE on urbanization bias: (1) how can we improve the characterization indexes of three-dimensional spatial morphology of MOE; and (2) how can we analyze the non-linear response of urbanization bias to the three-dimensional spatial morphology of the MOE and its scale dependence?
Characterization Indexes of Three-Dimensional Morphology of the MOE
Most studies only use the horizontal parameters of the MOE in remote sensing assessments and lack in-depth research on the internal structural layout. Landscape patterns (Figure 4) can be used to explore the relationship between structural land use layout and the local microclimate (Zhang et al., 2009; Meng et al., 2010; Estoque et al., 2017). For example, Meng et al. (2010) explored the thermal environmental effects of park landscape patches and road landscape corridors through landscape patch characterization. Ren (2015) used landscape metrics to analyze the configurations of urban vegetation to obtain the relationship between urban landscape distribution and the SAT. Tysa et al. (2019) showed that the effect of urbanization on the SAT series is closely related to the distance of the stations from the center of urban buildings. In general, the landscape pattern index, mainly including the largest patch index (LPI) and the mean fractal dimension, can fully consider the respective types, shapes, sizes, quantities and spatial combinations of different land uses, such as the perimeter–area ratios, the landscape shape indices, edge and patch densities, fragmentation and fractal dimensions. The larger the LPI value, the more obvious the advantage of this type of patch in the overall landscape. For an example of case studies in Hefei, the correlations between the changed air temperatures and the LPIs of built-up and water were 0.66 and −0.503, respectively, passing the 0.05-level significance test (Shi et al., 2021). These two landscape pattern indexes are important input variables for multiple linear regression models of the urbanization bias simulations in case studies of Hefei, and the error range of the model for simulated temperature difference related to MOE change was 7.01–18.37% with an average of 12.28% (Shi et al., 2021). Therefore, the introduction of the landscape pattern index can enrich the indexes in remote sensing studies of the MOE and quantify the degree of response of each meteorological element to the configuration structure of different land use types.
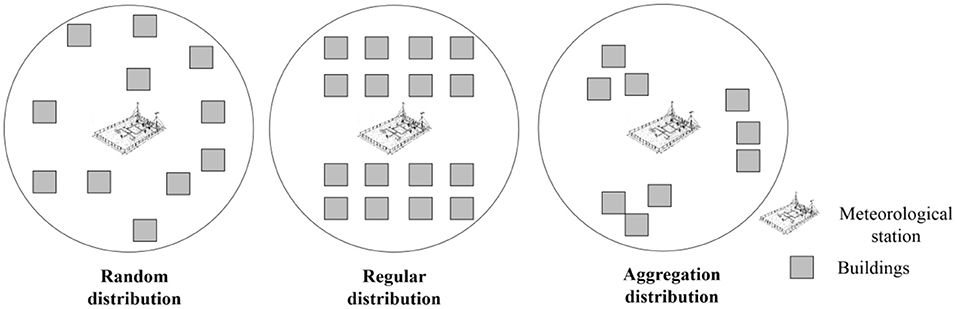
Figure 4. Schematic diagram of urban landscape patterns around weather stations (cited from Shi et al., 2021).
The impact of urban sprawl on the MOE is not only reflected horizontally, but also vertically as an important part of the spatial structure (Figure 5). Indexes such as the sky visual factor (SVF), the block height to width ratio (BHWR), the floor area ratio (FAR), and Vegetation volume to building volume (VV2BV) are often used to depict vertical morphology within cities (Figure 5), which are expected to provide scientific assessments for the MOE changes and their effects on urban thermal environments (Chen G. et al., 2021; Chen X. et al., 2021). In detail, the SVF is the ratio of the area of sky visible at a fixed point on the surface to the total visible area (Oke et al., 1991) and the BHWR is defined as the ratio between the average building height within a street canyon and the width of the canyon (Oke, 1988). FAR and SVF are two important parameters for characterizing the geometry, density and heat balance of urban areas, in addition to generating and controlling the heat island effect (Svensson, 2004; Chen et al., 2020; Chen G. et al., 2021). The BHWR and VV2BV are two important indicators for characterizing the microscopic three-dimensional morphology and play key roles in radiation balance and outdoor thermal environment studies (Shashua and Hoffman, 2000; Chen, 2021).
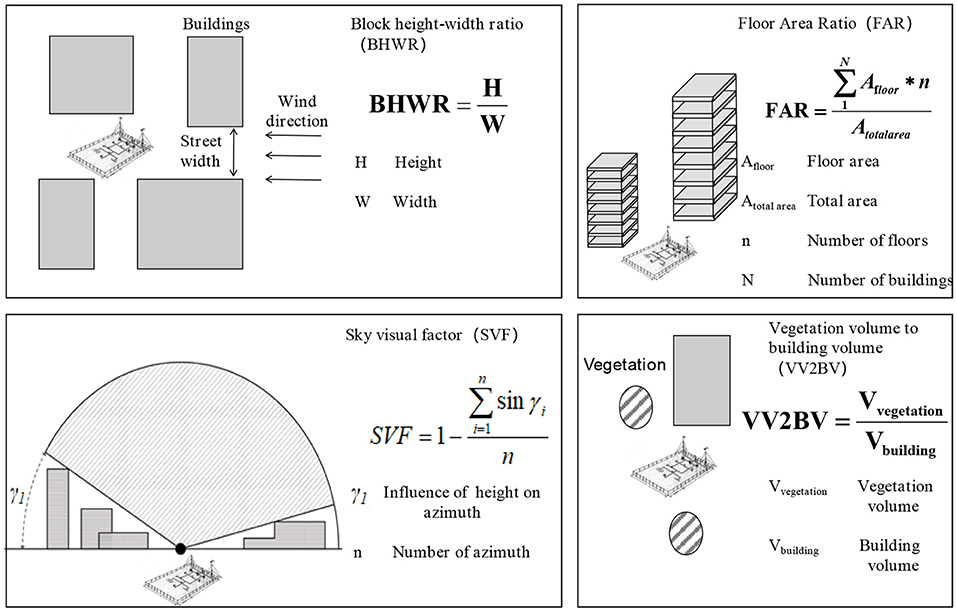
Figure 5. Schematic diagram of the vertical morphology of the MOE around a weather station.
The subsurface metadata of buildings, trees, roads and water bodies in the station buffer zone that affect the MOE can be established by field measurements and remote sensing, allowing us to retrieve parameters (e.g., the anthropogenic heat flux, land surface temperature and enhanced vegetation index) in the area around the station. Landscape pattern software (Fragstats) can be used to calculate the maximum number of patches, the average fractal dimension, the sprawl index and the distance from the station to the urban center for the land types around the station, reflecting the geographical characteristics and patterns of different land use types. For three-dimensional information about the MOE (Figure 6), the software can automatically read online map information and visual interpretations of high-resolution remote sensing images to obtain building height information. The software can then calculate the regional volume ratio around the station, the SVF, the BHWR and other urban vertical morphology parameters, extracting the characterization index system of the three-dimensional morphology of the MOE (Figure 6).
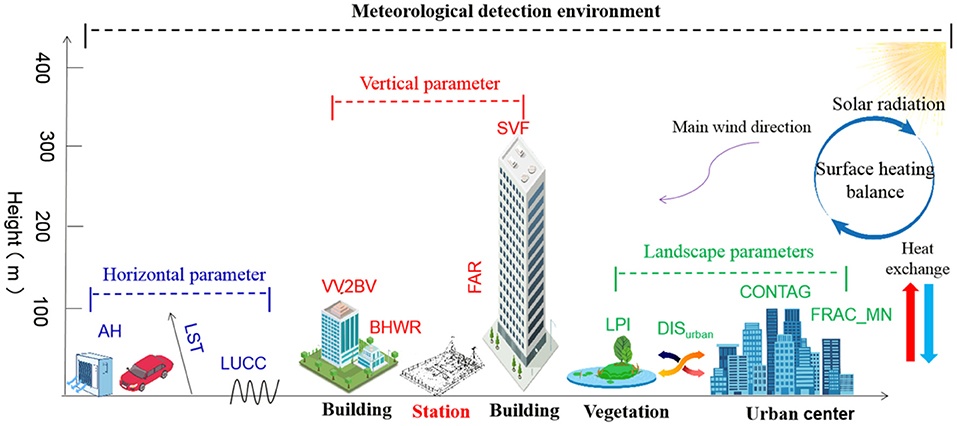
Figure 6. Indexes used to characterize the three-dimensional morphology of the MOE at the local scale. AH, anthropogenic heat; LST, land surface temperature; LUCC, land use and cover change; SVF, sky visual factor; BHWR, block height to width ratio; FAR, floor area ration; VV2BV, vegetation volume to building volume; CONTAG, contagion index; LPI, largest patch index; FRAC_MN, mean fractal dimension.
Non-linear Response of Urbanization Bias to the Three-Dimensional Morphology of the MOE and Its Scale Dependence
With the continuous development of high-performance computers and numerical simulation algorithms, researchers have increasingly used numerical modeling techniques to simulate the characteristics of urban climates (Zhang et al., 2002, 2016; Li L. et al., 2015; Li et al., 2016; Yu et al., 2021). This provides new ideas and methods to explore how the MOE is influenced by urbanization (You et al., 2014). An accurate description of the three-dimensional morphology of the MOE can provide effective subsurface information and boundary conditions for numerical simulations, which, in turn, can verify the accuracy of the remote sensing assessment of the MOE.
The Weather Research and Forecasting model has a comprehensive physical scheme to describe various complex climate phenomena and can analyze the climate characteristics of cities at the local scale. This model can propose policy recommendations and improvement strategies for urban construction, planning and management (Zhang et al., 2002; Fei et al., 2011). Computational fluid dynamics can quantitatively calculate the distribution of physical quantities (e.g., temperature and wind) at various points in space in a microscale open atmosphere and can describe in detail the characteristics of urban spatial patterns, building information and data on anthropogenic heat production, providing a powerful tool for understanding and evaluating microscale climate characteristics (Shao et al., 2012; You et al., 2014; Chen et al., 2020). In the future, the WRF model could be coupled with computational fluid dynamics models to obtain accurate information about meteorological elements from the large-scale circulation and the energy balance on the mesoscale; computational fluid dynamics could be used to finely describe the influence of the complex underlying surface on the SAT series (Li L. et al., 2015; Nelson et al., 2016).
Statistical modeling is also an important method of studying the drivers of urbanization bias at different scales. The random forest algorithm is a natural non-linear modeling method suitable for analyzing complex datasets with a large number of unknown features. This method can be used to predict and analyze the intrinsic association of variables and to perform importance and local dependence analysis of independent variables (Genuer, 2010). The random forest algorithm is widely used in fitting complex problems and to factor importance measures, especially for simulations of changes in land use and urban morphological expansion (Ghosh et al., 2014; Feng et al., 2015). Machine learning methods could be used in the future to analyze the influence of three-dimensional morphological changes of the MOE on urbanization bias and its scale dependence.
Summary
In the context of the current rapid increase in urbanization, studies of the impact of changes in the MOE on the urbanization bias in SAT series are of great scientific significance in monitoring regional and global climate change. These studies can also meet practical operational needs, such as the detection and revision of the asymptotic inhomogeneity of meteorological data, the standardized preparation of benchmark meteorological data, the environmental assessment of national meteorological stations, and the site selection and overall optimization of the layout of meteorological observational stations. Studies of the influence of changes in the MOE on urbanization bias in SAT series involve knowledge of urban meteorology, urban geography and the urban environment, as well as urban planning, architecture, landscape architecture and other disciplines. However, current research is mostly limited to a single discipline, resulting in relatively limited research findings. By effectively coupling multiple technical methods (e.g., machine learning, remote sensing and numerical models), we will be able to gain a greater understanding of the non-linear response of urbanization bias to the three-dimensional morphology of the MOE and its scale dependence.
Author Contributions
TS: methodology, formal analysis, results and discussion, and writing—original draft preparation. DS, YH, and CS: discussion and writing—reviewing and editing. YY: conceptualization, data curation, methodology, results and discussion, and writing—reviewing and editing. All authors contributed to the article and approved the submitted version.
Funding
This study was supported by National Natural Science Foundation of China (42105147 and 42175098). The data that support the findings of this study are openly available. The Meteorological Information Centre of the China Meteorological Administration provided the meteorological data (http://data.cma.cn/site/index.html) and the remote sensing data used in this study were Landsat data from the United States' EOS (Earth Observation System) refined by Department of Earth System Science/Institute for Global Change Studies Tsinghua University (http://data.ess.tsinghua.edu.cn/).
Conflict of Interest
The authors declare that the research was conducted in the absence of any commercial or financial relationships that could be construed as a potential conflict of interest.
Publisher's Note
All claims expressed in this article are solely those of the authors and do not necessarily represent those of their affiliated organizations, or those of the publisher, the editors and the reviewers. Any product that may be evaluated in this article, or claim that may be made by its manufacturer, is not guaranteed or endorsed by the publisher.
References
Amfield, A. J. (2003). Two decades of urban climate research: a review of turbulence, exchanges of energy and water, and the urban heat island. Int. J. Climatol. 23, 1–26. doi: 10.1002/joc.859
Bai, Z., and Ren, G. (2006). The effect urban heat island on change of regional mean temperature in Gansu Province, China. Plateau Meteorol. 25, 91–94. doi: 10.1016/S1003-6326(06)60040-X
Berger, C., Voltersen, M., Eckardt, R., and Eberle, J. (2013). Muli-mdal and multi-temporal data fusion outcome of the 2012 GRSS data usion contest. IEEE J. Select Topics Appl. Earth Observ. Remote Sens. 6, 1324–1340. doi: 10.1109/JSTARS.2013.2245860
Brohan, P., Kennedy, J. J., Harris, I., Tett, S. F. B., and Jones, P. D. (2006). Uncertainty estimates in regional and global observed temperature changes: a new data set from 1850. J. Geophys. Res. 111:D12106. doi: 10.1029/2005JD006548
Cao, L., Zhu, Y., Tang, G., Yuan, F., and Yan, Z. (2016). Climatic warming in China according to a homogenized data set from 2419 stations. Int. J. Climatol. 36, 4384–4392. doi: 10.1002/joc.4639
Chao, L., Huang, B., Yang, Y., and Jones, P. D. (2020). A new evaluation of the role of urbanization to warming at various spatial scales: evidence from the Guangdong-Hong Kong-Macau region, China. Geophys. Res. Lett. 47:20. doi: 10.1029/2020GL089152
Chen, G., Charlie, L., Kwong, C., Wang, K., Wang, B., Hang, J., et al. (2021). Effects of urban geometry on thermal environment in 2D street canyons: a scaled experimental study. Build. Environ. 198:107916. doi: 10.1016/j.buildenv.2021.107916
Chen, G., Wang, D., Wang, Q., Li, Y., and Wang, K. (2020). Scaled outdoor experimental studies of urban thermal environment in street canyon models with various aspect ratios and thermal storage. Sci. Total Environ. 726:138147. doi: 10.1016/j.scitotenv.2020.138147
Chen, T. (2021). Integrated impacts of tree planting and street aspect ratios on urban thermal environment in street canyons: a scaled outdoor experiment. Sci. Total Environ. 764:142920. doi: 10.1016/j.scitotenv.2020.142920
Chen, X., Yang, J., Zhu, R., Wong, M., and Ren, C. (2021). Spatiotemporal impact of vehicle heat on urban thermal environment: a case study in Hong Kong. Build. Environ. 205:108224. doi: 10.1016/j.buildenv.2021.108224
Chun, B., and Guldmann, J. M. (2014). Spatial statistical analysis and simulation of the urban heat island in high-density central cities. Landscape Urban Plan. 125, 76–88. doi: 10.1016/j.landurbplan.2014.01.016
Connolly, R., and Connolly, M. (2014). Has poor station quality biased U.S. temperature estimates? Open Peer Rev. J. 2014:11. Available online at: http://oprj.net/articles/climate-science/11 (accessed December 8, 2021).
Davey, C. A., and Pielke, R. A. Sr (2005). Microclimate exposures of surface-based weather stations: implication for the assessment of long-term temperature trends. Bull. Amer. Meteor. Soc. 86, 497–504. doi: 10.1175/BAMS-86-4-504
Davis, A. Y., Jung, J. B., PijaIlowski, C., and Mjnor, E. S. (2016). Combined vegetation Volume and “greenness” affect urban air temperature. Appl. Geogr. 71, 106–114. doi: 10.1016/j.apgeog.2016.04.010
Du, J., Wang, K., Cui, B., and Jiang, S. (2020). Correction of inhomogeneities in observed land surface temperatures over China. Atmos. Res. 33, 8885–8902. doi: 10.1175/JCLI-D-19-0521.1
Erell, E., Pearlmutter, D., and Williamson, T. J. (2011). Urban Microclimate: Designing the Spaces between Buildings. London, New York: Routledge. doi: 10.4324/9781849775397
Estoque, R. C., Murayama, Y., and Myint, S. W. (2017). Effects of landscape composition and pattern on land surface temperature: an urban heat island study in the megacities of Southeast Asia. Sci. Total Environ. 577, 349–359. doi: 10.1016/j.scitotenv.2016.10.195
Fall, S. A., Watts, J., Nielsen-Gammon, E., Jones, D., Niyogi, J. R., Christy, R., and Pielke, A. (2011). Analysis of the impacts of station exposure on the U.S. Historical Climatology Network temperatures and temperature trends. J. Geophys. Res. 116:D14120. doi: 10.1029/2010JD015146
Fei, C., Kusaka, H., Bornstein, R., Ching, J., and Zhang, C. (2011). The integrated WRF/urban modelling system: development, evaluation, and applications to urban environmental problems. Int. J. Climatol. 31, 273–288. doi: 10.1002/joc.2158
Feng, Q., Liu, J., and Gong, J. (2015). UAV remote sensing for urban vegetation mapping using random forest and texture analysis. Remote Sensing 7, 1074–1094 doi: 10.3390/rs70101074
Freitas, S., Catita, C., Redweik, P., and Brit, M. C. (2015). Modelling solar potential in the urban environment state-of-heat review. Renew. Sustain. Energy Rev. 41, 915–931. doi: 10.1016/j.rser.2014.08.060
Fujibe, F. (2009). Detection of urban warming in recent temperature trends in Japan. Int. J. Climatol. 29, 1811–1822. doi: 10.1002/joc.1822
Gallo, K., Easternling, D., and Peterson, T. (1996). The influence of land use/land cover on climatological values of the diurnal temperature range. J. Clim. 9, 2941–2944.
Gallo, K. P., Mcnab, A. L., Karl, T. R., Brown, J. F., and Tarpley, J. D. (1993). The use of NOAA AVHRR data for assessment of the urban heat island effect. J. Appl. Meteor. 32, 899–908. doi: 10.1175/1520-0450(1993)032<0899:TUONAD>2.0.CO;2
Genuer, R. (2010). Variable selection using random forests. Pattern Recognit. Lett., 31, 2225–2236 doi: 10.1016/j.patrec.2010.03.014
Ghosh, A., Sharma, R., and Joshi, P. K. (2014). Random forest classification of urban landscape using Landsat archive and ancillary data: combining seasonal maps with decision level fusion. Appl. Geogr. 48, 31–41. doi: 10.1016/j.apgeog.2014.01.003
Hansen, J., Ruedy, R., Sato, M., Imhoff, M., Lawrence, W., Easterling, D., et al. (2001). A closer look at united states and global surface temperature change. J. Geophys. Res. 106, 23947–23963. doi: 10.1029/2001JD000354
Imhoff, M. L., Lawrence, W. T., Stutzer, D. C., and Elvidge, C. D. (1997). A technique for using composite DMSP/OLS ‘City Lights’ satellite data to map urban area. Rem. Sens. Environ. 61, 361–370. doi: 10.1016/S0034-4257(97)00046-1
Imhoff, M. L., Zhang, P., Wolfe, R. E., and Bounoua, L. (2010). Remote sensing of the urban heat island effect across biomes in the continental USA. Rem. Sens. Environ. 114, 504–513. doi: 10.1016/j.rse.2009.10.008
Jamei, E., Rajagopalan, P., Seyedmahmoudian, M., and Jamei, Y. (2016). Review on the impact of urban geometry and pedestrian level greening on outdoor thermal comfort. Renew. Sustain. Energy Rev. 54, 1002–1017 doi: 10.1016/j.rser.2015.10.104
Jones, P. D., Ambenje, P., Bojariu, R., Easterling, D., and Tignor, M. (2007). Observations: Surface and atmospheric climate change. Climate Change: The Physical Science Basis. Contribution of Working Group I to the Fourth Assessment Report of the Intergovernmental Panel on Climate Change. Cambridge; New York, NY: Cambridge University Press.
Li, L., Hu, F., and Liu, J. (2015). Application of CFD technique on micro-scale issues in urban climatic environment researches in China. Adv. Meteorol. Sci. Technol. 5, 23–30 (in Chinese). doi: 10.3878/j.issn.1006-9585.2012.11147
Li, Q., and Huang, J. (2013). Effects of urbanization in surrounding Bohai area on extreme summer warmest night temperature. Acta Meteo Sinic, 27, 808–818. doi: 10.1007/s13351-013-0602-0
Li, Q. J, Huang, Z., Jiang, L., Zhou, P., and Chu Hu, K. (2014). Detection of urbanization signals in extreme winter minimum temperature changes over Northern China. Clim. Change. 122, 595–608. doi: 10.1007/s10584-013-1013-z
Li, Q., Liu, X., Zhang, H., Peterson, T. C., and Easterling, D. R. (2004). Detecting and adjusting on temporal inhomogeneities in chinese mean surface air temperature datasets. Adv. Atmos. Sci. 21, 260–268. doi: 10.1007/BF02915712
Li, Q., Yang, J., and Yang, L. (2021). Impact of urban roughness representation on regional hydrometeorology: an idealized study. J. Geophys. Res. Atmos. 126:4. doi: 10.1029/2020JD033812
Li, Q., Yang, S., Xu, W., Wang, X., Jones, P., Parker, D., et al. (2015). China experiencing the recent warming hiatus. Geophys. Res. Lett. 42, 889–898. doi: 10.1002/2014GL062773
Li, Q., Zhang, H., Liu, X., Chen, J., Wei, L., and Jones, P. (2009). A mainland China homogenized historical temperature dataset of 1951–2004. Bull Am. Meteorol. Soc. 90, 1062–1065. doi: 10.1175/2009BAMS2736.1
Li, Q. X. (2011). Introduction to the Study of Climate Data Homogeneity. Beijing: Meteorological Press, 20–23.
Li, X., Yang, Y., Cao, L., and Yong, Z. (2016). Research on the influence of urban green space distribution on the thermal environment based on RS and CFD simulation. Remote Sens. Technol. Appl. 31, 1150–1157 (in Chinese). doi: 10.11873/j.issn.1004-0323.2016.6.1150
Li, Y., Shi, T., Yang, Y., Wu, B., Wang, L., Shi, C., et al. (2015). Satellite-based investigation and evaluation of the observational environment of meteorological stations in Anhui Province. Pure Appl. Geophys. 172, 1735–1749. doi: 10.1007/s00024-014-1011-8
Li, Z., Yan, Z., Zhu, Y., Freychet, N., and Tett, S. (2020). Homogenized daily relative humidity series in China during 1960-2017. Adv. Atmos. Sci. 37, 318–327. doi: 10.1007/s00376-020-9180-0
Liang, W., Huang, X., Jones, P., Wang, Q., and Hang, J. (2018). A zonal model for assessing street canyon air temperature of high-density cities. Build. Environ. 132, 160–169. doi: 10.1016/j.buildenv.2018.01.035
Liu, S. H., and Zhou, B. (2007). Simulation of wind, temperature and humidity fields over Beijing area in summer using an improved model. Acta Sci. Nat. Univ. Pekin. 43, 42–47 (in Chinese). doi: 10.3321/j.issn:0479-8023.2007.01.007
Liu, W. D., Yang, P., and You, H. L. (2013). Heat island effect and diurnal temperature range in Beijing area. Clim. Environ. Res. 18, 171–177 (in Chinese).
Liu, Y., Ren, G., Zhang, G., Yu, H., and Center, H. C. (2018). Response of surface air temperature to micro-environmental change: results from Mohe parallel observation experiment. Meteorol. Sci. Technol. 46, 215–223 (in Chinese). doi: 10.19517/j.1671-6345.20170200
Liu, Y. L. (2006). A Preliminary Analysis of the Influence of Urbanization on Precipitation Change Trend in North China. Lanzhou: Lanzhou University.
Luo, M., and Lau, N. C. (2018). Increasing heat stress in urban areas of eastern China: acceleration by urbanization. Geophys. Res. Lett. 45, 13060–13069. doi: 10.1029/2018GL080306
Luo, M., and Lau, N. C. (2019). Urban expansion and drying climate in an urban agglomeration of east China. Geophys. Res. Lett. 46, 6868–6877. doi: 10.1029/2019GL082736
Mahmood, R., Foster, S. A., and Logan, D. (2006). The Geoprofille metadata, exposure of instruments, and measurement bias in climatic record revisited. Int. J. Clim, 26, 1091–1124. doi: 10.1002/joc.1298
Meng, D., Li, X., and Gong, H. (2010). The thermal environment landscape pattern and typical urban landscapes effect linked with thermal environment in Beijing. Acta Ecol. Sin. 30, 3491–3500 (in Chinese).
Menne, M. J., Williams, C. N. Jr., and Palecki, M. A. (2010). On the reliability of the U.S. surface temperature record. J. Geophys. Res. 115:D11108. doi: 10.1029/2009JD013094
Nelson, M. A., Brown, M. J., Halverson, S. A., Bieringer, P. E., Annunzio, A., Bieberbach, G., et al. (2016). A case study of the Weather Research and Forecasting model applied to the Joint Urban 2003 tracer field experiment. Part 2: Gas tracer dispersion. Boundary-Layer Meteorol. 161, 461–490. doi: 10.1007/s10546-016-0188-z
Ngarambe, J., Nganyiyimana, J., Kim, I., Santamouris, M., and Yunid, G. Y. (2020). Synergies between urban heat island and heat waves in Seoul: the role of wind speed and land use characteristics. PLoS ONE 15:12. doi: 10.1371/journal.pone.0243571
Oke, T. R. (1988). Street design and urban canopy layer climate. Energy Build. 11, 103–113. doi: 10.1016/0378-7788(88)90026-6
Oke, T. R. (2004). Initial Guidance to Obtain Representative Meteorological Observations at Urban Sites. Geneva: World Meteorological Organization, 51–52.
Oke, T. R., Johnson, G. T., Steyn, D. G., and Watson, I. D. (1991). Simulation of surface urban heat islands under ‘ideal’ conditions at night part 2: diagnosis of causation. Boundary-Layer Meteorol. 56, 339–358. doi: 10.1007/BF00119211
Peterson, T. C. (2003). Assessment of urban versus rural in situ surface temperatures in the contiguous United States: No difference found. J. Clim. 16, 2941–2959. doi: 10.1175/1520-0442(2003)016<2941:aouvri>2.0.co;2
Portman, D. (1993). Identifying and correcting urban bias in regional time series: surface temperature in China's northern plain. J. Clim. 6, 2298–2308. doi: 10.1175/1520-0442(1993)006<2298:IACUBI>2.0.CO;2
Qian, Y., Zhou, W., Hu, X., and Fan, F. (2018). The heterogeneity of air emperaue n uan residental neighborhoods and its relationship with the surrounding greenspace. Remote Sens. 10:965. doi: 10.3390/rs10060965
Ren, G. (2015). Urbanization as a major driver of urban climate change. Adv. Clim. Chang. Res. 6, 1–6. doi: 10.1016/j.accre.2015.08.003
Ren, G., Chu, Z., Chen, Z., and Ren, Y. (2007). Implications of temporal change in urban heat island intensity observed at Beijing and Wuhan stations, Geophys. Res. Lett. 34, 1–5. doi: 10.1029/2006GL027927
Ren, G., Ding, Y., and Tang, G. (2017). An overview of mainland china temperature change research. J. Meteor. Res. 31, 3–16. doi: 10.1007/s13351-017-6195-2
Ren, G., Feng, G., and Yan, Z. (2010a). Progresses in observation studies of climate extremes and changes in mainland China. Clim. Environ. Res. 15, 337–353 (in Chinese). doi: 10.3878/j.issn.1006-9585.2010.04.01
Ren, G., Li, J., Ren, Y., Chu, Z., Zhang, A., Zhou, Y., et al. (2015). An integrated procedure to determine a reference station network for evaluating and adjusting urban bias in surface air temperature data. J. Appl. Meteorol. Climatol. 54, 1248–1266. doi: 10.1175/JAMC-D-14-0295.1
Ren, G., Zhang, A., Chu, Z., Zhou, J., and Zhou, Y. (2010b). Principles and procedures for selecting reference surface air temperature stations in China. Meteorol. Sci. Technol. 38, 78–85 (in Chinese). doi: 10.3969/j.issn.1671-6345.2010.01.015
Ren, Y., and Ren, G. (2011). A remote-sensing method of selecting reference stations for evaluating urbanization effect on surface air temperature trends. J. Clim. 24, 3179–3189. doi: 10.1175/2010JCLI3658.1
Scarano, M., and Mancini, F. (2017). Assessing the relationship between sky view factor and land surface temperature to the spatial resolution. Int. J. Remote Sens. 38, 6910–6929. doi: 10.1080/01431161.2017.1368099
Schneider, A., Friedl, M. A., and Potere, D. (2009). A new map of global urban extent from MODIS satellite data. Environ. Res. Lett. 4:044003. doi: 10.1088/1748-9326/4/4/044003
Shao, J., Liu, J., and Zhao, J. (2012). Evaluation of various non-linear k-εmodels for predicting wind flow around an isolated high- rise building within the surface boundary layer. Build. Environ. 57, 145–155. doi: 10.1016/j.buildenv.2012.04.018
Shashua, B., and Hoffman, M. E. (2000). Vegetation as a climatic component in the design of an urban street: an empirical model for predicting the cooling effect of urban green areas with trees. Energy Build. 31, 221–235. doi: 10.1016/S0378-7788(99)00018-3
Shi, T., Huang, Y., Wang, H., Shi, C., and Yang, Y. (2015). Influence of urbanization on the thermal environment of meteorological stations: satellite-observational evidence. Adv. Clim. Change Res. 1, 7–15. doi: 10.1016/j.accre.2015.07.001
Shi, T., Sun, D., Huang, Y., Lu, G., and Yang, Y. (2021). A new method for correcting urbanization-induced bias in surface air temperature observations: Insights from comparative site-relocation data. Front. Environ. Sci. 9:625418. doi: 10.3389/fenvs.2021.625418
Soon, W. W., Ronan, C., Michael, C., Peter, O. N., Zheng, J., Ge, Q., et al. (2018). Comparing the current and early 20th century warm periods in China. Earth Sci. Rev. 185, 81–101. doi: 10.1016/j.earscirev.2018.05.013
Stewart, I. D., and Oke, T. R. (2012). Local climate zones for urban temperature studies. Bull. Am. Meteorol. Soc. 93, 1879–1900. doi: 10.1175/BAMS-D-11-00019.1
Svensson, M. K. (2004). Sky view factor analysis-implications for urban air temperature differences. Meteorol. Appl. 11, 201–211. doi: 10.1017/S1350482704001288
Tian, Y., Zhou, W., Qian, Y., Zheng, Z., and Yan, J. (2019). The effect of urban 2D and 3D morphology on air temperature in residential neighborhoods. Landscape Ecol. 34, 1161–1178. doi: 10.1007/s10980-019-00834-7
Tysa, S. K., Ren, G., Qin, Y., Zhang, P., Ren, Y., Jia, W., et al. (2019). Urbanization effect in regional temperature series based on a remote sensing classification scheme of stations. J. Geophys. Res. Atmos. 124, 646–661. doi: 10.1029/2019JD030948
Voogt, J. A., and Oke, T. R. (2004). Thermal remote sensing of urban climates. Remote Sens. Environ. 86, 370–384. doi: 10.1016/S0034-4257(03)00079-8
Vose, R. S., and Menne, M. J. (2004). A method to determine station density requirements for climate observing networks. J. Clim. 17, 2961–2971. doi: 10.1175/1520-0442(2004)017<2961:AMTDSD>2.0.CO;2
Wang, C., Wei, X., Yan, J., and Jin, L. (2019). Grade evaluation of detection environment of meteorological stations in Beijing. J. Appl. Meteorol. Sci. 30, 117–128 (in Chinese). doi: 10.11898/1001-7313.20190111
Wang, L., Guan, Y., and Guo, S. (2016). Urban surface energy's responses to land surface element types and interactive relationship. J. Geo-Information Sci. 18, 1684–1697 (in Chinese). doi: 10.3724/SP.J.1047.2016.01684
Wang, W., Zeng, Z., and Karl, T. R. (1990). Urban heat islands in China. Geophys. Res. Lett.17, 2377–2380. doi: 10.1029/GL017i013p02377
Watts, A. (2009). Is the U.S. Surface Temperature Record Reliable? Chicago, IL: The Heartland Institute.
Wen, K., Ren, G., Li, J., Ren, Y., Sun, X., Zhou, Y., et al. (2019). Adjustment of urbanization bias in surface air temperature over the mainland of China. Prog. Geogr. 38, 600–611 (in Chinese). doi: 10.18306/dlkxjz.2019.04.012
Weng, Q., Rajasekar, U., and Hu, X. (2011). Modeling urban heat islands and their relationship with impervious surface and vegetation abundance by using ASTER images. IEEE Trans. Geosci. Remote Sens. 49:10. doi: 10.1109/TGRS.2011.2128874
Xu, W., Li, Q., Wang, X., Yang, S., Cao, L., and Feng, Y. (2013). Homogenization of Chinese daily surface air temperatures and analysis of trends in the extreme temperature indices. J. Geophys. Res. Atmos. 118, 9708–9720. doi: 10.1002/jgrd.50791
Yan, W., Shaker, A., and El-Ashmmwy, N. (2015). Urban and cover classification using airborne LiDAR data: a review. Remote Sens. Environ. 158, 295–310. doi: 10.1016/j.rse.2014.11.001
Yan, Z., Li, Z., and Xia, J. (2014). Homogenization of climate series: the basis for assessing climate changes. Sci. Sin. (Terrae) 44, 2101–2111 (in Chinese). doi: 10.1007/s11430-014-4945-x
Yang, J., and Bou-Zeid, E. (2019). Designing sensor networks to resolve spatio-temporal urban temperature variations: fixed, mobile or hybrid?. Environ. Res. Lett. 14:10694. doi: 10.1088/1748-9326/ab25f8
Yang, J., Wang, Z., Kaloush, K., and Dylla, H. (2016). Effect of pavement thermal properties on mitigating urban heat islands: a multi-scale modeling case study in Phoenix. Build. Environ. 108, 110–121. doi: 10.1016/j.buildenv.2016.08.021
Yang, X., Hou, Y., and Chen, B. (2011a). Observed surface warming induced by urbanization in east China. J. Geophys. Res. 116:D14113. doi: 10.1029/2010JD015452
Yang, X., Leung, L. R., Zhao, N., Zhao, C., Yun, Q. K. H., and Liu Chen, B. (2017). Contribution of urbanization to the increase of extreme heat events in an urban agglomeration in east China. Geophys. Res. Lett. 44, 6940–6950. doi: 10.1002/2017GL074084
Yang, X., Yao, L., Jin, T., Jiang, Z., Peng, L., Ye, Y., et al. (2019). Temporal and spatial variations of local temperatures in the summer of Nanjing. J. Civil Environ. Eng. 41, 160–174 (in Chinese).
Yang, Y., Gao, Z., Shi, T., Wang, H., Li, Y., Zhang, N., et al. (2019). Assessment of urban surface thermal environment using MODIS with population-weighted method: a case study. J. Spatial Sci. 64, 1–14. doi: 10.1080/14498596.2017.1422155
Yang, Y., Shi, T., Tang, W., Wu, B., Xun, S., and Zhang, H. (2011b). Study of observational environment of meteorological station based remote sensing—cases in six stations of Anhui Province. Remote Sens. Technol. Appl. 26, 100–105 (in Chinese). doi: 10.11873/j.issn.1004-0323.2011.6.791
Yang, Y., Shi, T., Xun, S., Tang, W., Zhang, H., and Zhang, A. (2011c). Impact of Hefei urbanization on temperature observation based on remote sensing data. Meteorol. Monthly 37, 1430–1437 (in Chinese). doi: 10.1007/s00376-010-1000-5
Yang, Y., Wu, B., Shi, C., Zhang, J., Li, Y., Tang, W., et al. (2013). Impacts of urbanization and station-relocation on surface air temperature series in anhui Province, china. Pure Appl. Geophys. 170, 1969–1984. doi: 10.1007/s00024-012-0619-9
Yang, Y., Zhang, M., Li, Q., Chen, B., Gao, Z., Ning, G., et al. (2020a). Modulations of surface thermal environment and agricultural activity on intraseasonal variations of summer diurnal temperature range in the Yangtze River Delta of China. Sci. Total Environ. 736:139445. doi: 10.1016/j.scitotenv.2020.139445
Yang, Y., Zheng, Z., Yim, S. H. L., Roth, M., Ren, G., Gao, Z., et al. (2020b). PM2.5 pollution modulates wintertime urban-heat-island intensity in the Beijing-Tianjin-Hebei Megalopolis, China. Geophys. Res. Lett. 47:1. doi: 10.1029/2019GL084288
Yilmaz, H., Toy, S., and Irmak, M. A. (2008). Determination of temperature differences between asphalt concrete, soil and grass surfaces of the city of Erzurum, Turkey. Atmosfera, 21, 135–146. doi: 10.1029/2007SW000340
You, L., Zhang, X., Bai, L., Center, F. C., and Center, N. C. (2014). Application of CFD to studying the effect of building on wind observations at meteorological station. J. Meteorol. Environ. 30, 791–797 (in Chinese). doi: 10.3969/j.issn.1673-503X.2014.03.016
Yu, M., Chen, X., Yang, J., and Miao, S. (2021). A new perspective on evaluating high-resolution urban climate simulation with urban canopy parameters. Urban Clim. 38:10091 doi: 10.1016/j.uclim.2021.100919
Zhang, A. Y. (2009). Detection and Revision of Urbanization Effects in Surface Temperature Series of National Basic Reference Stations. Beijing: Chinese Academy of Meteorological Sciences.
Zhang, N., Jiang, W., and Wang, X. (2002). A numerical simulation of the effects of urban blocks and buildings on flow characteristics. Acta Aerodyn. Sin. 20, 339–342 (in Chinese). doi: 10.3969/j.issn.0258-1825.2002.03.012
Zhang, N., Wang, X., Chen, Y., Dai, W., and Wang, X. (2016). Numerical simulations on influence of urban land cover expansion and anthropogenic heat release on urban meteorological environment in Pearl River Delta. Theor. Appl. Climatol. 126, 469–479. doi: 10.1007/s00704-015-1601-0
Zhang, X., Steeneveld, G. J., Zhou, D., Duan, C., and Holtslag, A. A. M. (2019). A diagnostic equation for the maximum urban heat island effect of a typical Chinese city: a case study for Xi'an. Build. Environ. 158, 39–50. doi: 10.1016/j.buildenv.2019.05.004
Zhang, Y. (2014). Assessment and Correction of Urban Bias in Surface Air Temperature Series of Eastern China Over Time Period 1913-2012. Beijing, China: China Academy of Meteorological Sciences.
Zhang, Y., Ning, G., Chen, S., and Yang, Y. (2021). Impact of rapid urban sprawl on the local meteorological observational environment based on remote sensing images and GIS technology. Remote Sens. 13:2624. doi: 10.3390/rs13132624
Zhang, Y., Odeh, I. O. A., and Han, C. (2009). Bi-temporal characterization of land surface temperature in relation to impervious surface area, NDVI and NDBI, using a sub-pixel image analysis. Int. J. Appl. Earth Observ. Geoinform. 11:4. doi: 10.1016/j.jag.2009.03.001
Zheng, Z., Dou, J., Cheng, C., and Gao, H. (2021). Correlation and Causation analysis between COVID-19 and environmental factors in China. Front. Clim. 3:619338. doi: 10.3389/fclim.2021.619338
Zheng, Z., Ren, G., Wang, H., Dou, J., Gao, Z., Duan, C., et al. (2018). Relationship between fine particle pollution and the urban heat island in beijing, china: observational evidence. Bound.-Layer Meteorol. 169, 93–113. doi: 10.1007/s10546-018-0362-6
Keywords: meteorological observational environment, urbanization bias, regional warming, scale dependency, spatial morphology
Citation: Shi T, Yang Y, Sun D, Huang Y and Shi C (2022) Influence of Changes in Meteorological Observational Environment on Urbanization Bias in Surface Air Temperature: A Review. Front. Clim. 3:781999. doi: 10.3389/fclim.2021.781999
Received: 23 September 2021; Accepted: 08 December 2021;
Published: 20 January 2022.
Edited by:
Roger Rodrigues Torres, Federal University of Itajubá, BrazilReviewed by:
Arcilan Assireu, Federal University of Itajubá, BrazilWeber Andrade Gonçalves, Federal University of Rio Grande do Norte, Brazil
Copyright © 2022 Shi, Yang, Sun, Huang and Shi. This is an open-access article distributed under the terms of the Creative Commons Attribution License (CC BY). The use, distribution or reproduction in other forums is permitted, provided the original author(s) and the copyright owner(s) are credited and that the original publication in this journal is cited, in accordance with accepted academic practice. No use, distribution or reproduction is permitted which does not comply with these terms.
*Correspondence: Yuanjian Yang, eXlqMTk4NUBudWlzdC5lZHUuY24=