 Miguel Brandão
- Division of Sustainability Assessment and Management, Department of Sustainable Development, Environmental Science and Engineering (SEED), KTH Royal Institute of Technology, Stockholm, Sweden
Concerns over climate change have led to the promotion of biofuels for transport, particularly biodiesel from oilseed crops and ethanol from sugar and starch crops. However, additional concerns arose on whether the climate change mitigation potential of biofuels is negated by the associated direct land requirements (dLUC) for growing biofuel feedstocks, or by the indirect land requirements (iLUC) that compensate for the diversion of crops from food/feed into fuel, both cases potentially leading to emissions of greenhouse gases. We investigated official data over the last 20-year period to estimate the magnitude of the effects ethanol production in the USA has had on land use domestically and abroad. The data analyzed shows that, over the period, the use of corn for ethanol increased by 118 Mt per year. According to our model, most of it came from the displacement of other uses of corn, mainly feed, which was compensated for by increased feed production elsewhere. Results indicate a relatively low dLUC but a significant iLUC effect, mainly due to the compensation for the foregone feed production as a result of diverting corn into ethanol production. Meeting the renewable-energy target of 15 billion gallons of corn ethanol more than negates the climate benefits from avoided use of gasoline (by 18.0 Mt CO2-eq.), suggesting that promoting corn ethanol for global climate change mitigation may be counter-productive as, despite decreasing domestic emissions, global emissions increase. We suggest that the policy be revised accordingly.
Highlights
- Indirect effects negate the potential of corn ethanol used as a gasoline substitute in the USA to mitigate climate change.
- Diverting corn from other markets (food, feed, and export) is not burden-free as markets balance supply via indirect manners.
- Emissions from indirect land use change (iLUC) are important contributors to the total climate-change impact.
Introduction
Concerns over climate change have led to the promotion of biofuels for transport, particularly biodiesel from oilseed crops and ethanol from sugar and starch crops (e.g., RFS, U. S. Government, 2005). The production of fuel from crops is intuitively superior in terms of its climate-change impacts relative to equivalent fossil-based fuels: the carbon released upon combustion is balanced by the carbon that the crop photosynthesized while growing. However, when a life cycle approach is taken, it is clear that there are a range of indirect emissions that cannot be excluded from robust and comprehensive assessments, such as those from fertilizer production and land-use change (LUC). Most crops require land on which to grow; converting land from a natural state to cropland almost always entails a decrease in the terrestrial carbon stock between the two steady states prior and post conversion, the difference between those is what is emitted to the atmosphere as carbon dioxide (CO2). LUC emissions can negate the climate-change benefits from replacing fossil fuels with biofuels (see e.g., Brandão et al., 2011).
Cumulative LUC is estimated to account for around 1/3 of total anthropogenic CO2 emissions (180 PgC, Myhre et al., 2013), although some argue that LUC has been underestimated (Arneth et al., 2017). Currently, terrestrial ecosystems account for the sequestration of around 25% of global emissions of CO2 (Friedlingstein et al., 2020), but while it has been traditionally thought that terrestrial ecosystems were net sinks of CO2, it now appears that they may be a net source of greenhouse gases (GHGs) to the atmosphere (Tian et al., 2016). Consequently, an increase in demand for crops is expected to put pressure on land which, in turn, may result in CO2 emissions from conversion of natural ecosystems to cropland.
In addition, the climate change mitigation potential of biofuels may be determined by the indirect land use (iLUC) requirements for growing the food or feed crops that compensate for the diversion from other uses into fuels (e.g., Searchinger et al., 2008), leading to both emissions and avoided emissions, the net effect being positive or negative depending on the particular case under study. This issue has been documented and is well established in scientific and policy contexts, and ways to measure it have been proposed. (e.g., Fargione et al., 2008; Searchinger et al., 2008, 2015; Edwards et al., 2010; Ros et al., 2010; Rajagopal et al., 2011; Thompson et al., 2011; Wicke et al., 2012; Palmer and Owens, 2015; Panichelli and Gnansounou, 2015).
The USA is the world's leading producer of ethanol, producing around half of the global output (see Figure 1), partly due to the policy support that currently exists for biofuels. The Renewable Fuel Standard (RFS)—a US federal programme originated with the Energy Policy Act of 2005 (U. S. Government, 2005)—requires transportation fuel to contain a minimum volume of biofuels. The standard was expanded by the Energy Independence and Security Act (EISA) of 2007, which requires renewable fuel to be blended into transportation fuel in increasing amounts each year, up to 36 billion gallons by 2022. The changes required by the 2007 legislation are usually referred to as RFS2, and includes the requirement to use 36 billion gallons of biofuels by 2022, of which a maximum of 15 billion gallons from corn-starch ethanol and a minimum of 16 billion gallons from cellulosic biofuels. It has long been established that biofuels are not carbon-neutral (e.g., Johnson, 2009). One of the provisions in RFS2 is that the biofuels adopted must emit lower levels of GHGs along their life cycle relative to the fossil fuels they replace. However, concerns remain on the likelihood that biofuel expansion will meet its goal of climate change mitigation (e.g., GAO, 2016), particularly since the share of corn used for ethanol has increased from <1% in 1980 to around 40% in 2020 (USDA, 2021), which raises concerns over whether this share increase came via cropland expansion (resulting in dLUC), diversion from other corn uses (resulting in iLUC) and/or came via intensification (i.e., increased production per ha), all of which incurring GHG emissions.
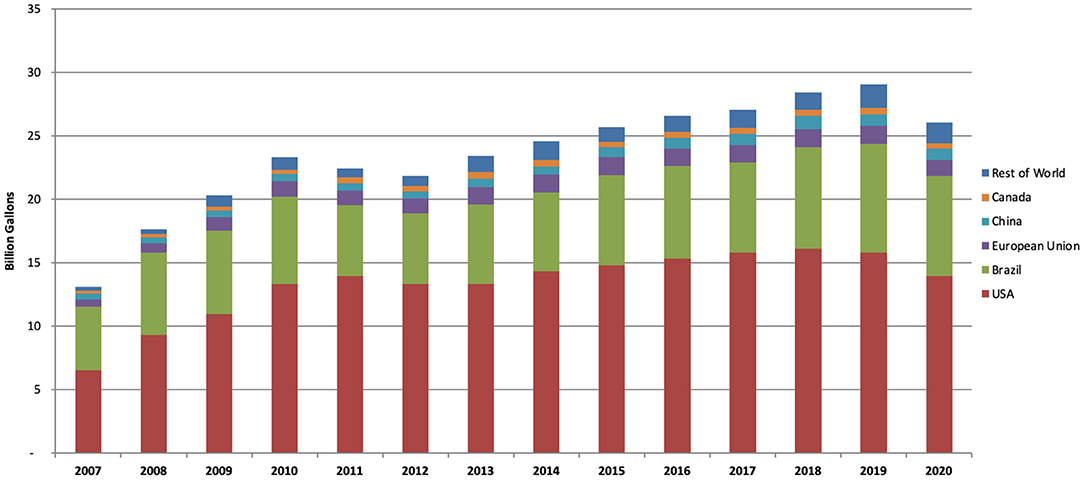
Figure 1. Global ethanol production by country or region [Renewable Fuels Association (RFA) (2021)].
Direct land use change (dLUC) entails converting land from one use into another. Land uses range from natural ecosystems to forest, grassland, permanent cropland or arable land. Indirect land use change (iLUC) refers to the conversion of land to make way for the crops that compensate those that were used for food but that are now being used for fuel. For example, if corn is diverted from feed to fuel in the USA, thereby decreasing global supply of feed while feed demand remains unchanged, the now underprovided feed market will trigger production and, in turn, LUC elsewhere so that the feed gap is compensated for and the feed market balances (i.e., maintains the same level of supply). An alternative way of increasing production without land as an additional factor of production is achieved via increased use of N fertilizer, other agrochemicals, mechanization and breeding (see Edgerton, 2009).
Our paper investigates the possible effects of producing annually 15 billion gallons of corn ethanol in the USA on other markets (e.g., food and feed), on the use of land domestically (i.e., USA) and abroad and, consequently, on the associated level of global GHG emissions.
Methodological Framework
Theory
As the aim of the research is to compare the changes in land use and associated climate-change impacts induced by the production of corn ethanol, we used the areas of land under the different corn uses at the beginning of the period (year 1999) as the counterfactual against which the actual land use at the end of the period is measured (year 2018). We have thus assumed that the counterfactual corresponds to the land dedicated to the different uses of corn in the absence of policy support for ethanol, and is represented by the corn land use areas for food, feed, ethanol, etc. at the start of the period.
We used official data from the (USDA, 2021) to estimate how additional demand for corn ethanol may be met which, as mentioned above, can take place in a variety of ways. The possible sources of additional supply are:
(i) Diversion: use of corn from land already devoted to corn but for non-ethanol uses, such as food and feed, which may result in iLUC when the assumption of ceteris paribus in adjacent markets is adopted, i.e., supply and demand in the markets for food and feed are assumed to remain at constant levels;”
(ii) dLUC: additional production via corn cropland expansion onto other land uses; and/or;
(iii) Intensification: yield increase via, e.g., increased fertilizer use on existing cropland.
We have estimated increased supply to come from a combination of the above. Subsequently, we estimated the indirect effects from each of the sources, such as land use requirements. Therefore, we have taken a consequential life cycle approach to estimating the climate change impacts of the policy shock under analysis. Life cycle assessment (LCA) and carbon footprinting are methods standardized by ISO (2006a,b, 2013). The carbon footprint of products/services refers to their life cycle GHG emissions.
The need to assess systems comprehensively along their supply chain led to the recognition that LCA is the appropriate decision-support tool for assessing the impacts of biofuel systems (European Union, 2009). LCA comprehensively compares alternative systems with the same functionality, thereby providing an appropriate basis to inform policy that aims at supporting transitions toward more sustainable production and consumption systems. LCA helps identify trade-offs between alternatives, and highlights risks of shifting burdens between impacts, life cycle stages, generations, and countries (Brandão, 2020). Published applications of environmental systems analysis tools, such as LCA, to biofuel systems has elucidated that the assumed climate benefit of biofuels is not always realized (e.g., Brandão et al., 2021b), not least because of indirect effects usually not accounted for, such as iLUC (Searchinger et al., 2008). Clearly, biofuel systems need to be analyzed quantitatively and comprehensively before robust claims can be made about their relative environmental superiority.
Choosing the Appropriate Period and Data Sources
We used the available statistical data from the USDA (2021) and FAOSTAT (2021) on key agricultural parameters, such as quantity and area of corn, and corn use (food, feed, ethanol, etc.) over the most recent 20-year period (1999–2018) in the USA. Given the availability of data up to, and including, 2019, and the need to minimize inter-annual variability, we selected the period as the average of 1998–2000 to the average of 2017–2019.
Balancing Markets
The production of ethanol from corn entails the co-production of dried distillers' grains with solubles (DDGS), which is used as animal feed, compensating to a degree for the diversion of corn from feed to fuel.
As feed energy and protein are co-produced jointly in different ratios across the various feedstocks, and soybean meal is co-produced with soybean oil (thereby substituting the marginal source of vegetable oil, which is identified as being palm oil), we estimated the balancing of the feed and vegetable oil markets after the shock (i.e., more DDGS but less corn in the feed market) by solving multiple equations simultaneously. The use of this by-product in the feed market implies that the exact amounts of feed energy and feed protein be displaced if the market is to balance.
We have followed the same method for balancing the food and feed markets as that used in other studies (e.g., Dalgaard et al., 2008; Schmidt and Weidema, 2008; Brandão et al., 2021a,b). In our consequential LCA model, the fate of DDGS as animal feed is included via substitution of the marginal feed crops. The energy and protein contained in DDGS substitute the marginal sources of feed energy and protein, i.e., the feedstocks responding to a change in demand. Assuming that the demand for feed is both global and independent from the fuel market, cereal grain is identified as the marginal source for feed energy while soybean meal as the marginal source for feed protein (Schmidt and Weidema, 2008). We have adopted Schmidt and De Rosa (2020) estimates for the marginal supply mix for feed energy and feed protein, which is based on the suppliers' largest share in global production increase over the period 2012–2016.
- Feed energy: corn from the USA (61%) and from Argentina (11%), and wheat from Russia (22%) and the Ukraine (7%), representing 54% of the increase in global annual production.
- Feed protein: soybean meal from USA (52%) and Brazil (48%), representing 70% of the increase in global annual production.
In addition, the co-production of vegetable oil from soybean meal interacts with the vegetable oil market, for which palm oil produced in Indonesia (55%) and Malaysia (45%) are identified as the marginal suppliers (Schmidt and De Rosa, 2020).
System Boundary Delimitation
Activities representing the cultivation of crops, such as corn, soybean, wheat, palm oil (e.g., inputs of agrochemicals and fuels) are included in our model. For the processing of corn into ethanol and the subsequent displacement of petroleum gasoline, we used data from GREET (ANL, 2020).
After estimating the changes in supply of the marginal crops, and respective areas and locations, we calculated emissions for the LUC in those countries from data previously modeled in Brandão et al. (2021a), based on the share of current production of those marginal crops that comes from expanding cropland in those countries. Land diverted from other agricultural uses is excluded from the delimitations of our system and, thus, is not subject to LUC considerations, unlike the land requirements for producing the marginal feed crops and associated land displaced by the co-production of DDGS. The iLUC component of the model is based on Schmidt et al. (2015), while the LUC component is based on BSI (2011) (see section Estimating Land-Use Change).
Characterizing GHG Emisisons
Emissions of carbon dioxide (CO2), methane (CH4), and nitrous oxide (N2O) are included in the assessment by using IPCC GWP-derived characterization reflecting cumulative radiative forcing over 100 years, yielding factors of 1, 25 and 298 for CO2, CH4, and N2O, respectively.
Results
Estimating Supply Changes
Over the period in question, total annual corn supply increased by 56% from 234 million metric tons (Mt) to 365 Mt, but this increase was not equal among all uses: ethanol production increased considerably over the period, while other uses remained largely unchanged (USDA, 2021).
The total production of corn for ethanol increased from 13 to 134 Mt (the amount required to produce 15 million gallons of ethanol), which corresponds to a share increase from 6% to 37% of the total corn produced in the USA at the beginning and end of the 20-year period, respectively. Corn use for feed remained at around 140 Mt, implying a share decrease from 60% to 39% of total production (and associated land use) over the period.
Estimating Displacement Effects
The data show that most of the corn being additionally produced annually is used for ethanol (117 out of 131 Mt), indicating the possibility of diversion from the other use(s) of corn that would otherwise have occurred if the land devoted to other purposes at the beginning of the period had remained dedicated to those other uses at the end of the period of assessment. Assuming that the corn land used for non-ethanol purposes would have remained unchanged (i.e., continue being dedicated to non-ethanol purposes) in the absence of policy support for biofuels, we attributed the changes in the actual use of land for non-ethanol corn relative to that of 20-years ago as a result of RFS2, implying a lack of supply of corn to other uses relative to the supply expressed in the counterfactual.
“Despite the production of corn increasing considerably over the two decades, we estimated that of the 134 Mt used for ethanol:
• 18 Mt came from land already under ethanol corn,
• 56 Mt came from expansion of land for corn, while
• 60 Mt came from diversion from other uses, particularly
- 44 Mt was from feed,
- 9 Mt was from food, and
- 7 Mt from exports.”
We have used the quantities diverted from their respective markets to estimate the knock-on effects when the food, feed, vegetable oil, and export markets balance supply as a result of meeting the ethanol target expressed in RFS2. Figure 2 shows the sources of corn supply: diversion of land from other uses and expansion for fuel, and implicit yield increases.
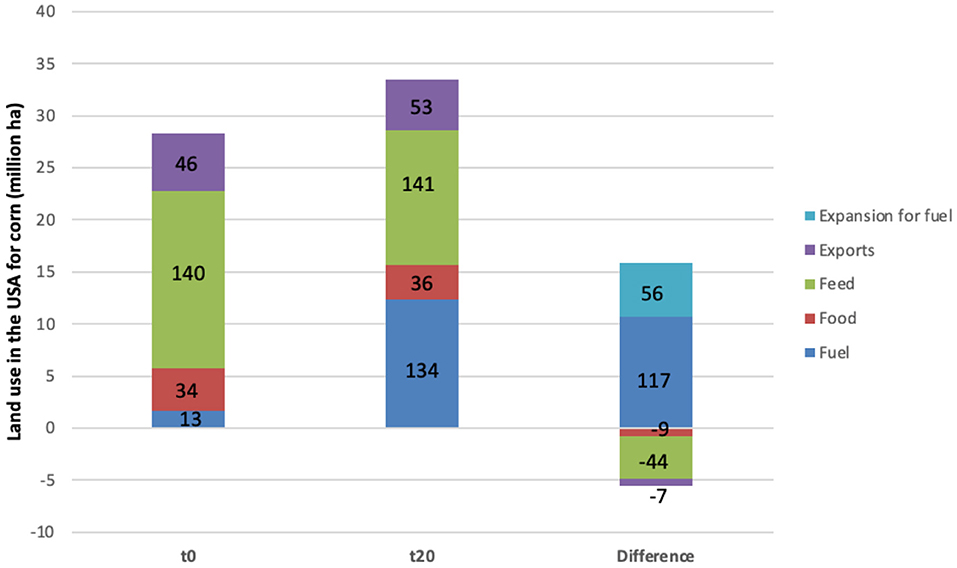
Figure 2. Sources of corn supply for ethanol at the beginning and end of the 20-year period: diversion form other uses and land expansion (area and volume of production—the figures on the bars refer to the volume of production in Mt). Negative values refer to land (and associated production) coming from diversion from other uses (60 Mt). In addition, land expansion for corn for ethanol by 5.2 Mha produced an additional 56 Mt.
Estimating how the Feed, Food, Export and Vegetable Oil Markets Balance
The conversion of 134 Mt of corn to ethanol results in the co-production of 37 Mt of DDGS (at 10% moisture), containing a digestible energy content of 636.1 PJ and 10.1 Mt of metabolizable protein. However, the diversion of 44 Mt of corn from the feed market subtracts 654.1 PJ and 2.8 Mt of protein, leaving −18.3 PJ and 7.2 Mt to be balanced by the marginal feed energy and protein sources, respectively.
In order to balance the feed and vegetable oil markets, 4.6 Mt of palm oil are required, 19.7 Mt of soybean meal are displaced, and 21.3 Mt of feed-energy crops will come into production. Figure 3 illustrates this, as well as the land requirements, which are further specified in Table 1. Figure 3 shows that 5.2 Mha are required for growing additional corn for ethanol, plus 0.9 Mha for compensating for the diversion of US corn from food purposes, plus 0.7 Mha for compensating for diversion from the export market and −3.2 Mha for compensating for changes in the feed and vegetable oil markets. Total LUC (direct and indirect) amounts to 3.8 Mha (see Table 1).
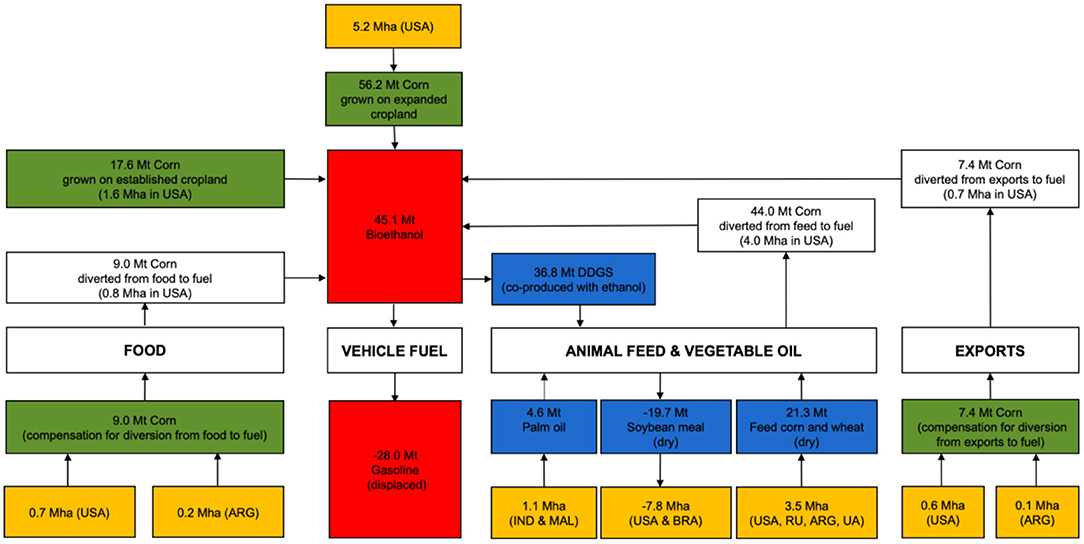
Figure 3. Implications associated with the policy shock of 15 billion gallons of ethanol from corn in the USA, including the balancing of vehicle fuel, food, feed, and vegetable oil markets.
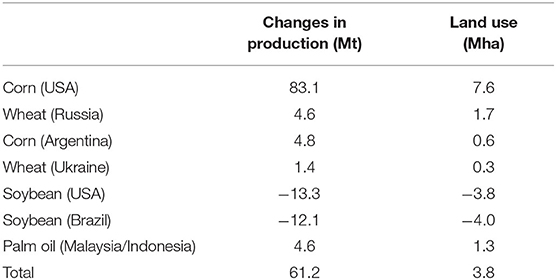
Table 1. Implications on crop production and land use associated with the policy shock of 15 billion gallons of ethanol, including the balancing of markets (food, feed, vegetable oil, and exports).
Estimating Land-Use Change
dLUC emissions are included by estimating the carbon-stock changes between the reference land use and the land used for the production of the crop, and amortized over 20 years. In order to estimate the reference land-use mix, our algorithm reflected the trend over the past 20 years (1999–2018) of expansion/contraction of forest, grassland, annual cropland and perennial cropland in the particular country (or country-mix) from FAO data (FAOSTAT, 2021); see Brandão et al. (2021a). The resulting values are consistent with the methodological guidance given in RED (European Union, 2009) and its amendment (European Union, 2015), PAS2050 (European Commission, 2010), Carré et al. (2010), BSI (2011), Blonk (2014), Novaes et al. (2017), ecoinvent (Moreno Ruiz et al., 2019; Donke et al., 2020) as well as the guidelines for National Greenhouse Gas Inventories (Buendia et al., 2019), and include carbon stock changes in mineral and organic soils due to changes in land management in addition to changes in land use. IPCC tier 1 values for carbon stocks in soil and vegetation, according to soil type, vegetation type, land use, and land management were applied, using the proportion of area of each soil/climate per country to produce a weighted average.
Estimating the Carbon Footprint of the Policy Shock
We have estimated that meeting the renewable-energy target of producing 15 billion gallons of ethanol (45.1 Mt) from corn in the USA is associated with the net GHG emissions of 18.0 Mt CO2-eq., representing the emissions at different stages of the ethanol life cycle: crop cultivation, processing, transport, use, as well as substitution effects and land-use change, which is included under crop cultivation (see Figure 4). The impact is not evenly distributed among the affected countries.
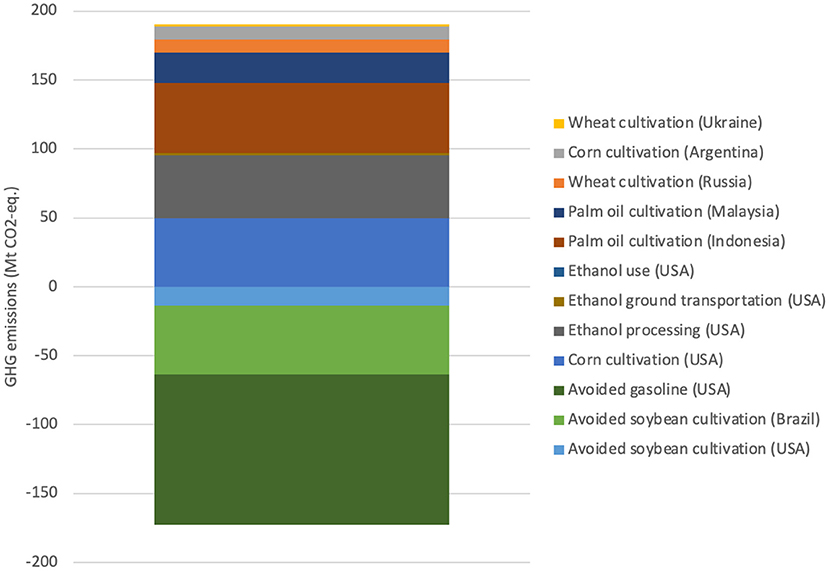
Figure 4. Global annual emissions associated with producing 15 billion gallons of corn ethanol in the USA.
Discussion
The results highlight that the production of 45.1 Mt corn ethanol substitute 28.0 Mt of gasoline, and thereby avoid the emission of 85.2 Mt CO2-eq. Despite the significant avoided emission of GHGs, as well as those from soybean production being substituted in both the USA and Brazil, the net level of GHG emissions is positive (by 18.0 Mt CO2-eq.) due to GHG emissions from ethanol processing and palm oil cultivation in South-East Asia, which are larger than the avoided emissions and therefore negate any climate benefit that substituting gasoline and soybean cultivation incurs. The net results show that corn ethanol has a carbon footprint of 105.1 gCO2-eq/MJ, which is 17% higher than that of gasoline (90.2 gCO2-eq/MJ).
While meeting the renewable energy target may meet domestic climate policy goals, as the USA would save 25.9 Mt CO2-eq., the effect abroad would be mixed:
• Malaysia and Indonesia (South-East Asia) would see their emissions increase significantly (by 72.6 Mt CO2-eq.),
• Brazil and Argentina (South-East America) would decrease emissions by 40.3 Mt CO2-eq, and
• Russia and the Ukraine (Europe/Asia) would increase emissions by 11.5 Mt CO2-eq.
A substantial contribution is made from land use change: 22.4 Mt CO2-eq., or 28% of the emissions in the crop cultivation phases of the life cycle, in which it is included.
There is no scientific consensus on how to capture dLUC and iLUC emissions in the carbon footprint of an agricultural commodity, making bioenergy systems notoriously challenging to model (see e.g., Cherubini et al., 2009) and giving rise to disparate carbon-footprint estimates (Pereira et al., 2019; Brandão et al., 2021b). Currently, standards are being developed by the GHG Protocol that give guidance on this methodological issue. Standardization is welcomed since the exclusion of LUC considerations may lead to contradicting insights (e.g., Lee et al., 2021).
Conclusions
The sustainability of ethanol has been scrutinized over the last years (e.g., Farrell et al., 2006; Hill et al., 2006). Concerns over the climate change mitigation potential of biofuels (e.g., Creutzig et al., 2015), in particular, resulted in a debate that got richer by including LUC (e.g., Foley et al., 2005; Silalertruksa et al., 2009; Aoun et al., 2013; Berndes et al., 2013; Qin et al., 2016; Saez de Bikuña et al., 2017) and iLUC (e.g., Fargione et al., 2010; Hertel et al., 2010; Plevin et al., 2010; Di Lucia et al., 2012; Ahlgren and Di Lucia, 2014), which helped in making more robust and comprehensive estimations of the climate change impact of biofuels.
We estimated the carbon footprint associated with meeting the annual target of 15 billion gallons of ethanol from corn in the USA, including direct and indirect effects, such as emission associated with cropland expansion and intensification, as well with the balancing of the various markets (food, feed, vegetable oil and export) that occurs when diverting corn from other uses and when co-producing DDGS that is subsequently used as animal feed.
We conclude that using corn for ethanol as a gasoline-substitute for transportation fuel is ineffective if the aim is to mitigate global climate change. There are more effective negative emission technologies that are less land intensive (Brandão et al., 2021c). The potential for first-generation biofuels used as transportation fuels to mitigate climate change has been extensively questioned (e.g., Brandão, 2020), as have bio-based products in general (e.g., Weiss et al., 2012). Similarly, the concept of iLUC is disputed by many, but is increasingly recognized as too important a parameter to be ignored (e.g., Muñoz et al., 2015). What appears to be universally recognized is the need to not shift burdens between different impacts (e.g., Yang et al., 2012) or countries—a phenomenon known as leakage (e.g., de Gorter and Drabik, 2011; de Gorter et al., 2013)—for which the net effects have to be properly estimated and challenging parameters should not be avoided because of their inherent uncertainty (Weidema, 2009).
Data Availability Statement
The raw data supporting the conclusions of this article will be made available by the authors, without undue reservation.
Author Contributions
MB: conceptualization, data curation, formal analysis, funding acquisition, investigation, methodology, project administration, resources, software, supervision, validation, visualization, writing—original draft, and writing—review and editing.
Conflict of Interest
The author declares that the research was conducted in the absence of any commercial or financial relationships that could be construed as a potential conflict of interest.
The reviewer JA declared a shared affiliation with the author to the handling Editor.
Publisher's Note
All claims expressed in this article are solely those of the authors and do not necessarily represent those of their affiliated organizations, or those of the publisher, the editors and the reviewers. Any product that may be evaluated in this article, or claim that may be made by its manufacturer, is not guaranteed or endorsed by the publisher.
Acknowledgments
The author would like to acknowledge Mudit Chordia, Annette Cowie, Hans Langeveld, Keith Kline, Virginia Dale, Debo Oladosu, Uwe Fritsche, the International Energy Agency (IEA) Bioenergy, and KTH—Royal Institute of Technology for the support provided.
Abbreviations
CO2, Carbon dioxide; DDGS, Dried distillers’ grains with solubles, ; dLUC, direct Land Use Change; EISA, Energy Independence and Security Act; FAO, Food and Agriculture Organization of the United Nations; FAOSTAT, FAO Corporate Statistical Database; GHG, Greenhouse gas; GWP, Global Warming Potential; iLUC, indirect Land Use Change; LCA, Life Cycle Assessment; LUC, Land Use Change; Mt, Million metric tons; N, Nitrogen; PgC, Petagram (1015 grams) of Carbon; PJ, Petajoule (1015 joules); RFS, Renewable Fuel Standard; USA, United Stated of America; USDA, United States Department of Agriculture.
References
Ahlgren, S., and Di Lucia, L. (2014). Indirect land use changes of biofuel production-a review of modelling efforts and policy developments in the European Union. Biotechnol. Biofuels 7, 1–10. doi: 10.1186/1754-6834-7-35
ANL. (2020). GREET Model. Available online at: https://greet.es.anl.gov/ (accessed April 20, 2021).
Aoun, W. B., Gabrielle, B., and Gagnepain, B. (2013). The importance of land use change in the environmental balance of biofuels. OCL Oléagineux Corps Gras Lipides. 20, 1–12. doi: 10.1051/ocl/2013027
Arneth, A., Sitch, S., Pongratz, J., Stocker, B. D., Ciais, P., Poulter, B., et al. (2017). Historical carbon dioxide emissions caused by land-use changes are possibly larger than assumed. Nat. Geosci. 10, 79–84. doi: 10.1038/ngeo2882
Berndes, G., Ahlgren, S., Börjesson, P., and Cowie, A. L. (2013). Bioenergy and land use change-state of the art. Wiley Interdiscipl. Rev. Energy Environ. 2, 282–303. doi: 10.1002/wene.41
Brandão, M. (2020). “Do bioenergy, bioeconomy and circular economy systems mitigate climate change? Insights from life cycle assessment,” in Handbook of the Circular Economy, eds M. Brandão, D. Lazarevic, and G. Finnveden (Cheltenham; Northampton, MA: Edward Elgar Publishing), 396–409.
Brandão, M., Azzi, E., Novaes, R. M., and Cowie, A. (2021a). The modelling approach determines the carbon footprint of biofuels: the role of LCA in informing decision makers in government and industry. Clean. Environ. Syst. 2:100027. doi: 10.1016/j.cesys.2021.100027
Brandão, M., Lamers, P., Olfe-Kraeutlein, B., Rickels, W., Sick, V., Van Der Spek, M., et al. (2021c). Editorial: developing and deploying negative emission technologies: system-level assessment and rationalization. Front. Clim. 3:707872. doi: 10.3389/fclim.2021.707872
Brandão, M., Milà i Canals, L., and Clift, R. (2011). Soil organic carbon changes in the cultivation of energy crops: implications for GHG balances and soil quality for use in LCA. Biomass Bioenergy 35, 2323–2336. doi: 10.1016/j.biombioe.2009.10.019
Brandão, M., Milà I Canals, L., and Clift, R. (2021b). Food, Feed, Fuel, Timber or Carbon sink? Towards sustainable land use: A Consequential Life Cycle Approach. Dordrecht: Springer Briefs in Environmental Science, 125.
BSI. (2011). Specification for the Assessment of the Life Cycle Greenhouse Gas Emissions of Goods and Services (PAS 2050). London: British Standards Institution.
Buendia, E., Tanabe, K., Kranjc, A., Baasansuren, J., Fukuda, M., Ngarize, S., et al. (2019). Refinement to the 2006 IPCC Guidelines for National Greenhouse Gas Inventories. Geneva: IPCC, 194.
Carré, F., Hiederer, R., Blujdea, V., and Koeble, R. (2010). Background Guide for the Calculation of Land Carbon Stocks in the Biofuels Sustainability Scheme Drawing on the 2006 IPCC Guidelines for National Greenhouse Gas Inventories. Luxembourg: Joint Research Center, European Commission.
Cherubini, F., Bird, N. D., Cowie, A., Jungmeier, G., Schlamadinger, B., and Woess-Gallasch, S. (2009). Energy- and greenhouse gas-based LCA of biofuel and bioenergy systems: Key issues, ranges and recommendations. Resour. Conserv. Recycl. 53, 434–447. doi: 10.1016/j.resconrec.2009.03.013
Creutzig, F., Ravindranath, N. H., Berndes, G., Bolwig, S., Bright, R., Cherubini, F., et al. (2015). Bioenergy and climate change mitigation: an assessment. GCB Bioenergy 7, 916–944. doi: 10.1111/gcbb.12205
Dalgaard, R., Schmidt, J., Halberg, N., Christensen, P., Thrane, M., and Pengue, W. A. (2008). LCA of soybean meal. Int. J. Life Cycle Assess. 13, 240–254. doi: 10.1065/lca2007.06.342
de Gorter, H., and Drabik, D. (2011). Components of carbon leakage in the fuel market due to biofuel policies. Biofuels 2, 119–121. doi: 10.4155/bfs.11.8
de Gorter, H., Drabik, D., and Just, D. R. (2013). The perverse effects of biofuel public-sector policies. Annu. Rev. Resour. Econ. 5, 463–483. doi: 10.1146/annurev-resource-091912-151933
Di Lucia, L., Ahlgren, S., and Ericsson, K. (2012). The dilemma of indirect land-use changes in EU biofuel policy - an empirical study of policy-making in the context of scientific uncertainty. Environ. Sci. Policy 16, 9–19. doi: 10.1016/j.envsci.2011.11.004
Donke, A. C. G., Novaes, R. M. L., Pazianotto, R. A. A., Moreno-Ruiz, E., Reinhard, J., Picoli, J. F., et al. (2020). Integrating regionalized Brazilian land use change datasets into the ecoinvent database: new data, premises and uncertainties have large effects in the results. Int. J. Life Cycle Assess. 25, 1027–1042. doi: 10.1007/s11367-020-01763-3
Edgerton, M. D. (2009). Increasing crop productivity to meet global needs for feed, food, and fuel. Plant Physiol. 149, 7–13. doi: 10.1104/pp.108.130195
Edwards, R., Declan Mulligan, D., and Marelli, L. (2010). Indirect Land Use Change From Increased Biofuels Demand - Comparison of Models and Results for Marginal Biofuels Production From Different Feedstocks. Luxembourg: Publication Office of the European Union, 145.
European Commission. (2010). Commission decision on guidelines for the calculation of land carbon stocks for the purpose of Annex V to Directive 2009/28/EC, 2010/335/EU. Off. J. 151, 19–41.
European Union. (2009). Directive 2009/28/EC of the European Parliament and of the Council of 23 April 2009 on the promotion of the use of energy from renewable sources and amending and subsequently repealing Directives 2001/77/EC and 2003/30/EC. Off. J. Eur. Union 5:2009.
European Union. (2015). Directive 2015/1513 of 9 September 2015 amending Directive 98/70/EC relating to the quality of petrol and diesel fuels and amending Directive 2009/28/EC on the promotion of the use of energy from renewable sources. Off. J. Eur. Union 239, 1–15.
FAOSTAT. (2021). Statistical Database. Retrieved from: https://www.fao.org/faostat/en/#home (accessed May 31, 2021).
Fargione, J., Hill, J., Tilman, D., Polasky, S., and Hawthorne, P. (2008). Land clearing and the biofuel carbon debt. Science 319, 1235–1238. doi: 10.1126/science.1152747
Fargione, J. E., Plevin, R. J., and Hill, J. D. (2010). The ecological impact of biofuels. Annu. Rev. Ecol. Evol. Syst. 41, 351–377. doi: 10.1146/annurev-ecolsys-102209-144720
Farrell, A. E., Plevin, R. J., Turner, B. T., Jones, A. D., O'Hare, M., and Kammen, D. M. (2006). Ethanol can contribute to energy and environmental goals. Science 311, 506–508. doi: 10.1126/science.1121416
Foley, J. A., DeFries, R., Asner, G. P., Barford, C., Bonan, G., Carpenter, S. R., et al. (2005). Global consequences of land use. Science 309, 570–574. doi: 10.1126/science.1111772
Friedlingstein, P., O'Sullivan, M., Jones, M. W., Andrew, R. M., Hauck, J., Olsen, A., et al. (2020). Global carbon budget. Earth Syst. Sci. Data 12, 3269–3340. doi: 10.5194/essd-12-3269-2020
GAO. (2016). Renewable Fuel Standard: Program Unlikely to Meet Its Targets for Reducing Greenhouse Gas Emissions. United States Government Accountability Office.
Hertel, T. W., Golub, A. A., Jones, A. D., O'Hare, M., Plevin, R. J., and Kammen, D. M. (2010). Effects of US maize ethanol on global land use and greenhouse gas emissions: estimating market-mediated responses. BioScience 60, 223–231. doi: 10.1525/bio.2010.60.3.8
Hill, J., Nelson, E., Tilman, D., Polasky, S., and Tiffany, D. (2006). Environmental, economic, and energetic costs and benefits of biodiesel and ethanol biofuels. Proc. Natl. Acad. Sci. U. S. A. 103, 11206–11210. doi: 10.1073/pnas.0604600103
ISO. (2006a). 14040:2006. Environmental Management – Life Cycle Assessment – Principles and Framework. International Organization for Standardization (ISO), 20.
ISO. (2006b). 14044:2006. Environmental Management – Life Cycle Assessment – Requirements and Guidelines. International Organization for Standardization (ISO), 46.
ISO. (2013). ISO/TS 14067:2013 Greenhouse Gases – C Footprint of Products – Requirements and Guidelines for Quantification and Communication. International Organization for Standardization.
Johnson, E. (2009). Goodbye to carbon neutral: getting biomass footprints right. Environ. Impact Assess. Rev. 29, 165–168. doi: 10.1016/j.eiar.2008.11.002
Lee, U., Kwon, H., Wu, M., and Wang, M. (2021). Retrospective analysis of the US corn ethanol industry for 2005-2019: implications for greenhouse gas emission reductions. Biofuels Bioprod. Biorefining 15, 1318–1331. doi: 10.1002/bbb.2225
Moreno Ruiz, E., Valsasina, L., Fitzgerald, D., Brunner, F., Symeonidis, A., Bourgault, G., et al. (2019). Documentation of Changes Implemented in the Ecoinvent Database v3. 6. Zürich: Ecoinvent Association.
Muñoz, I., Schmidt, J. H., Brandão, M., and Weidema, B. P. (2015). Rebuttal to ‘Indirect land use change (iLUC) within life cycle assessment (LCA)-scientific robustness and consistency with international standards'. Glob. Change Biol. Bioenergy 7, 565–566. doi: 10.1111/gcbb.12231
Myhre, G., Shindell, D., Bréon, F. M., Collins, W., Fuglestvedt, J., Huang, J., et al. (2013). “Anthropogenic and natural radiative forcing. Climate change 2013: the physical science basis, “in Contribution of Working Group I to the Fifth Assessment Report of the Intergovernmental Panel on Climate Change (Cambridge: Cambridge University Press), 659–740.
Novaes, R. M., Pazianotto, R. A., Brandão, M., Alves, B. J., May, A., and Folegatti-Matsuura, M. I. (2017). Estimating 20-year land-use change and derived CO2 emissions associated with crops, pasture and forestry in Brazil and each of its 27 states. Glob. Change Biol. 23, 3716–3728. doi: 10.1111/gcb.13708
Palmer, J., and Owens, S. (2015). Indirect land-use change and biofuels: the contribution of assemblage theory to place-specific environmental governance. Environ. Sci. Pol. 53, 18–26. doi: 10.1016/j.envsci.2014.10.010
Panichelli, L., and Gnansounou, E. (2015). Impact of agricultural-based biofuel production on greenhouse gas emissions from land-use change: key modelling choices. Renew. Sustain. Energy Rev. 42, 344–360. doi: 10.1016/j.rser.2014.10.026
Pereira, L. G., Cavalett, O., Bonomi, A., Zhang, Y., Warner, E., and Chum, H. L. (2019). Comparison of biofuel life-cycle GHG emissions assessment tools: the case studies of ethanol produced from sugarcane, corn, and wheat. Renew. Sustain. Energy Rev. 110, 1–12. doi: 10.1016/j.rser.2019.04.043
Plevin, R. J., Jones, A. D., Torn, M. S., and Gibbs, H. K. (2010). Greenhouse gas emissions from biofuels' indirect land use change are uncertain but may be much greater than previously estimated. Environ. Sci. Technol. 44, 8015–8021. doi: 10.1021/es101946t
Qin, Z., Dunn, J. B., Kwon, H., Mueller, S., and Wander, M. M. (2016). Soil carbon sequestration and land use change associated with biofuel production: empirical evidence. GCB Bioenergy 8, 66–80. doi: 10.1111/gcbb.12237
Rajagopal, D., Hochman, G., and Zilberman, D. (2011). Indirect fuel use change (IFUC) and the lifecycle environmental impact of biofuel policies. Energy Policy 39, 228–233. doi: 10.1016/j.enpol.2010.09.035
Renewable Fuels Association (RFA). (2021). Available online at: https://ethanolrfa.org/markets-and-statistics/annual-ethanol-production (accessed November 12, 2021).
Ros, J. P. M., Overmars, K. P., Stehfest, E., Prins, A. G., Notenboom, J., and van Oorschot, M. (2010). Identifying the Indirect Effects of Bio-Energy Production. Bilthoven: Netherlands Environmental Assessment Agency (PBL). Available online at: http://www.pbl.nl/en/publications/2010/Identifying-the-indirect-effects-of-bio-energy-production.html
Saez de Bikuña, K., Hamelin, L., Hauschild, M. Z., Pilegaard, K., and Ibrom, A. (2017). A comparison of land use change accounting methods: seeking common grounds for key modeling choices in biofuel assessments. J. Clean. Prod. 177, 52–61. doi: 10.1016/j.jclepro.2017.12.180
Schmidt, J., and De Rosa, M. (2020). Certified palm oil reduces greenhouse gas emissions compared to non-certified. J. Clean. Prod. 277:124045. doi: 10.1016/j.jclepro.2020.124045
Schmidt, J. H., and Weidema, B. P. (2008). Shift in the marginal supply of vegetable oil. Int. J. Life Cycle Assess. 13, 235–239. doi: 10.1065/lca2007.07.351
Schmidt, J. H., Weidema, B. P., and Brandão, M. (2015). A framework for modelling indirect land use changes in life cycle assessment. J. Clean. Prod. 99, 230–238. doi: 10.1016/j.jclepro.2015.03.013
Searchinger, T., Edwards, R., Mulligan, D., Heimlich, R., and Plevin, R. (2015). Do biofuel policies seek to cut emissions by cutting food? Science 347, 1420–1422. doi: 10.1126/science.1261221
Searchinger, T., Heimlich, R., Houghton, R. A., Dong, F., Elobeid, A., Fabiosa, J., et al. (2008). Use of US croplands for biofuels increases greenhouse gases through emissions from land-use change. Science 319, 1238–1240. doi: 10.1126/science.1151861
Silalertruksa, T., Gheewala, S. H., and Sagisaka, M. (2009). Impacts of Thai bio-ethanol policy target on land use and greenhouse gas emissions. Appl. Energy 86, S170–S177. doi: 10.1016/j.apenergy.2009.05.010
Thompson, W., Whistance, J., and Meyer, S. (2011). Effects of US biofuel policies on US and world petroleum product markets with consequences for greenhouse gas emissions. Energy Policy 39, 5509–5518. doi: 10.1016/j.enpol.2011.05.011
Tian, H., Lu, C., Ciais, P., Michalak, A. M., Canadell, J. G., Saikawa, E., et al. (2016). The terrestrial biosphere as a net source of greenhouse gases to the atmosphere. Nature 531, 225–228. doi: 10.1038/nature16946
USDA. (2021). U.S. Bioenergy Statistics: All Tables in One. Retrieved from: https://www.ers.usda.gov/data-products/u-s-bioenergy-statistics/ (accessed May 31, 2021).
U. S. Government. (2005). Energy Policy Act of 2005 Public Law 109-59, 109th Congress. Washington, DC.
Weidema, B. P. (2009). Avoiding or ignoring uncertainty. J. Ind. Ecol. 13, 354–356. doi: 10.1111/j.1530-9290.2009.00132.x
Weiss, M., Haufe, J., Carus, M., Brandão, M., Bringezu, S., Hermann, B., et al. (2012). A review of the environmental impacts of biobased materials. J. Ind. Ecol. 16, S169–S181. doi: 10.1111/j.1530-9290.2012.00468.x
Wicke, B., Verweij, P., Van Meijl, H., Van Vuuren, D. P., and Faaij, A. P. (2012). Indirect land use change: review of existing models and strategies for mitigation. Biofuels 3, 87–100. doi: 10.4155/bfs.11.154
Keywords: indirect land use change (iLUC), corn ethanol, climate change mitigation, life cycle assessment, carbon footprint
Citation: Brandão M (2022) Indirect Effects Negate Global Climate Change Mitigation Potential of Substituting Gasoline With Corn Ethanol as a Transportation Fuel in the USA. Front. Clim. 4:814052. doi: 10.3389/fclim.2022.814052
Received: 12 November 2021; Accepted: 14 February 2022;
Published: 09 March 2022.
Edited by:
Peter Haas, University of Massachusetts Amherst, United StatesReviewed by:
Edmundo Molina-Perez, Tecnologico de Monterrey, MexicoJeetendra Prakash Aryal, International Maize and Wheat Improvement Center, Mexico
Copyright © 2022 Brandão. This is an open-access article distributed under the terms of the Creative Commons Attribution License (CC BY). The use, distribution or reproduction in other forums is permitted, provided the original author(s) and the copyright owner(s) are credited and that the original publication in this journal is cited, in accordance with accepted academic practice. No use, distribution or reproduction is permitted which does not comply with these terms.
*Correspondence: Miguel Brandão, bWlndWVsLmJyYW5kYW9AYWJlLmt0aC5zZQ==