 Caleb M. Woodall
 Colin F. McCormick
- 1Carbon Management Research Initiative, Center on Global Energy Policy, Columbia University School of International and Public Affairs, New York, NY, United States
- 2Science, Technology and International Affairs Program, Edmund A. Walsh School of Foreign Service, Georgetown University, Washington, DC, United States
- 3Carbon Direct, New York, NY, United States
In the context of climate mitigation, biomass has traditionally been viewed as a means to deliver low-carbon energy products. Adding carbon capture and sequestration (CCS) to a bioenergy production process can yield net-removals of CO2 from the atmosphere, albeit at an increased cost. Recently, the Aines Principle was established, stating that at some carbon price, the revenue generated from CO2 removal will exceed the revenue generated from energy production from a given bioconversion process. This principle has only been illustrated for the theoretical conversion of a non-specific biomass source, and has not yet been demonstrated to show real carbon prices that can tip the scale for biomass carbon removal to be more economically favorable than bioenergy production. In this study, we demonstrate the Aines Principle at work in two specific examples of biomass conversion. The first case involves a Chinese municipal solid waste incineration plant, with and without CCS. The second case compares using forestry residue solely for energy production (via gasification), solely for carbon removal (via burial) or both. By comparing the energy and carbon revenue streams under a range of carbon prices, we show that carbon removal revenue can exceed energy revenue at currently available carbon prices below $200/tCO2.
Introduction
Biomass has been a quintessential part of the climate solution for decades. Traditionally, the use of biomass in the climate context has been focused on the production of bioenergy as a lower-emitting solution to fossil fuels. While burning biofuels still produces CO2, the technology is considered carbon neutral because the biomass is the result of photosynthetically removing an equivalent amount of CO2 from the atmosphere. If the bioenergy production is coupled with carbon capture and storage (BECCS), the system can become carbon negative and achieve carbon dioxide removal (CDR). With the increasing realization of the need for CDR to meet climate goals and avoid 2°C warming, the role of biomass has received increased attention. After all—biomass is one of nature's own CDR systems, drawing down a net 7.6 GtCO2e per year today in forests alone (Harris et al., 2021) and even up to thousands of gigatons of CO2 in the Arctic during the middle Eocene period (Speelman et al., 2009).
In December 2020, a new term was introduced to shift the emphasis of biomass utilization from primarily bioenergy production to primarily CDR: BiCRS (Biomass Carbon Removal and Storage) (Sandalow et al., 2020). With this, the Aines Principle was introduced, stating that for some carbon price, a ton of biomass can become more valuable for its use in CDR than for its use to produce bioenergy. To demonstrate this principle, a simple chart was produced that relates carbon price to the value of carbon removal, with references to the values of oil, gas, coal, and wood pellets (Figure 1). This chart demonstrates that, for example, at a carbon price of about $35/tCO2, the carbon within biomass—representing carbon removed from the atmosphere—is more valuable than the energy it can provide at a value equivalent to that of natural gas. Similarly, if the energy provided by the biomass is valued at an equivalent price to oil (or coal) the breakeven carbon price is higher (or lower).
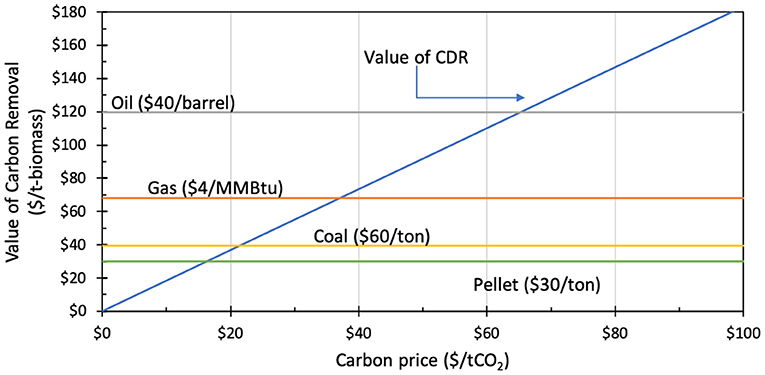
Figure 1. Change in the CDR value of biomass with increasing carbon price, compared to the value of reference energy sources. Based on figure in ICEF BiCRS report (Sandalow et al., 2020).
Figure 1 is a helpful tool to illustrate the point of the Aines Principle that at some carbon price, the carbon content of biomass is worth more than the energy content. Moreover, the carbon prices at which the biomass carbon value exceeds the value of traditional energy products (shown in Figure 1 to be about $17–65/tCO2) are sufficiently low that they are in the range of existing public subsidies and private purchases, as shown in Table 1. The US Section 45Q tax credit was recently updated under the Inflation Reduction Act, now providing $85/tCO2 for carbon emissions captured from energy production and industrial facilities (Bright, 2022). From July 2021 to July 2022, credits provided by the California Low-Carbon Fuel Standard (LCFS) were in the range of $117–188/tCO2 (California Air Resources Board, 2022), and permits from the EU Emission Trading System (ETS) ranged from about e54–97/tCO2 during the same period (Tradingeconomics, 2021). Several other nations across the globe are considering implementing carbon taxes or ETS schemes, or have already scheduled them for a later date (World Bank, 2022). Recently, corporations such as Microsoft, Shopify and Stripe have begun directly procuring carbon removal offsets as part of a nascent voluntary market; Stripe announced purchase prices ranging from $200 to 2,000/tCO2 (Stripe, 2021). As carbon prices in this range become an ever clearer reality, the time is ripe to re-think the way we view biomass within the portfolio of climate solutions, and shift from a viewpoint of producing bioenergy with some “bonus” carbon removal to a new viewpoint that prioritizes achieving carbon removal with some “bonus” bioenergy.
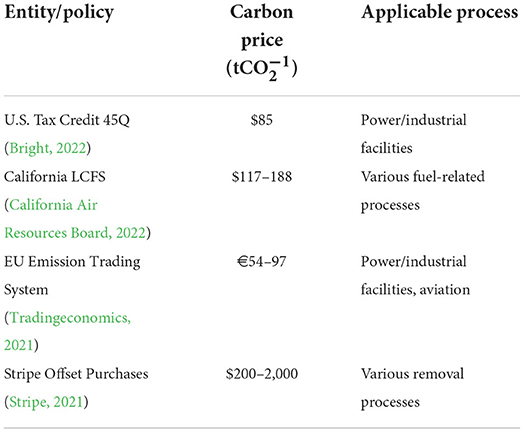
Table 1. Carbon prices currently paid by public policies and private corporations.
However, in order to validate this shift in thinking it is important to address the complexities of real-world biomass carbon removal and energy conversion. Figure 1, while broadly useful for visualization, is based on the simplified assumption that one bone-dry ton of biomass contains half a ton of carbon (0.5 tC/bdt), and is agnostic to different biomass types and conversion technologies. In fact, these factors are very influential in determining the actual realized revenue of energy production, the cost of capturing and removing CO2, and the production of process emissions. Therefore, the generalized approach of the previous treatment of the Aines Principle needs to be put on a firmer quantitative footing by including these important process-specific factors.
On a related note, some authors have begun to argue for a shift in thinking about the best role of biomass in climate for other reasons. A report by Material Economics observes that bioenergy is becoming uncompetitive with lower-cost solutions in road transport, low-temperature heat, power generation, and shipping, and concludes that higher-value uses of bioenergy will soon be preferred, like providing high-temperature industrial heat, liquid fuels for long-haul aviation, or negative emissions (Material Economics, 2021). In assessing biomass conversion processes for higher value purposes such as these, Patrizio et al. (2021) demonstrated that the processes that are most efficient at producing bioenergy do not necessarily provide the largest carbon mitigation, showing higher mitigation is associated with capturing CO2 at higher rates and displacing more carbon-intensive alternatives. A similar observation was made previously by Mac Dowell and Fajardy (2017), who showed that low-efficiency BECCS power plants can deliver more carbon removals at a lower cost than high-efficiency plants by requiring more biomass to produce one MWh of energy (producing more CO2 per MWh), and by having lower initial investment costs than high-efficiency plants. Due to their advantages, these low-efficiency plants are shown to yield a faster turnaround time on their initial investment (assuming a fixed carbon price of about $100/tCO2). While these publications indirectly validate the Aines Principle by discussing the notion that carbon removal is a more valuable use of biomass than bioenergy, they do not directly demonstrate the principle by comparing the revenue streams generated by energy and CO2 to identify a breakeven carbon price.
A closer, process-specific assessment of the balance of the energy and carbon values of biomass is needed for two primary reasons. First, it will help to inform policies on carbon prices in public and private offset markets by providing better insight into relevant carbon values that tip the scale for specific biomass conversion technologies. While some markets may already have carbon prices that incentivize carbon removal over bioenergy production (as demonstrated here), others looking to follow suit could benefit from this sort of analysis. Second, it could inform technology decisions, where processes can be optimized for carbon removal rather than energy production.
In this study, we demonstrate the Aines Principle at work in two specific examples of biomass conversion. By comparing the revenue generated from energy production with the potential revenue from carbon removal under a range of carbon prices, we show that carbon removal revenue can exceed energy revenue at currently available carbon prices below $200/tCO2. Both of the cases we consider focus on conversion of waste biomass, taken as the more sustainable option over dedicated “energy crops” (Welfle et al., 2017). The first case will compare municipal solid waste (MSW) incineration, with and without CCS. The second case will compare using forestry residue for solely energy production (via gasification), solely carbon removal (via burial), or both (BECCS/BiCRS). The demonstration of the Aines Principle through these two cases will be followed by a discussion of the implications to broader biomass usage and energy systems, along with limitations of the study. Afterward, the conclusion will summarize the key findings of the study and provide suggestions for how the work shown here can be used in the future. To facilitate a faster dissemination of the key ideas in this work, the methodology used to construct the demonstration figures is explained after the conclusion.
Demonstration of the Aines Principle
Case 1—Municipal solid waste
The first case considers the generation of electricity through incineration of municipal solid waste (MSW). About 11% of the world's 2 billion tons of MSW is incinerated annually, primarily in high-income countries with land constraints (Kaza et al., 2018). Globally, there are more than 2,400 MSW plants with incineration in operation, and this number could increase to more than 2,700 by 2027 (Kearns, 2019). Capturing the CO2 emitted from an incineration plant can yield carbon removals, although to varying degrees depending on the MSW composition. Rosa et al. use a wide range of 42–71% to represent the biogenic portion of CO2 emissions in European incineration plants (Rosa et al., 2021).
A recent analysis of a Chinese MSW incineration plant analyzes the economic and environmental impact of capturing CO2 emissions through three different CCS technologies (i.e., MEA, P/VSA, and oxyfuel) (Tang and You, 2018). Without CCS, the incineration plant produces electricity at a rate of slightly more than 272 kWh per ton of MSW and sells it to the grid for about $0.105/kWh. This process emits 586 kgCO2 per ton of MSW, and assuming the carbon content of the waste is 57% biogenic, there are 334 kgCO2 that could be captured to yield carbon removals from the atmosphere.
The oxyfuel CCS case was demonstrated by Tang and You to capture the most CO2 at the least cost (Tang and You, 2018). Adding oxyfuel CCS to the incineration plant captures 95% of the incinerator's emissions, but reduces the electricity output to 111 kWh/tMSW and adds capital expenses (with a capital charge factor of about 8.4%) and operating expenses, as described in the original analysis by Tang and You (2018). Capturing the CO2 from the incinerator allows the plant to sell carbon removal credits in addition to its electricity product. The two revenue streams at different carbon prices are shown in Figure 2, with a fixed rate at which electricity can be sold to the grid ($0.105/kWh).
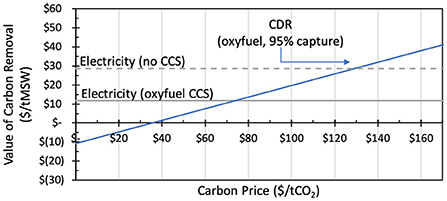
Figure 2. Comparison of electricity- and carbon-related revenue streams from MSW incineration.
When no carbon price is available, installing oxyfuel CCS on the incineration plant yields a net-expense, illustrated by a negative value of CDR in Figure 2. This led the original authors to conclude that CCS technologies are currently too immature to be installed on Chinese incineration plants (Tang and You, 2018). However, Figure 2 demonstrates that a carbon price of about $35/tCO2 rectifies the added expense of CCS installation. Further, a carbon price of about $70/tCO2 makes the removed CO2 more valuable than the electricity produced by an incineration + CCS plant, and at a breakeven price of about $130/tCO2 the CO2 revenue exceeds the electricity revenue that would be realized by the incineration plant without installing CCS. While this full range of carbon prices is currently available in public and private US carbon markets, they are not yet available in China. Although China recently introduced a cap and trade carbon market, the opening day carbon price was <$8/tCO2 (Nakano and Kennedy, 2021), and it does not yet have a market dedicated to carbon removals.
Case 2—Forestry residue
A more complex case considers various ways to remove carbon using forestry residue, which is generated from forest operations such as clearcutting, logging, and thinning, as well as from natural disturbances like fires and wind throw (Braghiroli and Passarini, 2020). Several national-level assessments show that substantial amounts of forestry residue are generated each year in countries including but not limited to Canada (~61 Mt) (Mansuy et al., 2017), Mexico (~1.4 Mt) (Honorato-Salazar and Sadhukhan, 2020), and Europe (~320 Mt, primarily in Sweden and Finland) (Hamelin et al., 2019).
Forestry residues present a suitable feedstock for gasification because of their relatively low moisture content. Larson et al. describe a gasification process that produces a combination of electricity and fuel—either Fischer-Tropsch (FT) fuels or liquid hydrogen (Larson et al., 2009). There are two hydrogen-producing variations: one where hydrogen and power are produced in a nearly-even split (H5050), and one where hydrogen production is maximized while producing minimal power (HMAX). Assuming this process is located in California, as assessed by Baker et al. (2020), the three energy products of electricity, FT fuels, and hydrogen can be sold at wholesale prices of $0.06/kWh, $2.35/gal, and $2.90–3.80/kg. Alternatively, the forestry residue could be directly buried, as proposed by Zeng (2008) and Zeng and Hausmann (2022). While this method would not provide any energy-based revenue, it avoids the conversion of carbon to CO2 emissions or fuels, presenting the potential to sequester all biogenic carbon from the forestry residue.
The comparison of potential energy and carbon revenue streams from burying or gasifying forestry residue is shown in Figure 3. Just as discussed with Case 1, implementing CCS on a gasification process brings capital and operational expenses and decreases the net energy output of the plant. The costs of gasification with CCS are calculated by estimating the cost of biomass conversion, H2 liquefaction, and the capture, drying, compression, transport and injection of CO2 as estimated previously (Larson et al., 2009; Baker et al., 2020). Capital expenses are assumed to be paid with a capital charge factor of 15%, and the cost of gathering forestry residue feedstock is estimated at $50 per dry ton (Baker et al., 2020). The cost of wood burial involves land purchase, construction, and operation estimated to be about $13–22 per tCO2 sequestered (Zeng and Hausmann, 2022), in addition to the $50/bdt feedstock costs. For a conservative estimate, we use the upper bound cost of $22. Additional information on these cost estimations is provided in the methods section.
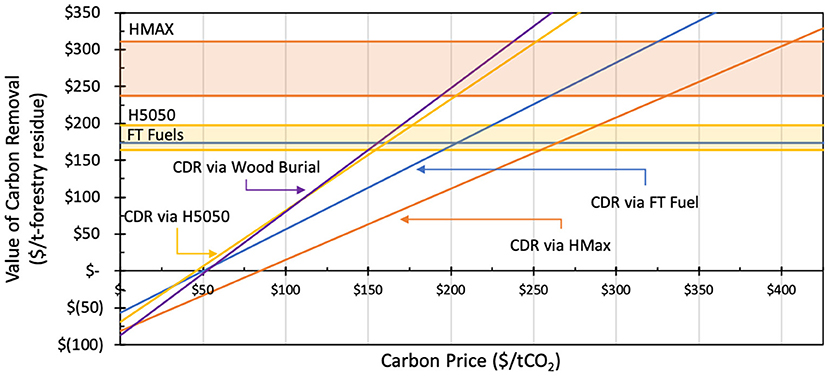
Figure 3. Comparison of the energy- and carbon-related revenues from gasification of forestry residue. Also shown is the estimated carbon revenue from burying an equivalent amount of forestry residue. A range of liquid hydrogen prices is given, as described in the text.
One point to note is that the y-axis values are much higher than in Figure 2 as a result of producing higher-value energy products. However, installing carbon capture to the gasification process adds considerable costs. Where producing power and FT fuels generates a revenue of about $165/bdt, the net profit is estimated to be about –$60/bdt. Similarly, while the hydrogen production cases generate energy revenues of up to about $200/bdt (H5050) and $310/bdt (HMAX), the net profit is –$76/bdt and –$59/bdt, respectively, at the hydrogen wholesale price of $3.80/kg (see Table 6).
As demonstrated in Case 1 with MSW incineration, adding CCS to gasification requires a non-zero carbon price to become economically feasible. Specifically, the carbon price that allows the gasification + CCS processes to become economically feasible is about $50/tCO2 for FT fuels and H5050, and about $85/tCO2 for HMAX. This is within the range of BECCS gasification costs of $30–150/tCO2 used in integrated assessment models (IAMs) (Fuss et al., 2018; Butnar et al., 2020). The energy products in Case 2 are higher value, meaning higher breakeven carbon prices are required for the carbon-based revenue to exceed the energy-based revenue and demonstrate the Aines Principle. These carbon prices are about $205/tCO2 (FT fuels), $150–175/tCO2 (H5050), and $325–400/tCO2 (HMAX).
Without any energy-related revenue, CDR via wood burial bears all feedstock and facility costs. However, because it is assumed to retain all of the biogenic carbon, a carbon price of $50/tCO2 enables burial to generate a net profit. At a carbon price of about $155/tCO2, one ton of forestry residue is more valuable for CDR via wood burial than it is for production of power and FT fuels; and at a carbon price range of about $150–170/tCO2, forestry residue burial becomes more economical than the H5050 process. These prices are well-within the range of what has been purchased on the voluntary offset market and through the California LCFS.
Also illustrated in Figure 3 is the choice of optimizing a process for energy production vs. carbon removal. Without a market for carbon removal, one would likely decide to use gasification to produce hydrogen via the HMAX configuration, as this process generates more energy-related revenue and is more profitable than the other two gasification configurations (shown explicitly in Table 6). Producing hydrogen generally results in a higher volume of CO2 that is captured and stored because all of the biogenic carbon is available for capture (as opposed to only 75% when producing FT fuels). However, the lack of power production in the HMAX configuration results in using carbon-intensive power from the grid to power carbon capture, resulting in a lower net-removal of CO2 compared to the H5050 process. Thus, although the H5050 configuration yields less energy-related revenue, its enhanced production of net carbon removals yields higher carbon-related revenue at carbon prices as low as $50/tCO2.
Discussion
In this study we demonstrated the Aines Principle for two different cases of biomass conversion technologies. That is, these processes generate revenue streams from carbon removal that exceed those from energy production at carbon prices that have already been paid in public and private markets. The Aines Principle has implications for technology decisions, municipal waste management, and climate policy.
Energy, removals, or both?
Biomass presents many potential pathways to achieve emission reductions, including production of electricity, materials, fuels, and heat; if coupled with CCS, it can yield net-carbon removals. While at the surface this might present a “best of both worlds” scenario, where energy can be produced while removing CO2 from the atmosphere, it is not that simple. Not only does adding CCS to a bioconversion process add operating and capital expenses, it also reduces the net output of energy products and their associated revenue streams. This is evidenced by both cases presented here, where additional electricity production is sacrificed to power a carbon capture unit and achieve carbon removals.
Thus, the Aines Principle has implications on technology optimization decisions—where energy production efficiency can be decreased in order to increase carbon removal efficiency, as noted previously (Mac Dowell and Fajardy, 2017) and illustrated in Figure 4. Take Case 2, where the increased hydrogen production of HMAX enables the process to generate a higher energy-related revenue stream than H5050 despite its lower electricity production (shown in Figure 3). However, when adding CCS, the lower electricity production of HMAX causes the process to require external grid electricity and yield less net-removal of CO2 per ton of forestry residue, making H5050 the superior option in terms of carbon removal.
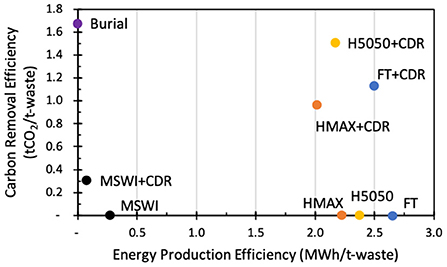
Figure 4. Comparison of the efficiency of energy production and carbon removal for each process studied. Efficiency here is defined as the amount of energy (MWh) or carbon removals (tCO2) generated per ton of waste (MSW or forestry residue).
Decisions on optimizing toward energy production vs. carbon removal can be taken a step further in deciding whether biomass should be used for only carbon removal. In Case 2, burial of forestry residue was compared to gasification processes, proving to be a simpler and often economically superior method of generating carbon removal revenue. This is a result of sequestering 100% of the biomass carbon rather than converting a portion to fuels or uncaptured emissions to the atmosphere. This type of carbon removal has been proposed for other forms of biomass like leaves and municipal waste (Amelse, 2020), and has even spawned a few companies. Charm Industrial converts biomass into bio-oil and injects the oil into underground wells (Pontecorvo, 2021), and Running Tide grows kelp and allows it to sink to the bottom of the ocean (Benveniste, 2021). However, decisions to completely forego energy production must also consider the potential for future changes in energy prices. While a gasification + CCS process might be able to adapt to increased energy value by optimizing back to increased energy efficiency, a project that involves only carbon removal would not have this option.
At the carbon prices identified in Case 1, cities may change the way they look at the treatment of MSW. When MSW is deposited to landfills, it undergoes a slow degradation process that results in CH4 and CO2 emissions, although the extent of this degradation is debated (O'Dwyer et al., 2018; Zhao, 2019). These emissions can be managed by directing the gas to a flare or an energy recovery system at the landfill, or they can be avoided altogether by incinerating the MSW. Many cities incentivize diverting waste from landfills by charging landfill taxes to disposers (CEWEP, 2021), which in turn can provide extra revenue for the incineration plant that burns the waste to produce power. Here, there is already a clear incentive to convert the waste, but not necessarily to capture and remove the CO2. In Case 1, the MSW treatment revenue ($27/tMSW) (Tang and You, 2018) is nearly the same as the electricity revenue without CCS shown in Figure 2, meaning that the carbon revenue exceeds both electricity and MSW treatment revenue at about the same carbon price of $130/tCO2. While there are other important considerations when choosing among different waste management practices, especially their impact on human health and the environment (Giusti, 2009; Iqbal et al., 2020), the potential carbon removal and associated revenue stream generated from capturing biogenic emissions at an incineration plant should be considered as new important factors.
Limitations of this study
It is important to note that some assumptions made in this study present limitations that might change the comparison among different technologies. One limitation is the important uncertainties around biomass burial that might make it a less favorable option than presented in Case 2. Wood burial is still in its early stages and its costs are still not well-characterized (Zeng and Hausmann, 2022); this was addressed by using a conservatively high cost estimate. Further, while geologic storage of CO2 has been performed for decades and is coupled with established methodologies for monitoring and verification of secure storage (US Department of Energy, 2017), the same cannot be said for biomass burial. Although burying biomass does not involve the risks associated with high CO2 pressures (e.g., caprock hydraulic fracturing) (Kelemen et al., 2019), other unique factors exist (e.g., burial pit design, conditions to hinder biomass decomposition) (O'Dwyer et al., 2018; National Academies Press, 2019) for which standards are being established to ensure long-term carbon sequestration (Puro.earth, 2022a,b). Ensuring sequestration of all of the biogenic carbon is important for evaluating this technology, as just a small decrease in the retention of carbon from 100 to 90% would cause the carbon revenue from wood burial to be less than that from the H5050 process in the full domain of carbon prices evaluated (see Figure 5). This demonstrates the importance of storage reliability in all cases, whether stored as biogenic carbon or pure CO2.
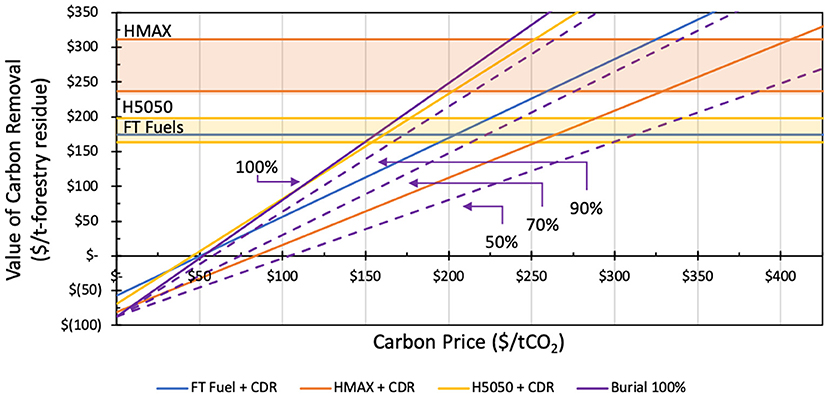
Figure 5. Sensitivity of the carbon-related revenue stream of biomass burial to its carbon removal efficiency, which is varied from 50 to 100%.
Other limitations exist due to assumptions around biomass feedstocks and energy products. While waste biomass was considered here, the results would differ for other biomass sources like dedicated energy crops which introduce substantial emissions from things like fertilizers and land use change. This would decrease the net-removal of CO2, resulting in a higher breakeven carbon price (Fajardy and Mac Dowell, 2017). Changes in energy price assumptions would also impact the results. For example, the two cases used different electricity prices to represent China ($0.105/kWh) and California ($0.05/kWh). Using the latter electricity price for Case 1 would effectively cut the electricity revenue in half, significantly decreasing the breakeven carbon price and making carbon removal a more favorable alternative to energy production. The same effect would occur for decreases to wholesale fuel prices.
Conclusions and future applications
In this study, we assess the recently introduced Aines Principle and demonstrate it for two specific biomass conversion cases—showing that revenue generated from capturing and permanently storing biogenic carbon emissions can exceed revenue from the associated bioenergy production at currently available carbon prices below $200/tCO2. This principle has implications for technology optimization, meaning that energy production efficiency can be sacrificed to achieve increased carbon removal efficiency and, ultimately, a larger net revenue for a project. As carbon removal and storage technology develops, this principle might in some cases lead to the decision of completely forgoing bioenergy production in exchange for pure carbon removal via biomass burial.
The two cases considered here are each associated with specific biomass feedstocks, conversion processes, energy products, and representative economics. There is still a vast array of other cases with different parameters that would alter the ultimate results (i.e., the breakeven carbon price). This study serves as an initial demonstration of the Aines Principle, and offers two simple equations to develop the breakeven carbon price (see Section Methods). Future analyses of biomass conversion processes could use these simple equations to determine the breakeven carbon price under localized conditions of energy prices, carbon prices, and local infrastructure. A larger pool of breakeven carbon prices can help inform policymakers on what levels of carbon incentives can become transformative for carbon removal.
Methods
Case 1—Municipal solid waste
Case 1 calculations were performed using data from Tang and You, who performed an economic and environmental assessment on the addition of three different CCS options to a Chinese MSW incineration plant (Tang and You, 2018). The authors report the various costs of the process, the revenue stream from electricity production, and the net profit. In cases with CCS, the net profit is negative. The authors also report the CO2 captured with each CCS option. In the oxyfuel case, 95% of the emissions from the incineration plant are captured. The authors do not account for biogenic emissions, so a 57% fraction was assumed (median value of the range reported by Rosa et al., 2021). One other modification to the data of Tang and You is the additional cost of CO2 transport and storage, assumed to be $16/tCO2 based on the transport and storage cost tiers identified for China by Smith et al. (2021). The relevant cost values are displayed in Table 2, and the carbon emissions balance is displayed in Table 3.
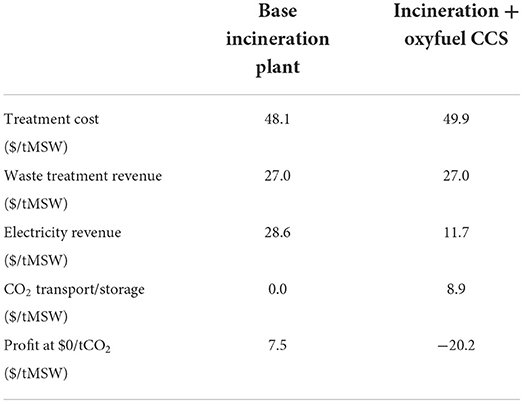
Table 2. Data used to generate plots for Case 1, based on data from Tang and You (2018).
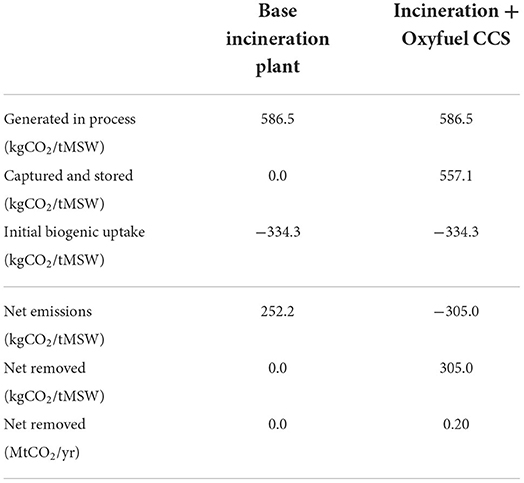
Table 3. Carbon balance for Case 1.
In Figure 2, the horizontal lines for electricity revenue use the two electricity revenue values shown in Table 2. The diagonal line representing CDR revenue in Figure 2 is plotted using Equations (1) and (2):
where Cadded is the additional treatment cost introduced by adding CCS to the base plant, and RCDR is the net revenue stream from CO2 removal credits. Thus, the intersection of electricity revenue and RCDR indicates the breakeven carbon price, where the revenue from CDR exceeds the revenue from energy production despite costs added from CCS.
Case 2—Forestry residue
Case 2 calculations were performed using an economic model based on a gasification process that converts 4,536 dry tons per day into Fischer Tropsch (FT) fuels or hydrogen, along with varying amounts of electricity (Zeng and Hausmann, 2022). In both cases, the gasification process consists of a fluidized-bed gasifier fed with oxygen from an air separation unit (ASU). The gasifier produces a mixture of light combustibles (CO, H2, and CH4), heavies (tars and oils), and minor contaminants at about 1,000°C. After this gas is cleaned and cooled, it is processed to produce the desired products of electricity and either FT fuels or hydrogen. The model was originally developed by Larson et al. (2009) and was more recently adapted for forestry residue by Baker et al. (2020).
Like with Figure 2 (Case 1), Figure 3 (Case 2) is based on the energy revenue streams, added cost, and net CO2 removal of the process. However, the original model of Larson et al. was meant for switchgrass, so the analysis here is slightly adapted for the characteristics of forestry residue. Specifically, the forestry residue is assumed to have a carbon content of about 46% and a calorific value of about 16.7 MJ/kg, based on an average value of wood wastes tested by Greinert et al. (2019). Electricity and fuel generation efficiencies reported by Larson et al. (Table 4) were applied to the forestry residue calorific value to estimate the generation of energy products.
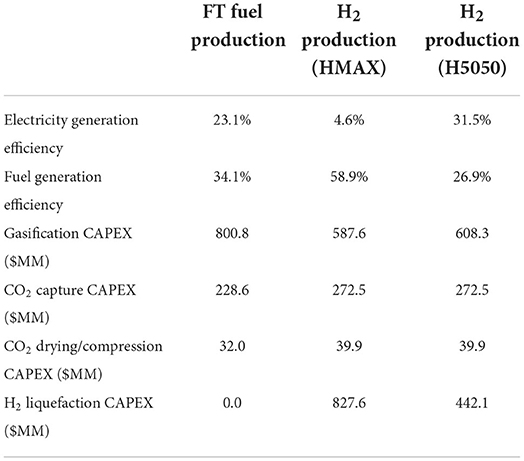
Table 4. Data used to generate plots for Case 2, based on data from Larson et al. (2009) and Baker et al. (2020).
The CAPEX also required some adaptations. The reported overnight CAPEX for the gasification plant was converted to 2019 USD using the chemical engineering plant cost index (CEPCI). Additionally, the equipment was scaled down linearly to reflect the slightly lower calorific value of forestry residue compared to switchgrass (plant thermal capacity of 875 MWth compared to 893 MWth of the original model). The original model by Larson et al. does not include carbon capture or hydrogen liquefaction, so additional CAPEX was added using capacity-dependent equations reported by Baker et al. (2020), also converted to 2019 USD using CEPCI. Final CAPEX values are shown in Table 4.
The biomass treatment cost (i.e., operating expense) also deviates from the original model of Larson et al., and more closely follows the method of Baker et al. A fixed capital charge factor of 15% and a fixed operating and maintenance rate of 4.5% were both applied to the total CAPEX for each case. The feedstock cost was assumed to be $50 per dry ton (Baker et al., 2020). Power demand for the conversion process (shown in Table 5) is based on Larson et al. (linearly scaled as described for CAPEX), while the power demanded by CO2 capture and H2 liquefaction processes are calculated using equations given by Baker et al. Any power needs are initially satisfied by the power produced via the gasification process, and necessary excess power is taken from the grid. The cost of transporting the compressed CO2 100 miles is estimated to be $5/tCO2 for the FT fuel process and $4/tCO2 for the hydrogen processes based on cost curves from Smith et al. (2021) (where the latter case is cheaper per ton because more CO2 is transported). Injection costs are assumed to be $11/tCO2 (Psarras et al., 2020). All treatment costs are incurred based on a plant capacity of 4,536 dry tons of forestry residue per day with an annual plant throughput of 1,325 kt/year (assuming an uptime of 80%).
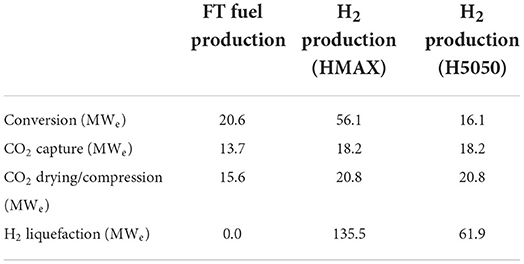
Table 5. Power demand for Case 2, based on data from Larson et al. (2009) and equations from Baker et al. (2020).
The revenue streams from the three energy products of electricity, FT fuels, and hydrogen are estimated based on selling prices of $0.06/kWh, $2.35/gal, and $2.90–3.10/kg, respectively, based on values from Baker et al. (2020). The profit of each case is the difference between total treatment cost and energy-based revenue. These final values (shown in Table 6) are used in Equations (1) and (2) to generate the plot shown in Figure 3. The cost of CO2 transport and storage (required for Equation 1) is included in the biomass treatment costs shown in Table 6.
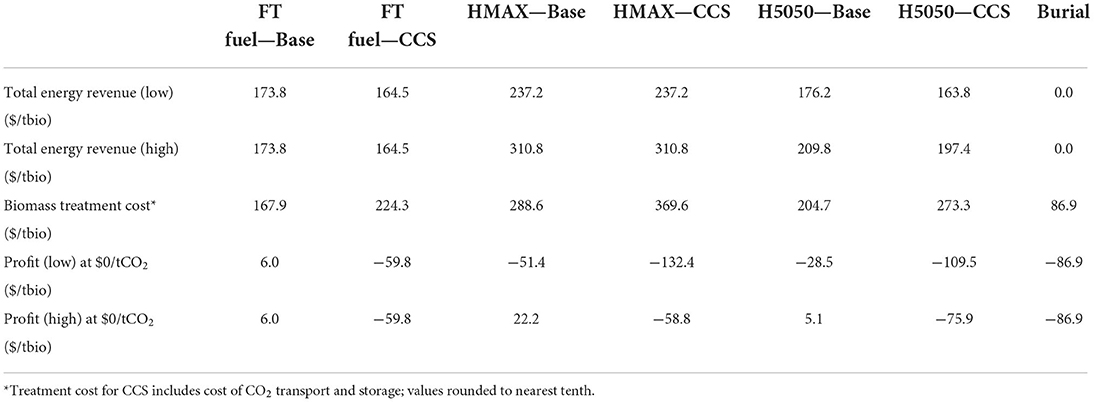
Table 6. Data used to generate plots for Case 2, based on data from Larson et al. (2009) and equations from Baker et al. (2020).
Also shown in Table 6 are parameters for forestry residue burial. These were modeled using the same annual throughput (1,325 kt) and feedstock price ($50/t) as the gasification process. The operating expense is based on the cost of land purchase, construction, and operation, which (Zeng and Hausmann, 2022) estimate to be about $13–22/tCO2 sequestered. For a conservative comparison, we choose the upper bound of this estimated range.
The final parameter necessary for Equation (2) is the net-removed CO2. The carbon balance for processes in Case 2 was estimated using the biomass carbon content. For gasification products, FT fuels retain 25% of the feedstock carbon, while H2 retains 0%; the remaining carbon content is emitted in the flue gas, with 90% of the emissions being captured. The carbon retained in the FT fuel is still included in the carbon balance, as it would later be emitted upon fuel combustion. Meanwhile, burial in specially engineered facilities is assumed to retain 100% of the carbon within the forestry residue (Zeng and Hausmann, 2022). The HMAX process does not produce enough electricity to satisfy all of its power demand, so it has some emissions from grid electricity with an emissions intensity of 170 gCO2/MJ (Baker et al., 2020). The emissions of each process are summed to determine the net emissions as shown in Table 7. If the energy products replace carbon-intensive products, additional emission reductions will be realized that could further reduce the net emissions and increase the net removed CO2. However, because the emissions intensity of the counterfactual energy product varies with time and location, it is not included in the carbon balance.
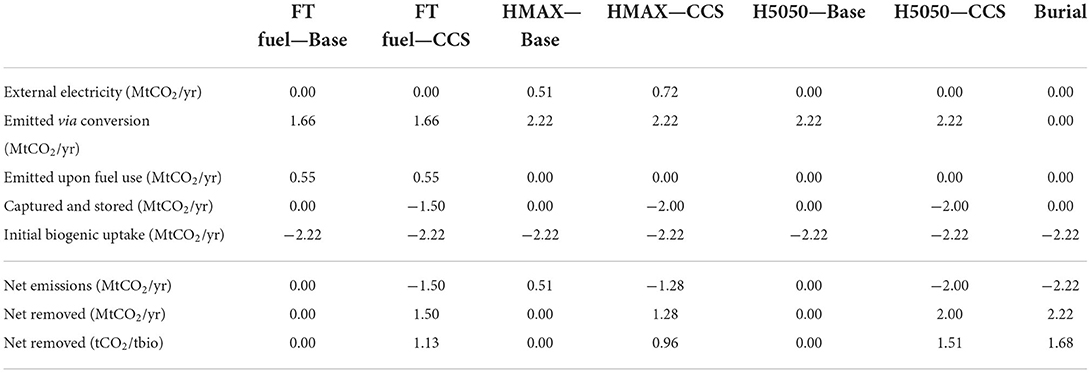
Table 7. Carbon balance for Case 2.
Data availability statement
The raw data supporting the conclusions of this article will be made available by the authors upon request.
Author contributions
CW and CM contributed to conception and design of the study. CW performed the spreadsheet analysis, performed extensive review, suggestive revision of the spreadsheet analysis, and wrote the first draft of the manuscript. All authors contributed to manuscript revision, read, and approved the submitted version.
Funding
The authors thank Climate Pathfinders for providing funding for this work.
Conflict of interest
Author CM was employed by company Carbon Direct.
The remaining authors declare that the research was conducted in the absence of any commercial or financial relationships that could be construed as a potential conflict of interest.
Publisher's note
All claims expressed in this article are solely those of the authors and do not necessarily represent those of their affiliated organizations, or those of the publisher, the editors and the reviewers. Any product that may be evaluated in this article, or claim that may be made by its manufacturer, is not guaranteed or endorsed by the publisher.
References
Amelse, J. (2020). Achieving Net Zero Carbon Dioxide by Sequestering Biomass Carbon. Social Science Research Network.
Baker, S., Stolaroff, J., Peridas, G., Pang, S., Goldstein, H., Lucci, F., et al. (2020). Getting to Neutral: Options for Negative Carbon Emissions in California. Lawrence Livermore National Laboratory.
Benveniste, A. (2021). This Startup Grows Kelp Then Sinks it to Pull Carbon From the Air. New York, NY: CNN.
Braghiroli, F. L., and Passarini, L. (2020). Valorization of biomass residues from forest operations and wood manufacturing presents a wide range of sustainable and innovative possibilities. Curr. For. Rep. 6, 172–183. doi: 10.1007/s40725-020-00112-9
Bright, M. (2022). The Inflation Reduction Act creates a whole new market for carbon capture. Clean Air Task Force. Available online at: https://www.catf.us/2022/08/the-inflation-reduction-act-creates-a-whole-new-market-for-carbon-capture/ (accessed on October 2, 2022).
Butnar, I., Li, P.-H., Strachan, N., Portugal Pereira, J., Gambhir, A., and Smith, P. (2020). A deep dive into the modelling assumptions for biomass with carbon capture and storage (BECCS): a transparency exercise. Environ. Res. Lett. 15, 084008. doi: 10.1088/1748-9326/ab5c3e
California Air Resources Board (2022). Monthly LCFS Credit Transfer Activity Report for July 2022. California Air Resources Board.
CEWEP (2021). Landfill Taxes and Restrictions Overview. Available online at: https://www.cewep.eu/wp-content/uploads/2021/10/Landfill-taxes-and-restrictions-overview.pdf (accessed on October 2, 2022).
Fajardy, M., and Mac Dowell, N. (2017). Can BECCS deliver sustainable and resource efficient negative emissions? Energy Environ. Sci. 10, 1389–1426. doi: 10.1039/C7EE00465F
Fuss, S., Lamb, W. F., Callaghan, M. W., Hilaire, J., Creutzig, F., Amann, T., et al. (2018). Negative emissions—Part 2: costs, potentials and side effects. Environ. Res. Lett. 13, 063002. doi: 10.1088/1748-9326/aabf9f
Giusti, L. (2009). A review of waste management practices and their impact on human health. Waste Manag. 29, 2227–2239. doi: 10.1016/j.wasman.2009.03.028
Greinert, A., Mrówczyńska, M., and Szefner, W. (2019). The use of waste biomass from the wood industry and municipal sources for energy production. Sustainability 11, 3083. doi: 10.3390/su11113083
Hamelin, L., Borzecka, M., Kozak, M., and Pudełko, R. (2019). A spatial approach to bioeconomy: Quantifying the residual biomass potential in the EU-27. Renew. Sustain. Energy Rev. 100, 127–142. doi: 10.1016/j.rser.2018.10.017
Harris, N. L., Gibbs, D. A., Baccini, A., Birdsey, R. A., de Bruin, S., Farina, M., et al. (2021). Global maps of twenty-first century forest carbon fluxes. Nat. Clim. Change 11, 234–240. doi: 10.1038/s41558-020-00976-6
Honorato-Salazar, J. A., and Sadhukhan, J. (2020). Annual biomass variation of agriculture crops and forestry residues, and seasonality of crop residues for energy production in Mexico. Food Bioprod. Process. 119, 1–19. doi: 10.1016/j.fbp.2019.10.005
Iqbal, A., Liu, X., and Chen, G.-H. (2020). Municipal solid waste: Review of best practices in application of life cycle assessment and sustainable management techniques. Sci. Total Environ. 729, 138622. doi: 10.1016/j.scitotenv.2020.138622
Kaza, S., Yao, L., Bhada-Tata, P., and Woerden, F. V. (2018). What a Waste 2.0: A Global Snapshot of Solid Waste Management to 2050. Washington, DC: World Bank Publications.
Kearns, D. T. (2019). Waste-to-Energy with CCS: A Pathway to Carbon-Negative Power Generation. Glob. CCS Inst, 1–11.
Kelemen, P., Benson, S. M., Pilorgé, H., Psarras, P., and Wilcox, J. (2019). An overview of the status and challenges of CO2 storage in minerals and geological formations. Front. Clim. 1, 9. doi: 10.3389/fclim.2019.00009
Larson, E. D., Jin, H., and Celik, F. E. (2009). Large-scale gasification-based coproduction of fuels and electricity from switchgrass. Biofuels Bioprod. Biorefin. 3, 174–194. doi: 10.1002/bbb.137
Mac Dowell, N., and Fajardy, M. (2017). Inefficient power generation as an optimal route to negative emissions via BECCS? Environ. Res. Lett. 12, 045004. doi: 10.1088/1748-9326/aa67a5
Mansuy, N., Paré, D., Thiffault, E., Bernier, P. Y., Cyr, G., Manka, F., et al. (2017). Estimating the spatial distribution and locating hotspots of forest biomass from harvest residues and fire-damaged stands in Canada's managed forests. Biomass Bioenergy. 97, 90–99. doi: 10.1016/j.biombioe.2016.12.014
Material Economics (2021). EU Biomass Use in a Net-zero Economy: A Course Correction for EU Biomass. Sverige: Material Economics.
Nakano, J., and Kennedy, S. (2021). China's New National Carbon Trading Market: Between Promise and Pessimism. Cent. Strateg. Int. Stud. Available online at: https://www.csis.org/analysis/chinas-new-national-carbon-trading-market-between-promise-and-pessimism (accessed on October 2, 2022).
National Academies Press (2019). Negative Emissions Technologies and Reliable Sequestration. Washington, DC: National Academies Press.
O'Dwyer, J., Walshe, D., and Byrne, K. A. (2018). Wood waste decomposition in landfills: an assessment of current knowledge and implications for emissions reporting. Waste Manag. 73, 181–188. doi: 10.1016/j.wasman.2017.12.002
Patrizio, P., Fajardy, M., Bui, M., and Dowell, N. M. (2021). CO2 mitigation or removal: the optimal uses of biomass in energy system decarbonization. iScience 24, 102765. doi: 10.1016/j.isci.2021.102765
Psarras, P., He, J., Pilorgé, H., McQueen, N., Jensen-Fellows, A., Kian, K., et al. (2020). Cost analysis of carbon capture and sequestration from U.S. Natural Gas-Fired Power Plants. Environ. Sci. Technol. 54, 6272–6280. doi: 10.1021/acs.est.9b06147
Puro.earth (2022b). Draft Methodology for Verification and Quantification of Carbon Removal: Woody Biomass Burial. puro.earth.
Rosa, L., Sanchez, D. L., and Mazzotti, M. (2021). Assessment of carbon dioxide removal potential via BECCS in a carbon-neutral Europe. Energy Environ. Sci. 14, 3086–3097. doi: 10.1039/D1EE00642H
Sandalow, D., Aines, R., Friedmann, J., McCormick, C., and Sanchez, D. (2020). Biomass Carbon Removal and Storage (BiCRS) Roadmap. ICEF.
Smith, E., Morris, J., Kheshgi, H., Teletzke, G., Herzog, H., and Paltsev, S. (2021). The cost of CO2 transport and storage in global integrated assessment modeling. Int. J. Greenh. Gas Control 109:103367. doi: 10.2139/ssrn.3816593
Speelman, E. N., Van Kempen, M. M. L., Barke, J., Brinkhuis, H., Reichart, G. J., Smolders, A. J. P., et al. (2009). The Eocene Arctic Azolla bloom: environmental conditions, productivity and carbon drawdown. Geobiology 7, 155–170. doi: 10.1111/j.1472-4669.2009.00195.x
Stripe (2021). Stripe Commits $8M to Six New Carbon Removal Companies. Available online at: https://stripe.com/newsroom/news/spring-21-carbon-removal-purchases (accessed on October 2, 2022).
Tang, Y., and You, F. (2018). Multicriteria environmental and economic analysis of municipal solid waste incineration power plant with carbon capture and separation from the life-cycle perspective. ACS Sustain. Chem. Eng. 6, 937–956. doi: 10.1021/acssuschemeng.7b03283
Tradingeconomics (2021). EU Carbon Permits Trading Econ. Available online at: https://tradingeconomics.com/commodity/carbon
US Department of Energy (2017). Monitoring, Verification, and Accounting (MVA) for Geologic Storage Projects. Washington, DC: US Department of Energy.
Welfle, A., Gilbert, P., Thornley, P., and Stephenson, A. (2017). Generating low-carbon heat from biomass: Life cycle assessment of bioenergy scenarios. J. Clean. Prod. 149, 448–460. doi: 10.1016/j.jclepro.2017.02.035
Zeng, N. (2008). Carbon sequestration via wood burial. Carbon Balance Manag. 3, 1. doi: 10.1186/1750-0680-3-1
Zeng, N., and Hausmann, H. (2022). Wood Vault: remove atmospheric CO2 with trees, store wood for carbon sequestration for now and as biomass, bioenergy and carbon reserve for the future. Carbon Balance Manag. 17, 2. doi: 10.1186/s13021-022-00202-0
Keywords: biomass conversion, carbon removal, carbon capture, bioenergy, climate change, resource allocation
Citation: Woodall CM and McCormick CF (2022) Assessing the optimal uses of biomass: Carbon and energy price conditions for the Aines Principle to apply. Front. Clim. 4:993230. doi: 10.3389/fclim.2022.993230
Received: 13 July 2022; Accepted: 20 September 2022;
Published: 18 October 2022.
Edited by:
Mijndert Van Der Spek, Heriot-Watt University, United KingdomReviewed by:
Dinesh Kumar, Municipal Corporation of Delhi, IndiaJohn Young, Heriot Watt University, United Kingdom
Copyright © 2022 Woodall and McCormick. This is an open-access article distributed under the terms of the Creative Commons Attribution License (CC BY). The use, distribution or reproduction in other forums is permitted, provided the original author(s) and the copyright owner(s) are credited and that the original publication in this journal is cited, in accordance with accepted academic practice. No use, distribution or reproduction is permitted which does not comply with these terms.
*Correspondence: Caleb M. Woodall, Y213MjI0NWN1QGdtYWlsLmNvbQ==