 Eric Jr. Bomdzele1,2,3*†
 Ernest L. Molua1,3†
- 1Department of Agricultural Economics and Agribusiness, Faculty of Agriculture and Veterinary Medicine, University of Buea, Buea, Cameroon
- 2Graduate Institute of International Development and Applied Economics (GIIDAE), University of Reading, Reading, United Kingdom
- 3Centre for Independent Development Research (CIDR), Clerks Quarter, Buea, Cameroon
Agriculture remains the mainstay of Cameroon's economy, with cocoa as one of its key export commodities. However, cocoa production may be affected by climate-related stressors. This study assesses the influence of climate and non-climate parameters on cocoa performance in Cameroon. We use time series data for temperature, rainfall, carbon dioxide emission, land use, labour hours, pesticide application, and cocoa output in Cameroon spanning 60 years (1961 to 2021). Trend analyses reveal a stochastic response of crop production under climate variation. Leveraging on the perennial crop supply response framework, a Vector Error Correction Model (VECM) reveals short-term climate impacts on cocoa production. The econometric estimation shows that climate and non-climate parameters explain the variations in cocoa output. More specifically, the short-run results reveal that temperature, carbon dioxide emission, land use, and pesticide quantity significantly increase crop yield, whereas rainfall decreases it substantially. Furthermore, the long-run analysis indicates that temperature, rainfall, carbon dioxide emission, and land use are significant negative determinants of the yearly changes in cocoa output. We recommend government policy reforms which address access to land, subsidies/climate finance and improved production technologies to reduce greenhouse gas emissions and enhance farmers' adaptive capacities to climatic stressors.
1. Introduction
Climate change significantly impacts Africa's agriculture, which is vital for the continent's economic growth and development (World Bank, 2019; FAO, 2022; Nkwi et al., 2023). Extreme weather events, such as storms and droughts, have decreased food and water security, making it challenging to meet the Sustainable Development Goals (IPCC, 2022). Moreover, rising temperatures and changing precipitation patterns threaten human health and safety, food and water security, and socioeconomic development (World Meteorological Organization, 2019). It is reported that carbon dioxide (CO2(g)) levels have surpassed another record threshold, increasing faster than the average of the last 10 years (World Meteorological Organization, 2019). While previous emissions alone may not cause a 1.5°C increase in the average global temperature from pre-industrial levels, they will contribute to further changes (IPCC, 2018, 2021). However, climate variations have already affected agricultural output, forcing farmers to adapt to new environmental conditions. Future climatic consequences, nonetheless, are expected to exacerbate the impact on agricultural productivity, with macroeconomic ramifications for African economies that lack coping mechanisms (IPCC, 2014; Vargas et al., 2018; Molua, 2022).
Despite these exogenous stressors, the agricultural sector remains essential for Africa's development, employing approximately 60% of the economically active population in most Sub-Saharan African countries (IPCC, 2022). An increase in farm productivity would result in higher rural incomes and spending power, benefiting a significant portion of rural dwellers and, thus, contributing toward no poverty and zero hunger, as enshrined in SDGs 1 and 2. African governments have recognized the importance of agriculture, prioritized the sector and increased the share of national budgets allocated to it as their revenue bases have expanded (Ngongi, 2016; Abei and Van Rooyen, 2018). However, achieving sustainability in the export tree-crop subsector requires more effort. Despite Africa's comparative advantage of 65.7% in cocoa production (Figure 1), climatic variables severely impact the continent (World Bank, 2019; FAO, 2022).
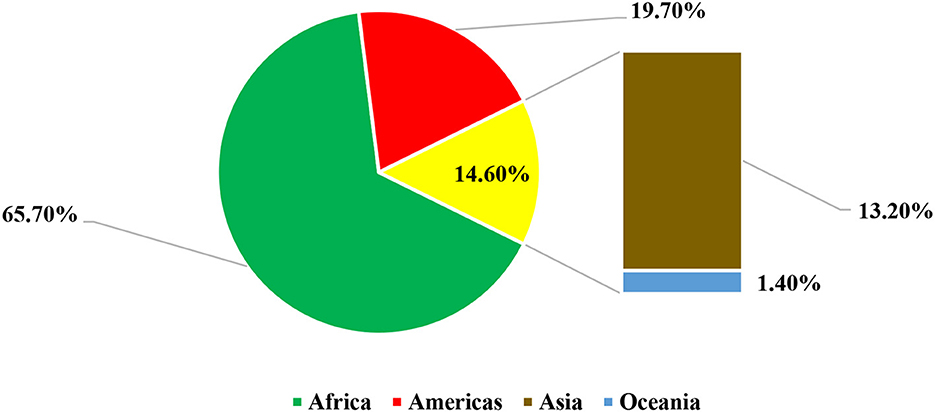
Figure 1. Cocoa production share by region. Source: Authors' computation from FAO, 2022.
Cameroon is Central Africa's leading cocoa producer, Africa's fourth largest, and the world's sixth-largest producer (Figure 2). Cocoa (Theobroma cacao L.) remains a cornerstone of Cameroon's export-based economy, making it important to assess the influence of climate change on cocoa performance in the country. Over the past 20 years, national production and the surface area planted with cocoa have increased (FAO, 2022). While cocoa production has risen significantly in Cameroon from approximately 122,600 tons in year 2000 to over 290,000 tons in 2021, Côte d'Ivoire, the world's largest producer, has increased its output over same period to 800,000 tons, with production in the country increasing over four times more than Cameroon (FAO, 2022). Cocoa is grown over about 460,000 hectares of Cameroon's total cultivated land, with the highest cocoa output from the Southwest (35%), Center (28%), and South (16%) regions, where it thrives best (FAO, 2017; Ngong et al., 2019; Lescuyer et al., 2020). However, the Southwest recently lost its leading position to the Center region owing to socio-political turmoil. Cameroon earns about 250 billion francs CFA (US$ 500,000,000) annually from cocoa, accounting for about half of the country's primary-sector exports (Ngong et al., 2019). Cocoa makes up a significant share of the country's agricultural exports, providing about 90% of the income for rural communities involved in its production (Abei and Van Rooyen, 2018).
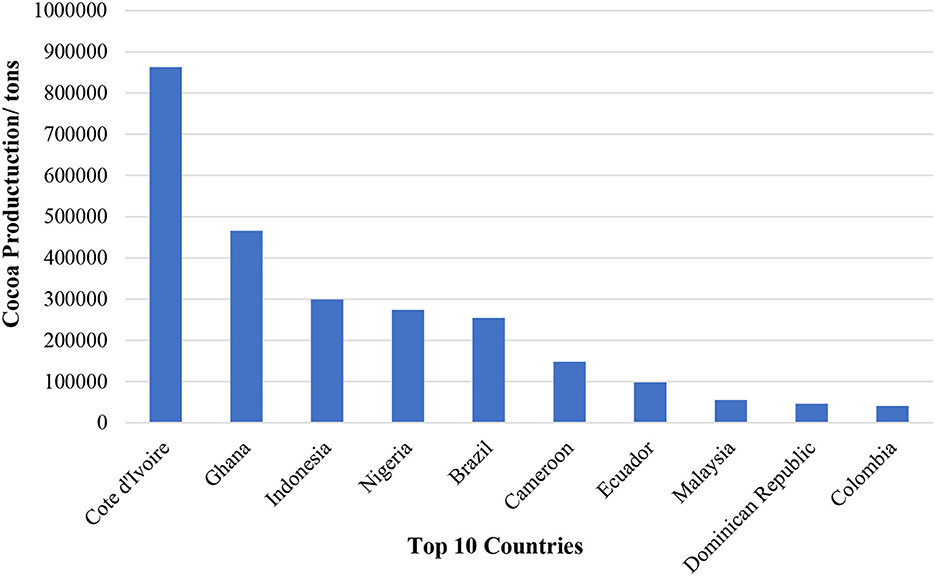
Figure 2. Average cocoa bean production by country. Source: Authors' computation from FAO, 2022.
Cocoa farming is essential to the welfare of the people in cocoa-producing regions. Over 60% of Cameroon's population depends (directly or indirectly) on the cocoa industry for their livelihood, with roughly 600,000 people directly involved in its cultivation. There are over 250,000 cocoa farms, with smallholder farmers making up roughly 95% with an average farm size ranging between 2.5 to 5 ha (Hütz-Adams et al., 2016). During the harvest seasons (July–December), cocoa's crucial role in these regions becomes apparent. Most commercial and economic actors benefit from cocoa farmers throughout this period. One local farmer says, “cocoa season is a season of cash”. Hence, discussing the welfare of people living in these regions without mentioning cocoa production is almost impossible.
Cameroon exports over 90% of its raw cocoa bean, while only about 10% is locally processed. The Netherlands, Belgium, Germany, Italy, and Spain are the top countries importing cocoa from Cameroon (ITC, 2021). The European Union is the primary market for cocoa exports from Cameroon, concentrated in a few nations, creating dependency on these countries. Any significant changes in their markets could negatively impact the Cameroon's cocoa industry. Cameroon's cocoa beans often trade at a discount of 400 FCFA ($0.65)/kg in the international market due to contamination with polycyclic aromatic hydrocarbons (PAH).
While Cameroon faces various economic, social, political, and environmental challenges, its production sectors rely heavily on agriculture to supply food and raw materials and release surplus labor. The majority of Cameroon's over 27 million people thus live in rural areas relying on agriculture for gainful employment and livelihoods (Achankeng, 2021). Poverty, hunger, and climate change are significant issues challenging the rural landscape. To address these challenges, the country has committed to achieving the Sustainable Development Goals (SDGs) 1, 2, and 13, which focus on ending poverty, eradicating hunger, and combating climate change (IPCC, 2021; UNDP, 2021). However, progress toward achieving these goals has been slow. There is a need for studies to guide the government's efforts to lift Cameroon's people out of poverty, eradicate food insecurity, and protect the environment from the negative impacts of climate change.
Promoting the growth of the cocoa subsector shall provide impetus in the export crop sector and agriculture in general in realizing national development objectives. However, a significant knowledge gap exists on how the agricultural subsector for perennial crops will respond to climate variation and change. On this guise, this study seeks to examine as its goal the role of climatic and non-climatic factors in driving cocoa production. In addition, we hypothesize that climate parameters of temperature, rainfall, carbon dioxide, and socio-economic factors related to land access and economic performance may influence cocoa production. On subjecting the data to econometric tests, we observe significant positive and negative associations of these variables with cocoa production, evoking the need for a policy response to cushion and promote the subsector's performance. To properly contextualize our study, we divide this paper into subsections. In section two, we address the nexus of climate and agricultural production. In section three, the nature and source of data as well as the analytical techniques employed, are presented. The results and discussion are presented in section four, while the paper ends with section five, which highlights some policy implications and suggestions for better performance of the cocoa subsector.
2. The nexus: climate, non-climatic parameters and cocoa production
The unrelenting threat of climate change to Cameroon's agricultural sector strains particularly smallholder farmers relying on rain-fed agriculture (Nkouathio et al., 2018; Nouck et al., 2019). The IPCC (2014, 2018, 2021, 2022) predicts that changes in rainfall patterns and higher temperatures will result in short-term crop failures and long-term output losses, exacerbating poverty and hunger in tropical regions. The prevalence of pests and diseases may also increase, leading to reduced crop yields, as the FAO (2020) notes. Overall, the effects of climate change on agriculture are expected to be negative, despite some potential for crop improvements. As climate change continues to put increasing pressure on the agricultural sector of developing and developed countries and the livelihoods of people in these countries, understanding and prioritizing vulnerable regions at the national and sub-national levels is crucial.
Studies have demonstrated that changes in rainfall patterns and higher temperatures resulting from climate change have led to short-term crop failures and long-term output losses (Djoumessi et al., 2019; Njoya et al., 2021). In addition, Nouck et al. (2019) used crop models to evaluate the potential effects of climate change on cocoa production in the country. They found that temperature increases and changes in rainfall patterns could reduce cocoa yields by up to 40% by the end of the century. Similarly, Tchinda-Metagne et al. (2020) used a crop model to evaluate the impact of climate change on cocoa production in three agroecological zones of Cameroon. Their results showed that temperature increases and changes in rainfall patterns could significantly reduce cocoa yields, with the most severe impacts expected in the Sudano-Guinean zone. Similarly, Ngo Bieng et al. (2018) surveyed cocoa farmers in three regions of Cameroon to assess their perceptions of climate change and its impacts on cocoa production. They found that farmers were experiencing changes in rainfall patterns and temperature increases, negatively affecting cocoa yields. Likewise, Fonjong et al. (2019) assessed farmers' perception of climate change and its impacts on cocoa production in the Southwest region of Cameroon. They found that farmers were experiencing changes in rainfall patterns, increasing temperatures, and pest and disease commonness with negative ripple effect on cocoa yields.
Furthermore, research has indicated that the prevalence of pests and diseases has increased because of climate change, leading to further reductions in crop yields (Njoya et al., 2021; Nkem et al., 2021). Suh and Molua (2022) discovered that climate variability significantly impacts cocoa production. They also revealed that socio-economic factors, such as farm management techniques that control pests and diseases and soil management practices, significantly influence yield. Climate change enhances the proliferation of pests and diseases (World Bank, 2019; Aikpokpodion and Obayagbona, 2020; Aikpokpodion et al., 2021; Oduro et al., 2021), devastatingly affecting cocoa output. According to Mahob et al. (2021), capsid bugs and the cocoa pod borer are Cameroon's most prevalent and destructive cocoa pests, causing yearly output losses of 30%−70% and 50%, respectively. To ensure the livelihood and survival of peasant cocoa farmers over the long term, reducing pest and disease attacks on cocoa crops and increasing productivity in this sector (Mahot et al., 2020). Although fertilizers, pesticides, and disease control techniques boost cocoa productivity (Tchokote et al., 2015; Ngong et al., 2019; Pratama et al., 2019), however, changing climate can also affect how pests and diseases that harm cocoa develops, altering the host's resilience to pesticides (Oyekale, 2015).
Climate change alters crop composition and nutritional value, in addition to its impact on crop yields. For instance, a study by Sielinou et al. (2021) found that elevated atmospheric carbon dioxide concentrations and increased temperatures could decrease protein while increasing carbohydrate content in cassava, a staple crop in Cameroon. However, The IPCC's fifth assessment report acknowledges that higher levels of atmospheric carbon dioxide can boost plant growth and carbon sequestration, but this increase can be limited by water stress and nutrient imbalances (IPCC, 2014). It notes that carbon dioxide is one of the most important greenhouse gases in the earth's atmosphere and is a major contributor to climate change. Additionally, climate change is predicted to exacerbate extreme weather events like droughts and floods, which can negatively impact crop yields (IPCC, 2014). By tracking changes in its emissions over time, it is possible to understand the historical trends and patterns of anthropogenic impact on the Earth's climate system (IPCC, 2014). The potential negative implications for the health and nutrition of the population have led to the proposal of various strategies to help farmers in Cameroon adapt to the impacts of climate change on agriculture. One such strategy is using drought-tolerant crops, which can help mitigate the effects of reduced rainfall (Njoya et al., 2021). Agroforestry, which involves integrating trees with crops and livestock, has also been suggested to improve resilience to climate change in Cameroon (Nkem et al., 2021).
Ojumo et al. (2020), Ayanlade et al. (2017), and Kreft et al. (2017) conducted research indicating that industries at the local, national, and international levels would feel the effects of climate change. However, small-scale rain-fed agriculture, which is relied upon by disadvantaged and impoverished groups in developing nations, is expected to be the most vulnerable. Also, Schroth et al. (2017) estimated losses in cocoa production in West Africa and developed a regional adaptation strategy for tropical commodities based on site-level projections (Ojumo et al., 2020). Similarly, Bunn et al. (2015) examined the impact of climate change on global cocoa and coffee production. They found that production losses could threaten nations' economies and local, regional, and international supply chains that depend on these crops as inputs. According to Bunn et al. (2019), increasing temperatures, decreasing rainfall, and changing weather patterns will result in a decline in suitable areas for cocoa cultivation in West African countries. Also, projections show that Ivory Coast could lose up to 40% of its current cocoa-growing regions by 2050, while Ghana may lose up to 20%. Similarly, Coulibaly et al. (2017) studied the long-term impact of climate change on the export earnings of the cocoa business in Cote d'Ivoire. They found that precipitation may impact the Ivorian economy's revenue from cocoa exports.
The vulnerability of cocoa farm to climate change remains a growing concern in various parts of the world. In Nigeria's Ekiti State, Oyedokun and Oyelana (2016) investigated how weather fluctuations affect cocoa growers. The study found that extreme climate change events, such as floods, high temperatures, and heat, reduced the productivity of cocoa plants, making cocoa producers vulnerable to hunger and poverty. Cocoa production is highly vulnerable to extreme weather events, and timely and moderate rainfall distribution is essential for effective production. Cocoa thrives in conditions of year-round, modest but persistent water supply, and the ideal annual rainfall regime for maximum growth and yield is between 1500–2500 mm. However, higher rainfall can slow cocoa drying and processing, lowering bean value and increase processing costs (Hutchins et al., 2015). Climatic factors, including temperature, rainfall, humidity, and sunshine, affect cocoa growth (Owoeye and Sekumade, 2016). Temperature and rainfall remain the most significant determinants of cocoa growth. Thus, climate oscillations and exceedingly prolonged drought make it difficult to establish new cocoa farms and marked dry periods reduce cocoa yields. Increased evapotranspiration due to changes in temperature affects the crop's flowering time, which reduces seed production. At the same time, moisture loss leads to plant water demand and crop stress throughout the dry season due to drought (Schroth et al., 2016).
Peasant farmers produce most of Cameroon's high-demand crops, including cocoa. However, Ngoe et al. (2018) noted inadequate access to economic resources, and the sector remains underperforming, characterized by low productivity, poor quality, and low prices. According to Abei and Van Rooyen (2018), climate shocks have disrupted cocoa output in the cocoa sector, threatening export earnings and food security. Moreover, climate change is affecting cocoa production in Cameroon, and the vulnerability of cocoa farmers to climate change has become a growing concern. Extreme weather events, such as floods, high temperatures, and heat, reduce the productivity of cocoa plants, making cocoa producers vulnerable to hunger and poverty. Effective cocoa production requires timely and moderate rainfall distribution, and socioeconomic factors, including farm management techniques such as pest and disease control, significantly impact yield. However, inadequate access to economic resources hinders cocoa production, and climate shocks limit the farmers' ability to adapt to the changing climate, threatening export earnings and food security (Agyeman et al., 2022).
It is clear that the impact of climate change on cocoa production extends beyond physical changes in climate parameters and has significant economic implications (Jabir et al., 2021). Policymakers must consider the economic implications of climate change when formulating policies to address its impact on cocoa production. Economic factors such as net farm income influence the adaptation measures adopted by cocoa farmers (Suh and Molua, 2022). The need for financial support to adopt effective adaptation measures also suggests that government intervention may be necessary to support farmers in their adaptation efforts.
Though climate change has been widely discussed and its impact on agriculture has become increasingly concerning, many studies have focused mainly on the micro-effects on food crops or the agricultural sector. Most often, the macroeconomic impacts of climate stressors on cocoa production have received little attention. By providing more comprehensive and reliable data and appropriate analytical techniques, our current study makes a significant contribution to the existing literature on the impact of climate change on agriculture. It highlights the need for policymakers to take immediate action to address the effects of climate change on cocoa production in Cameroon and beyond.
3. Materials and methods
3.1. Analytical framework
We present a framework to understand the interrelation between climate-related shocks, non-climate factors, and cocoa production. The framework explores the possible mechanisms through which climatic stressors and economic factors impact production activities and crop output, requiring adaptations. Our study utilizes the Crop Yield Response theory to analyse the weather's influence on crops in agricultural production. According to this theory, the output is generally a result of a production function involving land, labor, and capital. However, the direct application of such a function to agriculture overlooks the importance of weather as an exogenous factor. Therefore, the study combines rainfall and temperature to create composite aridity indexes, which consider rainfall, temperature, solar radiation, and other weather factors as non-cost inputs into the production process, particularly when they deviate from the average. The methodology assumes a log normal distribution of climate (C), and represented as a non-linear specification in equation (1) as follows:
The researchers adopt a model represented by the equation to analyse cocoa production, with each term representing a different factor. Q represents cocoa output, while land, labor, and capital (pesticide) are represented by L, N, and K, respectively. The coefficients l, n, k, and w indicate each input factor's impact on the output, with a being a constant term. The climatic index, represented by C, is crucial in understanding the relationship between climate and cocoa production. When climatic conditions are as expected, C equals 1, and logC equals 0. Other functional forms capture the effects of climatic variables, including trans-log formation. The translog model is essential for understanding the complex relationship between climate, cocoa production, and economic factors.
When determining crop output (Q), there are several inputs to consider, including weather variables represented by xi and xj. Different functional forms can model the relationship between inputs and output, such as quadratic, square root, Mitscherlich-Baule (MB), linear, and nonlinear Von-Liebig functions, which all have applications in crop response theory. However, researchers choose the functional form based on the study's objective and the underlying production processes they intend to model. By carefully considering these factors, researchers and farmers can make informed decisions to optimize crop productivity.
As climate change continues to wreak havoc on our planet, the future of cocoa production looks increasingly uncertain. Figure 3 demonstrates the inherent relationship between climate change and cocoa production. It highlights how climate change impacts not only cocoa trees but also the livelihoods of farmers who depend on cocoa production. This graphic is a crucial tool as it visually represents the relationship between climate change and cocoa production, making the complex issues easier to understand for readers (Carberry et al., 2016). It highlights the extreme variations in climatic factors that can increase the risk of farmers' efforts not paying off in the future, leading to fatalism and despair. This is pivotal because it illustrates how climate change affects cocoa production and can have adverse psychological effects on farmers. Additionally, the graphic explains how climate change impacts cocoa production by altering the development of cocoa pods, insect pests, and pathogens, leading to lower crop output and reduced farm income (Jabir et al., 2021).
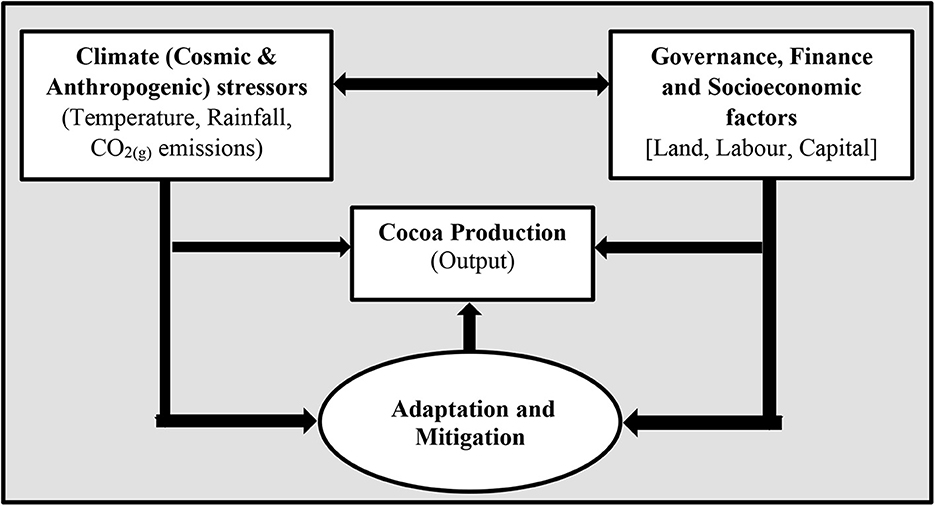
Figure 3. Interconnectedness between climatic, non-climatic factors, cocoa output, and adaptation. Source: Authors' Conceptualization, 2022.
Moreover, climate change affects cocoa trees directly and indirectly. It notes that temperature extremes during flowering lead to a lower seed count, directly impacting climate change on cocoa trees (Bunn et al., 2019). However, climate variability and change affects cocoa production by influencing other factors of production, such as soil nutrients and moisture, pesticide application, farming methods, seed varieties, and even the health of the farmers. In addition, it explains the interconnectedness of factors affecting cocoa production. Also, it affirms the urgent need for action to address the impact of climate change on cocoa production and the livelihoods of farmers who depend on this crop (Jabir et al., 2021). Furthermore, it emphasizes the importance of developing innovative solutions to mitigate the impact of climate change on cocoa production and secure the future of this valuable commodity.
This conceptualization highlights the impact of climate change on cocoa production and the resulting need for cocoa farmers adapt to minimize the impact on their output. Climate change may cause extreme variations in climatic factors such as rainfall and temperature, which may decrease in cocoa output. As a result, cocoa farmers adopt new adaptation measures to mitigate the impact of climate variability on their output (Ekwe et al., 2020; Komakech et al., 2020). The adaptation measures adopted by cocoa farmers not only affect the quantity and use of other economic determinants of cocoa production, but they also improve other factors of production (Suh and Molua, 2022), such as the use of improved varieties of cocoa, the application of more fertilizer to enrich soil nutrients, and the use of pesticides to reduce the incidence of pests and diseases (Schroth et al., 2016). Farmers have implemented measures to improve the other factors of production in line with macro-adaptation policies provided by the government, while individual farmers have taken micro-adaptation measures. These measures mainly consist of decision-making processes to increase output and net farm income despite climate stressors. Notably, these measures require farmers to have some income to purchase necessary inputs and make informed decisions. Therefore, net farm income determines the level and type of climate adaptation measures farmers adopt to improve cocoa output (Jabir et al., 2021).
Most studies conducted at the micro-level have relied mainly on cross-sectional data, which is susceptible to errors due to farmers' recall. Different techniques have been employed, including OLS (Suh and Molua, 2022), PCA (Ngong et al., 2019), VECM (Adinew and Gebresilasie, 2019), and ARDL (Coulibaly et al., 2017), with data sets below 30 years. However, some of these methods have limitations in capturing both short- and long-run relationships, which may lead to inaccurate results. For instance, Loves et al. (2021) and Adinew and Gebresilasie (2019) used the cointegration and VECM estimation technique. Coulibaly et al. (2017) employed the Autoregressive Distributed Lag (ARDL) method, while Coulibaly and Erbao (2019) tested the ECM to find significant short-run relationships between climate and the sector. Our current study closes the knowledge gap by focusing on a perennial crop and evaluates the impact of climate at the macro level. To improve accuracy, we use time series data spanning over 60 years for climate parameters such as rainfall, temperature, carbon dioxide emissions, and economic factors. This study thus employs the perennial crop supply response approach and the vector error correction regression to assess how climate and non-climatic factors affect cocoa production in Cameroon.
3.2. Data collection
Secondary data is collected from various sources over 60 years, from 1961 to 2021. Specifically, the study collected temperature and rainfall data from the World Bank climate portal (World Bank, 2022: https://climateknowledgeportal.worldbank.org/). It also sourced information on cocoa production, pesticide quantity, and carbon dioxide emission from FAO statistics (2022) (FAOSTAT: https://www.fao.org/faostat/en/#home). In addition, labor data is computed from Cameroon's national institute of statistics (INS, 2022: https://ins-cameroun.cm/en/statistiques/). The study applies the average labor productivity method, which divides the total labor used in cocoa production by the average labor productivity per worker. This method assumes that labor productivity has been relatively constant over time and may not have accounted for fluctuations due to climatic conditions, technology improvements, or changes in farming practices.
Before performing analysis, the time series data have been appropriately treated to minimize errors and ensure accurate and meaningful analysis. Also, the study data smoothing is done to remove any random fluctuations or noise, such as missing or invalid data points, outliers, or anomalies. Seasonal adjustments have also been performed to make identifying underlying trends or patterns easier. This involves using moving averages while calculating the average value of the data over a fixed period (annually) and subtracting this average from each data point in that period. Moreover, detrending helps remove trend components by differencing the data sets repeatedly until the time series are stationary (Adinew and Gebresilasie, 2019).
This study measures total annual cocoa output in tons, mean annual rainfall variations in mm, mean annual temperature in degrees centigrade, and mean annual carbon dioxide emissions in metric tons per capita. Additionally, we calibrate non-climatic parameters like the land size in hectares. The researchers also measure labor in man-days, where one man-day equals 8 h, and pesticide quantity in liters (Table 1). This is because data from FAOSTAT (cocoa output, land size, carbon dioxide emission quantities, and pesticide quantity) relies on a combination of imputed and estimated/simulated data through complex algorithms. Likewise, data for temperature and rainfall are based on observed data recorded from meteorological agencies, supplemented with data from satellite-remote technologies.
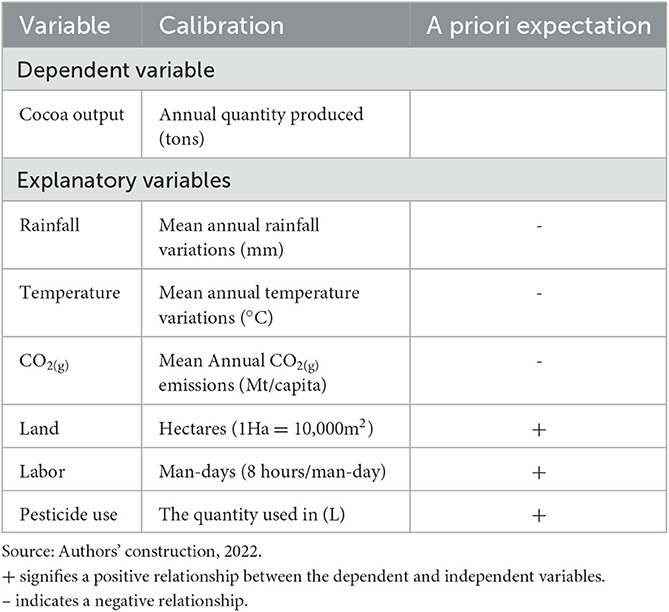
Table 1. Variable description and a priori expectation.
Using the secondary data collection method allows for obtaining a significant amount of data on the variables of interest over a long period, making it possible to draw meaningful conclusions about the effects of climate variations on cocoa output in Cameroon. This study uses Microsoft Excel for trend analysis and Stata 17 for econometric regressions. These tools identify patterns and relationships between the model variables and develop statistical models that predict future outcomes. Moreover, it is a comprehensive and user-friendly statistical software tool. Its strengths include statistical tools, high-quality graphics, robust data management capabilities, and reproducibility and transparency features. Nevertheless, it works primarily with its file format, which may not provide the customization or flexibility required for more complex or specialized analyses. Overall, the combination of various secondary data sources and statistical tools provided the researchers with a robust dataset to examine the research questions and generate empirical evidence for policymakers and other stakeholders in the cocoa industry.
3.3. Pre- and Post-estimation Tests
Macroeconomic time series data are prone to non-stationary issues, causing variations in mean and variance that contradict the fundamental assumption of OLS (Harris, 1995). Non-stationary series change their means and variance over time. Regressing them on one or more non-stationary time series variables may lead to spurious results (Adinew and Gebresilasie, 2019). Thus, we employ methods which emphasize the significance of the stationary assumption in classical estimation methods (Gujarati, 2004). To overcome these problems, the variables are tested using unit root, cointegrated and error correction models that assess the estimated long- and short-term relationships and effects of the variables. Non-stationary time series data have a covariance value that varies between two time periods on distance or lag, while their mean and variance remain constant across time. Hence, non-stationary time series data have non-time-invariant mean, variance, and autocovariance of individual time series. The study underlines the importance of testing for stationarity before estimation and highlights that the non-stationarity of variables can lead to false regression issues. It also emphasizes the need to use appropriate econometric models to evaluate the long- and short-term relationships and effects of variables, particularly in the case of macroeconomic time series data.
3.3.1. Unit-root test for stationarity
The study used the Philips-Perron test to identify the unit root problem in non-stationary series that follow the random walk model. The order of integration for a variable (climatic, non-climatic, and cocoa output factors) is crucial in determining its stationarity. If the climatic, non-climatic, and cocoa output factors become stationary at the level indicated as I(0) if they become stationary at first, the difference is indicated as I(1). Additionally, the climatic, non-climatic, and cocoa output factors are integrated of order n, I(n), if differencing it n times leads to a stationary series (Wooldridge, 2003; Burke and Hunter, 2005; Adinew and Gebresilasie, 2019).
Equation (3) expresses the relationship between time and the pure white noise error term, where t represents time, and μt represents the error term. E(μt) = 0.
The non-parametric Philips-Perron test requires less serial correlation than the Augmented Dickey-Fuller (ADF) test. However, the estimation method is likened to the DF test with the correction of autocorrelations and heteroscedasticity in the statistic.
3.3.2. Cointegration test
The cointegration analysis provides a framework for estimation, inference, and interpretation when the variables are not covariance stationary. Engle and Granger introduced the concept of cointegration, and Johansen later developed practical and inferential estimation methods (Engle and Granger, 1987; Johansen, 1988). If a time series for the climatic and non-climatic factors, denoted as xt, is integrated with the order of sequencing 1, or I(1), it means that (1-B)xt is stationary and non-reversible. For a univariate time series xt, it is referred to as process I(d) if (1-B)d xt is stationary and non-invertible. However, if the time series data for the climatic, non-climatic, cocoa output parameters are stationary and reversible, it is called process I(0). Johansen's estimation and inferential technique, introduced by Burke and Hunter (2005), is commonly used for this process (6). The Johansen cointegration test is a widely used method for cointegration testing, and it uses the VAR (p) model. When variables have cointegration, it is crucial to test the cointegration ranking. For this purpose, we leverage the trace test and maximal eigenvalue measurement (Engle and Granger, 1987).
The equation VAR (p) can be expressed in terms of a vector Yt (cocoa output) with k non-stationary variables of order I(1), a vector xt with d deterministic variables (climatic and non-climatic), and a pure white noise error term or error vector denoted as μt (7).
Where,
and
We use the trace test for testing the hypotheses;
The statistical test for maximum eigenvalue is given by;
This can also be written as;
The null hypothesis H0 states that there is no cointegration equation for the climatic, non-climatic, and cocoa output factors that is for r = 0, 1, ..., k-1. If the trace test statistic and the maximum eigenvalue are less than the critical value or the p-value is greater than the significance level, we fail to reject H0 at the (1-α) 100% significance level (Rosadi, 2012). If there is cointegration between these variables, the VAR model is modified to become a Vector Error Correction Model (Asteriou and Hall, 2007; Wei, 2019).
This study employs cointegration and the vector error correction model to determine the long-term relationship between the climatic, non-climatic factors, and cocoa output. If two I(1) series either climatic or non-climatic and cocoa output are cointegrated, then there are unique α0 and α1 such that;
The constant is only present in the long-run relationship. In a single equation cointegration model where y is the cocoa output, and x is a set of explanatory variables (climatic and non-climatic), the error correction model can be expressed as:
3.3.3. Vector autoregressive (VAR) model
The vector autoregressive (VAR) is a distinct type of simultaneous equation system that can be applied when all the climatic, non-climatic parameters, and cocoa output are stationary (15). However, in non-stationary data where a cointegration relationship exists, the Vector Error Correction Model (VECM) is a suitable form of limited VAR (Enders, 2015).
If Yt represents the vector of observations, α is the matrix of parameters, and εt is the vector error, and if the data used is stationary at the same differencing level, and there is cointegration, then the VAR model can be combined with the error correction model to create the VEC model (Asteriou and Hall, 2007).
3.3.4. Test for normality of residuals
The Jarque-Bera (JB) test determines residual normality in a multivariate model, which measures the skewness and kurtosis of the residuals. The JB test is a normality test that helps determine if a model's residuals are normally distributed. The test is calculated by including the number of predictor variables which are the climate and non-climate, as illustrated below:
The Jarque-Bera (JB) test of normality uses the following parameters: N, the sample size; β1, the expected skewness; β2, the expected excess kurtosis. The JB test statistic is compared to the Chi-square χ2 distribution with 2 degrees of freedom (Jarque and Bera, 1987).
3.3.5. Granger causality test
Granger causality assesses the short-term causal relationships between the climate, non-climate variables and cocoa output in terms of their reciprocity. A VAR is considered stable if it meets the following criteria:
Suppose Yt comprises two vectors, Y1t and Y2t, and Y2t does not have a Granger causality effect on Y1t. In that case, it means that the matrix coefficient of parameter VAR, denoted as α21, i = 0 for i = 1, 2, …, p, indicating no Granger causality effect (Lutkepohl, 2005; Loves et al., 2021). The Granger causality test bases on the F-test, which aims to determine whether a change in another variable causes a change in one variable. If the past value of X (climatic and non-climatic parameters) can predict the current value of Y (cocoa output). In that case, X is said to have a Granger causality effect on cocoa output. This model is presented as follows:
The significance of the coefficients 8 on the lagged value of cocoa output determines if the climatic and non-climatic factors Granger causes cocoa output. If the coefficients are significant, it indicates Granger causality from these climatic and non-climatic variables to cocoa output. Indirect causality arises when the climatic and non-climatic variables Granger causes cocoa output but not the other way around. Bidirectional causality occurs when there is causality in both directions (Brooks and Chris, 2008; Warsono and Hartono, 2019, 2020).
3.4. Empirical model: multivariate vector error correction model (VECM) specification
If cointegration between variables is established and confirmed to be stationary at the first difference value, the VAR model transforms into a Vector Error Correction Model (VECM). The VECM determines the influence of climatic and non-climatic variables on cocoa yield using the impulse response function and Granger causality (Tsay, 2014; Adinew and Gebresilasie, 2019; Loves et al., 2021). The VECM is a powerful tool for investigating the short- and long-term crop responses to changes in climatic and non-climatic factors. It provides a sound economic interpretation and a good fit. The VECM method assumes that the time series data is stationary and that long-term effects occur only when the time series under consideration are cointegrated. In this study, we use the single-equation perennial crop supply response VECM to evaluate the effects of climate variations on cocoa output in the short- and long-term (19). The model estimates the rate at which cocoa output is affected by variations in climatic and non-climatic elements in the short and long-run. The VECM method corrects the equilibrium error in one period by the next period, and it is a restricted VAR model with a cointegration relationship between variables.
Where; = operator differencing, that is, Yt = Yt− Yt−1 , Yt−1 = vector variable endogenous with lag 1, εt = kx1 vector residuals, Dt = kx1 vector constant, Γi = kxk matrix coefficient of the ith endogenous variable. Also, Π= cointegration matrix coefficient [(Π = αβ′; β = adjustment vector, kxr matrix and α matrix co-integration, that is, long-run parameter (kxr)]. That is, αi are the adjustment coefficients used to determine the long-term effects of variations in climatic (temperature, rainfall, and carbon dioxide emissions) and non-climatic (land, labor, pesticide) variables on cocoa output. While βj, is the adjustment coefficient used to estimate the short-term effects of these explanatory variables on cocoa output. Also, 0 < αi ≤ 1 and 0 < βi ≤ 1 where i = 1, 2, 3,…, n. We rewrite (19) as;
Given that cocoa output, has a long-run relationship with the independent factors, climate factors, temperature, rainfall, carbon dioxide, and non-climate variables (land use, labor, and pesticide). The Multivariate VECM model is explicitly expressed as thus:
Although many factors influence cocoa output, this study assumes that some fundamental factors remain constant. The signs in the above mentioned variables indicate the expected relationship between each explanatory variable (temperature, rainfall, carbon dioxide emission, land use, labor and pesticide quantity) and the cocoa output (CQt). Table 1 displays the measures of the model's variables and the expected outcomes.
4. Results
4.1. Trend analyses
4.1.1. Temperature variations on cocoa production trends
We present the mean annual temperature variation trends and cocoa production in Cameroon from 1961 to 2021. Figure 4 shows a gradual increase in temperature and cocoa output in the early 1960s, with a marked increase toward the late 1960s, up to 25°C and 108,186 tons, respectively, in 1969. In the early 1970s, the temperature sharply decreased to 24.1°C in 1971 and 24.0 °C in 1974 and 1976. Despite this, cocoa output continued to increase until 1971, reaching 138,775 tons, but sharply decreased to 82,500 tons in 1976. Temperature variations subsequently increased to 24.8°C in 1979 and up to 25.3°C in 2016. Meanwhile, cocoa production gradually increased from the early to the late 1980s, reaching 132,800 tons, but dropped to 97,835 tons in 1992.
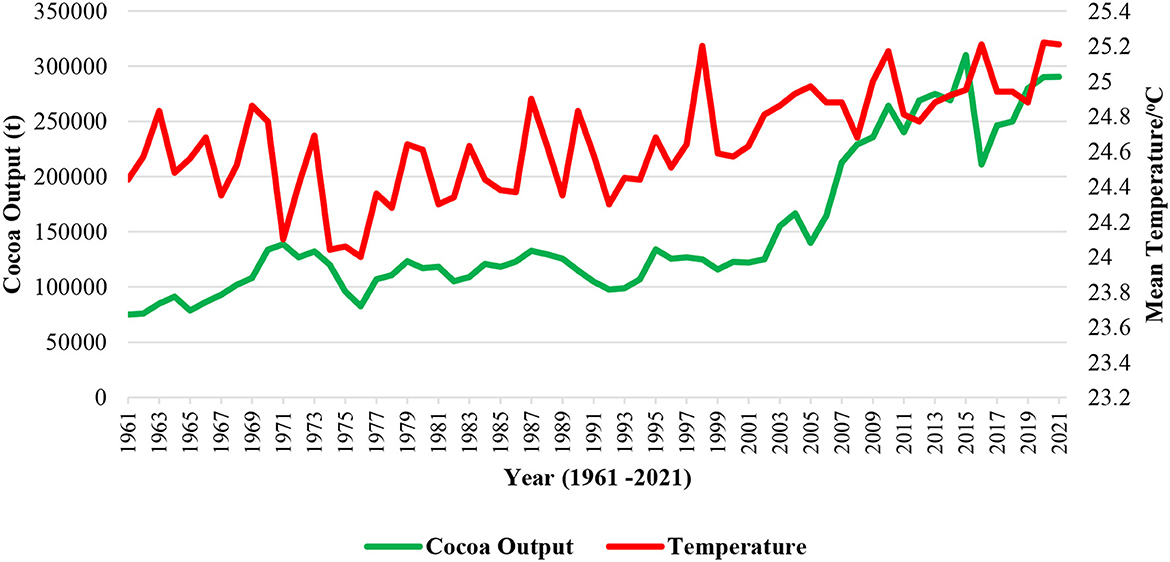
Figure 4. Average annual temperature variations and cocoa production trends in Cameroon. Source: Authors' computation based on data from the World Bank Climate portal and FAO, 2022.
In the onset of 1995, cocoa crop output increased gradually, up to 134,000 tons. In the early 2000s, crop output continuously increased, reaching 264,077 tons while the average temperature was 24.8°C. From 2013 to 2016, cocoa output increased to 211,000 tons. Recent years have seen an unprecedented rise in temperatures up to 25.22°C, which correlates to an increase in cocoa output to 290,000 tons. The results suggest a complex relationship between temperature and cocoa output, with some years showing a positive correlation and others showing a negative correlation. The recent temperature rise has a positive association with cocoa production, but it remains to be seen if this trend will continue.
4.1.2. Rainfall variations and cocoa production trends
The findings indicate a downward trend for rainfall and an upward trend for cocoa production. In the early 1960s, there was a decrease in rainfall to 1,675.12 mm in 1963, but cocoa output increased to 85,000 tons. In the late 60s, rainfall and cocoa yield increased to 1912.46 mm and 108,186 tons, respectively. The early 1970s saw a decrease in rainfall (1,680.7 mm) and cocoa output (96,000 tons), while rainfall further dropped to 1,487.03 mm and cocoa output significantly increased to 107,000 tons in 1977 (Figure 5). Cocoa production gradually increased to 132,800 tons in 1987, with a marked drop in rainfall to 1,357.89 mm in 1983. Fluctuations in rainfall patterns continued up to 1,679.47 mm in 1992, while cocoa output dropped to 97,835 tons. In the late 1990s and early 2000s, rainfall and cocoa output surged to 1,684.28 mm in 2002, while cocoa production increased to 125,000 tons. In the later years, mean annual rainfall decreased continuously to 1,467.07 mm in 2015, while cocoa production hit a record high of over 310,000 tons. In 2016, there was a sharp decrease in cocoa yield, while rainfall continued trending downwards. Still, in the later years, with slight variations in rainfall patterns, cocoa output experienced a marked increase to over 290,000 tons in 2021. The analysis underscores the importance of understanding the relationship between rainfall and cocoa production.
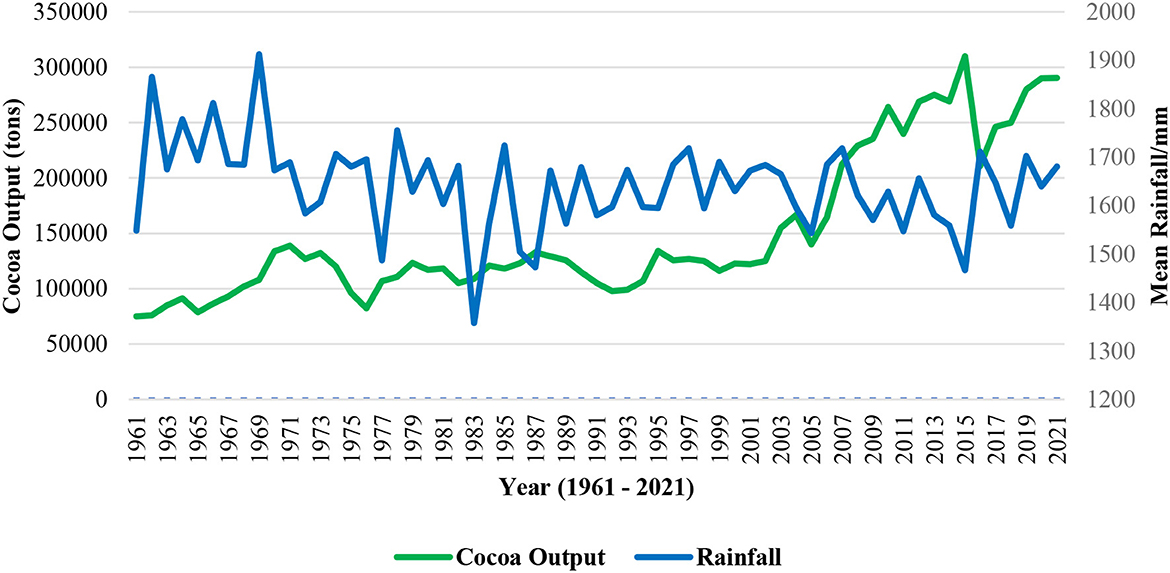
Figure 5. Average annual rainfall variations and cocoa production trends in Cameroon. Source: Authors' computation based on data from the World Bank Climate portal and FAO, 2022.
4.1.3. Carbon dioxide (CO2(g)) emissions and cocoa production trends
This association shows an upward trend in both Cameroon's carbon dioxide emissions and cocoa production from 1961 to 2021. During the 1960s and early 1970s, there was a gradual increase in carbon dioxide emissions, reaching a peak of 0.245 Mt/capita in the late 1970s, coinciding with an increase in cocoa output in 1971 up to 138,775 tons. However, cocoa production dropped to 82,500 tons in 1976.
From the late 1970s to the early 1980s, there was a continuous increase in carbon dioxide emissions, reaching a peak of 0.693 Mt/capita in 1983 and then dropping to 0.172 Mt/capita in 1987, with a corresponding increase in cocoa production from 108,900 tons to 132,800 tons over the same period. There was a sharp decrease in carbon dioxide emissions from 0.663 in 1989 to 0.221 metric tons per capita in 1990, and cocoa output dropped to 97,835 tons in 1992 (Figure 6). While carbon dioxide emissions fluctuated at 0.217 Mt/capita, cocoa output remained relatively stable. Furthermore, carbon dioxide emissions increased to 0.333 Mt/capita from 2009 through 2015, coinciding with a record high of 310,000 tons of cocoa yield. From 2016 to 2021, emissions have dropped to 0.260 Mt/capita, while cocoa output has increased to over 290,000 tons. These results suggest a complex relationship between carbon dioxide emissions and cocoa production, with emissions and cocoa output fluctuations across the years.
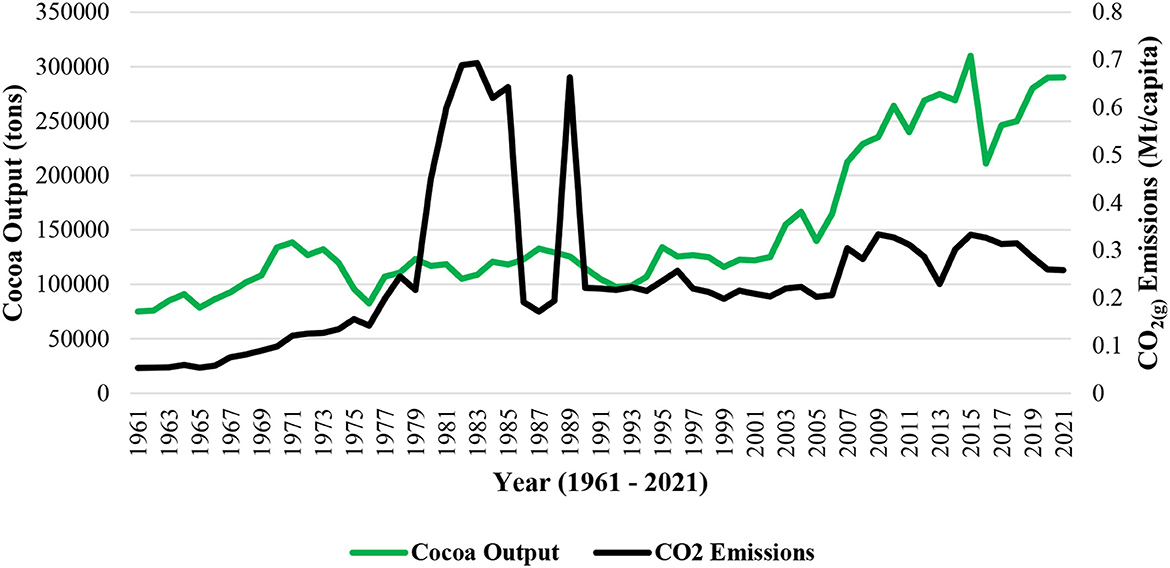
Figure 6. Average annual carbon dioxide emission and cocoa production trends in Cameroon. Source: Authors' computation based on data from the World Bank Climate portal and FAO, 2022.
4.2. Impact analysis
4.2.1. Pre-estimation test
4.2.1.1. Unit root test results
We employ the Phillips-Perron unit root test statistics to determine the order of integration of variables and tested the null hypothesis of non-stationarity against the alternative hypothesis of a stationary process. Table 2 presents the unit root test results for temperature, rainfall, labor hours, pesticide quantity, cocoa output, carbon dioxide emissions, and land use. The results indicate that all these variables are stationary after the first difference. The unit root test results provide confidence in using the model. This implies that it avoids the problem of spurious regression since the variables have zero means, while the variance and autocovariance are constant.
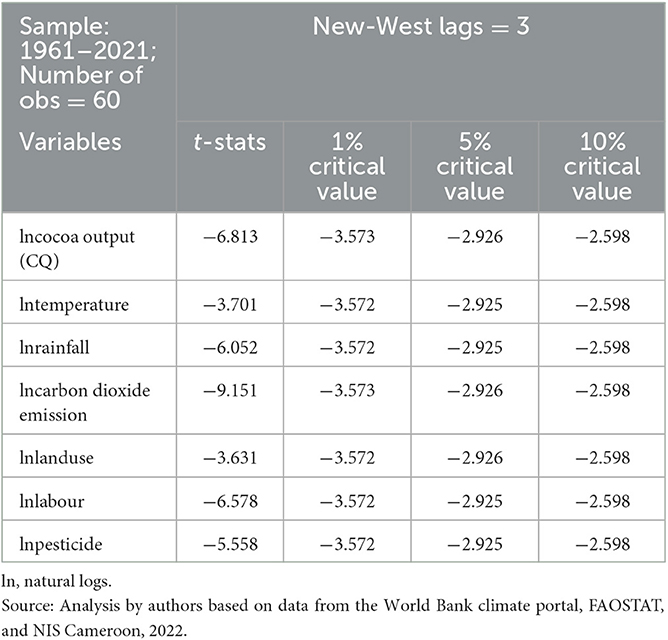
Table 2. Phillips-Perron unit root test.
4.2.1.2. Johansen test for cointegration
The analysis employs the co-integration test to determine whether there is a long-term relationship between two or more variables. The co-integration test aims to determine whether the model parameters move together over time and whether there is an equilibrium relationship between them.
The results highlight that the estimation of VECM requires a cointegration relationship. If no cointegration relationship exists, a VAR model is used. This analysis tests the null hypothesis of no long-run relationship between dependent and explanatory variables against the alternative hypothesis. The trace statistics column in Table 3 indicates two cointegrating equations that confirm long-run dynamics among the climate- non-climate parameters and cocoa output. Therefore, we reject the null hypothesis of no long-run relationship.
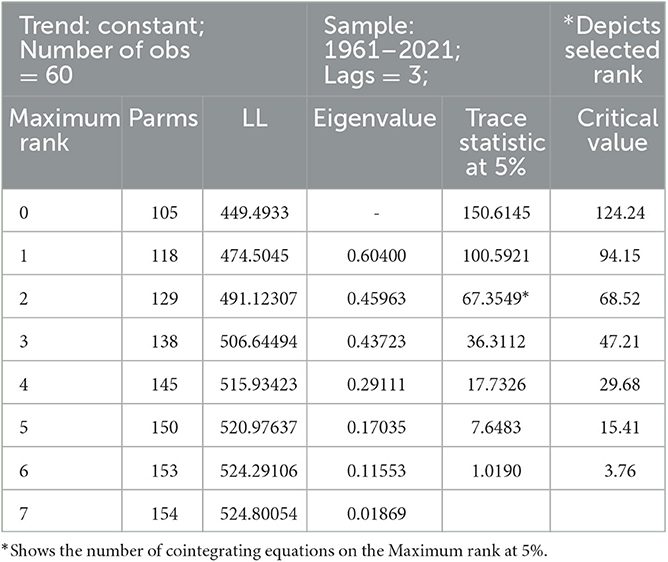
Table 3. Johansen cointegration test.
4.2.2. Vector error correction model (VECM) regression
The vector error correction estimation explores the relationship between climatic shocks and cocoa output. Table 4 presents an econometric analysis that examines the relationship between climatic elements, economic inputs, and cocoa output. It explains that the error correction model is used to assess the speed of adjustment of a variable back to equilibrium when there is a shock in cocoa production. The Johansen cointegration test results indicate a long-run relationship among the variables. Additionally, the presence of a significantly negative and less than one coefficient of the error correction term confirms the existence of an error correction mechanism that allows for more reliable estimates. The negative sign of the error correction term implies that the crop output will adjust to equilibrium, which is desirable.
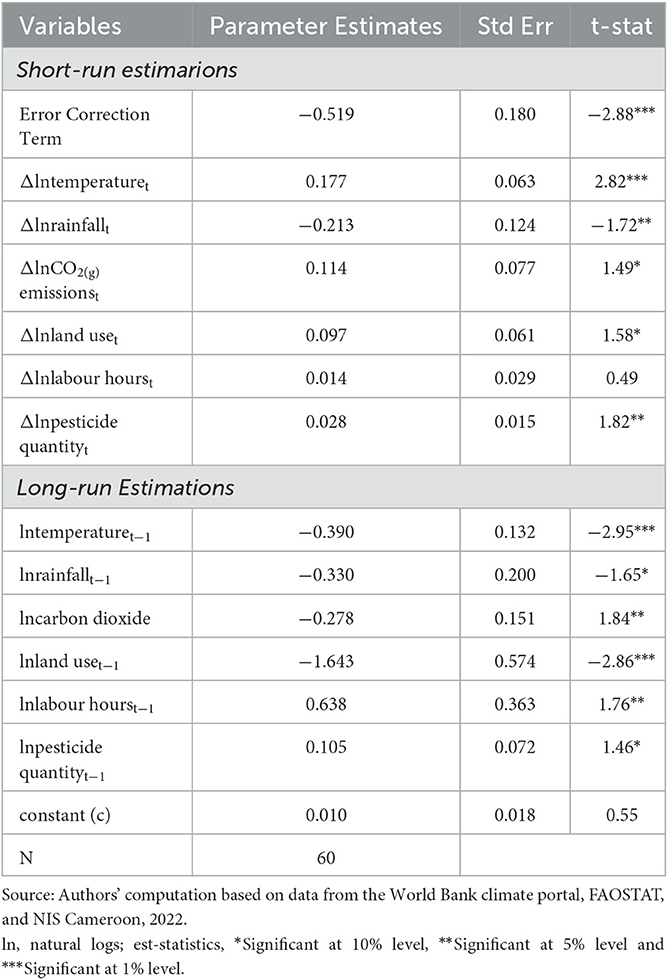
Table 4. Vector error correction estimation results (dependent variable = D[CQ]).
Furthermore, the coefficient of the error correction term is negative and statistically significant at a 1% significance level. This highly significant error correction term is an additional confirmation of a stable long-run association between the variables. The error correction coefficient indicates that the speed of adjustment of any short-run disequilibrium to long-run equilibrium is 51.9% each year. Overall, the results indicate a long-term relationship among the variables, and the error correction mechanism allows for adjusting any short-run disequilibrium to long-run equilibrium. The findings suggest that climatic shocks significantly impact cocoa output and that the vector error correction model is valuable for exploring this relationship.
4.2.3. Robustness tests
4.2.3.1. Johansen normalization restrictions imposed
The Johansen normalization confirms the relationship between cocoa output and its predictor variables (temperature, rainfall, carbon dioxide emission, land use, labor, and pesticide). The number of error correction terms in the Johansen normalization restrictions imposed reflects the number of cointegrating equations. Table 5 shows that the Johansen identification places four constraints. The first constraint indicates a long-run equilibrium relationship between cocoa output and the explanatory variables. The second constraint indicates no long-run relationship between temperature and the other variables in the model. In the second cointegrating equation, the Johansen normalization restricts the coefficient for the temperature to be unitary, meaning there is an equally long-term relationship between temperature and the other variables in the model. Thus, the unitary restrictions on cocoa output and temperature uphold that it is exactly identified. The results suggest a long-term equilibrium relationship between cocoa output and the explanatory variables. The findings indicate that mean annual temperature changes are crucial in the long-run equilibrium relationship among the variables.
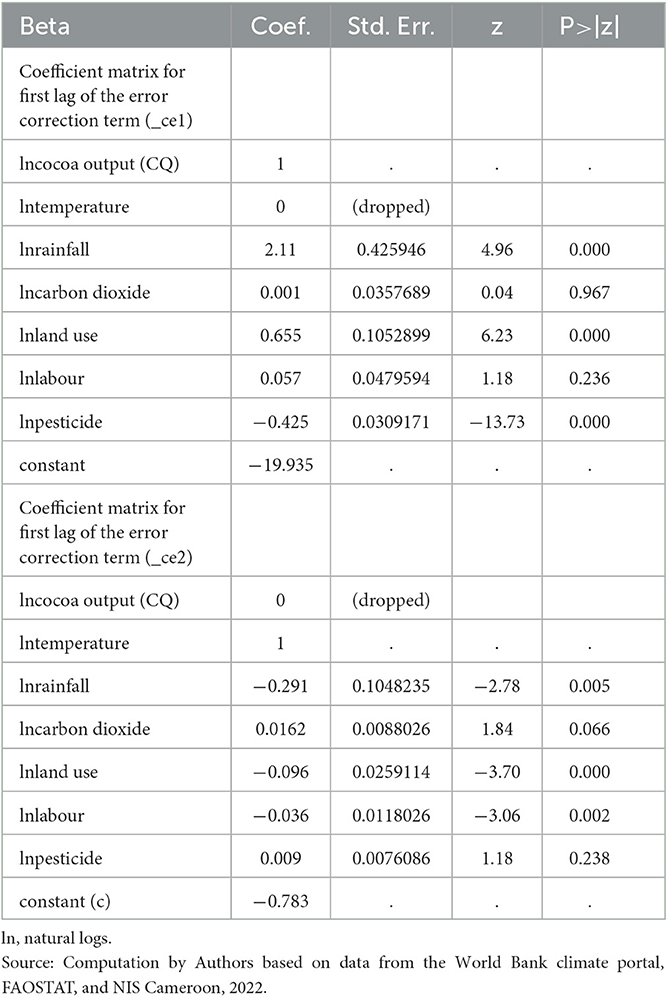
Table 5. Johansen normalization restrictions imposed.
4.2.3.2. Test for model stability
Figure 7 demonstrates the stability of the VECM and ensures that the number of cointegrating equations is correctly specified. The eigenvalues of the companion matrix, the real component is plotted on the x-axis, and the imaginary component is on the y-axis. The number of unit eigenvalues equals the number of endogenous variables minus the number of cointegrating equations. In this study, the VECM specification imposed 2-unit moduli, indicating that there are two unitary constraints on the eigenvalues.
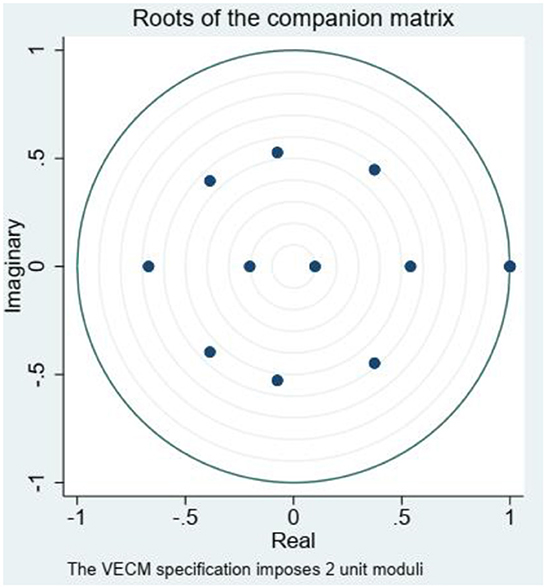
Figure 7. Eigenvalue stability condition. Source: Analysis by Authors based on data from the World Bank climate portal and FAO, 2022.
Given that none of the remaining eigenvalues is close to the unit circle, the results imply that all the remaining modulus values are less than one. This suggests that the number of cointegrating equations is correctly specified in the VECM and supports its feasibility. Moreover, the graphical stability test provides additional confirmation of the validity of the VECM and the accuracy of the number of cointegrating equations specified, further validating the study's findings.
4.2.3.3. Diagnostic tests and model fitness
The R-squared value measures how well the regression model fits the data. In this study, the adjusted R-squared value of 53.3% indicates that temperature, rainfall, carbon dioxide emissions, land use, labor, and pesticides account for over half of the changes in cocoa output (Table 6). The remaining 46.7% of changes in cocoa output owe to other factors which affect the cocoa output but are not included in the model, represented by the white noise error term. Furthermore, the probability value of F-statistics of 0.000 suggests that the explanatory variables in the model are jointly significant in explaining cocoa production. The model shows a strong statistical relationship between the cocoa output and its regressors, thus, confirming model reliability.
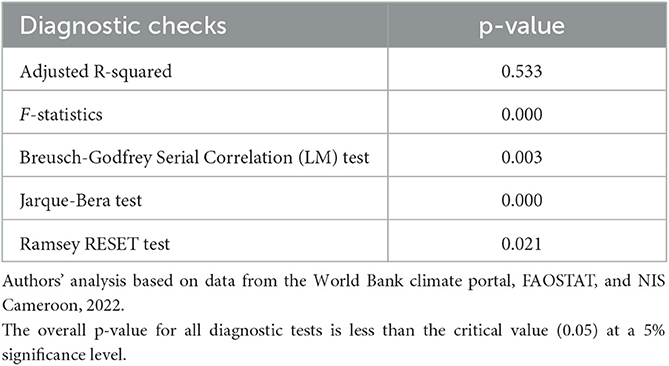
Table 6. Diagnostic tests and model fitness.
We perform the Breusch-Godfrey test for serial correlation, the Jarque-Bera test for normality, and the Ramsey RESET test for model misspecification. Based on the significance of the p-values for all three tests, we reject the null hypotheses of serial correlation, non-normality, and misspecification bias, implying that the model is reliable. Specifically, the Lagrange multiplier test shows no serial correlation in the residuals, and the Jarque-Bera test indicated that the errors are both skewed and kurtotic. Therefore, the VECM model is free from serial correlation, normality, and misspecification problems.
4.2.3.4. Analysis of the Granger causality test
We then employ the Granger causality Wald test to determine the causal linkages between temperature, rainfall and carbon dioxide, and cocoa output. It further confirms the study's findings and ensures their robustness. Our analysis focuses on identifying causal relationships between the variables and determining if there was bi-directional (two-way) Granger causality in the VECM. The results presented in Table 7 reveal that we reject the null hypothesis of no Granger causality between climatic parameters and cocoa output. It means there is a significant relationship between the climate-changing variables and cocoa output (Granger cause each other).
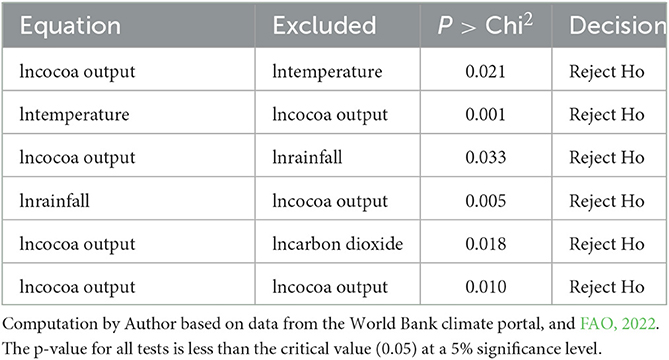
Table 7. Granger causality Wald test.
These findings suggest that the past values of climatic variables have significant predictive power on cocoa output. Likewise, past cocoa output also has significant predictive power on current values of these climatic variables. These results also confirm the negative relationship between climatic parameters and cocoa output, as observed in Table 5. However, it is essential to note that the Granger causality test does not reveal any information about the causal link between variables, and it cannot predict when two or more variables are interdependent. The Granger causality test differs from cause-and-effect analysis, which seeks to establish a direct causal link between variables.
4.3. Discussion
Mean annual temperatures in Cameroon have increased by 0.7°C since the 1960s, indicating continuous temperature rises across the country. This steady increase in average temperatures has led to climate change and affected cocoa output. Additionally, the mean annual rainfall in Cameroon has been decreasing at a rate of about 2.9 mm per decade since 1961, with record declines noted in 1977, 1983, 1987, 2011, and 2015 (see Figure 4), despite controversial increases in cocoa output. This decrease in rainfall might result in shorter rainy periods with higher intensity, directly or indirectly affecting crop output (World Bank, 2021). Recent studies have supported the findings of our analysis. A study by Niyibituronsa et al. (2022) reports that there has been a significant increase in mean annual temperatures in Cameroon, particularly in the northern regions. The study also reported a decrease in the amount and distribution of rainfall in the country, leading to adverse effects on agricultural production, including cocoa. On the other hand, some studies contradict the earlier findings on the relationship between rainfall and cocoa production. Similarly, Tening et al. (2021) affirm that changes in temperature and rainfall patterns hurt cocoa production in Cameroon, particularly in the southwestern region. Likewise, Gockowski et al. (2021) found that increased rainfall intensity in some regions of Cameroon resulted in higher cocoa yields. The study attributed this to the ability of cocoa trees to tolerate brief periods of flooding and the increased nutrient availability in the soil during and after flooding.
The analysis elucidates a surge in mean carbon dioxide emissions since 1961. This could be attributed to the continuous burning of fossil fuels and farming activities such as excessive fertilizer and pesticide use and converting forested areas to agricultural land, as earlier studies have also indicated (World Bank, 2021). Studies confirm the findings regarding the rising carbon dioxide emissions and their impact on the atmosphere. For instance, Le Quéré et al. (2021) indicate that global carbon dioxide emissions increased by 4.9% in 2021, the second-largest annual increase ever recorded. Similarly, a study by IPCC (2021) highlights that the concentration of carbon dioxide and other greenhouse gases in the atmosphere has continued to rise, resulting in increased global warming and climate change. However, while it is challenging to attribute current cocoa crop output solely to carbon dioxide emissions from the 1960s, evidence suggests that climate change and related factors are likely affecting cocoa production, especially in regions experiencing high temperatures and limited water resources. According to the IPCC's 5th assessment report, increased atmospheric carbon dioxide concentrations can improve plant growth and productivity. Still, it can also lead to water stress and nutrient imbalances in crops, particularly in areas already facing high temperatures and limited water resources (IPCC, 2014). The report also highlights that climate change is expected to increase extreme weather events like droughts and floods, which can negatively impact crop yields.
The trends show the changes in cocoa output associated to the vagaries of climatic factors like temperature, rainfall, and carbon dioxide emissions. These climatic parameters have experienced oscillations over the years, with mean annual rainfall trending downward (Figure 5), while the average annual temperature (Figure 4) and mean annual carbon dioxide emissions (Figure 6) trend upwards. These changes in climate elements result in increased sun intensity, global warming, high evaporation, condensation, increased droughts, and floods, which can harm cocoa production (Kimengsi and Tosam, 2013; IPCC, 2014; Suh and Molua, 2022). These findings are consistent with reports from the World Meteorological Organization (2019, 2021) on global climate.
However, some recent studies have provided contrasting findings on the impact of climate change on cocoa production in Cameroon. For example, a study by Njiti et al. (2021) suggests that while climate change has plagued cocoa production in some regions of Cameroon, it has positively impacted cocoa production in other regions. The study argues that climate change has led to the expansion of cocoa production areas in some regions due to increased temperatures and rainfall patterns oscillations. Another study by Foudjet et al. (2022) also highlights the positive impact of climate change on cocoa production in some regions of Cameroon, indicating that climate change has increased the length of the cocoa growing season in some areas. Similarly, Schroth et al. (2016) notes cocoa yields in Indonesia have increased by 10–20% over the past three decades. The study affirms that although climate change has led to changes in the phenology of cocoa trees and an increase in pest and disease pressure, cocoa cultivation is still possible in many regions by implementing climate-smart practices. The study by Grüninger and Berndt (2019) posits that technological innovation, such as precision agriculture and remote sensing, helps farmers adapt to changing climatic conditions and improve cocoa productivity. Amekawa et al. (2020) have shown that genetic engineering and agroforestry systems can improve cocoa farmers' resilience to climate change. Additionally, farmers are implementing various adaptation measures, such as intercropping, using improved varieties, planting shade trees, and implementing irrigation (Vaast and Somarriba, 2014; Thompson and Bekele, 2019; Awazi et al., 2020; Adu-Bredu et al., 2021; Kwakye et al., 2021; Mensah et al., 2021; Agyeman et al., 2022).
In evaluating the impact of climate stressors on cocoa output, Table 4 provides insights into the impact of climate stressors on cocoa production. According to Tchokote et al. (2015) and Pratama et al. (2019), short-term temperature fluctuations positively affect cocoa production. However, other studies (Hutchins et al., 2015; Owoeye and Sekumade, 2016; Schroth et al., 2016; Adinew and Gebresilasie, 2019; Ngong et al., 2019; Suh and Molua, 2022) have found a significant negative relationship between temperature and cocoa output. Also, Schroth et al. (2016) report that cocoa yields in West Africa have decreased by 30–40% over the past three decades due to climate change and other factors. Navarro et al. (2018) reviewed the literature on the impacts of climate change on cocoa production. They found that while some regions are already experiencing negative impacts, the severity of the impacts can vary widely depending on factors such as temperature, rainfall, and soil type.
Soil, pests, and diseases have a significant impact on cocoa output. According to Aikpokpodion and Ighodaro (2020) and Aikpokpodion and Obayagbona (2020), soil nutrients play a crucial role in cocoa production, and their availability can affect the crop's growth, yield, and quality. Inadequate soil management practices, such as overuse of fertilizers or land clearing, can deplete the soil nutrients, reducing cocoa productivity. Additionally, pests and diseases can devastate cocoa production, leading to significant yield losses and reduced quality. Pest infestations, such as cocoa pod borer, mirid bug, and capsids, Tamanjong and Neena (2014) can cause premature fruit drop, while fungal diseases, such as black pod and witches' broom, can cause pod rot and stunt growth. Effective management practices, such as integrated pest management (IPM) and disease control, are essential to minimize the impact of pests and diseases on cocoa output (Aikpokpodion and Obayagbona, 2020; Oduro et al., 2021). Overall, soil, pests, and diseases are critical factors that should be considered in efforts to improve cocoa productivity and sustainability.
The short-run marginal effects reveal a temperature increase of 1°C leads to a cocoa production increase of 0.18 tons. Adinew and Gebresilasie (2019) used VECM, and their results support this finding, indicating a significant positive short-term relationship between temperature and cocoa output (an increase of 2.14 tons). The reason for this could be that improved cocoa varieties, which are drought-resistant, thrive well in hot areas. However, the long-term estimates indicate that an increase in temperature by one unit in the previous year leads to a significant decrease in cocoa output by 0.39 tons in the next year, affirming the negative relationship between temperature and cocoa output (Table 4). Surging temperatures increase evapotranspiration (Schroth et al., 2016), dehydrating some cocoa plants, and thus affecting their growth with consequences such as alteration of the crop flowering period, leading to a reduction in seed number. Although plant growth requires heat, high temperatures could stress the plant leading to low cocoa output. Suggesting increased temperatures also provoke pest and disease incidence (Schroth et al., 2016), which could lead to premature ripening of the cocoa fruits. The short-term effect contradicts the a priori expectations that asserted an inverse relationship between mean annual temperature and cocoa output. In the short-term, better drought-resistant cocoa varieties and favorable conditions for cocoa growth in hot areas are the reasons for the improved impacts.
Increased variations in average annual rainfall have significant adverse effects on cocoa output in both the short-run and long-run as anticipated (Adjei-Nsiah and Kermah, 2012; Owoeye and Sekumade, 2016; Oyedokun and Oyelana, 2016; Sayouri et al., 2021). This implies that an increase in mean annual rainfall will reduce cocoa performance; in absolute terms, an increase in rainfall by 1 mm will result in a drop in cocoa output by 0.41 tons in the short-run, which is significant at 5%. Similarly, the long-run results show that the coefficient for rainfall is still negative, meaning a negative association exists between the previous year's mean rainfall and current cocoa output. Quantitatively, Table 4 reports the long-run result reveals that an increase in rainfall by 1 mm in the previous year will significantly cause cocoa output to reduce by 0.38 tons. However, Adinew and Gebresilasie (2019) argue the long-run result and pose an increase of 0.14 tons depicting a positive long-run relationship between rainfall and cocoa output. Current rainfall patterns may already be above the required level for optimum production. As such, more rainfall could lead to slower rates of fruit development. Likewise, an increase in rainfall variations could obstruct farming activities like spraying with farm chemicals such as pesticides, fertilizers (Oyekale, 2015), harvesting, and off-farm activities such as drying as testified by Hutchins et al. (2015) leading to post-harvest losses. Increased rainfall variations could also lead to droughts, floods, and inundations, causing leaching, and soil erosion, destroying agricultural land, and, hence, reducing production. The overall results imply that oscillations in mean annual rainfall significantly reduce cocoa output.
In the short run, increased carbon dioxide emission into the atmosphere depicts a positive relationship with cocoa output. More specifically, it explains that an increase in atmospheric carbon dioxide by 1Mt/capita leads to a significant increase in cocoa output by 0.11 tons at a 10% level. This may be attributed to plants absorbing carbon during photosynthesis for food production. It contradicts our a priori expectations and the findings of Adinew and Gebresilasie (2019), which saw a negative outcome between carbon dioxide and cocoa output in the short run. However, as expected in the long term, more carbon dioxide harms cocoa production (Adinew and Gebresilasie, 2019). The study anticipated a reverse relationship between cocoa production and carbon dioxide emissions. The marginal effects affirm an increase in carbon dioxide emission by 1mt/capita leads to a significant decrease in cocoa production by 0.28 tons at a 5% level (Table 4). Also, this explains that the long-term effect on crop output results from the previous year's emissions affecting current production. Although plants need carbon for food production, excess carbon dioxide in the air can lead to problems like greenhouse gases, ozone depletion, global warming, climate variability, and changes in temperature and rainfall. These changes can ultimately decrease crop production over time.
Table 4 equally presents economic factors as significant determinants of cocoa output. The results show a positive short-term relationship between land use and cocoa performance Coulibaly and Erbao (2019). In the short-term, a unit change in land use or increase in land size for cultivation will lead to a 0.10 tons increase in cocoa, and the results are significant at 10%. The increased land used for cocoa production may lead to greater output since plants might be more likely to survive the climate stress. In cocoa production, land serves two typical functions. Firstly, it serves as the basis for production. Secondly, in cocoa-producing communities in Cameroon, forest land permits climate-smart farming systems such as agroforestry, which can help in carbon sequestration (carbon sink or store). This can ultimately decrease global temperature warming and increase soil precipitation, as observed in studies by Amekawa et al. (2020) and Adinew and Gebresilasie (2019).
Similarly, organic farming practices can improve soil health, enhance water retention, and increase cocoa plant resilience to climate variability (Tahi et al., 2020). However, the long-run results show that an increase in land size in the previous years has a negative relationship with crop outputs. That will reduce by 1.64 tons for cocoa, significant at 1% (Table 4). Outcomes from Hutchins et al. (2015) recount that climate oscillations, and prolonged droughts on cocoa, make it difficult to establish new cocoa farms. Expanding cocoa farms involves deforestation with adverse trickle-down effects on increasing greenhouse gas emissions and hence increased climate vagaries. Also, deforestation causes land degradation, exposing the soil to erosion and leaching, decreasing soil fertility as soil nutrients percolate. Deforestation destroys soil nitrogen fixing and soil aeration organisms, which help increase soil fertility because of flooding, soil erosion, droughts, and inundations, reducing cocoa production in the long run.
As projected, long-run analysis shows a significant influence of labor on cocoa production. The finding supports Ngong and Forgha (2013) and Coulibaly and Erbao (2019), who reported that labor significantly positively affects the cocoa output. The research opines that an increase in labor by 1 man-day causes cocoa output to increase by 0.64 tons (Table 4). On the other hand, labor shows an insignificant positive impact on cocoa output in the short-run. We can attribute this to cocoa being a perennial crop with seasonal farm operations. Hence the demand for labor in cocoa farms is also seasonal. Thus, short-run labor efforts may not immediately pay off. Recent literature indicates that despite efforts to eradicate child labor, it remains pervasive in the industry, particularly in remote and hard-to-reach areas. Child labor affects the productivity and quality of cocoa production. On the contrary, adult labor is crucial to cocoa production, and labor shortages can lead to decreased output and quality. Similarly, labor exploitation and poor working conditions in cocoa production can lead to social and ethical concerns that can impact consumer demand and market access. (Olivier and Bakari, 2021; Ryan and Bicknell, 2021).
Furthermore, the analysis shows that pesticide quantity used in cocoa production has significant optimistic estimates in both the short and long run. It conforms to the findings of Ngong et al. (2019), who reported that using chemical sprays has a significant positive effect on cocoa production in the Southwest region of Cameroon. The increase in the prevalence of pests and diseases due to climate change (Schroth et al., 2016; Aikpokpodion and Obayagbona, 2020; Oduro et al., 2021) requires the use of pesticides. Table 4 shows that an increase in the pesticide quantity used in production by 1 liter leads to a significant increase in cocoa output by 0.028 tons and 0.11 tons in both the short and long-run, respectively. Hence, researchers have found a significant positive relationship between cocoa output and pesticide application rates. Farmers use pesticides to treat cocoa diseases such as capsid, swollen shoot virus, and black pod propagated by climatic elements such as high temperatures, leading to pest and disease proliferation, as reported by Aikpokpodion et al. (2021). Furthermore, appropriate use of pesticides makes the crops more tolerant to pests and diseases, even though changes in climatic parameters such as temperature and rainfall may bring about resistance (Oyekale, 2015; Suh and Molua, 2022).
5. Conclusion and policy implications
Climate change has adverse effects on cocoa output. Oscillations in climatic patterns, including temperature, rainfall, and carbon dioxide emissions, cause variations in cocoa output. However, short-run analysis shows warmer climate increases cocoa output. In addition, land use and labor are significant determinants of cocoa output in the short and long run. An increase in land use or size for cultivation has a positive relationship with cocoa production in the short term. In the long run, increased land size has decreased crop output in previous years. Labor positively influences cocoa production in both the short and long run. As expected, pesticide quantity used in cocoa production significantly affects cocoa output in the short and long run.
Secondary data sources, such as the World Bank's climate portal and FAOSTAT, comprehensively cover global trends and patterns in climate stressors, non-climate parameters, and cocoa output. While these databases rely on standardized methodologies for data collection and reporting and are publicly available, making them accessible and easy to use, they are also subject to weaknesses such as incomplete or inconsistent data, limited granularity, and a time lag in reporting. Combining various secondary data sources and statistical tools allows for a robust examination in the current study. It provides empirical evidence for policymakers and other stakeholders in the cocoa industry. However, it is crucial to consider these strengths and weaknesses for research or policy analysis and to supplement them with additional data sources or primary data collection where necessary.
The findings suggest the long-run negative impact of a changing climate on cocoa output in Cameroon, but recent studies have shown contrasting findings on its impact in different regions. Therefore, further research is needed to investigate the specific impacts of climate change on cocoa production in different regions. These involve conducting more localized studies to understand better the biophysical (soil) and socioeconomic factors contributing to variations in cocoa output and examining the potential for targeted interventions to address these factors. It could involve evaluating the impacts of different policy interventions on cocoa productivity and farmer resilience, such as land tenure reforms or improved access to training and extension services. There is also need to explore the potential for new technologies and practices by conducting experimental trials to test the effectiveness of these approaches and identify barriers to their adoption by farmers.
Therefore, we recommend governments and policymakers promote climate-smart practices to improve cocoa productivity. This includes using genetic engineering, agroforestry systems, intercropping, precision agriculture, remote sensing, and forecasting of climate parameters. These practices are imperative for adjusting the cocoa calendar while implementing Climate-smart adaptive measures such as shade trees and irrigation. Also, the government should prioritize reducing carbon dioxide emissions by adopting green technology and regulating pesticide usage. Furthermore, increased access to land and improved capacity building of farmers could improve their resilience. Prioritizing climate finance, these policy interventions can help mitigate the negative impact of climate change on cocoa production and improve the resilience of farmers to climate stressors, thus making the cocoa industry climate-proof.
Data availability statement
The original contributions presented in the study are included in the article/supplementary material, further inquiries can be directed to the corresponding author.
Author contributions
EB: conceptualization, methodology, formal analysis, writing—original draft preparation, writing—review and editing, visualization, and investigation. EM: conceptualization, supervision, review and editing, and validation. All authors contributed to the article and approved the submitted version.
Acknowledgments
This study utilized data from the World Bank Group's climate portal (WBG), the Food and Agriculture Organization's statistics (FAOSTAT), and Cameroon's National Institute of Statistics (NIS).
Conflict of interest
The authors declare that the research was conducted in the absence of any commercial or financial relationships that could be construed as a potential conflict of interest.
Publisher's note
All claims expressed in this article are solely those of the authors and do not necessarily represent those of their affiliated organizations, or those of the publisher, the editors and the reviewers. Any product that may be evaluated in this article, or claim that may be made by its manufacturer, is not guaranteed or endorsed by the publisher.
Author disclaimer
The views expressed are purely those of the authors and may not in any circumstances be regarded as stating an official position of the World Bank or the FAO.
References
Abei, L., and Van Rooyen, J. (2018). “Competitiveness in the Cash Crop Sector: The Case of the Cameroonian Cocoa Industry Value Chain,” in Paper presented at the 56th Annual Conference of the Agriculture Economics Association in South Africa, 25-27 September 2018, Somerset West.
Achankeng, E. (2021). Cameroon's challenges in achieving the sustainable development goals. J. Sustain. Dev. Afr. Africa Scholarly Science Communications Trust (ASSCAT), 23, 103–120.
Adinew, M., and Gebresilasie, G. (2019). Effect of climate change on agricultural output growth in ethiopia: cointegration and vector error correction model analysis. Budapest Int. Res. Exact Sci. (BirEx). 1, 132–143. doi: 10.33258/birex.v1i4.461
Adjei-Nsiah, S., and Kermah, M. (2012). Climate Change and Shift in Cropping System: From Cocoa to Maize Based Cropping System in Wenchi Area of Ghana. doi: 10.5281/zenodo.8385
Adu-Bredu, S., Agyeman, K., Blay, E. T., and Appiah, M. (2021). The impact of climate change on cocoa production in Ghana: a review. Climat Dev. Amsterdam: Elsevier, 1–14.
Agyeman, K., Adu-Bredu, S., Blay, E. T., and Appiah, M. (2022). Examining the impact of climate change on cocoa production in Ghana: a case study of the Ashanti Region. Climate Risk Manag. Amsterdam: Elsevier, 33, 100326.
Aikpokpodion, P. O., Adetimirin, V. O., and Daramola, O. O. (2021). Effect of climate change on the incidence and severity of cocoa pests and diseases in Nigeria. J. Agric. Ecol. Amsterdam: Elsevier, 24, 31–38.
Aikpokpodion, P. O., and Ighodaro, O. M. (2020). Climate change, cacao production and chocolate industry: challenges, opportunities and the way forward. J. Agri. Stud. 8, 1–19. doi: 10.5296/jas.v8i2.16770
Aikpokpodion, P. O., and Obayagbona, O. N. (2020). Soil fertility management for sustainable cocoa production: a review. J. Soil Sci. Environ. Lagos: Academic Journals, 11, 45–56.
Amekawa, Y., Chong, C., Umetsu, C., and Kozai, T. (2020). “Genetic engineering and agroforestry systems for improving the adaptation of cocoa to climate change,” in Biotechnology for Sustainable Agriculture. Singapore: Springer. p. 69–84.
Asteriou, D., and Hall, S. G. (2007). Applied Econometrics: A Modern Approach. New York: Palgrave Macmillan.
Awazi, N. P., Tchamba, M. N., and Temgoua, L. F. (2020). Climate-smart practices of smallholder farmers in Cameroon confronted with climate variability and change: the example of agroforestry. Agric. Res. 2020, 1–14. doi: 10.1007/s40003-020-00477-0
Ayanlade, A., Radeny, M., and Morton, J. F. (2017). Comparing smallholder farmers' perception of climate change with meteorological data: a case study from southwestern Nigeria. Weather Climate Ext. 15, 24–33. doi: 10.1016/j.wace.2016.12.001
Brooks and Chris (2008). Introductory Econometrics for Finance 2nd ed. New York: Cambridge University Press. doi: 10.1017/CBO9780511841644
Bunn, C., Läderach, P., Ovalle Rivera, O., and Kirschke, D. (2015). A bitter cup: climate change profile of global production of Arabica and Robusta coffee. Clim. Change 129, 89–101. doi: 10.1007/s10584-014-1306-x
Bunn, C., Läderach, P., Pérez Jiménez, J., and Montagnon, C. (2019). Higher temperatures shorten growing seasons of cocoa trees in Ghana. Glob. Chang. Biol. Hoboken, NJ: Wiley, 25, 1658–1670.
Burke, S. P., and Hunter, J. (2005). Modelling Non-stationary Time Series: A Multivariate Approach. New York: Palgrave Macmillan. doi: 10.1057/9780230005785
Carberry, A. R., Doherty, A., Kornelsen, K. C., and Finnigan, S. (2016). The role of visualizations and contextualisations in understanding climate change. Environm. Educ. Res. Abingdon: Taylor & Francis, 22, 177–193.
Coulibaly, S. K., and Erbao, C. (2019). An empirical analysis of the determinants of cocoa production in Cote d'Ivoire. Econ. Struc. 8, 1–22. doi: 10.1186/s40008-019-0135-5
Coulibaly, S. K., Metuge, T. M., Erbao, C., and Ya Bin, Z. (2017). “Climate Change Effects on Cocoa Export: Case study of Cote d'Ivoire,” in Allied Social Science Association (ASSA)/American Economic Association (AEA). African Finance and Economic Association (AFEA) Jan 8 Session 2017. Chicago – USA: Annual Meeting, Chicago – USA.
Djoumessi, J. C. T., Mfopou, E. S., Tsafack, E. N., and Tsague, F. (2019). Climate variability and crop yield in Cameroon: Evidence from time series data. J. Afr. Econ. Oxford, UK: Oxford University Press, 28, 558–577.
Ekwe, K. C., Nkonya, E., Idrissa, M., and Kato, E. (2020). Climate smart cocoa production in Nigeria: a value chain analysis of barriers and opportunities. J. Envi. Manag. 256, 109934. doi: 10.1016/j.jenvman.2019.109934
Enders, W. (2015). Applied Econometric Time Series. USA: John Wiley and Sons Interscience Publication.
Engle, R. F., and Granger, C. W. (1987). Co-integration and error correction: representation, estimation, and testing. Econometrica. 55, 251–276. doi: 10.2307/1913236
FAO (2017). The State of Food and Agriculture 2017 in Brief. Leveraging Food Systems For Inclusive Rural Transformation. Food and Agriculture Organization of the United Nations. Rome. Available online at: https://www.fao.org/3/i7833en/i7833en.pdf (accessed June 6, 2022).
FAO (2020). The impact of pests and diseases on food security and livelihoods: a global perspective. Food and Agriculture Organization of the United Nations. Rome, Italy. Available at: http://www.fao.org/documents/card/en/c/ca9692en/ (accessed 29 September 2022).
FAO (2022). FAOSTAT Data Base. Rome, Italy: Food and Agriculture Data. Available at: https://www.fao.org/faostat/en/#data/QCL (accessed 29 September, 2022).
Fonjong, L., Lekane, S., and Fobuzie, W. (2019). Climate change, cocoa production and farmers' livelihoods in the Southwest Region of Cameroon. Climate Dev. Amsterdam: Elsevier, 11, 120–131.
Foudjet, A., Tchindjang, M., and Hensel, O. (2022). Impacts of climate change on the production and quality of cocoa beans in cameroon: an econometric analysis. Sustainability. Basel: MDPI, 14, 1686.
Gockowski, J., Bisseleua, D. H. B., and Tchoundjeu, Z. (2021). High rainfall intensity increases cocoa yield in Cameroon. J. Agri. Sci. Cambridge, UK: Cambridge University Press, 13, 1–13.
Grüninger, T., and Berndt, A. (2019). Climate-smart cocoa in Ghana: assessing the benefits of climate-smart agriculture technologies for cocoa farmers. Climate Dev. Amsterdam: Elsevier, 11, 215–226.
Harris, R. I. D. (1995). Using Co-integration Analysis in Econometric Modeling prentice Hall/Harvester Wheatsh. Portsmouth: University of Portsmouth.
Hutchins, A., Tamargo, A., Bailey, C., and Kim, Y. (2015). Assessment of climate change impacts on cocoa production and approaches to adaptation and mitigation: a contextual view of Ghana and Costa Rica. Int. Dev. Stud. Oxford, UK: Wiley Online Library, 1–22.
Hütz-Adams, F., Claudia, H., Irene, K., Pedro, M., and Mara, M. (2016). Strengthening the competitiveness of cocoa production and improving the income of cocoa producers in West and Central Africa. SUDWIND e.V. Bonn, Germany: Kaiserstr. 201, 53113.
INS (2022). Statistics – Institut National de la Statistique du Cameroun. Available online at: https://ins-cameroun.cm/en/statistiques/ (accessed November 6, 2022).
IPCC (2014). “Summary for policymakers,” in Climate Change 2014: Impacts, Adaptation, and Vulnerability. Part A: Global and Sectorial Aspects. The contribution of Working Group II to the Fifth Assessment Report of the Intergovernmental Panel on Climate Change. United Kingdom and New York, NY, USA: Cambridge University Press, Cambridge. p. 1–32.
IPCC (2018). An IPCC Special Report on the Impacts of Global Warming of 1.50C Above Pre-Industrial Levels and Related Global Greenhouse Gas Emission Pathways, in the Context of Strengthening the Global Response to the Threat of Climate Change, Sustainable Development, and Efforts to Eradicate Poverty Cambridge: Cambridge University Press
IPCC (2021). “Climate Change 2021: The Physical Science Basis,” in Contribution of Working Group I to the Sixth Assessment Report of the Intergovernmental Panel on Climate Change, Masson-Delmotte, V., Zhai, P., Pirani, A., Connors, S.L., Péan, C., Berger, S., et al. (eds.). Cambridge: Cambridge University Press.
IPCC (2022). “Climate Change 2022: Impacts, Adaptation, and Vulnerability,” in. Contribution of Working Group II to the Sixth Assessment Report of the Intergovernmental Panel on Climate Change, Pörtner, H. O., Roberts, D.C. Tignor, M. Poloczanska, E.S. Mintenbeck, A. Alegría, M. Craig, S. Langsdorf, S. Löschke, V. Möller, A. Okem, B. Rama (eds.). Cambridge: Cambridge University Press.
ITC (2021). Trade map. Available online at: http://www.trademap.org/ (accessed 12 November, 2021).
Jabir, A., Kimaro, A. A., and Temu, A. B. (2021). Climate change impact on cocoa production in Tanzania: a review. Cogent Food Agricult. Abingdon: Taylor & Francis Group, 7, 1966062.
Jarque, C. M., and Bera, A. K. (1987). A test for normality of observations and regression residuals. Int. Statistical Rev. 55, 163–172. doi: 10.2307/1403192
Johansen, S. (1988). Statistical analysis of cointegration vectors. J Econ. Dynam. Control Amsterdam: Elsevier, 12, 231–254. doi: 10.1016/0165-1889(88)90041-3
Kimengsi, J. N., and Tosam, J. N. (2013). Climate variability and cocoa production in Meme Division of Cameroon: agricultural development policy options. Greener J. Agricult. Sci. 3, 606–617. doi: 10.15580/GJAS.2013.3.022713505
Komakech, H. C., Obeng-Ofori, D., and Sakyi-Dawson, E. (2020). Intercropping cocoa with nitrogen-fixing trees improves soil fertility and resilience to drought and climate variability in a cocoa agroforestry system. Agroforestry Syst. Berlin: Springer, 94, 1251–1266.
Kreft, S., Eckstein, D., and Melchior, I. (2017). Global climate risk index. Who suffers most from extreme weather events? Weather-related loss events in 2015 and 1996 to 2015. Germanwatch Nord-Sud Iniative eV. Available online at: www.germanwatch.org/en/cri (accessed November 11, 2022).
Kwakye, M., Bonsu, K. O., Darko-Obiri, B., and Gaisie, E. (2021). Impact of climate change on cocoa production in Ghana: a case study of offinso municipality. Sustainability. Basel: MDPI, 13, 10147.
Le Quéré, C., Jackson, R. B., Jones, M. W., Smith, A. J., Abernethy, S., Andrew, R. M., et al. (2021). Temporary reduction in daily global CO2(g) emissions during the COVID-19 forced confinement. Nat. Clim. Chang. 11, 230–236. doi: 10.1038/s41558-020-0797-x
Lescuyer, G., Boutinot, L., Goglio, P., and Bassanaga, S. (2020). Analysis of the cocoa value chain of Cameroon. Value chain analysis for development (VCA4D) report funded by the European Commission/DEVCO and its implementing partner Agrinatura. Available online at: https://eu/capacity4dev/value-chain-analysis-for-development-vca4d- (accessed 11 March, 2023).
Loves, L., Usman, M., Warsono, W., and Russel, E. (2021). Modeling Multivariate Time Series by Vector Error Correction Models (VECM). J. Phyicss. 1751, 012013. doi: 10.1088/1742-6596/1751/1/012013
Lutkepohl, H. (2005). New Introduction to Multiple Time Series Analysis. (Berlin: Springer Verlaag). doi: 10.1007/978-3-540-27752-1
Mahob, R. J., Taliedje, D. M., Mahot, H. C., Ngah, I. M., Enama, S. E., Cilas, C., et al. (2021). Biocontrol of the brown cocoa mirids using neem oil and an ethanolic extract from neem under laboratory conditions. African Entomol. 29, 507–521. doi: 10.4001/003.029.0507
Mahot, H. C., Mahob, J. R., Hall, D. R., Arnold, S. E., Fotso, A. K., Membang, G., et al. (2020). Visual cues from different trap colours affect catches of Sahlbergella singularis (Hemiptera: Miridae) in sex pheromone traps in Cameroon cocoa plantations. Crop Protect. 127, 104959. doi: 10.1016/j.cropro.2019.104959
Mensah, M. A., Ibrahim, S., Adewuyi, S. A., and Mutalib, S. A. (2021). Effect of climate change on cocoa production in West Africa: a review. Renewable Sust. Energy Rev. Amsterdam: Elsevier, 148, 111320.
Molua, E. L. (2022). Private farmland autonomous adaptation to climate variability and change in Cameroon. Rural Society. 31, 115–135. doi: 10.1080/10371656.2022.2086223
Navarro, J. A., Pérez-Hernández, O., and Deheuvels, O. (2018). Climate change impacts on cocoa: A review of the current knowledge and research gaps. Eur. J. Agron. Amsterdam: Elsevier, 92, 129–141.
Ngo Bieng, M. A., Nkouathio, D. G., and Kuate Tegoum, P. (2018). Perception and adaptation strategies of cocoa farmers to climate change: a case study in three agroecological zones of Cameroon. J. Agri. Environ. Sci. Wiley Online Library, 7, 77–86.
Ngoe, M., Fonge, B. A., and Diopoh, J. K. (2018). Assessing the impact of cocoa farming on livelihoods and poverty among smallholder farmers in Cameroon. J. Agribusiness Dev. Emerg. Econ. 8, 1–15.
Ngong, J. T., Akume, A. D., Forgha, N. G., and Wujung, V. A. (2019). An empirical investigation of the determinants of cocoa production in the Southwest Region of Cameroon. Int. J. Econ. Commerce Manag. 7, 01–14.
Ngong, J. T., and Forgha, N. G. (2013). An analysis of the socio-economic determinants of cocoa production in Meme Division, Cameroon. Greener J Business Manag. Stud. 3, 298–308.
Ngongi, A. N. (2016). Africa Agriculture Status Report. Progress towards Agricultural Transformation in Africa; Forward, International Journal of Economics, Commerce and Management (IJECM) Publishing. Available online at: https://agra.org/aasr2016 (accessed 11 March 2023).
Niyibituronsa, A., Mbonimpa, E. G., Niyitugabira, V., and Nzeyimana, J. (2022). Climate variability and changes in Burundi and their implications on agriculture. Climate 10, 1–15.
Njiti, C. F., Ngome, A. F., Tchaleu, G. N., and Nkongho, R. N. (2021). Impacts of climate change on cocoa production in Cameroon: evidence from the humid and sub-humid regions. Agric. Syst. Amsterdam: Elsevier, 190, 103150.
Njoya, A., Suh, C., Kamga, R., and Nkongho, R. N. (2021). Farmers' perception of climate change and its impacts on crop production in the humid forest zone of Cameroon. Climate Dev. Taylor & Francis Online, 13, 18–29.
Nkem, J., Mala, W. A., and Yinda, G. S. (2021). “Agroforestry as a climate change adaptation strategy in Cameroon,” in Krishnaswamy, B. A., Singh, R. S., Lal, R., and Lal, R. K. (eds.), Agroforestry for Climate Resilient Agriculture in Southern Africa. Berlin: Springer Nature. p. 293–307.
Nkouathio, D. G., Kouam, E. R., and Mfegue, C. V. (2018). Impact of climate change on agriculture in Cameroon: a review. Adv Res. Cairo University, 14, 1–14.
Nkwi, G. E., Fani, D. C. R., Ahungwa, G. T., and Ukpe, U. H. (2023). “Climate Change and Agricultural Output: The Need for Policy,” in Agricultural Transformation in Africa: Contemporary Issues, Empirics, and Policies. Cham: Springer International Publishing. p. 137–151. doi: 10.1007/978-3-031-19527-3_10
Nouck, P. N., Nchoutnji, I., Nchoutnji, R. J., and Ngosong, C. (2019). Impact of climate change on agriculture and food security in Cameroon. Int. J. Environm. Sci. Technol. 16, 1193–1204.
Oduro, W., Mensah, J. K., and Gyedu-Akoto, E. (2021). Impact o8f pests and diseases on cocoa (Theobroma cacao L.) production in Ghana. African J. Agri. Res. Lagos: Academic Journals, 16, 329-341.
Ojumo, O. G., Ojumo, M. F., and Joonas, k. (2020). A theoretical framework for assessing the impact of climate change on crop yields. AIMS Int. J. Manag. 14, 65. doi: 10.26573/2020.14.2.1
Olivier, G., and Bakari, S. (2021). The stubborn reality of child labor in the cocoa industry: An analysis of the Ivory Coast and Ghana. Int. J. Children's Rights. Leiden: Brill, 29, 168-190.
Owoeye, R. S., and Sekumade, A. B. (2016). Effects of climate change on cocoa production In Ondo State, Nigeria. J. Social Sci. Res. 10, 2014–2025. doi: 10.24297/jssr.v10i2.4730
Oyedokun, T., and Oyelana, A. A. (2016). Climate variability and cocoa production in Nigeria: Impacts and adaptation strategies. Int. J. Climate Change Strategies Manag. Emerald Publishing, 8, 237–255.
Oyekale, A. S. (2015). Climate change induced occupational stress and reported morbidity among cocoa farmers in South-Western Nigeria. Annals Agri. Environm. Med. 22, 357–361. doi: 10.5604/12321966.1152095
Pratama, M. F., Rauf, R. A., Antara, M., and Basir-Cyio, M. (2019). Factors influencing the efficiency of cocoa farms: a study to increase income in rural Indonesia. PLoS ONE. 14, e0214569. doi: 10.1371/journal.pone.0214569
Rosadi, D. (2012). Ekonometrika dan Analisis Runtun Waktu Terapan dengan Eviews Yogyakarta: Penerbit Andi Offset.
Ryan, S., and Bicknell, J. (2021). Child labor in cocoa production in Ghana and Ivory Coast: Policy versus practice. Dev. Pract. Taylor & Francis, 31, 525–538.
Sayouri, A., Jabbour, J., and Hénin, S. (2021). Evaluating the effects of climate change on cocoa production in Côte d'Ivoire. J. Environ. Manage. Amsterdam: Elsevier, 291, 112555.
Schroth, G., Läderach, P., Martinez-Valle, A. I., and Bunn, C. (2017). From site level to regional adaptation planning for tropical commodities: Cocoa in West Africa. Mitig. Adapt. Strateg. Glob. Chang. 22, 903–927. doi: 10.1007/s11027-016-9707-y
Schroth, G., Läderach, P., Martinez-Valle, A. I., Bunn, C., and Jassogne, L. (2016). Vulnerability to climate change of cocoa in West Africa: Patterns, opportunities and limits to adaptation. Sci. Total Environm. 556, 231–241. doi: 10.1016/j.scitotenv.2016.03.024
Sielinou, V. T., Tchinda-Metagne, C., Noubissie, T. S., Ngosong, C., Ngonkeu, E. L. M., and Kamga, R. (2021). Elevated atmospheric CO2(g) and temperature affect the composition and nutritional quality of cassava storage roots in Cameroon. J. Agron. Crop Sci. Wiley-Blackwell Publishing Ltd., 207, 346–357.
Suh, N. N., and Molua, E. L. (2022). Cocoa production under climate variability and farm management challenges: some farmers' perspective. J. Agri. Food Res. 8, 100282. doi: 10.1016/j.jafr.2022.100282
Tahi, G. M., Waeles, M., N'Guessan, A. K., Kouam,é, C., N'Goran, J. A. K., Kouakou, K. T., et al. (2020). Assessing the impact of organic farming on soil quality and cocoa production in Côte d'Ivoire. Agric. Ecosyst. Environ. Amsterdam: Elsevier, 289, 106733.
Tamanjong, E., and Neena, R. (2014). “Insect threat to Cameroon cocoa crop,” in Sap-sucking bug infests African Nation as demand for chocolate ingredient is set to outstrip supply, Wall St. J. (2014). Available online at: https://www.wsj.com/articles/SB10001424052702303795904579433041249679608 (accessed August 05, 2020).
Tchinda-Metagne, C., Gockowski, J., and Nyemeck, J. (2020). Modeling the potential impacts of climate change on cocoa (Theobroma cacao L.) production in three agro-ecological zones of Cameroon. Climate Dev. Taylor and Francis Ltd., 12, 731–745.
Tchokote, J., Martin, P., Nguezet, D., and Onyebuchi, O. K. (2015). An economic appraisal of cocoa production in Cameroon: The case study of Lekie Division. J. Econom. Sustain. Develop. 6, 168–181.
Tening, A. S., Njukeng, A. P., Kien, C. N., and Nkwatoh, A. F. (2021). Assessing the impacts of climate change on cocoa production in southwestern Cameroon. Environ. Sci. Pollut. Res. 28, 20271–20284.
Thompson, S. A., and Bekele, E. J. (2019). The impact of climate change on cocoa production: a systematic review. Renewable Agri. Food Syst. Cambridge University Press, 34, 12–25.
Tsay, R. S. (2014). Multivariate Time Series Analysis: With R and Financial Applications. Hoboken New Jersey: John Wiley and Sons, Inc.
UNDP (2021). Cameroon. New York: UNDP. Available online at: https://www.undp.org/content/undp/en/home/countries/cameroon.html. (accessed 11 March 2023).
Vaast, P., and Somarriba, E. (2014). Trade-offs between crop intensification and ecosystem services: the role of agroforestry in cocoa cultivation, Agrofor. Syst. 88, 947–956. doi: 10.1007/s10457-014-9762-x
Vargas, R., Cabrera, M., Cicowiez, M., Escobar, P., Hernandez, V., Cabrera, J., et al. (2018). Climate risk and food availability in Guatamala. Environm. Dev. Econ. 23, 558–579. doi: 10.1017/S1355770X18000335
Warsono, W.arsono, Sulung, L., and Hartono, M. (2019). Modeling and forecasting by the vector autoregressive moving average model for export of coal and oil data. Int. J. Energy Econ. Policy. 9, 240–247. doi: 10.32479/ijeep.7605
Warsono, W.arsono, Sulung, L., and Hartono, M. (2020). Dynamic modeling using vector error-correction model studying the relationship among data share price of energy PGAS Malaysia, AKRA, Indonesia, and PTT PCL-Thailand. Int. J. Energy Econ. Policy. 10, 360–373. doi: 10.32479/ijeep.8946
Wei, W. W. S. (2019). Multivariate Time Series Analysis and Applications. Hoboken New Jersey: John Wiley and Sons Inc. doi: 10.1002/9781119502951
World Bank (2021). The Changing Wealth of Nations 2021: Building a Sustainable Recovery. Washington, DC: World Bank.
World Bank (2022). Climate Change Knowledge Portal. Washington, DC: World Bank Group. Available online at: https://climateknowledgeportal.worldbank.org/ (accessed December 3, 2022).
World Bank. (2019). World Development Report. 2019, The Changing Nature of Work. Washington, DC: World Bank Group. Available online at: https://www.worldbank.org/en/publication/wdr2019
World Meteorological Organization (2019). United in Science: High-level synthesis report of latest climate science information convened by the Science Advisory Group of the UN Climate Action Summit 2019. Geneva, Switzerland: WMO. Available online at: https://public.wmo.int/en/resources/united_in_science (accessed March 11, 2023).
World Meteorological Organization (2021). State of the Global Climate 2020. Geneva, Switzerland: WMO. Available at: https://library.wmo.int/doc_num.php?explnum_id=10410 (accessed 11 March, 2023).
Keywords: climate change, cocoa, supply response model, Vector Error Correction Model, climate-smart agriculture, cameroon
Citation: Bomdzele EJ and Molua EL (2023) Assessment of the impact of climate and non-climatic parameters on cocoa production: a contextual analysis for Cameroon. Front. Clim. 5:1069514. doi: 10.3389/fclim.2023.1069514
Received: 14 October 2022; Accepted: 18 May 2023;
Published: 15 June 2023.
Edited by:
Sirkku Juhola, University of Helsinki, FinlandReviewed by:
Priscilla Ntuchu Kephe, Potsdam Institute for Climate Impact Research (PIK), GermanyTerence Epule Epule, Mohammed VI Polytechnic University, Morocco
Copyright © 2023 Bomdzele and Molua. This is an open-access article distributed under the terms of the Creative Commons Attribution License (CC BY). The use, distribution or reproduction in other forums is permitted, provided the original author(s) and the copyright owner(s) are credited and that the original publication in this journal is cited, in accordance with accepted academic practice. No use, distribution or reproduction is permitted which does not comply with these terms.
*Correspondence: Eric Jr. Bomdzele, ZWJvbWR6ZWxlQGdtYWlsLmNvbQ==
†ORCID: Eric Jr. Bomdzele orcid.org/0000-0002-7479-3029
Ernest L. Molua orcid.org/0000-0001-8724-6035