 Catherine Nakalembe
 Diana B. Frimpong
 Hannah Kerner
 Mamadou Adama Sarr
- 1Department of Geographical Sciences, University of Maryland, College Park, MD, United States
- 2Arizona State University, School of Computing and Augmented Intelligence, Tempe, AZ, United States
- 3Centre de Suivi Ecologique, Dakar, Senegal
Climate change impacts manifest differently worldwide, with many African countries, including Senegal, being particularly vulnerable. The decline in ground observations and limited access to these observations continue to impede research efforts to understand, plan, and mitigate the current and future impacts of climate change. This occurs at a time of rapid growth in Earth observations (EO) data, methodologies, and computational capabilities, which could potentially augment studies in data-scarce regions. In this study, we utilized satellite remote sensing data leveraging historical EO data using Google Earth Engine to investigate spatio-temporal rainfall and temperature patterns in Senegal from 1981 to 2020. We combined CHIRPS precipitation data and ERA5-Land reanalysis datasets for remote sensing analysis and used the Mann–Kendall and Sen's Slope statistical tests for trend detection. Our results indicate that annual temperatures and precipitation increased by 0.73°C and 18 mm in Senegal from 1981 to 2020. All six of Senegal's agroecological zones showed statistically significant upward precipitation trends. However, the Casamance, Ferlo, Eastern Senegal, Groundnut Basin, and Senegal River Valley regions exhibited statistically significant upward trends in temperature. In the south, the approach to climate change would be centered on the effects of increased rainfall, such as flooding and soil erosion. Conversely, in the drier northern areas such as Podo and Saint Louis, the focus would be on addressing water scarcity and drought conditions. High temperatures in key crop-producing regions, such as Saraya, Goudiry, and Tambacounda in the Eastern Senegal area also threaten crop yields, especially maize, sorghum, millet, and peanuts. By acknowledging and addressing the unique impacts of climate change on various agroecological zones, policymakers and stakeholders can develop and implement customized adaptation strategies that are more successful in fostering resilience and ensuring sustainable agricultural production in the face of a changing climate.
1 Introduction
The impacts of climate change manifest uniquely across the world's regions, and Africa remains one of the hotspots of its crippling effects (Cappelli et al., 2023; IPCC, 2023). Climate change impacts ecosystems, people, infrastructure, and agriculture. Extensive empirical research has shown that many African countries, including Senegal, face substantial exposure, have limited adaptive capacity, and exhibit low resilience to climate change and its impacts (Leal Filho et al., 2019; Saeed et al., 2023; IPCC, 2023). This is a significant environmental injustice because Africa has contributed the least to global greenhouse gas emissions of all populated continents (Höhne and Blok, 2005; den Elzen et al., 2005).
In Senegal, poverty and food insecurity compound climate impacts, and research has shows that the impacts on agriculture are mixed. Araya et al. (2022) predicted significant declines of 16%–20% in peanut yields in Senegal for the period 1981–2005 due to rising temperatures. In contrast, Konte et al. (2019) found that rising temperatures could positively impact rice and maize yields in Senegal while potentially harming the growth of other crops, such as sorghum. Ultimately, the impacts of climate change vary across countries within and across agroecological zones, and understanding how to mitigate these impacts will require more localized research.
Access to reliable station-based climate data in Africa remains a significant challenge owing to the uneven distribution of weather stations and poor data quality, resulting in substantial data gaps (Bodian et al., 2020; Dosio et al., 2021; Dinku, 2019; Morice et al., 2012). Despite these limitations, research on climate trends in countries such as Senegal has primarily relied on data from in situ meteorological stations (Koudahe et al., 2017; Bodian et al., 2020). However, approaches that depend solely on in-situ station data face challenges in remote and sparsely gauged areas, in addition to the well-documented difficulty in accessing hydrological and meteorological data (Bodian et al., 2020; Barry et al., 2017; Funk et al., 2012; Fall et al., 2006).
The accuracy of data collected from meteorological stations is often questionable because of unusual data values, errors in handwritten records, data unavailability, and significant data gaps (Mekonnen et al., 2023; Dosio et al., 2021). Undetected data quality issues can profoundly affect climatological analyses, leading to biased results and substantial uncertainties (Hunziker et al., 2018). Consequently, it is crucial to explore alternative approaches to study climate trends in regions with limited station data to fill informational gaps and provide a more comprehensive understanding of the climate in these areas.
Advances in geospatial technology and easier access to high-performance computing resources such as Google Earth Engine (GEE), which stores multi-petabyte curated satellite datasets and facilitates the processing of large datasets, make it possible to implement complex data-intensive analyses of remote sensing data quickly and effectively (Gorelick et al., 2017). Satellite data cover vast, remote areas that are difficult to access or lack dense networks of climate stations (Huntington et al., 2017). The increasing availability of satellite data has enabled the development and application of machine learning models to analyze climate data with greater precision and detail (Magadzire et al., 2022). This has the potential to help the world understand the dynamics and effects of climate change at different scales and solve urgent environmental problems, such as food insecurity (Nakalembe et al., 2021). GEE houses easily obtainable high spatial and temporal resolution agriculture, precipitation, and atmospheric observation data. Some of these include the Climate Hazards Group InfraRed Precipitation with Station (CHIRPS), Tropical Rainfall Measuring Mission (TRMM 3B42), and ECMWF atmospheric reanalysis 5 (ERA5) (Gorelick et al., 2017). Satellite-based rainfall and temperature retrieval algorithms are becoming increasingly popular for climate research owing to their scalability and complementary data to station-based hydro-meteorological data. CHIRPS data, for example, has a strong correlation and relatively lower bias compared to using only station data for monitoring precipitation or drought (Ndecky, 2020; Sacré Regis et al., 2020). However, satellite-derived estimates still have limitations, particularly in high elevation regions and poorer estimates on a daily timescale in Africa due to insufficient data required for downscaling (Macharia et al., 2022; Stewart and Nitschke, 2017; Liu et al., 2020). Other satellite-based products, including the Moderate Resolution Imaging Spectroradiometer (MODIS) and ERA5, have also been evaluated. These studies showed highly consistent results between ERA5 and MODIS in evaluating global and regional land warming trends over the past decades, with strong correlations to observed meteorological station data (Wang et al., 2022).
This study aims to assess the unique spatio-temporal trends in precipitation and temperature in Senegal from 1981 to 2020, leveraging satellite-retrieved datasets accessible in GEE. We analyzed annual and seasonal temperature and precipitation across Senegal and estimated them in all six agroecological zones of Senegal. The methods presented in this study offer a robust and reproducible approach for regions in which ground-based observations are scarce.
1.1 Study area
Senegal is a West African country located between 12.5 and 16.7°C N latitudes and 11.3° and 17.5°W longitude (Figure 1). Its population was 16,876,720 in 2020, representing a 15% increase from 2015 (Population, total – Senegal, 2024). Senegal has a tropical climate with a distinct dry season from November to June and a rainy season from July to October. Average annual temperatures have increased from 28.6°C in 2000 to 29.56°C in 2020, with a hot semi-arid climate inland and coastal tropical conditions (World Bank Climate Change Knowledge Portal, 0000).
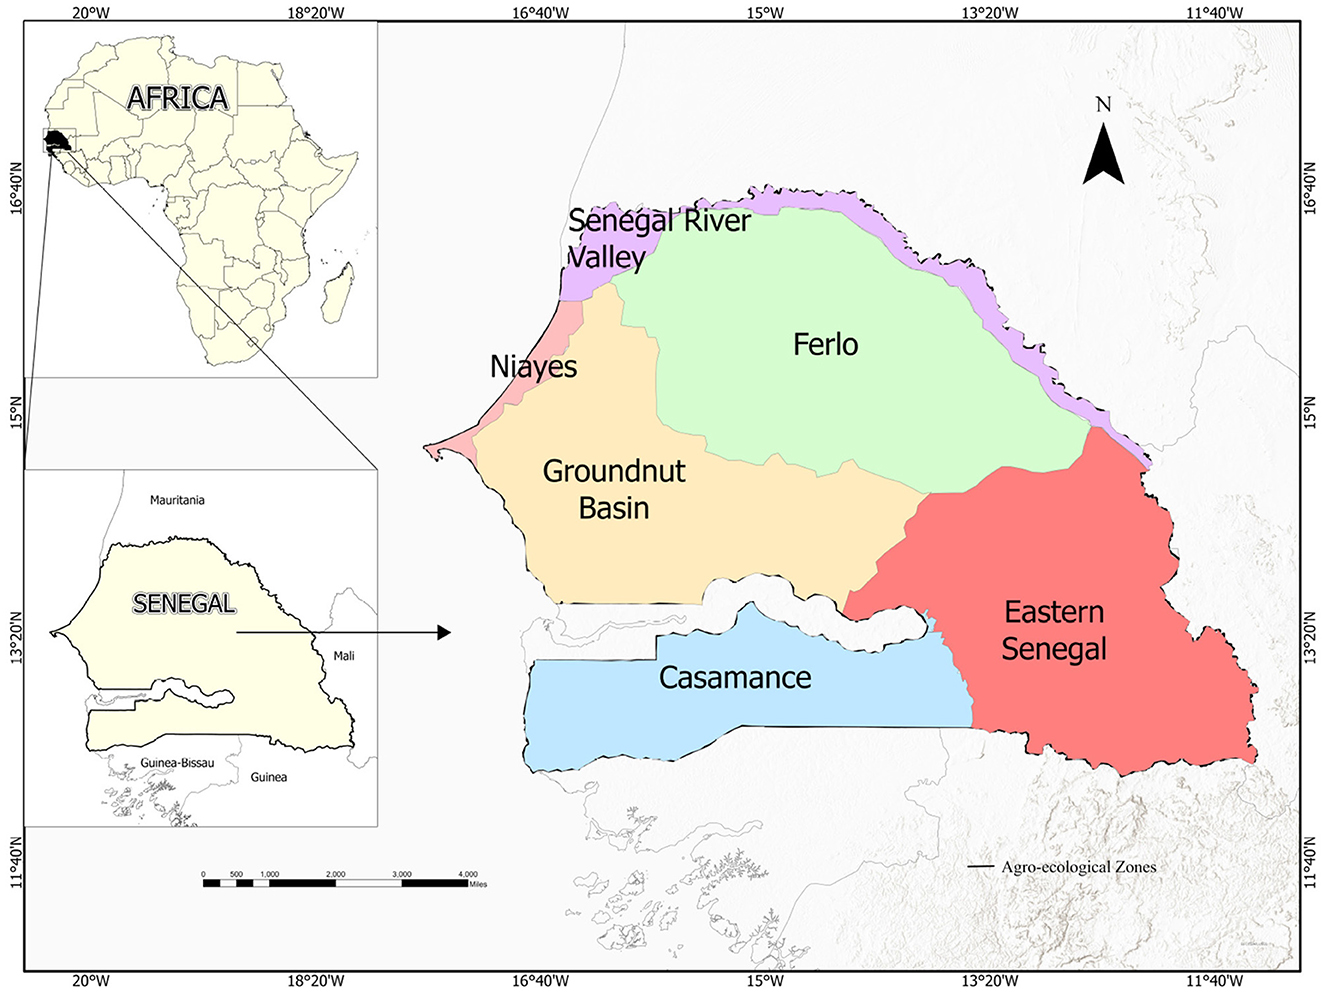
Figure 1. Map of Senegal showing the major agro-ecological zones/ecoregions defined in Tappan et al. (2004).
Senegal is divided into six major agro-ecological zones based on climate, soil, and vegetation characteristics: the Niayes, Senegal River Valley, Groundnut Basin, Casamance, Eastern Senegal, and Ferlo Zone (Tappan et al., 2004; Marfurt et al., 2023). The Niayes zone along the coast has cooler temperatures and unique humid micro-climates conducive to horticulture. The Senegal River Valley in the north has hot, dry conditions but supports irrigated agriculture. The Groundnut Basin in the central regions has relatively abundant rainfall for rainfed agriculture. Casamance and Eastern Senegal receive high rainfall with frequent risks of flooding. The Ferlo Zone has a hot, semi-arid climate suitable for agro-pastoralism.
Agriculture is Senegal's main economic sector, employing 22% of the workforce and contributing 15.7% to GDP in 2022, despite a decline since the 1990s (World Bank Climate Change Knowledge Portal, 0000; Sarr and Sultan, 2023). With over 95% of arable land being dependent on rainfall, agriculture is highly vulnerable to climate change impacts on crop yields (Sabelli et al., 2016; Lamaoui et al., 2018). Limited resources and reliance on smallholder farming constrain Senegal's adaptive capacity, whereas poverty and food insecurity exacerbate the effects of climate change (Nébié et al., 2021; Faye et al., 2022). Although peanut farming has dominated, crop diversification has increased since the 1980s (Diallo et al., 2022). Climate-smart strategies are crucial for enhancing resilience and ensuring future food security amidst climate change. To address these challenges, the government should prioritize development strategies through the continuous assessment and monitoring of changes in agro-ecological zones.
2 Methodology
2.1 Datasets
Table 1 summarizes the datasets used in this study. These include the gridded rainfall data from CHIRPS and air temperature data from ERA5-Land reanalysis.
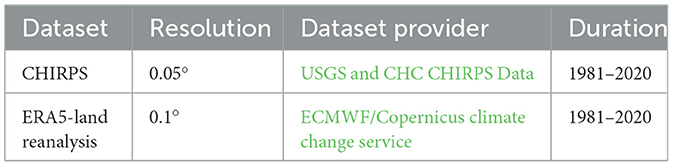
Table 1. Summary of the datasets used in the study.
2.1.1 CHIRPS rainfall data
CHIRPS incorporates satellite imagery and station data to produce a 0.05° resolution gridded rainfall product for trend analysis and drought monitoring (Funk et al., 2015). We accessed CHIRPS data via GEE monthly from 1981 to 2020 (ee.ImageCollection(“UCSB-CHG/CHIRPS/PENTAD”)) (Funk et al., 2015). Previous studies validated CHIRPS against station observations and other satellite precipitation datasets and showed high accuracy in West Africa (Satgé et al., 2020; Sacré Regis et al., 2020). The availability of a 40-year CHIRPS time series enabled this study's precipitation trend analysis in Senegal.
2.1.2 ERA5-land air temperature
The ERA5-Land dataset from the European Center for Medium-Range Weather Forecasts provides consistent global atmospheric reanalysis data from 1950-present at ~11 km resolution, dynamically downscaled from the native 9 km product (Muñoz-Sabater et al., 2021). ERA5-Land data are readily available as an asset from GEE from 1950 to three months from real-time (ee.ImageCollection (“ECMWF/ERA5_LAND/HOURLY”)).
3 Approach
We analyzed precipitation and temperature patterns in Senegal from 1981 to 2020 using CHIRPS rainfall and ERA5-Land temperature data. Seasonal and monthly averages were calculated, and zonal statistics were derived for each agroecological zone (Tappan et al., 2004).
Data were extracted and processed in GEE. Monthly and seasonal statistics were calculated efficiently using ee.Reducer functions allowed for the derivation of temporal patterns. Zonal statistics were computed with ee.Image.reduceRegions() to analyze spatial variability across different regions. GEE's powerful processing capabilities facilitated a robust and streamlined workflow for data extraction, quality checking, and statistical analysis (Figure 2).
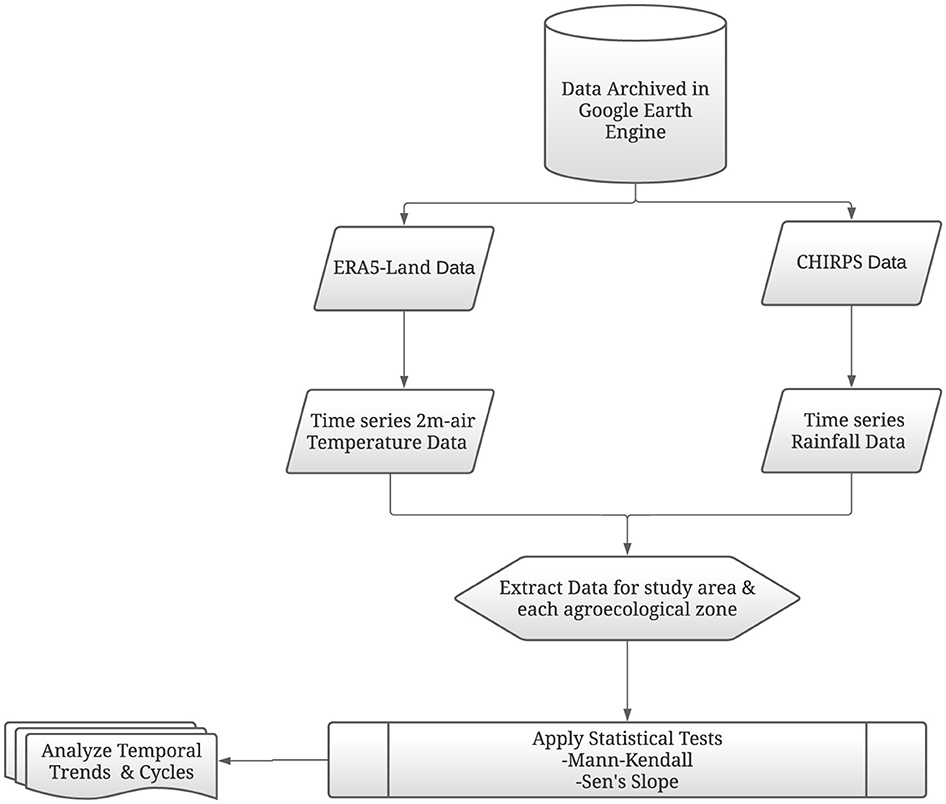
Figure 2. Methodological flowchart outlining the key steps in analyzing temperature and precipitation trends across Senegal from 1981–2020 using CHIRPS, MODIS, and ERA5-Land datasets in GEE and R.
3.1 Trend analysis
We quantified trends in each pixel using the non-parametric Mann–Kendall test for trend significance (Supplementary material A1) and Sen's slope estimator for magnitude (Supplementary material A5) (Sen, 1968; Mann, 1945). These methods are particularly well-suited for climate time series analysis as they make no assumptions about the underlying data distribution, are robust to outliers, and can handle missing values effectively. The Mann–Kendall test specifically excels at detecting monotonic trends in environmental data that may exhibit non-normal distributions and temporal irregularities. These robust non-parametric approaches have become increasingly adopted for precipitation and temperature change analysis, including recent implementations in Google Earth Engine (Zeng et al., 2019; Banerjee et al., 2020).
The Mann–Kendall test was applied to each pixel time series to determine the presence of significant increasing or decreasing trends. In GEE, this was implemented using the ee.Reducer.mannKendall() function, which calculates the Mann–Kendall test statistic (Z) and p-value based on the rank correlation between the time series values and their temporal order. Pixels with an absolute Z value >1.96 (corresponding to a p-value < 0.05) were considered to have a significant trend at the 95% confidence level.
We used Sen's slope, which calculates the median slope between all pairwise points in a time series, to estimate the magnitude of significant trends. In GEE, this was implemented using the ee.Reducer.sensSlope() function. For each pixel, the median slope was calculated if the Mann–Kendall test indicated a significant trend (p < 0.05).
To summarize trends at the agroecological zone level, we first calculated the spatial averages of the annual precipitation and temperature time series within each zone using the ee.Image.reduceRegions() function with the agroecological zone boundaries (Tappan et al., 2004) as input features. Each zone's resulting annual time series were then exported to R, where the Mann–Kendall and Sen's slope tests were applied using the “trend” package to assess long-term regional trends.
This approach leverages GEE to efficiently apply trend tests to each pixel across the entire study area, while also allowing for more detailed regional summaries. The 40-year CHIRPS and ERA5-Land datasets enabled a statistically robust assessment of recent climate changes at both the pixel and agroecological zone scales.
The MK test determined whether the precipitation or temperature time series of each pixel showed a significant trend at the 95% confidence level. Pixels with MKstatistic≥1.96 were considered to have a significant trend.
Additionally, we quantified the magnitude of the trend using non-parametric Sen's slope method (Sen, 1968). Sen's slope estimates the magnitude of the change per unit time. It calculates the median of all pairwise slopes between sequential data points and quantifies the trend slope.
We implemented Sen's slope in GEE to estimate the monotonically increasing/decreasing tendency over time and in R for each agro-ecological zone. Temperature and precipitation data were extracted for each zone, and statistical tests were applied to detect trends over time. However, it is important to recognize the limitations of this approach. Although the satellite-based datasets used here have been extensively validated and shown to perform well, there is still potential for bias and uncertainty, particularly in areas with complex topography or limited in-situ data for calibration (Macharia et al., 2022; Stewart and Nitschke, 2017). The 0.05° and 0.1° spatial resolutions of CHIRPS and ERA5-Land, respectively, may also smooth out fine-scale variability. Integrating the available station observations could help refine the trends identified here.
Additionally, while non-parametric trend tests are robust to non-normality and missing values, they assume the observations are independent. A positive serial correlation can increase the likelihood of detecting significant trends in which none exists (Jhajharia et al., 2014).
4 Results
4.1 Precipitation distribution and variation from 1981–2020
Figure 3 shows the spatial distribution of the mean annual and seasonal precipitation across Senegal, from 1981 to 2020. There was considerable variation in the spatial distribution of precipitation across the different seasons. In the rainy season, the maximum rainfall did not exceed 55 mm average rainfall between 1981–2000. However, the average rainfall patterns in the southeast and southwest regions showed distinct shifts between 1981–2000 and 2001–2020, exceeding 65 mm in certain regions. Conversely, during the dry season, the entire country experiences exceedingly arid conditions, with the average precipitation across the region for the past four decades falling below 5 mm. This stark seasonal contrast underscores the significant variations in precipitation throughout the year.
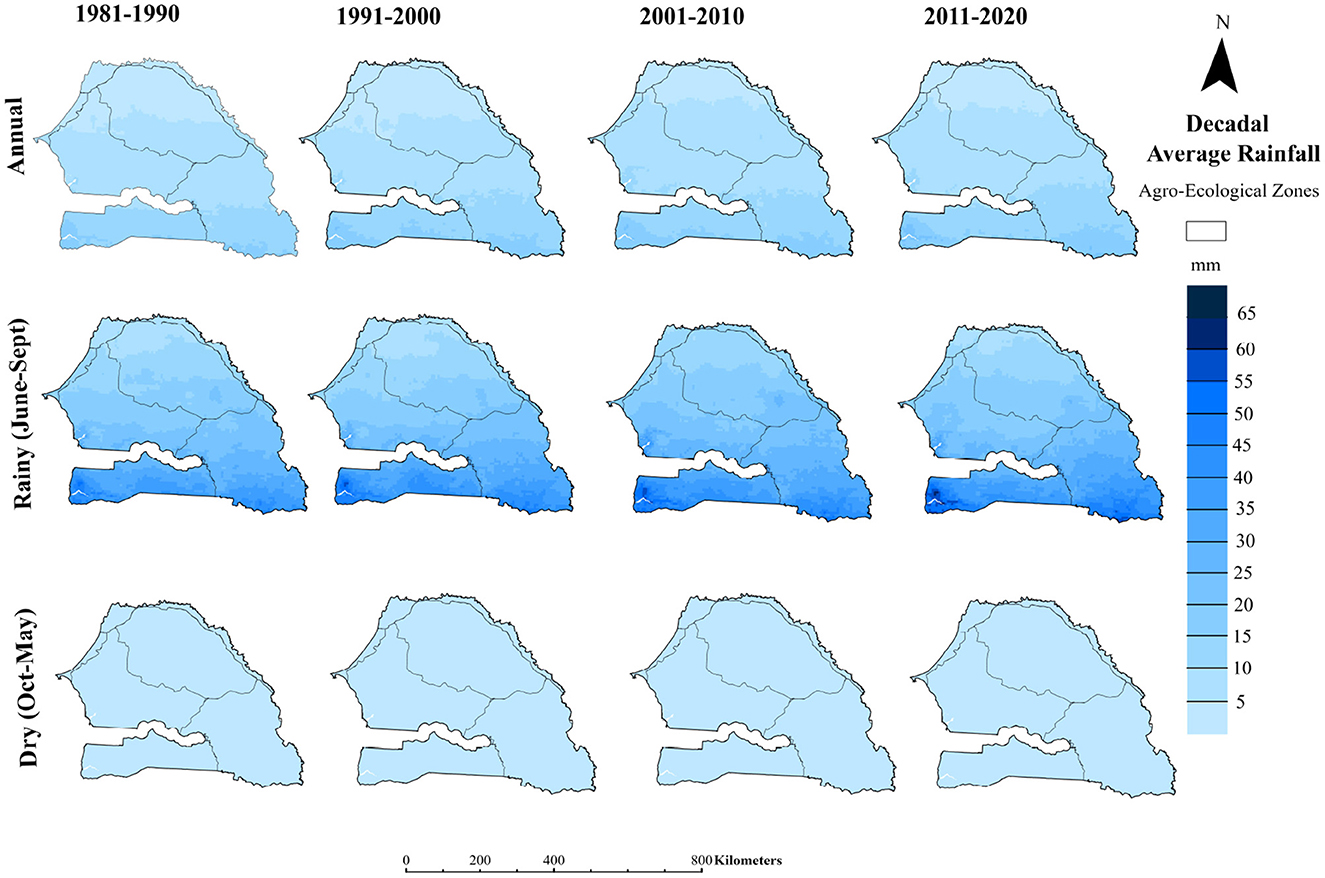
Figure 3. Decadal mean annual and seasonal rainfall for Senegal, 1981–2020.
Figure 3 shows the annual rainfall variations from 1981 to 2020 with alternating periods of dry and wet years within the recorded timeline. This pattern indicates variability in precipitation, with specific years (1983, 1990, 1991, 2011, 2014, and 2019) exhibiting notably drier conditions with lower yearly averages and others displaying increased rainfall or wetter conditions (1999, 2010, and 2020) with higher yearly averages in Senegal. Such variability in annual precipitation suggests fluctuations in the region's climate, with alternating periods of drought and increased moisture levels, potentially impacting agricultural practices, water resource management, and ecological systems. This may be linked to recurrent El Niño events, which significantly affect climatic variability in the Sahel region (Pomposi, 2016). Overall, with a 95% confidence interval of 0.1116–0.4636 mm, the rate of change of precipitation in Senegal is calculated to be 0.288 mm annually using the Mann–Kendall trend test and Sen's slope estimator. Given that the confidence range excludes 0, this suggests a statistically significant increase (R2 = 0.26, p ≤ 0.05) in average annual rainfall from 1981 to 2020 (Figure 4).
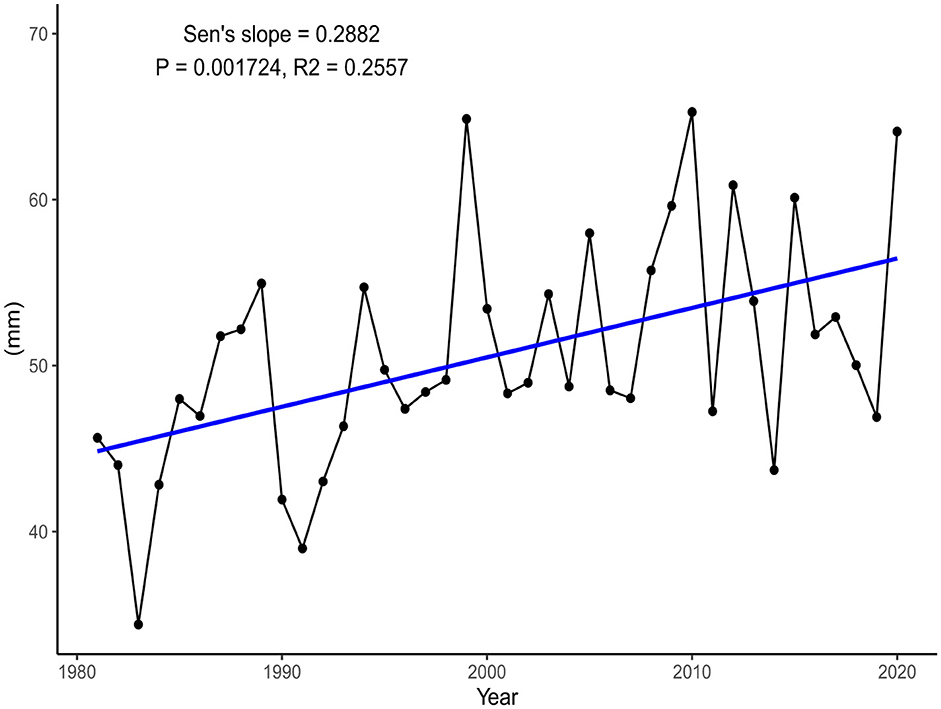
Figure 4. Average precipitation trend in Senegal from 1981–2020.
4.2 Temperature distribution and variation from 1981–2020
Figure 5 illustrates the mean temperatures for both the rainy season (June–September) and dry season (October–May) for the periods 1981–2000 and 2001–2020, respectively. Notably, regions closer to water bodies and located in the southern areas, such as Saint Louis, Louga, Keberner, Ziguinchor, and Tivaoune, consistently exhibited lower temperatures ranging from 22–27°C in all seasons. Compared to inland areas, these locations experience a distinct cooling effect owing to proximity to the Atlantic Ocean. The overall analysis revealed a statistically significant increase of 0.73°C (R2 = 0.24, p ≤ 0.05) in the mean temperature from 1981 to 2020 (Figure 6).
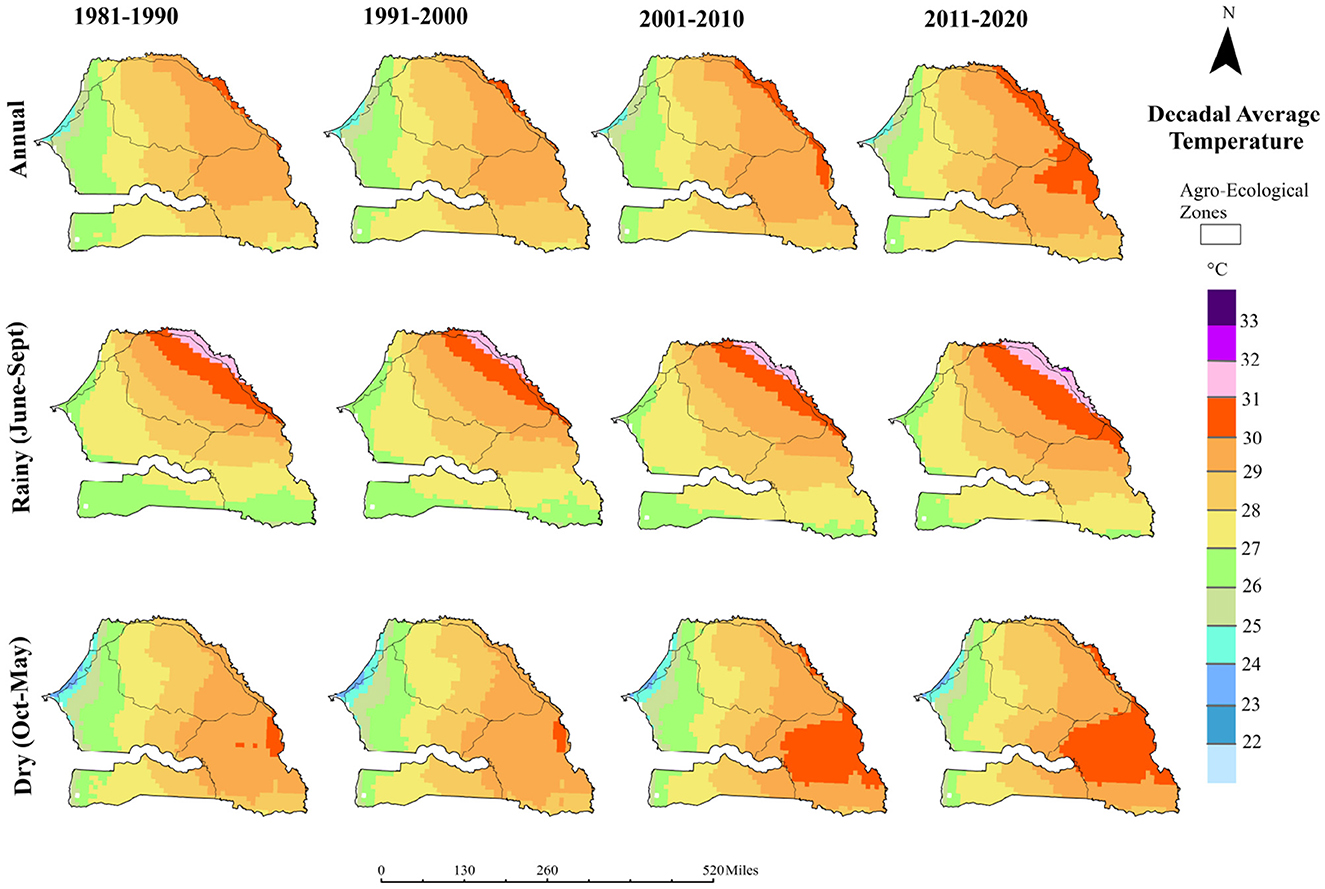
Figure 5. Decadal mean and seasonal temperatures for Senegal, 1981–2020.
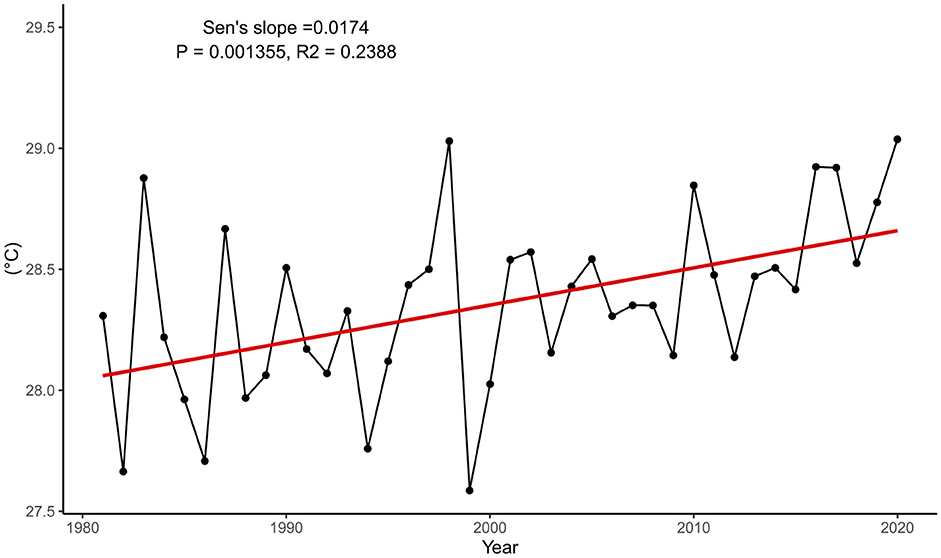
Figure 6. Average temperature trend in Senegal from 1981–2020.
Despite the significant increase in temperature across the region over the past four decades, the most recent decade (2011–2020) exhibited a 0.69% decrease compared with the previous decade (2001–2010), as Supplementary material C1.
Senegal's annual temperature change rate is estimated to be 0.017°C, with a 95% confidence interval of 0.0072 to 0.0259°C, based on the Mann–Kendall trend test and Sen's slope estimator. This indicates a statistically significant increasing trend in temperature, as the confidence interval does not include zero. The range reflects some uncertainty, but all plausible values point to warming over the study period.
4.2.1 Addressing serial correlation
To ensure the validity of the statistical tests, we utilized both the Ljung-Box (Burns, 2002) and the Durbin–Watson Test (Bartels and Goodhew, 1981) to test for autocorrelation in our datasets. The results indicate no significant serial correlation in the data. The Durbin–Watson test yielded a statistics of 2.3394 and 1.8795 with a p-value of 0.8213 and 0.2895, showing no evidence of first-order autocorrelation in both the temperature and precipitation datasets, respectively. Similarly, the Ljung-Box test (p-value = 0.581 and 0.2895) confirms the absence of significant autocorrelation across multiple lags in both datasets, ensuring the validity of the model's residuals.
4.3 Spatial distribution of temperature trends
Figure 7 shows the spatial distribution of the temperature trends (a) and the magnitude of the statistically significant trends (b) across Senegal over the past 40 years (1981–2020). The results revealed widespread warming, with the largest temperature increase concentrated in the inland regions. Areas around Saraya, Goudiry, and Tambacounda have experienced a pronounced warming of 0.2–0.3°C per decade. The hardest-hit areas align with the agriculturally vital Eastern Senegal agroecological zone, a major producer of corn, cotton, millet, peanuts, and sorghum. Considerable warming in this region suggests that crop yields could face mounting heat stress in the coming decades, portending the risk to Senegalese food security.
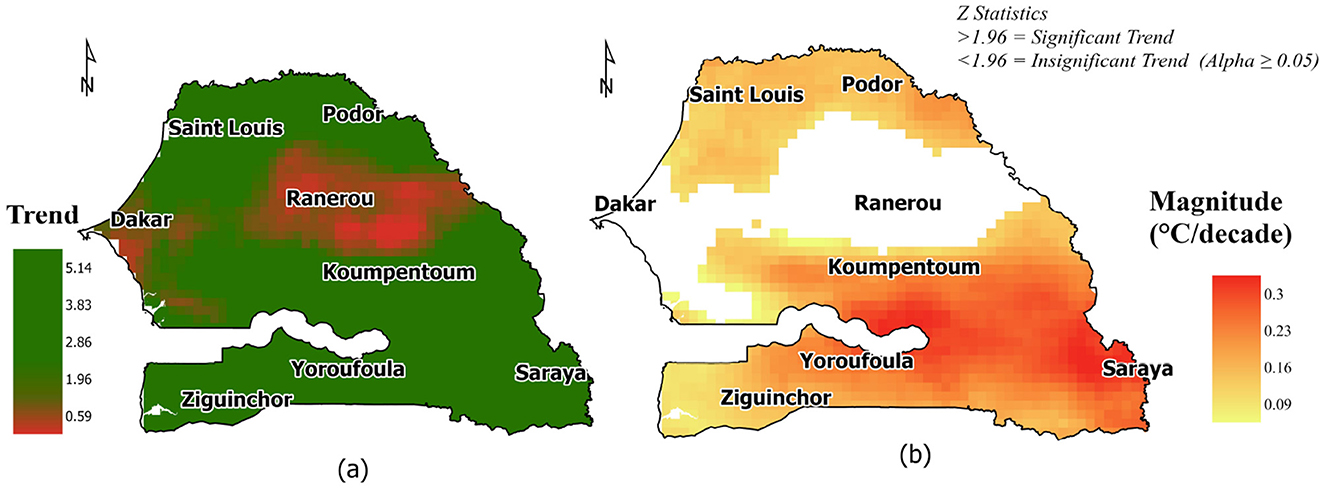
Figure 7. Spatial distribution of (A) temperature trend from 1981 to 2020 using the Mann–Kendall's correlation reducer, and (B) the magnitude of trend in areas with statistically significant trend using the Senslope reducer.
4.4 Spatial distribution of precipitation trends
Figure 8 shows the spatial distribution of the annual precipitation trends from 1981 to 2020 using the Mann–Kendall's correlation reducer and the magnitude of the trend in areas with statistically significant trends. Over the past four decades, most areas in the north, known to be the dry regions of the country, have shown an increasing precipitation tendency, but at a lower magnitude of about 1.42 mm per decade. However, the southeast, western parts and coastal Senegal had relatively higher rainfall magnitudes of 6.33 and 17.77 mm per decade, respectively. This includes Bignonia, Goudomp, Ziguanchor, Oussouye, Saraya, Foundiougne, Fatick, and Keberner, which are also known as the wet regions of Senegal (Figure 8B).
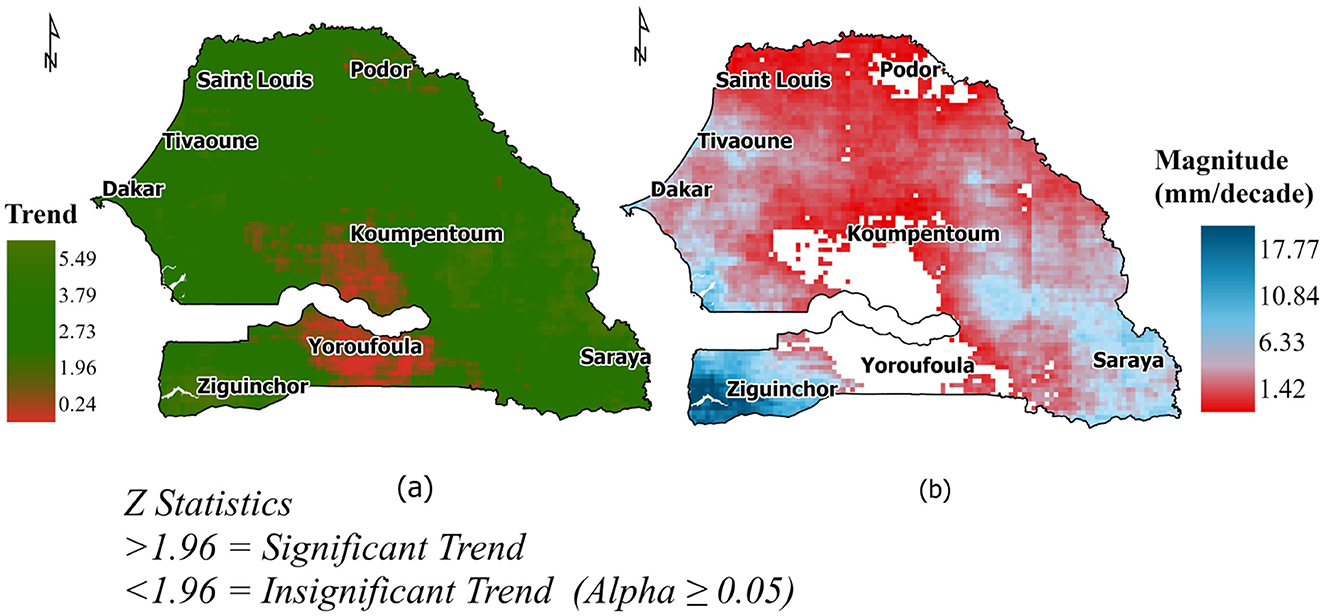
Figure 8. Spatial distribution of (A) yearly precipitation trend from 1981 to 2020 using the Mann–Kendall's correlation reducer, and (B) the magnitude of trend in areas with significant trend using the Senslope reducer.
4.5 Trends in precipitation across agro-ecological zones
To further analyze climate variability across Senegal's agroecological zones, we used the Mann–Kendall and Sen's slope statistical tests to identify significant precipitation trends from 1981 to 2020 (Table 2). Our analysis revealed widespread increases in precipitation, even in the typically driest Senegal River Valley and Ferlo regions (Figure 9). Specifically, the Senegal River Valley has experienced a significant positive precipitation trend over the past four decades (R2 = 0.14, p = 0.04). Ferlo showed a similar trend (R2 = 0.18, p = 0.01), both at p ≤ 0.05.
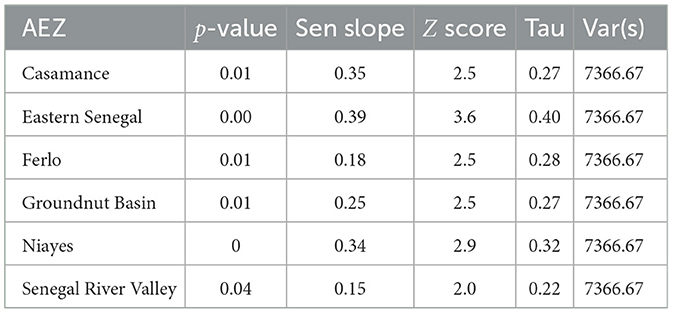
Table 2. Precipitation trend statistics by agro-ecological zone all significant at α = 0.05.
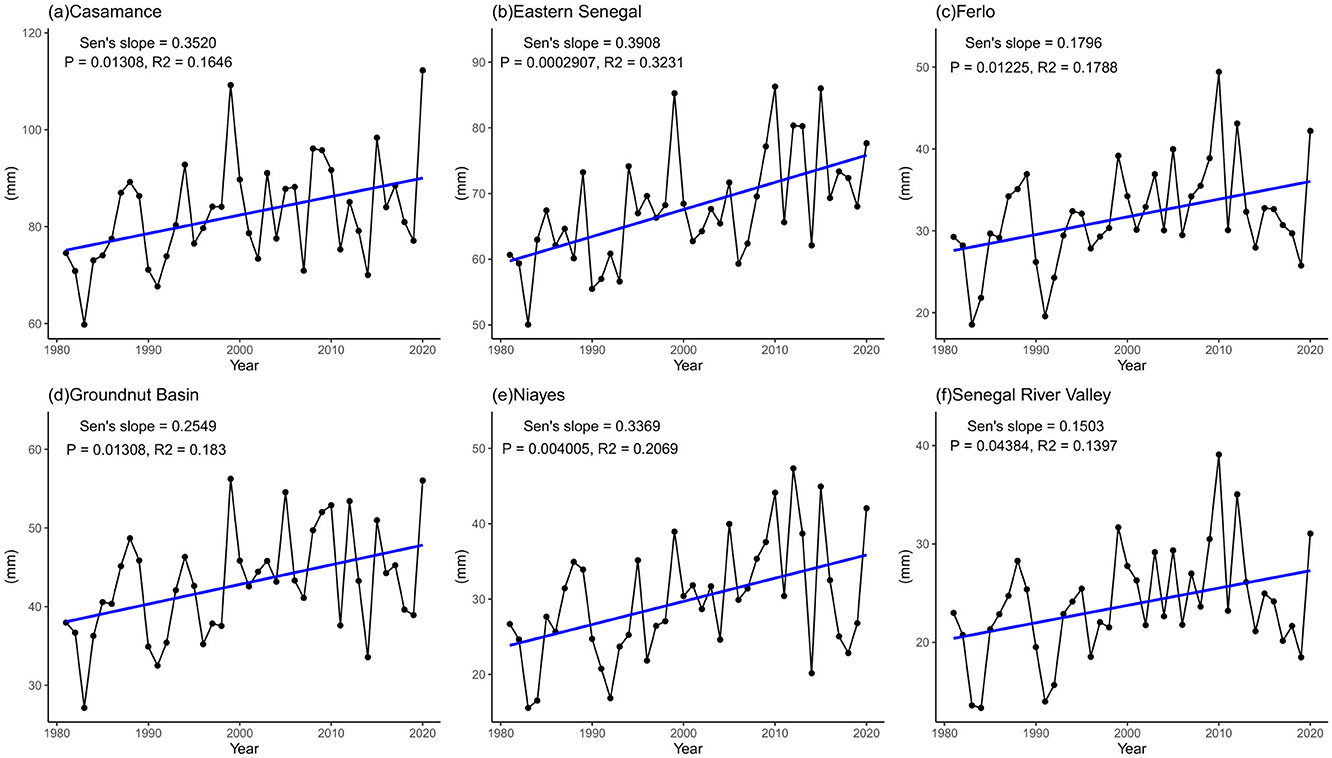
Figure 9. Trends in precipitation using the Mann–Kendall test for the periods 1981–2020.
4.6 Trends in temperature across agro-ecological zones
Our analysis revealed significant warming trends across most of Senegal's agroecological zones from 1981 to 2020, highlighting the spatially heterogeneous nature of climate change impacts. This finding corroborates the regional climate change observations previously reported by Funk et al. (2012) in Senegal. As shown in Figure 10 and Table 3, the Casamance, Eastern Senegal, Ferlo, Groundnut Basin, and Senegal River Valley zones experienced statistically significant temperature increases over the past four decades. The most pronounced warming occurred in the Casamance and Eastern Senegal regions, with Sen's slope values indicating an average increase of 0.16 and 0.19 °C per decade (p < 0.05) respectively (Table 3). The Ferlo, Groundnut Basin, and Senegal River Valley saw slightly lower but significant warming rates, with average temperatures rising between 0.13°C, 0.12°C, and 0.08°C per decade.
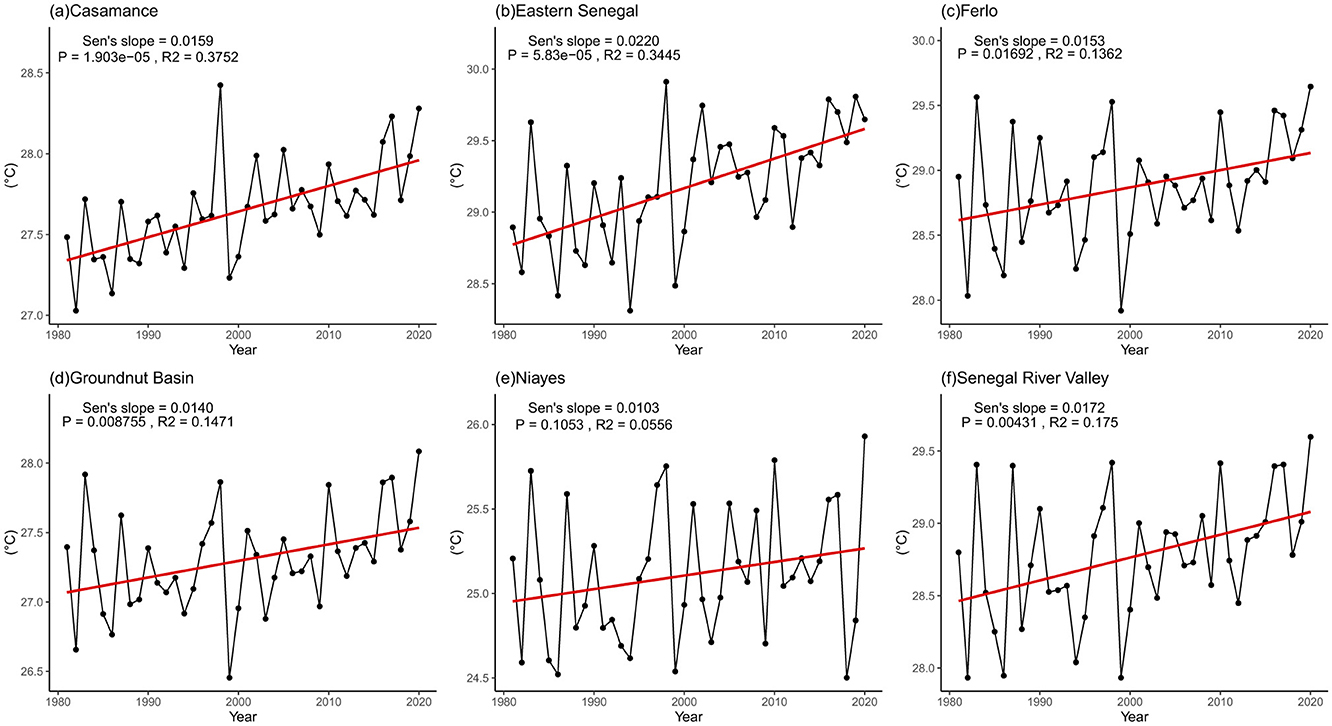
Figure 10. Trends in temperature using the Mann–Kendall Test for the period 1981–2020.
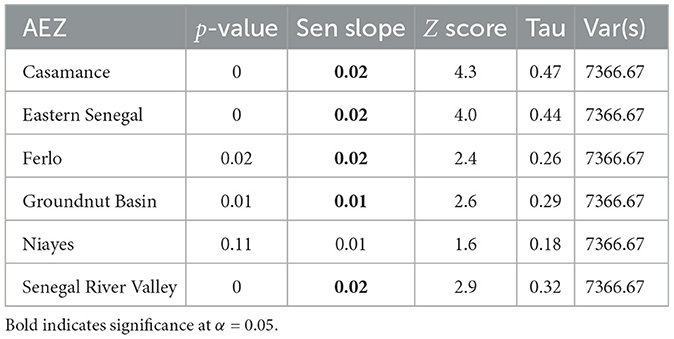
Table 3. Temperature trend statistics by agro-ecological zone.
In contrast, the Niayes zone along the coast exhibited moderate and statistically insignificant warming (R = 0.24, p = 0.14). This result suggests that the cooling may buffer the Niayes from the more rapid temperature increases seen inland.
The divergent temperature trends identified across Senegal's agroecological zones have important implications for planning climate adaptation. The pronounced warming in the southern and eastern regions threatens the productivity of staple crops such as maize, millet, and sorghum, vital for food security (Araya et al., 2022; Konte et al., 2019). In the Ferlo and Senegal River Valley, increasing temperatures may exacerbate existing drought and desertification risks, with consequences for pastoralist communities (Nébié et al., 2021). The gradual warming in the Niayes offers some respite but warrants monitoring and preparedness.
5 Limitations
The reliability of CHIRPS and ERA5-Land datasets for climate analysis in Africa has been extensively validated, though important limitations exist that warrant careful interpretation of our findings. Several studies have confirmed the applicability of these datasets for climate and hydrological studies, particularly drought monitoring (Du et al., 2024; Atiah et al., 2020; Dinku et al., 2018; Muñoz-Sabater et al., 2021; Yilmaz, 2023; Vicente-Serrano et al., 2023). CHIRPS monthly data has demonstrated strong performance in West Africa, with studies by Satgé et al. (2020) and Poméon et al. (2017) confirming its reliability compared to other gridded rainfall products through validation against daily and monthly rain gauge data. Further validation by Ndecky (2020) and Sacré Regis et al. (2020) found CHIRPS monthly data to have relatively lower bias and strong correlation with meteorological station data. In East and Southern Africa, comparison with ~1,200 stations across six countries revealed CHIRPS to perform significantly better than other rainfall products (Dinku et al., 2018; Du Plessis and Kibii, 2021). Similarly, ERA5-Land has shown considerable improvements over previous ERA-interim versions in Africa (Gleixner et al., 2020). Despite its coarser resolution, ERA5-Land has been successfully downscaled using statistical and machine learning techniques, providing reliable temperature data for long-term trend analysis (Raffa et al., 2021; Sebbar et al., 2023; Gleixner et al., 2020; Muñoz-Sabater et al., 2021).
However, several important limitations affect both datasets and necessitate careful interpretation of our findings. Africa remains one of the most undergauged continents, with complex topographies presenting challenges for accurate data collection. This limitation is particularly significant given that both datasets rely on ground-based observations for calibration and validation. CHIRPS exhibits systematic biases, tending to overestimate precipitation during wet seasons and underestimate during dry seasons (Sacré Regis et al., 2020; Dinku et al., 2018). ERA5 shows underestimation patterns in areas with sparse station densities, arid regions, and tropical vegetative zones (Liu et al., 2024). Both datasets share several technical constraints, including increased error rates in monitoring higher elevation areas, smoothing of fine-scale variability due to spatial resolution limitations, and reduced accuracy at daily timescales in Africa due to insufficient downscaling data (Macharia et al., 2022; Stewart and Nitschke, 2017; Liu et al., 2020).
While remote sensing reveals valuable regional climate trends, investment in expanding ground station weather networks across Senegal remains critical. High-resolution ground measurements would serve to validate satellite-derived findings and provide meteorological insights at finer spatial scales. A comprehensive approach integrating satellite monitoring, ground truthing, participatory planning, and localized impact studies will be essential for developing effective climate adaptation strategies. This integrated approach will better support the resilience of Senegal's agricultural and pastoral communities across diverse local geographies.
6 Discussion
This study analyzed precipitation and temperature patterns across Senegal from 1981 to 2020, revealing insights into the country's climate variability. Examining mean rainy and dry season temperatures showed interesting geographic contrasts, notably cooler temperatures near water bodies than inland areas. Locations along the coast and near rivers (Saint Louis, Louga, and Ziguinchor) consistently experienced 22–27°C across seasons, while inland sites experienced higher temperatures.
Our analysis revealed an overall increase in rainfall in Senegal from 1981 to 2020, despite considerable interannual variations and alternating periods of drought and wet years. These findings align with previous studies by Sacré Regis et al. (2020) and Sarr and Sultan (2023), who documented similar trends from 1981–2015 and 1952–2010 respectively. The drivers of these observed temperature and rainfall patterns, particularly the contrast between coastal and inland regions, operate on both regional and global scales (Kang et al., 2008; Biasutti et al., 2018).
Multiple interacting factors contribute to Senegal's climate variability. As detailed by Biasutti (2019), Sea Surface Temperature (SST) variability plays a fundamental role, particularly in the Atlantic and Indian Oceans. North Atlantic SST increases enhance the West African Monsoon, contributing to observed seasonal shifts in rainfall timing and intensity. Concurrently, Indian Ocean SST patterns influence moisture availability for the monsoon system, affecting both temperature extremes and annual rainfall distribution (Song et al., 2018). These oceanic influences operate alongside other key drivers, including land use changes, shifts in the Inter-Tropical Convergence Zone (ITCZ) positioning, and anthropogenic climate change through increased greenhouse gas emissions.
Monitoring these spatial temperature differences and their driving mechanisms is essential for understanding climate change impacts in Senegal. The differential warming rates between inland and coastal areas could exacerbate existing climate risks, particularly for inland agricultural and pastoral communities facing increased heat stress and drought vulnerability. This spatial disparity in climate impacts could potentially influence internal migration patterns toward cooler coastal cities. Therefore, continued analysis of temperature-moderating effects from Senegal's water bodies (lakes, rivers, and oceans) remains crucial for future adaptation planning.
Additionally, our study provides valuable insights into localized climatic variations across the six agroecological zones of Senegal. These findings reveal that Senegal's climate exposure is far from uniform. The southern Casamance and Eastern Senegal zones receive more intense rainfall than the central and northern areas. Over the past four decades, the Groundnut Basin, Ferlo, Senegal River Valley, and Niayes zones saw generally increasing but lower magnitude precipitation trends between 6.33 and 1.4 mm per decade, with insignificant changes in areas like Medina and Kolda. This variability aligns with previously noted inconsistent rainfall patterns (Ahmed et al., 2021).
The rise in temperature was significant across most zones except the coastal Niayes region, likely due to the moderating effects of the Atlantic Ocean. Cooling ocean breezes offer seasonal heat relief. These climatic nuances underscore the need for adaptation strategies tailored to each region's distinct climate risks rather than one-size-fits-all national policies. For instance, rainfall variability may be a priority concern in drier central/northern areas, whereas combined rainfall and warming changes pose a compound risk in the crop-critical south. Tracking subnational climate divergence can provide localized adaptation.
6.1 Impacts of rising temperatures
The persistent rise in temperature, particularly in relatively hot areas such as Saraya, Goudiry, and Tambacounda, threatens crop yields. These areas are the major producing regions of corn (75,000–150,000 metric tons), sorghum (25,000–65,000 metric tons), millet (18,000–95,000 metric tons), and peanuts (100,000–200,000 metric tons) (Senegal Production, 0000).
Climate studies reviewed by Tall et al. (2017) and Ahmed et al. (2021) project Senegal's temperature will rise by a median of 0.90°C (0.70–1.50°C) by 2035, 2.10°C (1.60–3.30°C) by 2065, and 4.00°C (2.6–5.90°C) by 2100. In 2020, temperatures in Casamance, Senegal River Valley, and Ferlo already exceeded 29.5°C. Our study adds spatial nuance, showing that Eastern Senegal and the Senegal River Valley regions will exceed 30.0°C by 2030. Prasad et al. (2001) found that exposing peanuts to temperatures ≥ 33°C during the floral development stage significantly lowers fruit set due to pollen sterility, affecting the overall peanut yield in the long run. Unless targeted adaptation efforts are promptly implemented, this could significantly affect crop yields in the future.
Therefore, implementing targeted interventions tailored to Senegal's diverse climatic zones is imperative. Heterogeneous climate trends underscore the critical importance of localized climate analysis in adaptive planning. Flexible, climate-smart management strategies that can adapt to variable conditions are essential for the sustainable development of Senegal's agriculture and its overall resilience to climate change.
6.2 Implications of variable rainfall and future projections
Based on the Sen's slope values and assuming a linear continuation of observed trends, rainfall projections for 2035 in Senegal's agroecological zones show a slight increase compared to estimated 2020 values, with the highest increases in Casamance (0.35 mm/year) and Eastern Senegal (0.39 mm/year), and the lowest in the Senegal River Valley (0.15 mm/year). While these projections assume a linear continuation of observed trends and do not account for potential non-linear changes, tipping points, or detailed emission scenarios and climate forcings, the unpredictability and variability of rainfall in Senegal pose multifaceted challenges for the country's rainfed agriculture, economy, food security, farmer livelihoods, and livestock. While increased rainfall benefits crop growth, it also increases the risks of flooding, erosion, and malaria outbreaks owing to favorable transmission conditions. Devastating flood events in 1999, 2005, 2009, and 2012 underscores the urgent need for effective flood mitigation measures. Proactive malaria prevention strategies are essential (Dennis et al., 1995; Global Facility for Disaster Reduction and Recovery, 2014; Fall et al., 2022). Furthermore, variable rainfall patterns disrupt pastoralist migratory routes, contributing to livestock losses. Comprehensive strategies are required to address these multifaceted challenges effectively (Schwartzstein, 2023).
Investing in sustainable water management strategies is imperative to enhance resilience across all regions. These should include developing water storage and irrigation infrastructure, adopting climate-smart practices such as cultivating drought-tolerant crops and implementing agroforestry. Additionally, strengthening the institutional capacity for integrated water resource management and promoting cross-sectoral collaboration will be key to effectively addressing the challenges posed by variable rainfall patterns and climate change.
7 Conclusions
This study analyzed the meteorological trends in Senegal from 1981 to 2020 using remote sensing data and GEE. The results show that Senegal experienced a statistically significant increase in annual temperatures, with an overall rise of 0.73°C, and a rainfall increase of 18mm over the past four decades. However, the magnitude of warming and precipitation patterns varied across the country's agroecological zones, with the southern regions experiencing significantly more intense rainfall than the central and northern areas. These findings highlight the importance of conducting localized climate trend analyses to understand better the specific impacts and risks different regions face in Senegal.
The study demonstrates the value of leveraging satellite data and cloud computing to uncover regional climate trends where ground-based observations are limited. Future work could apply this methodology to conduct crop-specific climate trend analyses across Senegal's agricultural areas, informing climate impact assessments to guide adaptation policies and investments that improve food security. An integrated approach coupling satellite monitoring, ground truthing, participatory planning, and localized impact studies is essential to devise climate adaptation strategies that strengthen the resilience of Senegal's agricultural and pastoral communities across localized geographies. Capacity building for decentralized adaptation planning, supportive policies, and financing is paramount.
Data availability statement
The datasets presented in this study can be found here: https://diana-botchway-frimpong.users.earthengine.app/view/climate-trends—senegal. Further inquiries can be directed to the corresponding author.
Author contributions
CN: Conceptualization, Funding acquisition, Investigation, Methodology, Project administration, Resources, Supervision, Writing – original draft, Writing – review & editing. DF: Data curation, Formal analysis, Investigation, Methodology, Visualization, Writing – original draft, Writing – review & editing. HK: Writing – review & editing. MS: Writing – review & editing.
Funding
The author(s) declare financial support was received for the research, authorship, and/or publication of this article. This research was funded by NASA SERVIR grant number NNH22ZDA001.
Conflict of interest
The authors declare that the research was conducted in the absence of any commercial or financial relationships that could be construed as a potential conflict of interest.
Publisher's note
All claims expressed in this article are solely those of the authors and do not necessarily represent those of their affiliated organizations, or those of the publisher, the editors and the reviewers. Any product that may be evaluated in this article, or claim that may be made by its manufacturer, is not guaranteed or endorsed by the publisher.
Supplementary material
The Supplementary Material for this article can be found online at: https://www.frontiersin.org/articles/10.3389/fclim.2025.1462626/full#supplementary-material
Data Sheet 1 | Decadal Percentage Change of Average Precipitation from 1981.
Data Sheet 2 | Average Temperature with % change from year 1981.
Data Sheet 3 | Percentage Change in Average Precipitation from 1981.
Data Sheet 4 | Quinquennial Percentage Change of Average Precipitation from 1981.
Data Sheet 5 | Decadal Percentage Change of Average Temperature from 1981.
Data Sheet 6 | Average Temperature with yearly % change.
Data Sheet 7 | Average Precipitation with yearly % change.
Data Sheet 8 | Quinquennial Percentage Change of Average Temperature from 1981.
References
Ahmed, A., Suleiman, M., Abubakar, M. J., and Saleh, A. (2021). Impacts of climate change on agriculture in Senegal: a systematic review. J. Sustain. Environ. Peace 4, 30–38. doi: 10.53537/jsep.2021.09.004
Araya, A., Jha, P., Zambreski, Z., Faye, A., Ciampitti, I., Min, D., et al. (2022). Evaluating crop management options for sorghum, pearl millet and peanut to minimize risk under the projected midcentury climate scenario for different locations in Senegal. Clim. Risk Manag. 36:100436. doi: 10.1016/j.crm.2022.100436
Atiah, W. A., Amekudzi, L. K., Aryee, J. N. A., Preko, K., and Danuor, S. K. (2020). Validation of satellite and merged rainfall data over Ghana, West Africa. Atmosphere 11:859. doi: 10.3390/atmos11080859
Banerjee, A., Chen, R., Meadows, E., Singh, M., Mal, R., Sengupta, S. D., et al. (2020). An analysis of long-term rainfall trends and variability in the uttarakhand himalaya using google earth engine. Remote Sens. 12:709. doi: 10.3390/rs12040709
Barry, N. Y., Traore, V. B., Ndiaye, M. L., Isimemen, O., Celestin, H., Sambou, B., et al. (2017). Assessment of climate trends and land cover/use dynamics within the Somone river basin, Senegal. Am. J. Clim. Change 6:513. doi: 10.4236/ajcc.2017.63026
Bartels, R., and Goodhew, J. (1981). The robustness of the Durbin–Watson test. Rev. Econ. Statist. 63, 136–139. doi: 10.2307/1924228
Biasutti, M. (2019). Rainfall trends in the African Sahel: characteristics, processes, and causes. Wires Clim. Change 10:e591. doi: 10.1002/wcc.591
Biasutti, M., Voigt, A., Boos, W. R., Braconnot, P., Hargreaves, J. C., Harrison, S. P., et al. (2018). Global energetics and local physics as drivers of past, present and future monsoons. Nat. Geosci. 11, 392–400. doi: 10.1038/s41561-018-0137-1
Bodian, A., Diop, L., Panthou, G., Dacosta, H., Deme, A., Dezetter, A., et al. (2020). Recent trend in hydroclimatic conditions in the Senegal River basin. Water 12:436. doi: 10.3390/w12020436
Burns, P. (2002). Robustness of the ljung-box test and its rank equivalent. Available at SSRN 443560. doi: 10.2139/ssrn.443560
Cappelli, F., Conigliani, C., Consoli, D., Costantini, V., and Paglialunga, E. (2023). Climate change and armed conflicts in Africa: temporal persistence, non-linear climate impact and geographical spillovers. Econ. Politica 40, 517–560. doi: 10.1007/s40888-022-00271-x
den Elzen, M., Fuglestvedt, J., Höhne, N., Trudinger, C., Lowe, J., Matthews, B., et al. (2005). Analysing countries' contribution to climate change: scientific and policy-related choices. Environ. Sci. Policy 8, 614–636. doi: 10.1016/j.envsci.2005.06.007
Dennis, K. C., Niang-Diop, I., and Nicholls, R. J. (1995). Sea-level rise and senegal: Potential impacts and consequences. J. Coast. Res. 243–261.
Diallo, M., Ndir, K. N., Diallo, D., Dembélé, J. S. B., and Ndiaye, S. (2022). Assessment of the management and performance of farming and cropping systems in Senegalese Niayes and groundnut basin. J. Agric. Sci. 14, 84–85. doi: 10.5539/jas.v14n5p76
Dinku, T. (2019). “Challenges with availability and quality of climate data in Africa,” in Extreme Hydrology and Climate Variability, eds. A. M. Melesse, W. Abtew, and G. Senay (Amsterdam: Elsevier), 71–80. doi: 10.1016/B978-0-12-815998-9.00007-5
Dinku, T., Funk, C., Peterson, P., Maidment, R., Tadesse, T., Gadain, H., et al. (2018). Validation of the chirps satellite rainfall estimates over eastern Africa. Q. J. R. Meteorol. Soc. 144, 292–312. doi: 10.1002/qj.3244
Dosio, A., Pinto, I., Lennard, C., Sylla, M. B., Jack, C., Nikulin, G., et al. (2021). What can we know about recent past precipitation over Africa? Daily characteristics of African precipitation from a large ensemble of observational products for model evaluation. Earth Space Sci. 8:e2020EA001466. doi: 10.1029/2020EA001466
Du Plessis, J., and Kibii, J. (2021). Applicability of chirps-based satellite rainfall estimates for South Africa. J. S. Afr. Inst. Civ. Eng. 63, 43–54. doi: 10.17159/2309-8775/2021/v63n3a4
Du, H., Tan, M. L., Zhang, F., Chun, K. P., Li, L., Kabir, M. H., et al. (2024). Evaluating the effectiveness of chirps data for hydroclimatic studies. Theor. Appl. Climatol. 155, 1519–1539. doi: 10.1007/s00704-023-04721-9
Fall, P., Diouf, I., Deme, A., and Sene, D. (2022). Assessment of climate-driven variations in malaria transmission in Senegal using the Vectri model. Atmosphere 13:418. doi: 10.3390/atmos13030418
Fall, S., Niyogi, D., and Semazzi, F. H. (2006). Analysis of mean climate conditions in senegal (1971-98). Earth Interact. 10, 1–40. doi: 10.1175/EI158.1
Faye, A., Camara, I., Diop, M., OuryDiallo, A., Sine, B., Noblet, M., et al. (2022). Millet and sorghum yield simulations under climate change scenarios in Senegal. Reg. Environ. Change 22:86. doi: 10.1007/s10113-022-01940-0
Funk, C., Peterson, P., Landsfeld, M., Pedreros, D., Verdin, J., Shukla, S., et al. (2015). The climate hazards infrared precipitation with stations–a new environmental record for monitoring extremes. Sci. Data 2, 1–21. doi: 10.1038/sdata.2015.66
Funk, C. C., Rowland, J., Adoum, A., Eilerts, G., Verdin, J., White, L., et al. (2012). A Climate Trend Analysis of Senegal. Technical report. Reston, VA: US Geological Survey. doi: 10.3133/fs20123123
Gleixner, S., Demissie, T., and Diro, G. T. (2020). Did era5 improve temperature and precipitation reanalysis over east Africa? Atmosphere 11:996. doi: 10.3390/atmos11090996
Gorelick, N., Hancher, M., Dixon, M., Ilyushchenko, S., Thau, D., Moore, R., et al. (2017). Google earth engine: planetary-scale geospatial analysis for everyone. Remote Sens. Environ. 202, 18–27. doi: 10.1016/j.rse.2017.06.031
Höhne, N., and Blok, K. (2005). Calculating historical contributions to climate change-discussing the ‘brazilian proposal'. Clim. Change 71, 141–173. doi: 10.1007/s10584-005-5929-9
Huntington, J. L., Hegewisch, K. C., Daudert, B., Morton, C. G., Abatzoglou, J. T., McEvoy, D. J., et al. (2017). Climate engine: cloud computing and visualization of climate and remote sensing data for advanced natural resource monitoring and process understanding. Bull. Am. Meteorol. Soc. 98, 2397–2410. doi: 10.1175/BAMS-D-15-00324.1
Hunziker, S., Brönnimann, S., Calle, J., Moreno, I., Andrade, M., Ticona, L., et al. (2018). Effects of undetected data quality issues on climatological analyses. Clim. Past 14, 1–20. doi: 10.5194/cp-14-1-2018
Jhajharia, D., Dinpashoh, Y., Kahya, E., Choudhary, R. R., and Singh, V. P. (2014). Trends in temperature over godavari river basin in southern peninsular India. Int. J. Climatol. 34, 1369–1384. doi: 10.1002/joc.3761
Kang, S. M., Held, I. M., Frierson, D. M., and Zhao, M. (2008). The response of the ITCZ to extratropical thermal forcing: Idealized slab-ocean experiments with a GCM. J. Clim. 21, 3521–3532. doi: 10.1175/2007JCLI2146.1
Konte, M. A., Ablouka, G., and Behanzin, P. (2019). Impact of climate change on food yield in Senegal: favar approach. J. Econ. Sci. Res. 2:447. doi: 10.30564/jesr.v2i1.447
Koudahe, K., Djaman, K., Bodian, A., Irkmak, S., Sall, M., Diop, L., et al. (2017). Trend analysis in rainfall, reference evapotranspiration and aridity index in southern Senegal: adaptation to the vulnerability of rainfed rice cultivation to climate change. Atmos. Clim. Sci. 7, 476–495. doi: 10.4236/acs.2017.74035
Lamaoui, M., Jemo, M., Datla, R., and Bekkaoui, F. (2018). Heat and drought stresses in crops and approaches for their mitigation. Front. Chem. 6:26. doi: 10.3389/fchem.2018.00026
Leal Filho, W., Balogun, A.-L., Olayide, O. E., Azeiteiro, U. M., Ayal, D. Y., Muñoz, P. D. C., et al. (2019). Assessing the impacts of climate change in cities and their adaptive capacity: Towards transformative approaches to climate change adaptation and poverty reduction in urban areas in a set of developing countries. Sci. Total Environ. 692, 1175–1190. doi: 10.1016/j.scitotenv.2019.07.227
Liu, J., Hagan, D. F. T., and Liu, Y. (2020). Global land surface temperature change (2003-2017) and its relationship with climate drivers: Airs, Modis, and era5-land based analysis. Remote Sens. 13:44. doi: 10.3390/rs13010044
Liu, R., Zhang, X., Wang, W., Wang, Y., Liu, H., Ma, M., et al. (2024). Global-scale era5 product precipitation and temperature evaluation. Ecol. Indic. 166:112481. doi: 10.1016/j.ecolind.2024.112481
Macharia, D., Fankhauser, K., Selker, J. S., Neff, J. C., and Thomas, E. A. (2022). Validation and intercomparison of satellite-based rainfall products over Africa with Tahmo in situ rainfall observations. J. Hydrometeorol. 23, 1131–1154. doi: 10.1175/JHM-D-21-0161.1
Magadzire, T., Hoell, A., Nakalembe, C., and Tongwane, M. (2022). Recent advances in agrometeorological analysis techniques for crop monitoring in support of food security early warning. Front. Clim. 4:950447. doi: 10.3389/fclim.2022.950447
Mann, H. B. (1945). Nonparametric tests against trend. Econometrica 13, 245–259. doi: 10.2307/1907187
Marfurt, F., Haller, T., and Bottazzi, P. (2023). Green agendas and white markets: the coloniality of agroecology in Senegal. Land 12:1324. doi: 10.3390/land12071324
Mekonnen, K., Velpuri, N. M., Leh, M., Akpoti, K., Owusu, A., Tinonetsana, P., et al. (2023). Accuracy of satellite and reanalysis rainfall estimates over Africa: a multi-scale assessment of eight products for continental applications. J. Hydrol. Reg. Stud. 49:101514. doi: 10.1016/j.ejrh.2023.101514
Morice, C. P., Kennedy, J. J., Rayner, N. A., and Jones, P. D. (2012). Quantifying uncertainties in global and regional temperature change using an ensemble of observational estimates: the hadcrut4 data set. J. Geophys. Res. Atmos. 117(D8). doi: 10.1029/2011JD017187
Muñoz-Sabater, J., Dutra, E., Agustí-Panareda, A., Albergel, C., Arduini, G., Balsamo, G., et al. (2021). Era5-land: a state-of-the-art global reanalysis dataset for land applications. Earth Syst. Sci. Data 13, 4349–4383. doi: 10.5194/essd-13-4349-2021
Nakalembe, C., Becker-Reshef, I., Bonifacio, R., Hu, G., Humber, M. L., Justice, C. J., et al. (2021). A review of satellite-based global agricultural monitoring systems available for Africa. Glob. Food Secu. 29:100543. doi: 10.1016/j.gfs.2021.100543
Ndecky, A. M. A. (2020). Evaluation and comparison of remote sensing based precipitation products in casamance basin, Senegal (Master's thesis). PAUWES. Available at: http://repository.pauwes-cop.net/handle/1/407
Nébié, E. K. I., Ba, D., and Giannini, A. (2021). Food security and climate shocks in Senegal: who and where are the most vulnerable households? Glob. Food Secur. 29:100513. doi: 10.1016/j.gfs.2021.100513
Poméon, T., Jackisch, D., and Diekkrüger, B. (2017). Evaluating the performance of remotely sensed and reanalysed precipitation data over West Africa using HBV light. J. Hydrol. 547, 222–235. doi: 10.1016/j.jhydrol.2017.01.055
Population, total – Senegal. (2024). Available at: https://data.worldbank.org/indicator/SP.POP.TOTL?contextual=defaultandend=2021andlocations=SNandstart=1960andtype=shadedandview=chart (accessed March 10, 2023).
Prasad, P. V. V., Craufurd, P. Q., Kakani, V. G., Wheeler, T. R., and Boote, K. J. (2001). Influence of high temperature during pre-and post-anthesis stages of floral development on fruit-set and pollen germination in peanut. Funct. Plant Biol. 28, 233–240. doi: 10.1071/PP00127
Raffa, M., Reder, A., Marras, G. F., Mancini, M., Scipione, G., Santini, M., et al. (2021). Vhr-rea_it dataset: very high resolution dynamical downscaling of era5 reanalysis over Italy by COSMO-CLM. Data 6:88. doi: 10.3390/data6080088
Sabelli, A., Nowak, A., Corner-Dolloff, C., Lizarazo, M., Jarvis, A., Girvetz, E., et al. (2016). Climate-smart agriculture in Senegal. Available at: https://climateknowledgeportal.worldbank.org/sites/default/files/2019-06/SENEGAL_CSA_Profile.pdf (accessed March 10, 2023).
Sacré Regis M, D., Mouhamed, L., Kouakou, K., Adeline, B., Arona, D., Houebagnon Saint, J. C., et al. (2020). Using the chirps dataset to investigate historical changes in precipitation extremes in West Africa. Climate 8:84. doi: 10.3390/cli8070084
Saeed, S., Makhdum, M. S. A., Anwar, S., and Yaseen, M. R. (2023). Climate change vulnerability, adaptation, and feedback hypothesis: a comparison of lower-middle, upper-middle, and high-income countries. Sustainability 15:4145. doi: 10.3390/su15054145
Sarr, A. B., and Sultan, B. (2023). Predicting crop yields in Senegal using machine learning methods. Int. J. Climatol. 43, 1817–1838. doi: 10.1002/joc.7947
Satgé, F., Defrance, D., Sultan, B., Bonnet, M.-P., Seyler, F., Rouché, N., et al. (2020). Evaluation of 23 gridded precipitation datasets across West Africa. J. Hydrol. 581:124412. doi: 10.1016/j.jhydrol.2019.124412
Schwartzstein, P. (2023). Out of place, out of time: The experience of Senegal's migratory pastoralists.
Sebbar, B.-e., Khabba, S., Merlin, O., Simonneaux, V., Hachimi, C. E., Kharrou, M. H., et al. (2023). Machine-learning-based downscaling of hourly era5-land air temperature over mountainous regions. Atmosphere 14:610. doi: 10.3390/atmos14040610
Sen, P. K. (1968). Estimates of the regression coefficient based on Kendall's tau. J. Am. Stat. Assoc. 63, 1379–1389. doi: 10.1080/01621459.1968.10480934
Senegal Production (0000). Available at: https://ipad.fas.usda.gov/countrysummary/default.aspx?id=SG (accessed November 17, 2023).
Song, F., Leung, L. R., Lu, J., and Dong, L. (2018). Seasonally dependent responses of subtropical highs and tropical rainfall to anthropogenic warming. Nat. Clim. Change 8, 787–792. doi: 10.1038/s41558-018-0244-4
Stewart, S. B., and Nitschke, C. R. (2017). Improving temperature interpolation using Modis LST and local topography: a comparison of methods in south east Australia. Int. J. Climatol. 37, 3098–3110. doi: 10.1002/joc.4902
Tall, M., Sylla, M. B., Diallo, I., Pal, J. S., Faye, A., Mbaye, M. L., et al. (2017). Projected impact of climate change in the hydroclimatology of Senegal with a focus over the lake of Guiers for the twenty-first century. Theor. Appl. Climatol. 129, 655–665. doi: 10.1007/s00704-016-1805-y
Tappan, G. G., Sall, M., Wood, E. C., and Cushing, M. (2004). Ecoregions and land cover trends in Senegal. J. Arid Environ. 59, 427–462. doi: 10.1016/j.jaridenv.2004.03.018
Vicente-Serrano, S. M., Domínguez-Castro, F., Reig, F., Tomas-Burguera, M., Peña-Angulo, D., Latorre, B., et al. (2023). A global drought monitoring system and dataset based on era5 reanalysis: a focus on crop-growing regions. Geosci. Data J. 10, 505–518. doi: 10.1002/gdj3.178
Wang, Y.-R., Hessen, D. O., Samset, B. H., and Stordal, F. (2022). Evaluating global and regional land warming trends in the past decades with both Modis and era5-land land surface temperature data. Remote Sens. Environ. 280:113181. doi: 10.1016/j.rse.2022.113181
World Bank Climate Change Knowledge Portal (0000). Available at: https://climateknowledgeportal.worldbank.org/country/senegal/climate-data-historical (accessed 10-Mar-2023).
Yilmaz, M. (2023). Accuracy assessment of temperature trends from era5 and era5-land. Sci. Total Environ. 856:159182. doi: 10.1016/j.scitotenv.2022.159182
Zeng, H., Wu, B., Zhang, N., Tian, F., Phiri, E., Musakwa, W., et al. (2019). Spatiotemporal analysis of precipitation in the sparsely gauged Zambezi river basin using remote sensing and google earth engine. Remote Sens. 11:2977. doi: 10.3390/rs11242977
Appendix A
Statistical Equations
Key equations simplified as follows:
Calculate the Mann-Kendall test statistic S using Equation 1 Mann (1945):
where
For n > 10, compute the variance of S:
where n is the number of observations, g the number of tied groups, and tp is the number of observations tied to a particular value.
Compute the Mann-Kendall test statistic ZMK:
To test for a monotonic trend at a significance level α, compare ZMK to the critical values of the standard normal distribution: For an upward trend, reject H0 if ZMK ≥ Z1−α For a downward trend, reject H0 if ZMK ≤ −Z1−α For a two-tailed test, reject H0 if |ZMK| ≥ Z1−α/2
Equation 5 estimates the slope from the time series data Sen (1968):
where xij and xik are the data values and j and k are the time series.
Keywords: Senegal, climate variability, satellite remote sensing, google earth engine, climate trend
Citation: Nakalembe C, Frimpong DB, Kerner H and Sarr MA (2025) A 40-year remote sensing analysis of spatiotemporal temperature and rainfall patterns in Senegal. Front. Clim. 7:1462626. doi: 10.3389/fclim.2025.1462626
Received: 10 July 2024; Accepted: 10 January 2025;
Published: 06 February 2025.
Edited by:
Xiang Gao, Massachusetts Institute of Technology, United StatesReviewed by:
Detelina Ivanova, Climformatics Inc, United StatesMohammed Elseidi, Umm Al Quwain University, United Arab Emirates
Copyright © 2025 Nakalembe, Frimpong, Kerner and Sarr. This is an open-access article distributed under the terms of the Creative Commons Attribution License (CC BY). The use, distribution or reproduction in other forums is permitted, provided the original author(s) and the copyright owner(s) are credited and that the original publication in this journal is cited, in accordance with accepted academic practice. No use, distribution or reproduction is permitted which does not comply with these terms.
*Correspondence: Catherine Nakalembe, Y25ha2FsZW1AdW1kLmVkdQ==