 Umanda Abeysinghe
 Sarah Balkissoon
 Noel Aloysius
- 1Chemical and Biomedical Engineering, University of Missouri, Columbia, MO, United States
- 2School of Natural Resources, University of Missouri, Columbia, MO, United States
- 3Missouri Water Center, University of Missouri, Columbia, MO, United States
- 4Missouri Climate Center, University of Missouri, Columbia, MO, United States
The Mississippi River Basin (MRB) has undergone substantial hydroclimatic changes due to climate variability and anthropogenic influences. These changes present challenges for sustainable water resource management and agricultural planning, necessitating comprehensive assessments of climate-driven trends. This study examined spatiotemporal trends in precipitation, potential evapotranspiration (PET), air temperature, and aridity indices across the MRB from 1980 to 2019. Daily meteorological data were obtained from the North American Land Data Assimilation System (NLDAS). Trend detection employed both parametric (linear regression) and non-parametric (Mann-Kendall and Pettitt’s tests) methods, applying a 5% significance level to ensure statistical robustness against non-normality and outliers. Statistically significant increasing trends were observed in PET (+4.18 mm/year in Arkansas, p < 0.001) and temperature (+0.078°C/year in Ohio-Tennessee, p < 0.001). Precipitation trends displayed spatial heterogeneity, with significant increases in the Upper Missouri (+1.91 mm/year, p = 0.03) and non-significant declines in the Lower Mississippi (−0.77 mm/year, p = 0.75). Change point analysis indicated abrupt shifts in PET and temperature in the early 2000s and in precipitation in the late 1990s. Aridity indices (UNEP and De Martonne) revealed significant increases in aridity in the southern and western MRB (p < 0.05), suggesting heightened drought risk. The analysis highlights a clear intensification of hydroclimatic extremes across the MRB. The spatial variability in trends and abrupt changes underscores the need for region-specific adaptive water management strategies to bolster resilience against future climate variability.
1 Introduction
Human activities and changing weather patterns have significantly impacted ecohydrological processes worldwide, altering water resources and ecosystem services. River basins, particularly in arid and semi-arid regions, are highly sensitive to even small changes in precipitation and temperature, which can profoundly affect hydrological processes (Haji Mohammadi et al., 2024). Evapotranspiration, a critical component of the water cycle, reflects the interaction between atmospheric water demand and land surface conditions, making it a key indicator of meteorological and agricultural droughts. Changes in weather patterns directly influence evapotranspiration and vegetation water needs (Katul et al., 2012; Konapala et al., 2020; Masson-Delmotte et al., 2021). Climate change is widely recognized as a driver of drought and desertification due to increased potential evapotranspiration (PET) and altered precipitation patterns, particularly in fragile ecosystems (Upadhyay, 2020). Aridity indices (AIs), which quantify climatic dryness, are essential tools for understanding and managing water resources in these regions (Dai, 2011).
The Mississippi River Basin (MRB), one of the largest and most ecologically diverse river basins in the world, has experienced significant hydroclimatic variability due to infrastructure development, agricultural expansion, urbanization, and decadal weather changes (National Research Council, 2014; Qian et al., 2007). Previous studies have examined the impacts of these factors on hydrological processes in the MRB, including changes in evapotranspiration, streamflow, and land use (Lagarde, 2023; Rajib et al., 2021). However, many studies remain limited in scope, often focusing on specific sub-basins, temporal scales, or hydrological variables. Additionally, traditional drought indices, such as the Palmer Drought Severity Index (PDSI), may not fully capture the diverse climatic conditions within the MRB (Dai, 2011; Heim et al., 2023).
Previous studies on aridity in the United States and the Mississippi River Basin (MRB) have highlighted the importance of aridity indices in understanding regional climatic variations and their impacts. For instance, Seager et al. (2007) explored the increasing aridity in the western United States and its implications for water resources. Similarly, research on the MRB has examined the spatial variability of aridity and its relationship with agricultural practices and water management (Fuhrmann et al., 2021; Martin et al., 2020). These studies underscore the necessity of region-specific analyses to better understand how climatic factors interact with anthropogenic activities, such as urbanization and agricultural expansion, to influence aridity and water availability in major river basins.
Mccabe and Wolock (2019) conducted a comprehensive analysis of water balance components in the MRB, identifying significant changes in runoff patterns due to increased precipitation and evapotranspiration. They emphasized that the MRB has experienced wetter conditions since 1900 compared to the previous 500 years. Guo (2023) noted increasing variability in the hydrologic conditions of the Mississippi River Basin (MRB), posing significant challenges to water resource management and ecosystem sustainability. Despite the availability of extensive data, comprehensive long-term analyses that encompass the broader spatial extent of the MRB remain limited. Most studies, such as those by Vörösmarty et al. (2000), focus on specific aspects like water quality and flood dynamics but do not integrate broader aridity indices across temporal scales. Seager et al. (2007) explored increasing aridity in the western United States, identifying similar hydroclimatic dynamics as those observed in the MRB. Their findings underscore the need to examine region-specific aridity trends comprehensively. Martin et al. (2020) analyzed drought severity in the MRB, linking increasing aridity to rising temperatures and variable precipitation. They suggested that traditional indices like the Palmer Drought Severity Index may not fully capture the evolving aridity conditions. While PDSI has been a standard drought metric, it fails to fully capture modern hydroclimatic changes due to its simplistic soil model, lagged response, and limited applicability in diverse climates (Dai et al., 2004; Vicente-Serrano et al., 2010). UNEP Aridity Index and De Martonne Aridity Index are more robust, easier to compute, better suited for global aridity assessments, and more responsive to short-term and long-term climatic variations (Zomer et al., 2022). By applying both the United Nations Environment Programme (UNEP) and De Martonne aridity indices, this study aims to provide a more detailed and applicable understanding of hydroclimatic variability, thereby enhancing water resource management and policymaking for the region. Previous studies by Milly and Dunne (2001) and Sheffield and Wood (2008) demonstrated the use of aridity indices in diverse climatic regions to assess changing drought patterns and forecast future water availability. These findings highlight the importance of aridity indices in adapting to evolving hydrological cycles influenced by climate change and human activities.
Climate change, primarily driven by anthropogenic greenhouse gas emissions, has led to significant shifts in global temperature, precipitation patterns, and hydroclimatic extremes (Bisht et al., 2024; Sandilya et al., 2025; Raymond et al., 2020). These changes are projected to intensify in the coming decades, posing substantial threats to water resources, agricultural productivity, and ecosystem stability across major river basins such as the Mississippi River Basin (MRB) (Jain et al., 2024; Paramaguru et al., 2023). Understanding hydroclimatic variability and its future consequences is thus essential for the development of sustainable adaptation strategies. Traditional approaches to analyzing climate trends often rely on parametric methods such as linear regression, which assume normality and may be sensitive to outliers. However, the non-linear and non-normal nature of hydroclimatic data has prompted the increasing use of non-parametric methods like the Mann-Kendall test and Pettitt’s test (Arockia Anusty et al., 2024; Gaddikeri et al., 2024). Common methods include regression analysis, the Mann-Kendall test, and change point detection techniques, which have been widely applied in hydrological studies to detect significant trends and shifts in climatic and hydrological variables (Cigizoglu et al., 2005; Yue and Wang, 2004). These techniques provide robust frameworks for evaluating hydroclimatic variability and understanding its spatial and temporal diversity in the MRB.
This study addresses these gaps by employing both parametric and non-parametric statistical methods to rigorously assess trends in precipitation, temperature, potential evapotranspiration (PET), and aridity indices across the MRB from 1980 to 2019. By applying both the UNEP Aridity Index and the De Martonne Index, the analysis captures different dimensions of climatic dryness, offering a more nuanced perspective compared to traditional drought indices. The novelty of this research lies in its integration of high-resolution meteorological data, multiple trend detection techniques, and dual aridity indices to comprehensively evaluate spatial and temporal hydroclimatic variability across the diverse sub-basins of the MRB.
This study aims to assess the temporal and spatial hydroclimatic shifts in the Mississippi River Basin (MRB) and their implications for sustainable water resource management and agriculture. By utilizing a long-term dataset (1980–2019) and employing UNEP and De Martonne aridity indices, this research integrates statistical techniques to identify significant trends and regional disparities in aridity over an extended period. Additionally, the study evaluates the interrelationships between aridity indices and hydrological variables, providing a comprehensive understanding of the factors influencing water availability in the MRB. Many studies relied heavily on traditional drought indices like the Palmer Drought Severity Index (PDSI), which may not accurately capture the evolving hydroclimatic conditions in the MRB. This study fills this gap by employing both the UNEP and De Martonne aridity indices to provide a more comprehensive understanding of aridity under varying climatic conditions. The research specifically aims to answer how temporal trends in precipitation, PET, and temperature have evolved in the MRB from 1980 to 2019, what the spatial patterns of aridity are across different sub-basins, and how these trends impact sustainable water resource management and agricultural practices in the region. Furthermore, the integration of UNEP and De Martonne indices offers a robust framework for assessing aridity under varying climatic conditions, providing valuable insights for future climate resilience planning.
2 Materials and methods
2.1 Study area
The Mississippi River Basin (MRB) encompasses a vast and diverse region, extending from its source at Lake Itasca, Minnesota, to its outlet in the Gulf of America. Covering approximately 3,202,000 square kilometers, the basin spans 31 U.S. states and two Canadian provinces. The Mississippi River itself, one of the longest rivers in the world, flows for about 3,730 kilometers (Donner et al., 2004).
With a mean annual temperature ranging from approximately 6°C to 24°C, the MRB experiences significant seasonal variations, with peak summer temperatures reaching 26°C and winter lows dropping to −6°C. Annual precipitation plays a crucial role in shaping the region’s water availability, influencing both ecosystems and water resources (Table 1). The MRB is divided into six sub-regions: Arkansas, Ohio, Tennessee, Upper Mississippi, Lower Mississippi, Upper Missouri, and Lower Missouri (Figure 1).
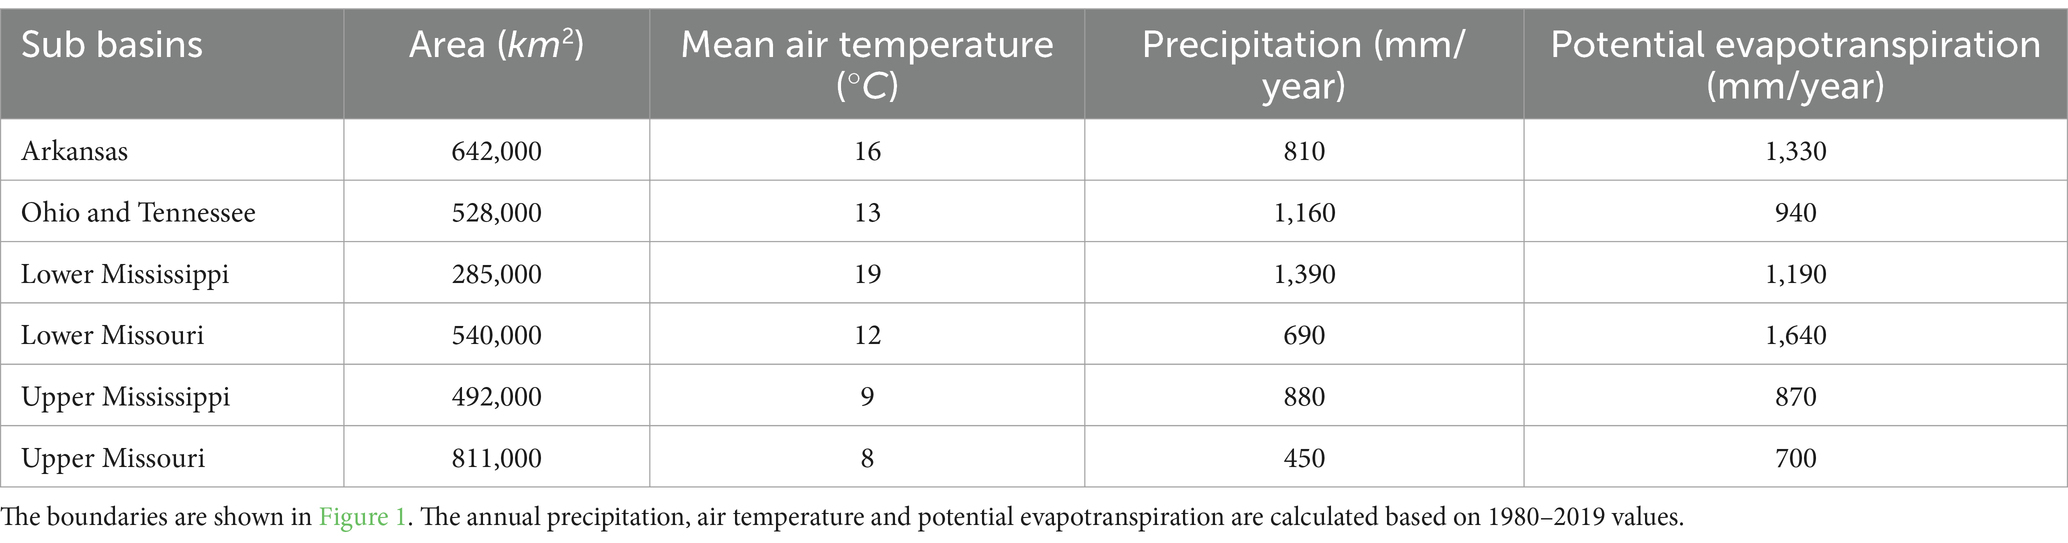
Table 1. Characteristics of the seven sub-basins of the Mississippi River Basin.
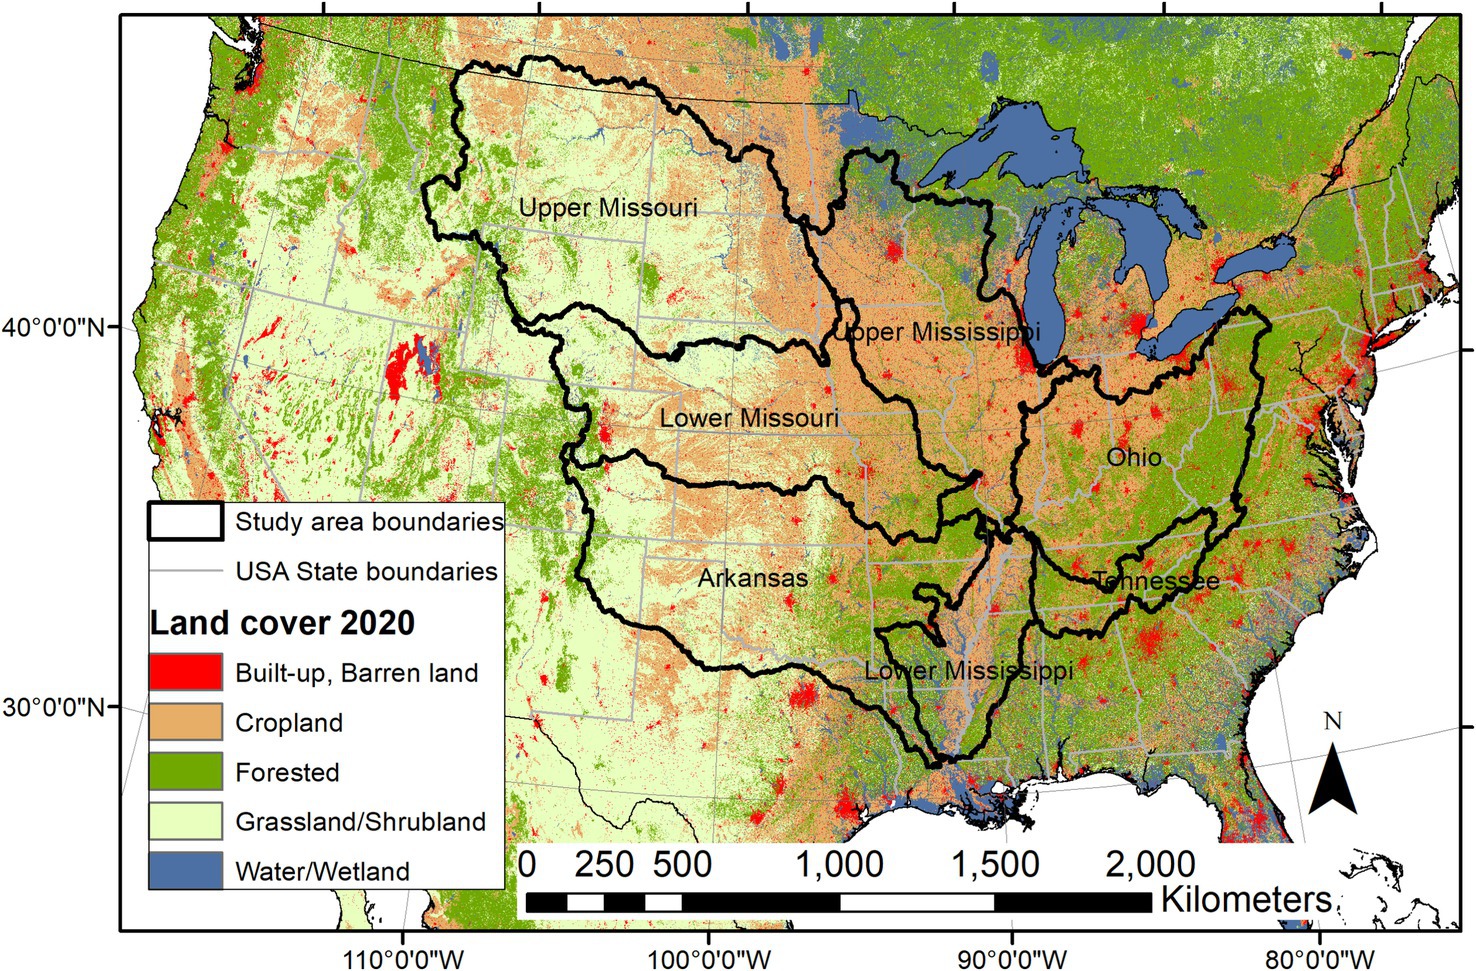
Figure 1. The study area with the seven regions of the Mississippi River Basin (MRB) is shown (North American Land Change Monitoring System, n.d.).
Land use within the MRB is diverse, with agriculture playing a dominant role. The basin supports a major agribusiness sector, producing 92% of the United States’ agricultural exports, including feed grains and soybeans. Additionally, extensive forested areas are present, particularly in the Lower Mississippi, Tennessee, and Ohio regions. The basin also includes significant urban development, with major cities such as St. Louis, Memphis, and New Orleans contributing to its economic and social landscape (Mississippi River Facts, n.d.).
2.2 Data
For this study on the MRB, we utilized a dataset comprising daily meteorological records from the North American Land Data Assimilation System Phase 2 (NLDAS-2). The NLDAS dataset integrates ground-based observations, satellite measurements, and model reanalysis to ensure consistency and accuracy (Mitchell et al., 2004). The climate variables used in the analysis include precipitation, potential evapotranspiration (PET), and temperature. Data were obtained for the period 1980–2019. The gridded dataset is available at a spatial resolution of 0.125° × 0.125° (Xia et al., 2012a,b).
NLDAS-2 is a collaborative initiative designed to generate quality-controlled, spatially, and temporally consistent land-surface datasets for central North America. NLDAS derives its forcing data from a combination of observation-based datasets and model outputs. Key components of these datasets include precipitation, shortwave radiation, and surface meteorology variables such as air temperature, humidity, wind speed, and surface pressure. Precipitation data is derived from daily gauge-based analyses, which are then temporally disaggregated to hourly intervals using radar data. In the NLDAS-2, Potential Evapotranspiration (PET) is calculated using the Penman method. This approach integrates various meteorological parameters, including surface net radiation, near-surface air temperature, wind speed, and specific humidity, to estimate the rate at which water vapor is transferred from the land surface to the atmosphere under optimal moisture conditions. The Penman method is a physically based approach that combines energy balance and aerodynamic principles to provide a comprehensive assessment of environmental demand for evapotranspiration. By considering factors such as temperature, solar radiation, humidity, and wind speed, it effectively captures the complex interactions influencing evapotranspiration processes (Xia et al., 2016).
Despite its strengths, NLDAS has certain limitations and uncertainties that affect the reliability of its outputs. The accuracy of NLDAS data heavily depends on the quality of input forcing data. Errors or biases in precipitation measurements, radiation estimates, or reanalysis data can propagate through the system, impacting the accuracy of land-surface simulations. Additionally, variations in soil and vegetation parameters across models contribute to uncertainty in model outputs, complicating the interpretation of hydrological trends. To address missing data, NLDAS employs several strategies aimed at maintaining data continuity and accuracy. For precipitation data, gaps in radar coverage are filled using nearest-neighbor interpolation within a 2-degree radius. For other variables, including temperature, humidity, and radiation, NLDAS relies on model reanalysis data from NARR to ensure spatial and temporal consistency, thereby mitigating the impact of missing observational data (Xia et al., 2016).
2.3 Aridity index
An aridity index (AI) quantifies the dryness of a climate at a given location, providing essential information for climatological and agricultural planning. Several aridity indices, such as the Thornthwaite aridity index, Köppen aridity index, UNEP aridity index, and De Martonne aridity index, have been developed to assess arid climates and classify regions based on water availability (Tsiros et al., 2020).
Potential evapotranspiration (PET) is a key factor influencing aridity, as it is driven by multiple climatic variables, including temperature, humidity, wind speed, and solar radiation. PET estimates the rate at which these factors contribute to evaporation and transpiration under the assumption of an ample water supply. Various methods exist for estimating PET, each with specific assumptions and data requirements. Commonly used approaches include the Penman-Monteith, Thornthwaite, and Hargreaves-Samani methods (Cai et al., 2007; Li et al., 2022; Sepaskhah and Razzaghi, 2009). PET is a theoretical measure representing the amount of water that would be evaporated and transpired by vegetation given unlimited water availability (Allen et al., 1998).
In this study, we focus on two aridity indices, UNEP and De Martonne to compare their formulations, as they incorporate potential evapotranspiration and temperature alongside precipitation. Additionally, we aim to visualize how these indices vary with different parameters, namely potential evapotranspiration (which is derived using temperature and other climatic variables) and temperature.
2.3.1 UNEP aridity index
The United Nations Environment Programme (UNEP) Aridity Index is a climatological tool used to categorize regions based on their level of dryness. It serves as a significant indicator in environmental and climatic studies, particularly for assessing the risks and impacts of desertification and drought (Middleton and Thomas, 1992). The UNEP Aridity Index is calculated using Equation 1.
where P is the annual precipitation in millimeters, and PET is the annual potential evapotranspiration in millimeters (Middleton and Thomas, 1992). By considering both precipitation and potential evapotranspiration, the UNEP Aridity Index offers a comprehensive measure of aridity, reflecting not only the quantity of precipitation but also its effectiveness for ecological processes (Díaz et al., 2005). This dual consideration makes it particularly effective in regions with variable precipitation and temperature patterns, such as the MRB.
The UNEP index’s reliance on PET, which integrates multiple climatic factors including temperature, humidity, wind speed, and solar radiation, enhances its sensitivity to climate variability and change. Studies by Díaz et al. (2005) have demonstrated the efficacy of the UNEP index in diverse climatic settings, emphasizing its applicability to large river basins like the MRB.
2.3.2 De Martonne aridity index
In a climatological sense, aridity is the degree to which a climate lacks effective, life-promoting moisture, the opposite of humidity, in the climate sense of the term (Pellicone et al., 2019). A measure of the annual aridity (IDM) is given by the following relationship:
where P is the annual mean precipitation (mm), and T (°C) is the annual mean air temperature. This makes it particularly useful for assessing aridity trends in regions where temperature variations significantly influence water availability.
Studies such as Pellicone et al. (2019) have validated the De Martonne index’s effectiveness in temperate regions by correlating it with observed soil moisture and drought patterns. This index’s ability to reflect temperature-induced variations in water balance makes it a valuable tool for analyzing aridity in the MRB’s diverse climatic zones.
An increase in the value of the De Martonne Aridity Index (IDM), while maintaining a constant temperature, indicates an increase in precipitation. The primary difference between the UNEP and De Martonne Aridity Indices (AI) lies in their denominators (Equations 1, 2), where the UNEP aridity index employs PET, while the De Martonne aridity index utilizes T + 10. Additionally, the UNEP aridity index is unitless, whereas the De Martonne aridity index is expressed in mm/°C. The accuracy of key parameters, such as precipitation and temperature, both essential for the reliability of aridity indices, depends on various climatic factors and can be ensured through different methodological approaches tailored to the available data.
Using both indices provides a more comprehensive assessment of aridity trends by capturing different aspects of hydroclimatic variability. Employing multiple indices helps mitigate the limitations associated with individual indices, thereby enhancing the robustness of the analysis. This approach is particularly valuable for regions like the MRB, where hydroclimatic conditions vary significantly across sub-basins.
2.4 Methods
Gridded hourly NLDAS data for precipitation (P), potential evapotranspiration (PET), and temperature (T) in the MRB were aggregated to create daily and annual time series for the period 1980–2019. These datasets provide consistent and spatially distributed hydroclimatic variables, making them suitable for long-term trend analysis. A combination of statistical techniques was employed to analyze these variables, including trend detection, change point identification, variability assessment, and inter-variable relationship evaluation.
2.4.1 Linear regression
Linear regression was applied to detect and quantify temporal trends in precipitation (P), potential evapotranspiration (PET), and temperature (T) for each sub-basin. This method identifies the rate of change over time (slope) and the initial value (intercept). Annual values were regressed against time (years), and the regression slope was used to determine whether a variable exhibited an increasing or decreasing trend (Nordhaus and Moffat, 2017). In this study, regression analysis was used to assess the relationship between time and key climatic variables—precipitation, PET, and temperature—to determine the presence of significant trends over time. The general form of a linear regression model used in this context can be represented as in Equation 3:
where represents the climatic variable, is time, is the intercept, is the slope (representing the trend), and is the error term. The slope is of particular interest, as a non-zero slope indicates a trend over the period studied. The statistical significance of the regression results was evaluated at a 95% confidence level (p < 0.05) to confirm meaningful trends.
2.4.2 Mann-Kendall test
The Mann-Kendall (MK) test was employed to detect monotonic trends in precipitation (P), potential evapotranspiration (PET), and temperature (T). This non-parametric test is robust against non-normality and missing values, making it well-suited for hydroclimatic time series analysis. The MK test was applied to the annual values of each variable across the six regions (Figure 1), with the Tau statistic (τ) used to quantify the strength and direction of the trend. The test was conducted at a 95% confidence level (α = 0.05), and trends were considered statistically significant if p-values were below this threshold (Hirsch et al., 1982).
In hydroclimatic studies, data uncertainties can arise from measurement errors, model limitations, and temporal or spatial variability. The use of a 95% confidence level helps ensure that detected trends are not merely artifacts of data noise but reflect true underlying patterns. For instance, Hirsch et al. (1982) emphasized the importance of this threshold for non-parametric tests like the Mann-Kendall test when dealing with hydrological time series characterized by variability and potential non-normal distributions. The choice of α = 0.05 aligns with previous studies analyzing hydroclimatic trends in the Mississippi River Basin (MRB) and similar regions. For example, Mccabe and Wolock (2019) and Seager et al. (2007) employed this significance level to assess trends in precipitation, temperature, and runoff, providing a consistent basis for comparison.
The test statistic, S, is calculated by evaluating the sign of differences between all pairs of data points. The equation for S is given by Equation 4:
where is the number of data points, and are data values at time series and is the sign function, which is 1 if < , 0 if = , and −1 if > . The statistical significance of the observed trend is then evaluated.
The Mann-Kendall test’s efficacy in datasets which do not have normal distributions makes it a reliable tool in hydrology and climatology, especially for datasets with anomalies or non-linear trends (Mondal et al., 2012).
To evaluate the significance of the Mann-Kendall test statistic its variance, var.(S), is computed. The variance is given by Equation 5:
where n is the number of data points, q is the number of tied groups, and is the number of data points in the group.
In Mann-Kendall test, the standardized test statistic, Z is used to assess the significance of the trend detected in the data series. It is calculated from the S statistic, which is the sum of sign differences between data points, and the variance of S. The formula for Z depends on the sign of S. According to sign of S, the equations for Z are given in Equations 6–8.
If , then is calculated as:
If , then is equal to 0:
If , then is calculated as:
Where represents the variance of the S statistic. A positive value of indicates an upward trend, while a negative value suggests a downward trend. This test helps in identifying significant trends in climatic or environmental time series data.
The tau statistic (τ) is a non-parametric measure of association that tells the strength and direction of the trend. It is calculated as in the Equation 9, the S statistic divided by the square root of its variance:
The value of ranges between −1 and 1, where: indicates a perfect increasing trend, indicates a perfect decreasing trend, and indicates no trend.
2.4.3 Change point analysis
Several methods, such as the Pettitt test, Buishand range test, and Standard Normal Homogeneity Test (SNHT), can be used to identify change points in a time series (Buishand, 1982; Conte et al., 2019). In this study, Pettitt’s test was applied to detect significant change points (abrupt shifts) in precipitation (P), potential evapotranspiration (PET), and temperature (T) over time. This test identifies the year of the most significant change for each region by calculating the maximum U statistic and corresponding p-values. A 95% confidence level (α = 0.05) was used to determine the statistical significance of detected change points. Pettitt’s test is particularly effective for identifying sudden transitions in hydroclimatic time series, providing valuable insights into shifts driven by climate variability.
The test statistic for the Pettitt test is given by Equation 10:
where is the total number of data points, and are individual data points, is the sign function. The statistical significance of is then assessed to identify the change point.
2.4.4 Other tests
Pairwise correlations among precipitation (P), potential evapotranspiration (PET), and temperature (T) were analyzed to explore interdependencies among hydroclimatic variables. Pearson correlation coefficients were calculated for each region to quantify the strength and direction of these relationships. Positive correlations indicate direct associations, while negative correlations suggest inverse relationships. Understanding these interactions helps elucidate how temperature variations influence precipitation and evapotranspiration, which are critical for aridity index calculations and climate impact assessments.
Spatial and temporal trends of the UNEP and De Martonne aridity indices were analyzed to assess changes in aridity over four time periods (1980–1989, 1990–1999, 2000–2009, and 2010–2019). These indices were computed for each region using precipitation, PET, and temperature data. Spatial maps were generated to visualize the distribution of aridity indices, providing insights into regional variations over time. The UNEP index, which incorporates PET and precipitation, and the De Martonne index, which relies on precipitation and temperature, enabled a comparative analysis of aridity patterns driven by different climatic factors.
3 Results
3.1 Linear regression
Linear regression was employed to identify trends in precipitation, temperature, and potential evapotranspiration (PET) across the Mississippi River Basin (MRB) for the period 1980–2019. This method enabled the estimation of trend slopes (β) and the assessment of statistical significance using p-values and confidence intervals, providing a quantitative understanding of hydroclimatic changes.
The regression analysis revealed variable precipitation trends (Figure 2) across the MRB. Significant positive trends (Table 2) were observed in the Upper Missouri (+1.8869 mm/year, p = 0.0337). In contrast, the Lower Mississippi exhibited a decreasing trend (−0.7744 mm/year, p = 0.7464), which was not statistically significant. These results suggest a north–south gradient, with increasing precipitation in northern sub-basins and a potential drying trend in southern areas.
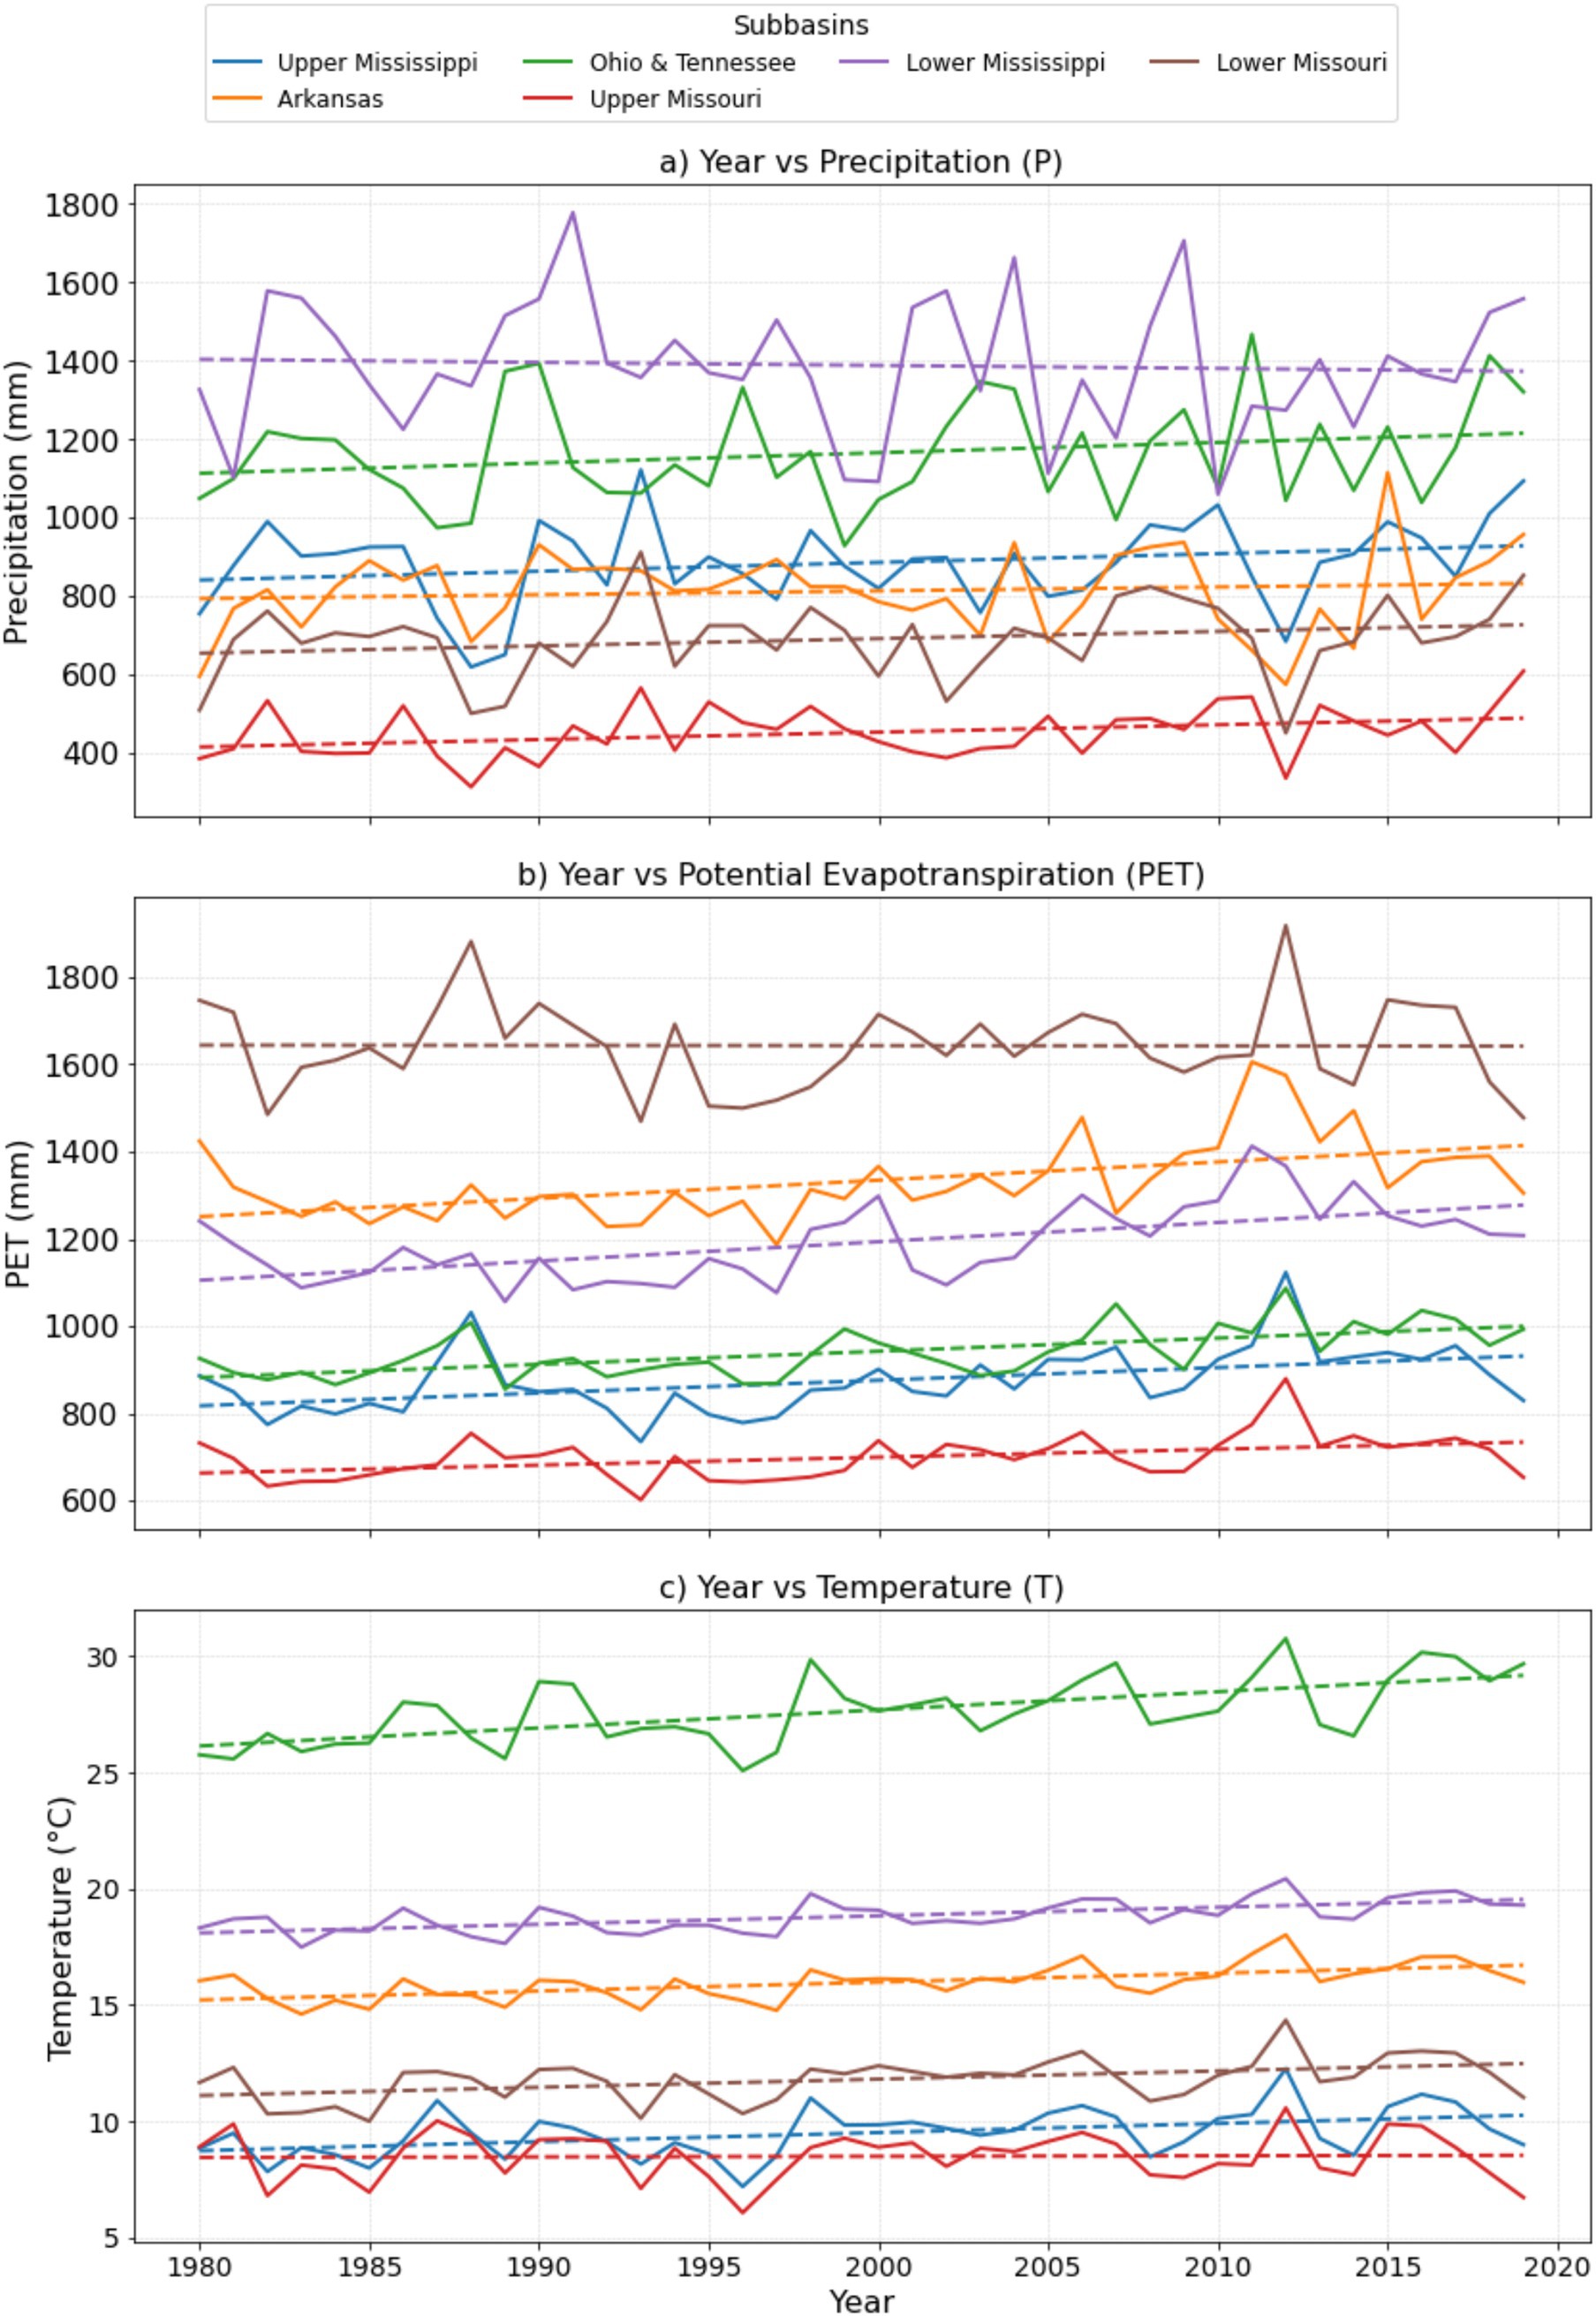
Figure 2. Trends of annual (a) precipitation, (b) potential evapotranspiration, and (c) temperature of the seven sub-basins of the MRB from 1980 to 2019. The region boundaries are shown in Figure 1.
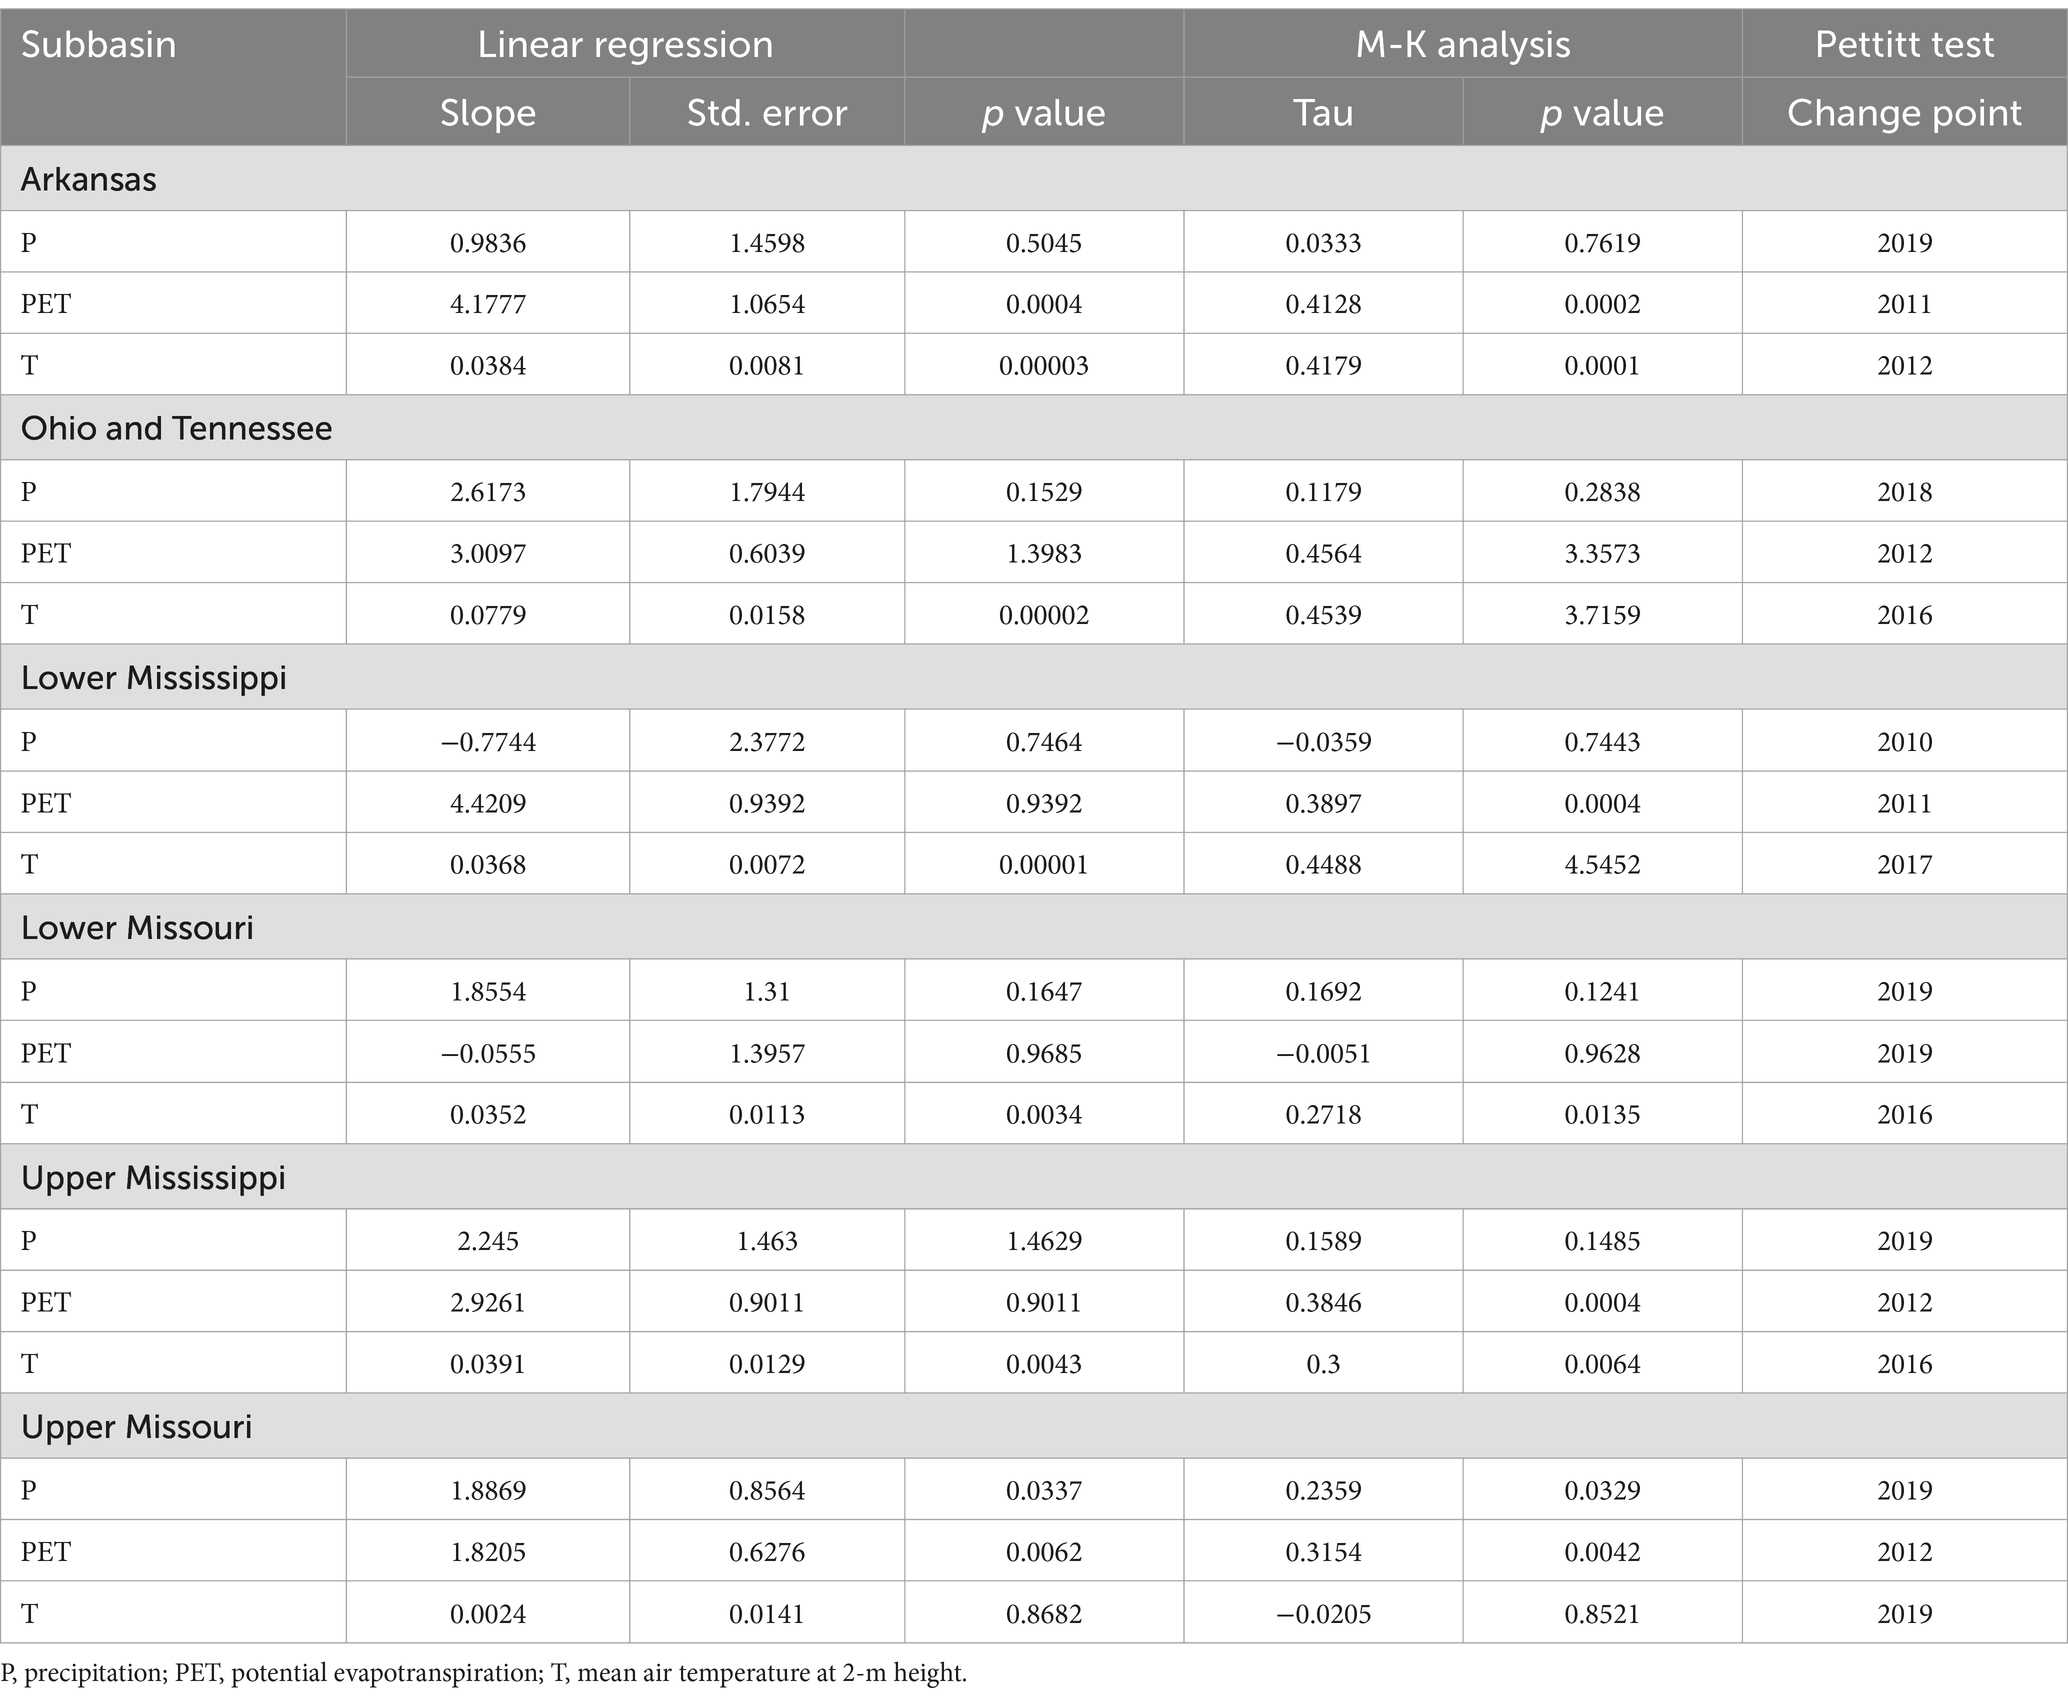
Table 2. Trend analysis results of climate variables were derived using linear regression, the Mann-Kendall test, and the Pettitt test.
Temperature showed a consistent and statistically significant warming trend across all sub-basins (Figure 2), with slope coefficients (Table 2) ranging from +0.03°C/year to +0.078°C/year. The most pronounced warming was detected in the Ohio-Tennessee sub-basin (+0.0779°C/year, p < 0.001). The Upper Mississippi also exhibited a notable warming trend (+0.0391°C/year, p = 0.0043). The R2 values for temperature regression models ranged from 0.25 to 0.38, indicating a moderate fit and suggesting that other factors may also influence temperature trends.
Potential Evapotranspiration (PET) demonstrated significant positive trends (Figure 2) across most sub-basins, with the Arkansas sub-basin showing (Table 2) the highest increase (+4.1777 mm/year, p < 0.001). The Upper Missouri sub-basin also exhibited a significant upward trend (+1.8205 mm/year, p < 0.01). In contrast, the Lower Missouri sub-basin did not show a significant PET trend (p = 0.9685). The observed PET trends suggest an increasing atmospheric demand for water, which could exacerbate aridity, particularly in sub-basins already experiencing declining precipitation.
The results from the linear regression analysis indicate significant warming and increasing PET trends, particularly in the southern and central parts of the MRB, which are likely to intensify water stress. The mixed precipitation trends suggest a complex interaction of regional climatic drivers, with potential implications for flood risk in northern sub-basins and drought risk in southern areas. The use of confidence intervals and p-values enhances the robustness of these findings, providing a clearer understanding of hydroclimatic variability across the MRB.
3.2 Mann-Kendall test
The Mann-Kendall test was utilized to detect monotonic trends in precipitation, temperature, and potential evapotranspiration (PET) across the Mississippi River Basin (MRB) for the period 1980–2019. By evaluating the significance of trend directions, the Mann-Kendall test provides a framework for understanding long-term changes in hydroclimatic variables.
The Mann-Kendall test identified significant positive trends (Table 2) in precipitation for the Upper Missouri (Tau = +2,359, p = 0.0329) sub-basin, indicating an increase of approximately +1.8869 mm/year. In contrast, the Lower Mississippi sub-basin exhibited a negative trend (Tau = −0.0359, p = 0.7443), suggesting a decreasing but statistically insignificant trend. The lack of significant trends in southern sub-basins highlights the spatial heterogeneity of precipitation patterns across the MRB.
Temperature trends were uniformly positive and significant across all sub-basins (Table 2). The most substantial warming was observed in the Ohio-Tennessee sub-basin (Tau = +0.459), with an estimated increase of +0.0779°C/year. The Upper Mississippi also exhibited a notable warming trend (Tau = 0.3, p = 0.0064). These results align with the broader warming trends observed in North America, suggesting that the MRB is experiencing significant temperature increases that could exacerbate PET and aridity.
Potential Evapotranspiration (PET) trends were also significantly positive in most sub-basins (Table 2), with the Arkansas sub-basin showing the higher increase (Tau = +0.4128, p < 0.001), corresponding to an increase of +4.1777 mm/year. The Lower Missouri sub-basin, however, did not show a significant PET trend (Tau = −0.0051, p = 0.9628), indicating localized variations in atmospheric demand for water. These findings suggest a potential intensification of water stress in southern sub-basins due to rising PET.
The Mann-Kendall test results reveal a clear north–south gradient in hydroclimatic trends across the MRB. Increasing trends in temperature and PET, particularly in southern sub-basins, highlight the growing risk of aridity and water stress.
3.3 Change point analysis
Change point analysis was performed using Pettitt’s test to detect significant shifts in precipitation, temperature, and potential evapotranspiration (PET) trends across the Mississippi River Basin (MRB) for the period 1980–2019. This non-parametric test is effective for identifying abrupt changes in time series data without assuming a specific distribution.
The analysis identified significant change points in precipitation trends (Table 2) primarily during the late 1990s, with the most notable shifts occurring around 1997 in the Lower Mississippi sub-basin (p = 0.02). In the Upper Missouri and Upper Mississippi sub-basins, change points were detected in 1995 and 1998, respectively, corresponding to a marked increase in precipitation. The detection of these change points suggests a possible linkage between large-scale climate drivers and precipitation variability across the MRB.
Change point analysis revealed significant shifts in temperature trends (Table 2) across all sub-basins, with most change points occurring in the early to mid-1990s. For instance, the Ohio-Tennessee sub-basin exhibited a notable change point in 1994 (p < 0.01), coinciding with a period of accelerated warming. The Upper Mississippi also showed a significant change point in 1992 (p = 0.03), aligning with global warming trends observed during the 1990s. The consistent timing of temperature change points across multiple sub-basins suggests a basin-wide warming trend potentially linked to anthropogenic climate change and increased greenhouse gas concentrations.
Potential Evapotranspiration (PET) exhibited significant change points (Table 2) in the early 2000s, particularly in the Arkansas and Ohio-Tennessee sub-basins. For instance, a change point was detected in 2002 for the Arkansas sub-basin (p < 0.01), indicating a sudden increase in PET rates likely driven by rising. The Lower Missouri sub-basin, however, did not show significant PET change points, suggesting localized variability in climatic drivers. The alignment of PET change points with temperature shifts underscores the influence of rising temperatures and subsequent increases in PET.
3.4 Other tests
Correlation analysis was performed to examine the relationships among precipitation, temperature, and potential evapotranspiration (PET) across the Mississippi River Basin (MRB). The results, summarized in Table 3, provide insights into the interconnectedness of hydroclimatic variables and their spatial variability across different sub-basins.
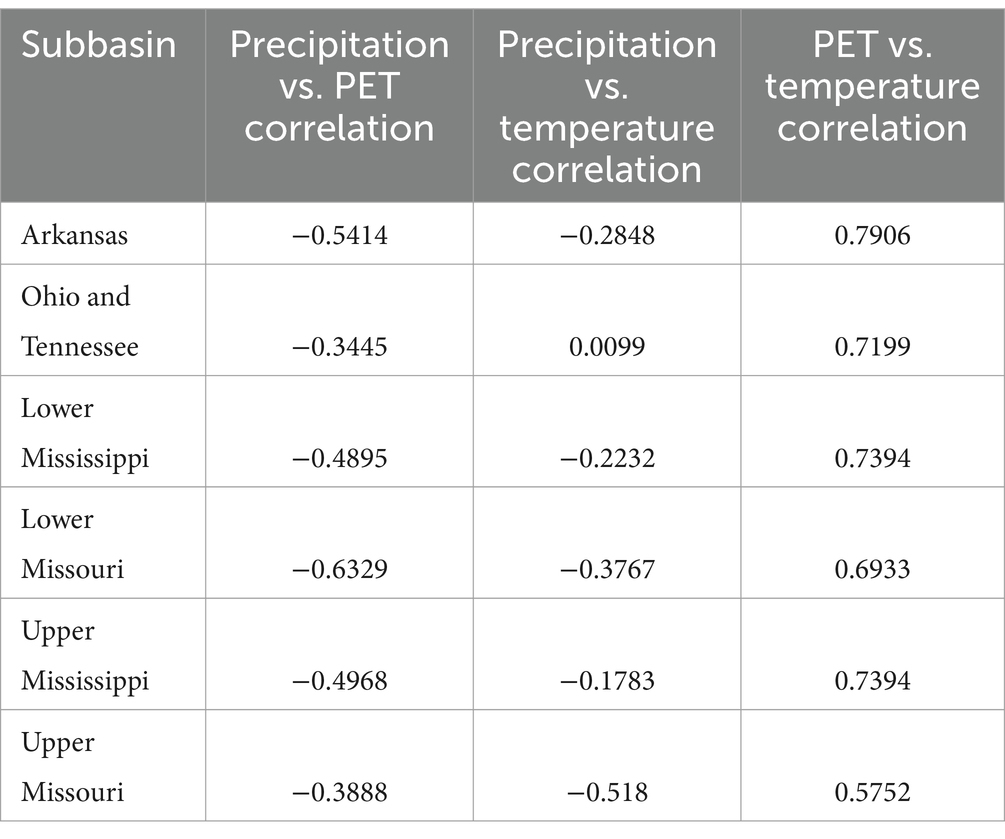
Table 3. Pairwise correlation analysis between hydroclimatic variables (precipitation, potential evapotranspiration, and temperature) across subbasins.
Table 3 reveals a notable negative correlation between precipitation and temperature in the Upper Missouri sub-basin, with a correlation coefficient of −0.518 (p < 0.05). This inverse relationship suggests that higher temperatures coincide with reduced precipitation in this region. One potential explanation for this negative correlation is the enhanced evapotranspiration during warmer periods, which can deplete soil moisture and reduce the amount available for precipitation formation. These factors could contribute to the observed inverse relationship between precipitation and temperature.
As expected, a strong positive correlation was detected between temperature and PET across all sub-basins, with correlation coefficients ranging from +0.65 to +0.85 (p < 0.01). The highest correlation was observed in the Arkansas sub-basin (+0.85, p < 0.001). This strong association underscores the role of temperature as a key driver of PET increases in the MRB, particularly in southern regions (Table 3).
The analysis showed mixed correlations between precipitation and PET. Northern sub-basins exhibited weak positive correlations, suggesting that wetter conditions may coincide with higher PET. In contrast, southern sub-basins displayed weak negative correlations, likely reflecting the impact of reduced moisture availability on PET in drier areas.
3.5 Aridity index
The analysis of aridity trends across the Mississippi River Basin (MRB) was conducted using the United Nations Environment Programme (UNEP) Aridity Index and the De Martonne Aridity Index (Table 4). The spatial distribution of these indices is presented in Figures 3, 4, illustrating distinct patterns of aridity that have implications for water resource management and agricultural practices across the MRB.

Table 4. Classification of UNEP and De Mortanne aridity indices (Pellicone et al., 2019; Zomer et al., 2022).
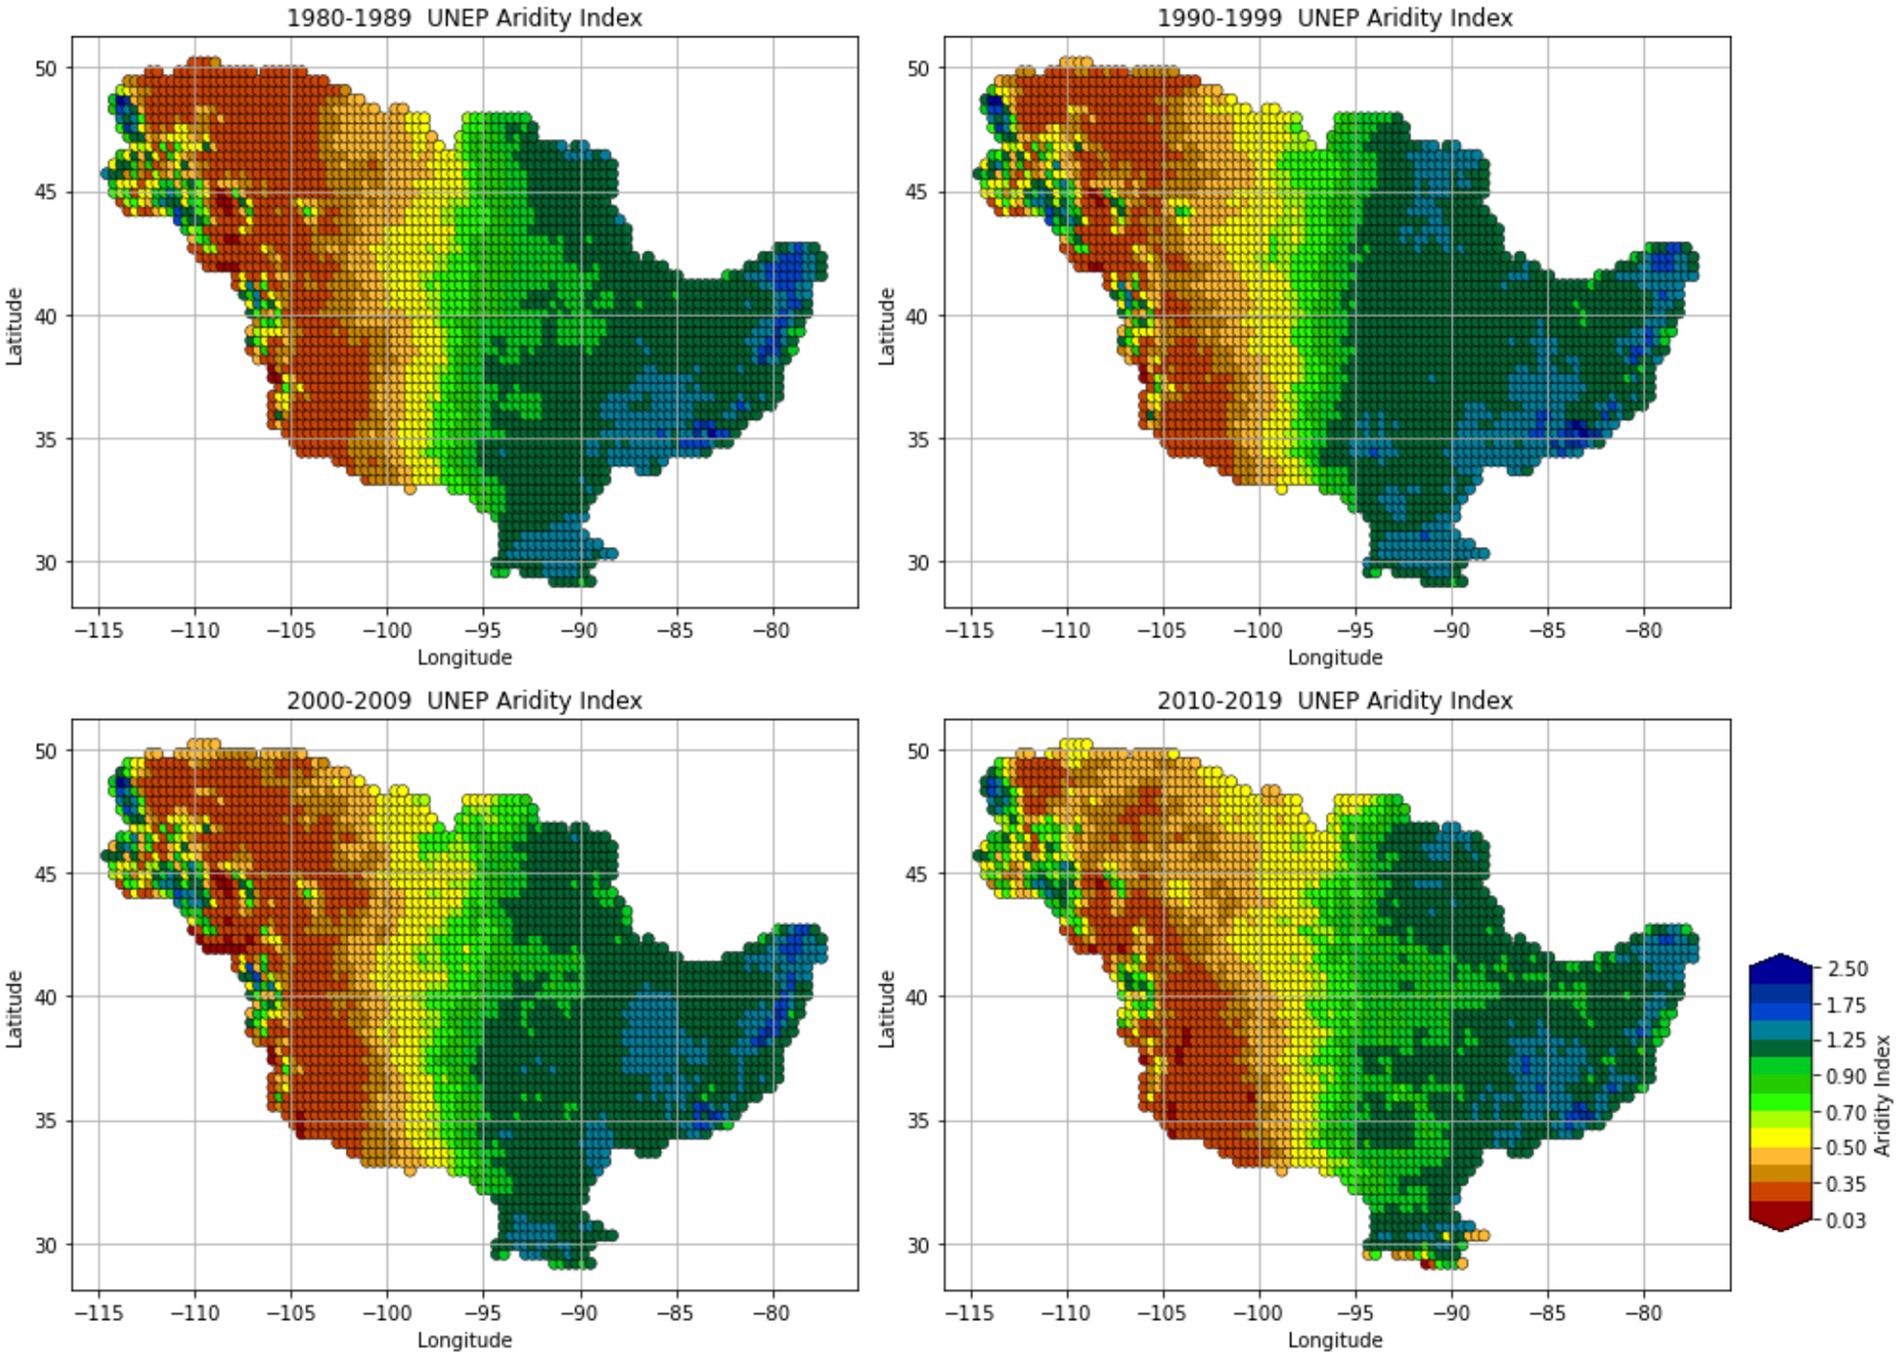
Figure 3. Spatial distribution of aridity indices (AI) using UNEP formula.
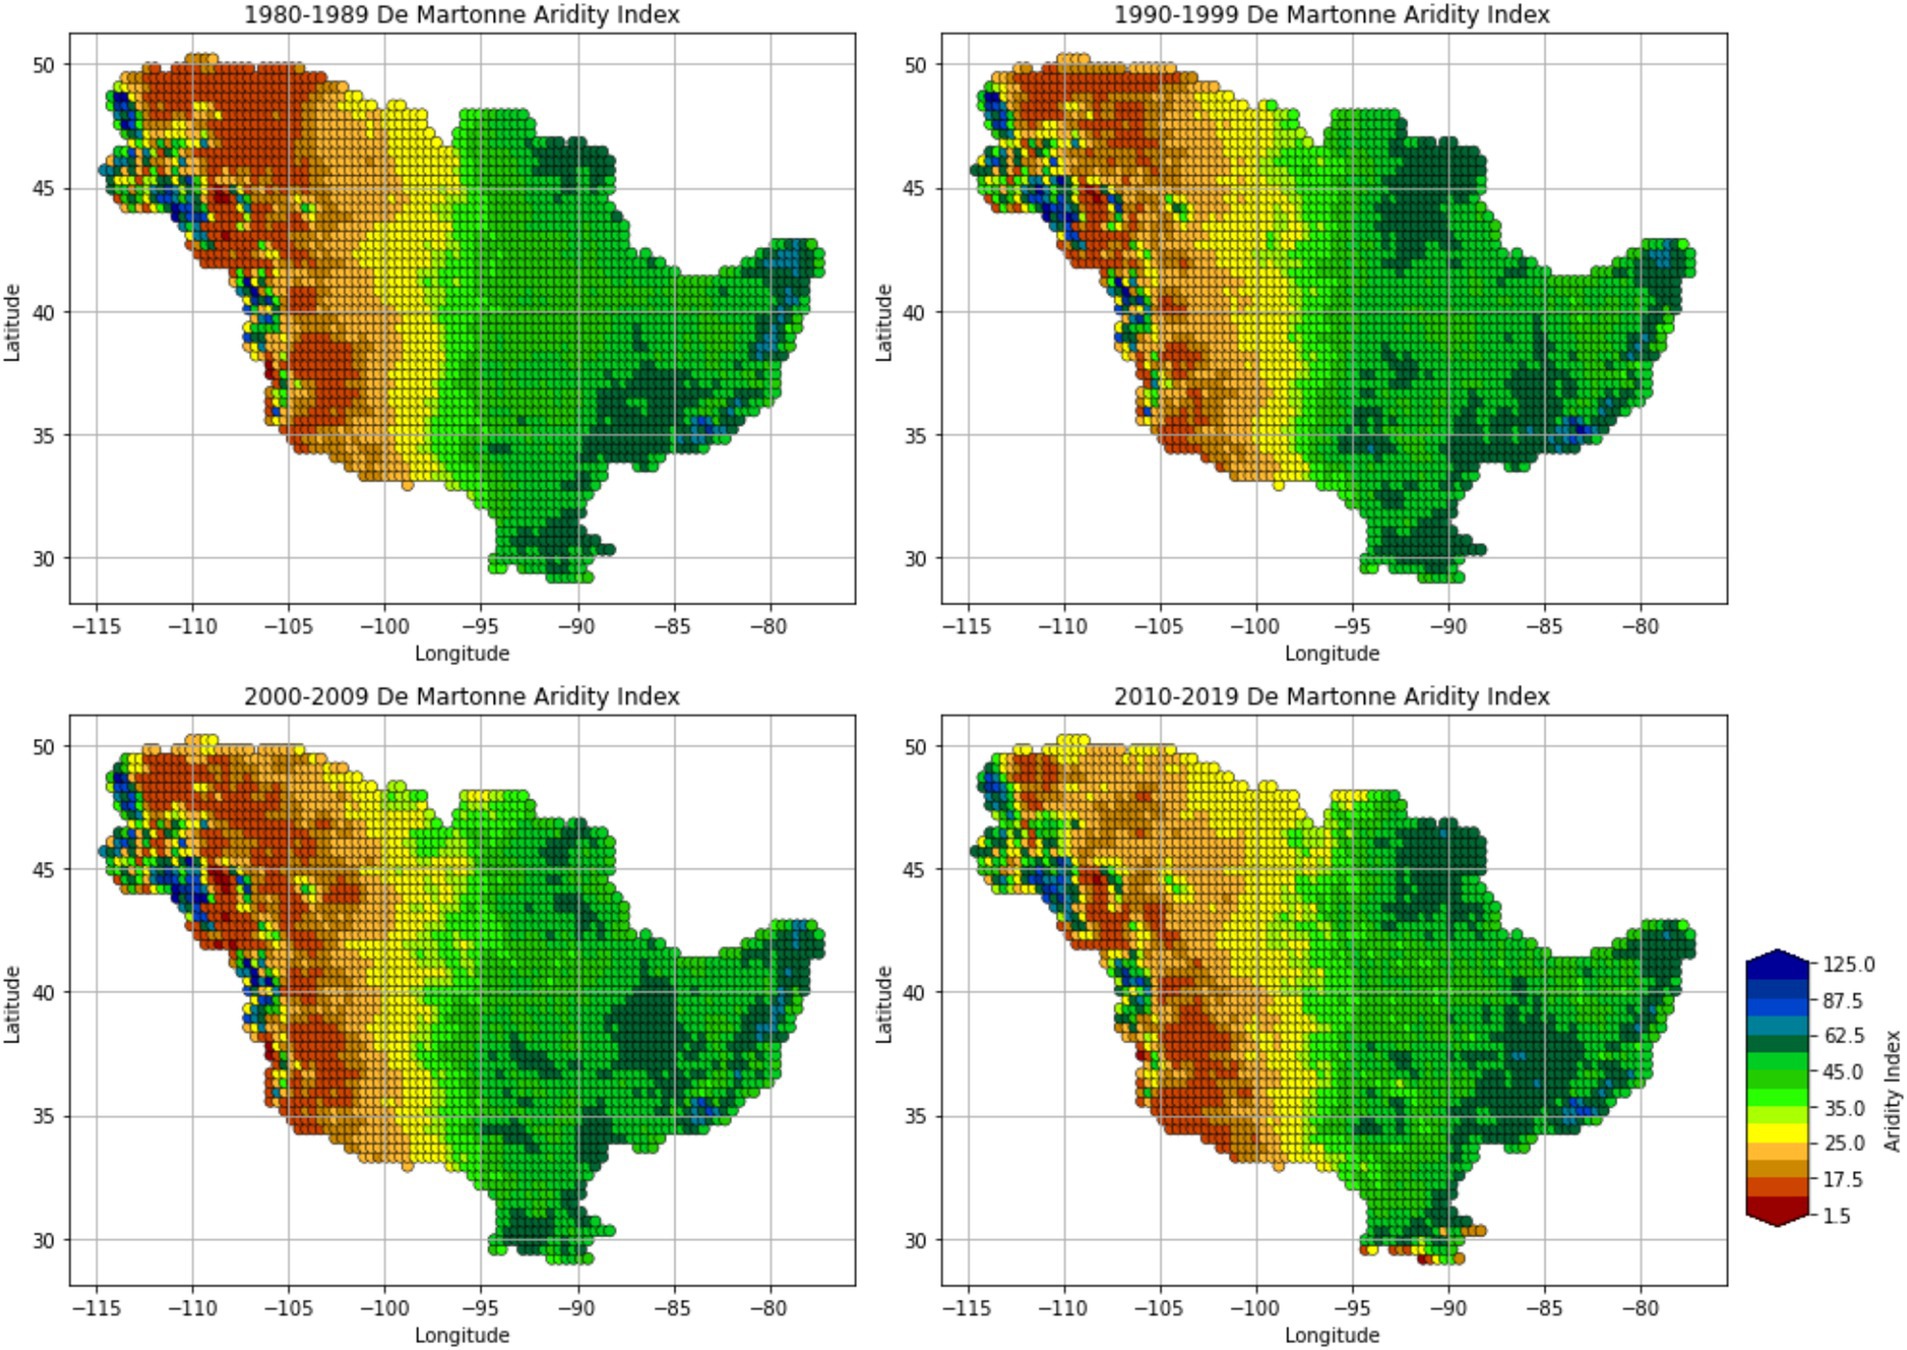
Figure 4. The spatial distribution of aridity indices (AI) using the De Martonne formula (units: mm/°C).
The UNEP Aridity Index, which is calculated as the ratio of annual precipitation to PET, shows substantial spatial variability across the MRB. According to Figure 3, the western portions of the MRB, particularly the Upper Missouri and Arkansas sub-basins, exhibit lower UNEP index values (<0.50), indicating semi-arid conditions. In contrast, the Ohio-Tennessee sub-basin maintains higher index values (>0.65), reflecting humid conditions. From 2010 to 2019, there is evidence of expanding semi-arid conditions in the western sub-basins, supported by Figure 2 increased PET and relatively stable or declining precipitation. The expansion of semi-arid conditions is: particularly notable in the Arkansas sub-basin, where index values have declined significantly, suggesting a heightened risk of drought and water stress. The observed shifts in the UNEP index across western sub-basins are statistically significant (p < 0.05), confirming that the trends are not due to random variability. The confidence intervals for the observed trends suggest a high level of certainty, reinforcing the robustness of the findings.
The De Martonne Index, which accounts for precipitation and temperature, also reveals significant aridity trends across the MRB, as shown in Figure 4. The western sub-basins demonstrate lower index values (<20), characteristic of semi-arid to dry sub-humid conditions. In contrast, the northern sub-basins, such as the Upper Mississippi, maintain higher index values (>30), indicating sub-humid to humid conditions. The analysis suggests that the De Martonne Index exhibits smoother gradients of aridity change compared to the UNEP Index, reflecting its sensitivity to temperature rather than PET. This pattern is particularly evident in the southern MRB, where rising temperatures have contributed significantly to decreasing De Martonne Index values. The observed declines in the De Martonne Index in the Arkansas and Lower Missouri sub-basins are statistically significant (p < 0.05). The confidence intervals for these trends are relatively narrow, suggesting reliable and robust results.
The spatial patterns in Figures 3, 4 collectively indicate that while the eastern MRB continues to experience humid conditions, the western sub-basins are increasingly shifting towards semi-arid conditions. The contrasting sensitivities of the two indices underscore the importance of using multiple indices to assess aridity comprehensively. The period from 2010 to 2019 witnessed a significant expansion of semi-arid conditions in the western MRB, particularly in the Upper Missouri and Arkansas sub-basins. The UNEP Index for these regions dropped below 0.50, confirming the shift towards semi-arid conditions.
4 Discussion
The observed hydroclimatic trends across the MRB reveal substantial spatial variability in precipitation, PET, and temperature, leading to distinct regional differences in aridity (Table 2). While precipitation and PET increased basin-wide, the impacts varied significantly across regions. The southern MRB exhibited the most pronounced rise in aridity, with UNEP index values increasing by 0.12–0.15 units per decade. This trend was largely driven by elevated PET (average increase of 3.27 mm/year) and declining precipitation in Lower Missouri (−0.06 mm/year). These findings align with previous studies identifying the southern MRB as highly vulnerable to increasing aridity due to the combined effects of rising temperatures and variability in precipitation patterns (Cook et al., 2015).
The strong correlation between PET and temperature highlights the dominant role of atmospheric drivers in controlling PET variability. The notable increase in PET in the Arkansas and Ohio, Tennessee regions further emphasize the intensifying evaporative demand. However, precipitation trends exhibited greater heterogeneity, with some regions (e.g., Upper Missouri and Upper Mississippi) experiencing increases, while others (e.g., Lower Mississippi) showed declines. These findings align with previous research suggesting a complex interplay between temperature, PET, and precipitation in large river basins (Apurv and Cai, 2021; Ficklin et al., 2018).
The central MRB exhibited intermediate trends, with both temperature and PET rising by 0.03°C/year and 0.4 mm/year, respectively, contributing to moderate increases in aridity. This region serves as a transitional zone, where climatic variability creates complex interactions between precipitation and PET. These findings support observations by Muñoz et al. (2020), which emphasize the central MRB’s dual vulnerability to both droughts and floods due to its transitional climatic characteristics.
The UNEP index, which incorporates PET as a component, captured sharper increases in aridity in Eastern and Southern regions. Conversely, the De Martonne index presented smoother gradients (Figure 4), particularly in regions where temperature and PET exhibited a strong correlation (r > 0.7). This difference underscores the distinct sensitivities of the two indices and highlights the importance of employing multiple metrics to assess aridity. The key distinction between these indices lies in their denominators: the UNEP index uses PET, whereas the De Martonne index uses temperature. Since temperature is a primary variable in PET calculation and shows a positive correlation greater than 0.7 with PET, the two indices exhibit similar spatial trends, with minor variations in humid and very humid regions.
The observed hydroclimatic trends in the Mississippi River Basin (MRB) from 1980 to 2019 indicate significant increases in aridity, particularly in the southern and western sub-basins. These findings align with previous studies that reported rising potential evapotranspiration (PET) and temperature as Qian et al. (2007) primary drivers of increased drought risks in the central and southern United States (Cook et al., 2015; Ficklin et al., 2018). For instance, Cook et al. (2015) identified a heightened risk of 21st-century droughts in the American Southwest due to temperature-driven increases in PET, which is consistent with the significant PET trends observed in the Arkansas and Lower Missouri sub-basins. Similarly, Apurv and Cai (2021) highlighted the role of warming-induced increases in PET in exacerbating aridity across the MRB.
However, this study diverges from previous research by emphasizing the role of PET as a driver of aridity trends than precipitation alone. While earlier studies, such as Qian et al. (2007) and Seager et al. (2007), primarily focused on precipitation variability and its influence on drought risks, the current analysis demonstrates that rising PET due to increasing temperatures significantly amplifies aridity, even in regions with relatively stable precipitation. This distinction underscores the importance of considering PET trends in addition to precipitation variability when assessing drought risks and water management strategies in the MRB (Seagera et al., 2018).
Additionally, the spatial analysis of aridity indices in this study reveals a more understanding of regional differences in aridity trends compared to previous basin-wide assessments. For instance, while (Seager et al., 2007) suggested a relatively uniform increase in aridity across the central U.S., our findings highlight distinct spatial gradients, with the western MRB experiencing a more pronounced shift towards semi-arid conditions. This insight suggests that localized adaptation strategies are essential to effectively manage water resources and mitigate drought risks in different sub-basins.
Key limitations of this study include the reliance on annual data, which may obscure important seasonal dynamics that are critical for understanding hydroclimatic extremes. Seasonal variations in precipitation and PET significantly influence water availability and drought risks, and future research should incorporate higher-resolution seasonal or sub-annual data to capture these dynamics accurately. The spatial heterogeneity observed in aridity trends underscores the need for localized adaptation strategies. For instance, southern regions may require enhanced drought mitigation measures, such as improved irrigation efficiency and soil moisture conservation techniques, while northern regions might focus on maintaining existing water resource stability.
Also, the potential impacts of land use changes, such as urbanization and agricultural expansion, were not explicitly considered in this analysis. Previous studies (Shi and Wang, 2020; Turner, 2022) have demonstrated that land use changes significantly affect runoff, soil moisture, and groundwater recharge, potentially altering the hydroclimatic balance in the MRB. Integrating land use data with hydroclimatic trends could provide a more comprehensive understanding of the drivers of aridity and inform more effective adaptation strategies.
The observed increase in aridity in the southern and western MRB poses significant challenges for water resources, agriculture, and ecosystems. Rising potential evapotranspiration (PET) and declining precipitation are likely to exacerbate water stress for irrigation and municipal uses, reduce soil moisture availability, and negatively impact crop yields. Efficient irrigation practices, drought-resistant crops, and integrated water management could mitigate these impacts. Ecologically, increased aridity threatens the hydrological balance of wetlands and riparian habitats, reducing streamflow and biodiversity. Nature-based solutions such as floodplain restoration, reforestation, and buffer zones can help enhance the resilience of aquatic and terrestrial ecosystems to these stressors.
Addressing the diverse hydroclimatic challenges across the Mississippi River Basin (MRB) necessitates localized adaptation strategies tailored to each sub-basin’s specific conditions. In the southern MRB, where declining precipitation and rising potential evapotranspiration (PET) are concerns, watershed development practices such as check dams, percolation tanks, and contour bunding can enhance groundwater recharge and reduce runoff. These measures have been effective in semi-arid regions, improving water security and sustainability (Srivastava and Chinnasamy, 2024). Conversely, the northern sub-basins of the MRB experience increased precipitation and heightened flood risks. Implementing green infrastructure solutions, such as constructed wetlands and riparian buffers, can manage excess runoff and mitigate flooding. These approaches contribute to water security and ecosystem health by addressing the impacts of climate change and water scarcity (Jain et al., 2024).
For the western MRB, where semi-arid conditions are expanding, strategies focused on artificial groundwater recharge, sedimentation enhancement, and controlled river diversions could help sustain water availability and counteract land degradation. Integrating these localized strategies with broader policy measures such as Integrated Water Resource Management (IWRM) can provide a comprehensive approach to managing water resources under increasing aridity.
5 Conclusion
The broader implications of these findings are substantial. The increasing aridity in the southern MRB underscores the urgent need for targeted policy interventions focused on water conservation and land management. These results can inform regional climate adaptation frameworks, guiding the development of strategies to mitigate drought impacts and enhance water resource resilience. In agriculture, rising aridity trends highlight the necessity of adaptive measures such as drought-resistant crop varieties, improved irrigation efficiency, and soil moisture conservation techniques. Additionally, hydroclimatic shifts are likely to affect ecosystem health in the MRB, with potential consequences for biodiversity and ecosystem services.
Despite its contributions, this research has limitations. The focus on annual data precludes an in-depth examination of seasonal dynamics, which are critical for understanding short-term hydroclimatic extremes. Future research should address these limitations by incorporating higher-resolution datasets to capture hydroclimatic variations more precisely and by exploring seasonal and sub-annual dynamics. Additionally, investigating the role of groundwater dynamics and human interventions—such as irrigation and urbanization—could provide a more comprehensive understanding of the MRB’s hydrological changes. Expanding the temporal scope of analysis to include future climate projections would also be valuable for informing long-term adaptation strategies.
In conclusion, this study highlights the complex and spatially heterogeneous nature of hydroclimatic trends in the MRB, offering valuable insights for sustainable water resource management, agricultural planning, and ecosystem conservation in the face of ongoing and future climate challenges.
Data availability statement
The original contributions presented in the study are included in the article/supplementary material, further inquiries can be directed to the corresponding author.
Author contributions
UA: Conceptualization, Formal analysis, Investigation, Methodology, Software, Visualization, Writing – original draft, Writing – review & editing. SB: Writing – review & editing. NA: Conceptualization, Supervision, Writing – review & editing.
Funding
The author(s) declare that financial support was received for the research and/or publication of this article. This research is supported by the College of Engineering and the School of Natural Resources, University of Missouri startup funds to NA and College of Engineering Graduate Research Fellowship to UA.
Acknowledgments
We acknowledge the suggestion provided by Dr. Akanksha Balha on earlier drafts.
Conflict of interest
The authors declare that the research was conducted in the absence of any commercial or financial relationships that could be construed as a potential conflict of interest.
Publisher’s note
All claims expressed in this article are solely those of the authors and do not necessarily represent those of their affiliated organizations, or those of the publisher, the editors and the reviewers. Any product that may be evaluated in this article, or claim that may be made by its manufacturer, is not guaranteed or endorsed by the publisher.
References
Allen, R. G., Pereira, L. S., and Raes, D., (1998). Crop evapotranspiration – Guidelines for computing crop water requirements. FAO Irrigation and Drainage Paper 56. Rome: FAO.
Apurv, T., and Cai, X. (2021). Regional drought risk in the contiguous United States. Geophys. Res. Lett. 48:e2020GL092200. doi: 10.1029/2020GL092200
Arockia Anusty, J., Singh, M., Khanna, M., Krishnan, P., Shrivastava, M., Parihar, C. M., et al. (2024). Trend detection and change point analysis of inflows in Karuppanadhi and Gundar dams of Chittar River basin, Tamil Nadu, India. Water Pract. Technol. 19, 113–133. doi: 10.2166/wpt.2023.231
Bisht, H., Shaloo,, Kumar, B., Rajput, J., Singh, D. K., Vishnoi, L., et al. (2024). Impacts of climate change on phenology, yield, and water productivity of wheat in a semi-arid region of India using the CERES-wheat model. J. Water Clim. Change 15, 5089–5106. doi: 10.2166/wcc.2024.139
Buishand, T. A. (1982). Some methods for testing the homogeneity of rainfall records. J. Hydrol. 58, 11–27. doi: 10.1016/0022-1694(82)90066-X
Cai, J., Liu, Y., Lei, T., and Pereira, L. S. (2007). Estimating reference evapotranspiration with the FAO penman–Monteith equation using daily weather forecast messages. Agric. For. Meteorol. 145, 22–35. doi: 10.1016/J.AGRFORMET.2007.04.012
Cigizoglu, H. K., Bayazit, M., and Önöz, B. (2005). Trends in the maximum, mean, and low flows of Turkish Rivers. J. Hydrometeorol. 6, 280–290. doi: 10.1175/JHM412.1
Conte, L. C., Bayer, D. M., and Bayer, F. M. (2019). Bootstrap Pettitt test for detecting change points in hydroclimatological data: case study of Itaipu hydroelectric plant, Brazil. Hydrol. Sci. J. 64, 1312–1326. doi: 10.1080/02626667.2019.1632461
Cook, B. I., Ault, T. R., and Smerdon, J. E. (2015). Unprecedented 21st century drought risk in the American southwest and Central Plains. Sci. Adv. 1:e1400082. doi: 10.1126/sciadv.1400082
Dai, A. (2011). Characteristics and trends in various forms of the palmer drought severity index during 1900–2008. J. Geophys. Res. Atmos. 116:12115. doi: 10.1029/2010JD015541
Dai, A., Trenberth, K. E., and Qian, T. (2004). A global dataset of palmer drought severity index for 1870–2002: relationship with soil moisture and effects of surface warming. J. Hydrometeorol. 5, 1117–1130. doi: 10.1175/JHM-386.1
Díaz, S., Tilman, D., Fargione, J., Chapin, F. S. III, Dirzo, R., Kitzberger, T., et al. (2005). Biodiversity regulation of ecosystem services. Trends and conditions. 279–329.
Donner, S. D., Kucharik, C. J., and Foley, J. A. (2004). Impact of changing land use practices on nitrate export by the Mississippi River. Global Biogeochem. Cycles 18. doi: 10.1029/2003GB002093
Ficklin, D. L., Abatzoglou, J. T., Robeson, S. M., Null, S. E., and Knouft, J. H. (2018). Natural and managed watersheds show similar responses to recent climate change. Proc. Natl. Acad. Sci. USA 115, 8553–8557. doi: 10.1073/pnas.1801026115
Fuhrmann, F., Diensberg, B., Gong, X., Lohmann, G., and Sirocko, F. (2021). Aridity synthesis for eight selected key regions of the global climate system during the last 60 000 years 16. Clim. Past 16, 2221–2238. doi: 10.5194/cp-16-2221-2020
Gaddikeri, V., Sarangi, A., Singh, D. K., Jatav, M. S., Rajput, J., and Kushwaha, N. L. (2024). Trend and change-point analyses of meteorological variables using Mann–Kendall family tests and innovative trend assessment techniques in new Bhupania command (India). J. Water Clim. Change 15, 2033–2058. doi: 10.2166/wcc.2024.462
Guo, Q. (2023). Strategies for a resilient, sustainable, and equitable Mississippi River basin. River 2, 336–349. doi: 10.1002/RVR2.60
Haji Mohammadi, M., Shafaie, V., Nazari Samani, A., Zare Garizi, A., and Movahedi Rad, M. (2024). Assessing future hydrological variability in a semi-arid Mediterranean Basin: soil and water assessment tool model projections under shared socioeconomic pathways climate scenarios. Water 16:805. doi: 10.3390/W16060805
Heim, R. R., Bathke, D., Bonsal, B., Cooper, E. W. T., Hadwen, T., Kodama, K., et al. (2023). A review of user perceptions of drought indices and indicators used in the diverse climates of North America. Atmosphere (Basel) 14:1794. doi: 10.3390/ATMOS14121794
Hirsch, R. M., Slack, J. R., and Smith, R. A. (1982). Techniques of trend analysis for monthly water quality data. Water Resour. Res. 18, 107–121. doi: 10.1029/WR018I001P00107
Jain, S., Srivastava, A., Khadke, L., Chatterjee, U., and Elbeltagi, A. (2024). Global-scale water security and desertification management amidst climate change. Environ. Sci. Pollut. Res. 31, 58720–58744. doi: 10.1007/s11356-024-34916-0
Katul, G. G., Oren, R., Manzoni, S., Higgins, C., and Parlange, M. B. (2012). Evapotranspiration: a process driving mass transport and energy exchange in the soil-plant-atmosphere-climate system. Rev. Geophys. 50. doi: 10.1029/2011RG000366
Konapala, G., Mishra, A. K., Wada, Y., and Mann, M. E. (2020). Climate change will affect global water availability through compounding changes in seasonal precipitation and evaporation. Nat. Commun. 11, 11, 1–10. doi: 10.1038/s41467-020-16757-w
Lagarde, A. (2023). Hydrological modeling for the impact of predicted climate change and urbanization: A case study of the lower Mississippi River basin. New Orleans, LA, USA: University of New Orleans. Theses and Dissertations. Available at: https://scholarworks.uno.edu/cgi/viewcontent.cgi?article=4355&context=td
Li, Y., Qin, Y., and Rong, P. (2022). Evolution of potential evapotranspiration and its sensitivity to climate change based on the Thornthwaite, Hargreaves, and penman–Monteith equation in environmental sensitive areas of China. Atmos. Res. 273:106178. doi: 10.1016/J.ATMOSRES.2022.106178
Martin, J. T., Pederson, G. T., Woodhouse, C. A., Cook, E. R., McCabe, G. J., Anchukaitis, K. J., et al. (2020). Increased drought severity tracks warming in the United States’ largest river basin. Proc. Natl. Acad. Sci. USA 117, 11328–11336. doi: 10.1073/PNAS.1916208117
Masson-Delmotte, V., Zhai, P., Pirani, S., Connors, C., Péan, S., Berger, N., et al. (2021). Climate Change 2021: The Physical Science Basis. Contribution of Working Group I to the Sixth Assessment Report of the IPCC. doi: 10.1017/9781009157896
Mccabe, G. J., and Wolock, D. M., (2019) Hydroclimatology of the Mississippi River basin. JAWRA 55, 1053–1064. doi: 10.1111/1752-1688.12749
Middleton, N. J., and Thomas, D. S. G. (1992). World atlas of desertification. J. Arid Environ. 23, 456–457. doi: 10.1016/S0140-1963(18)30626-8
Milly, P. C. D., and Dunne, K. A. (2001). Trends in evaporation and surface cooling in the Mississippi River basin. Geophys. Res. Lett. 28, 1219–1222. doi: 10.1029/2000GL012321
Mississippi River Facts. Mississippi National River & Recreation Area (U.S. National Park Service). (n.d.) Available online at: https://www.nps.gov/miss/riverfacts.htm?utm_source=chatgpt.com (Accessed February 12, 2025).
Mitchell, K. E., Lohmann, D., Houser, P. R., Wood, E. F., Schaake, J. C., Robock, A., et al. (2004). The multi-institution north American land data assimilation system (NLDAS). J. Geophys. Res. Atmos. 109. doi: 10.1029/2003JD003823
Mondal, A., Kundu, S., and Mukhopadhyay, A. (2012). Rainfall trend analysis by Mann-Kendall test: A case study of north-eastern part of Cuttack district, Orissa. Int. J. Geol. Earth Environ. Sci. 2, 70–78.
Muñoz, S. E., Porter, T. J., Bakkelund, A., Nusbaumer, J., Dee, S. G., Hamilton, B., et al. (2020). Lipid biomarker record documents hydroclimatic variability of the Mississippi River basin during the common era. Geophys. Res. Lett. 47:e2020GL087237. doi: 10.1029/2020GL087237
National Research Council. (2014). Mississippi River Water Quality and Interstate Collaboration: Summary of a Workshop. National Academies Press. doi: 10.17226/18797
Nordhaus, W. D., and Moffat, A., (2017). A survey of global impacts of climate change: replication, survey methods, and statistical analysis. NBER Working Paper No. 23646. doi: 10.3386/w23646
North American Land Change Monitoring System. (n.d.). Available online at: http://www.cec.org/north-american-land-change-monitoring-system/ (Accessed February 16, 2025).
Paramaguru, P. K., Panda, K. C., Suna, T., and Rajput, J. (2023). Assessment of spatiotemporal variability of rainfall and surface wind speed over the eastern coastal agro-ecological zones of India using advanced trend detection approaches. Theor. Appl. Climatol. 154, 311–335. doi: 10.1007/s00704-023-04556-4
Pellicone, G., Caloiero, T., and Guagliardi, I. (2019). The De Martonne aridity index in Calabria (southern Italy). J. Maps 15, 788–796. doi: 10.1080/17445647.2019.1673840
Qian, T., Dai, A., and Trenberth, K. E. (2007). Hydroclimatic trends in the Mississippi River basin from 1948 to 2004. J. Clim. 20, 4599–4614. doi: 10.1175/JCLI4262.1
Rajib, A., Zheng, Q., Golden, H. E., Wu, Q., Lane, C. R., Christensen, J. R., et al. (2021). The changing face of floodplains in the Mississippi River basin detected by a 60-year land use change dataset. Sci. Data 8, 8:271. doi: 10.1038/s41597-021-01048-w
Raymond, C., Horton, R. M., Zscheischler, J., Martius, O., AghaKouchak, A., Balch, J., et al. (2020). Understanding and managing connected extreme events. Nat. Clim. Chang. 10, 611–621. doi: 10.1038/s41558-020-0790-4
Sandilya, S., Singh, S., Kumar, S., and Rajput, J. (2025). Understanding the performance of global precipitation products for hydrological modeling in the data-scarce morphologically complex central Himalayan region. J. Atmos. Sol. Terr. Phys. 271:106513. doi: 10.1016/j.jastp.2025.106513
Seager, R., Ting, M., Held, I., Kushnir, Y., Lu, J., Vecchi, G., et al. (2007). Model projections of an imminent transition to a more arid climate in southwestern North America. Science 1979, 1181–1184. doi: 10.1126/science.1139601
Seagera, R., Feldman, J., Lis, N., Ting, M., Williams, A. P., Nakamura, J., et al. (2018). Whither the 100th meridian? The once and future physical and human geography of America’s arid-humid divide. Part II: the meridian moves east. Earth Interact. 22, 1–24. doi: 10.1175/EI-D-17-0012.1
Sepaskhah, A. R., and Razzaghi, F. (2009). Evaluation of the adjusted Thornthwaite and Hargreaves-Samani methods for estimation of daily evapotranspiration in a semi-arid region of Iran. Arch. Agron. Soil Sci. 55, 51–66. doi: 10.1080/03650340802383148
Sheffield, J., and Wood, E. F. (2008). Global trends and variability in soil moisture and drought characteristics, 1950–2000, from observation-driven simulations of the terrestrial hydrologic cycle. J. Clim. 21, 432–458. doi: 10.1175/2007JCLI1822.1
Shi, W., and Wang, N. (2020). An improved SCS-CN method incorporating slope, soil moisture, and storm duration factors for runoff prediction. Water 12:1335. doi: 10.3390/W12051335
Srivastava, A., and Chinnasamy, P. (2024). Watershed development interventions for rural water safety, security, and sustainability in semi-arid region of Western-India. Environ. Dev. Sustain. 26, 18231–18265. doi: 10.1007/s10668-023-03387-7
Tsiros, I. X., Nastos, P., Proutsos, N. D., and Tsaousidis, A. (2020). Variability of the aridity index and related drought parameters in Greece using climatological data over the last century (1900–1997). Atmos. Res. 240:104914. doi: 10.1016/J.ATMOSRES.2020.104914
Turner, R. E. (2022). Variability in the discharge of the Mississippi River and tributaries from 1817 to 2020. PLoS One 17:e0276513. doi: 10.1371/JOURNAL.PONE.0276513
Upadhyay, R. K. (2020). Markers for global climate change and its impact on social, biological and ecological systems: a review. Am. J. Clim. Change 9, 159–203. doi: 10.4236/AJCC.2020.93012
Vicente-Serrano, S. M., Beguería, S., and López-Moreno, J. I. (2010). A multiscalar drought index sensitive to global warming: the standardized precipitation evapotranspiration index. J. Clim. 23, 1696–1718. doi: 10.1175/2009JCLI2909.1
Vörösmarty, C. J., Green, P., Salisbury, J., and Lammers, R. B. (2000). Global water resources: vulnerability from climate change and population growth. Science 1979, 284–288. doi: 10.1126/SCIENCE.289.5477.284
Xia, Y., Cosgrove, B. A., Mitchell, K. E., Peters-Lidard, C. D., Ek, M. B., Brewer, M., et al. (2016). Basin-scale assessment of the land surface water budget in the national centers for environmental prediction operational and research NLDAS-2 systems. J. Geophys. Res. 121, 2750–2779. doi: 10.1002/2015JD023733
Xia, Y., Mitchell, K., Ek, M., Cosgrove, B., Sheffield, J., Luo, L., et al. (2012a). Continental-scale water and energy flux analysis and validation for north American land data assimilation system project phase 2 (NLDAS-2): 2. Validation of model-simulated streamflow. J. Geophys. Res. Atmos. 117. doi: 10.1029/2011JD016051
Xia, Y., Mitchell, K., Ek, M., Sheffield, J., Cosgrove, B., Wood, E., et al. (2012b). Continental-scale water and energy flux analysis and validation for the north American land data assimilation system project phase 2 (NLDAS-2): 1. Intercomparison and application of model products. J. Geophys. Res. Atmos. 117. doi: 10.1029/2011JD016048
Yue, S., and Wang, C. (2004). The Mann-Kendall test modified by effective sample size to detect trend in serially correlated hydrological series. Water Resour. Manag. 18, 201–218. doi: 10.1023/B:WARM.0000043140.61082.60
Keywords: Mississippi River Basin, aridity indices, precipitation, potential evapotranspiration, temperature
Citation: Abeysinghe U, Balkissoon S and Aloysius N (2025) Assessment of hydroclimatic variability and aridity trends in the Mississippi River Basin using parametric and non-parametric techniques. Front. Clim. 7:1481926. doi: 10.3389/fclim.2025.1481926
Edited by:
Aman Srivastava, Indian Institute of Technology Kharagpur, IndiaCopyright © 2025 Abeysinghe, Balkissoon and Aloysius. This is an open-access article distributed under the terms of the Creative Commons Attribution License (CC BY). The use, distribution or reproduction in other forums is permitted, provided the original author(s) and the copyright owner(s) are credited and that the original publication in this journal is cited, in accordance with accepted academic practice. No use, distribution or reproduction is permitted which does not comply with these terms.
*Correspondence: Umanda Abeysinghe, bWphYm5mQHVtc3lzdGVtLmVkdQ==