 Marion Devilliers1*
 Steffen M. Olsen1
 Helene R. Langehaug2
 Chuncheng Guo1
 Rashed Mahmood1
 Tian Tian1
 Shuting Yang1
- 1National Center for Climate Research Department, Danish Meteorological Institute, Copenhagen, Denmark
- 2Nansen Environmental and Remote Sensing Center and Bjerknes Centre for Climate Research, Bergen, Norway
Atlantic Water plays a key role in future changes in the Arctic Ocean. It contributes to Atlantification by transporting salt and heat within the Arctic Ocean basins. Many studies also attribute the amplified warming of the Arctic Ocean to an increase in poleward ocean heat transport by warming currents or the increasing strength of ocean currents. Global models are needed to reliably predict consistent trends in heat transport, as large-scale processes are at play. However, these models are too coarse to resolve key ocean processes and to address the complex interplay between ocean dynamics and the bathymetry of the Arctic region. Here, we propose to construct a sub-ensemble of simulations based on 235 historical simulations from 12 CMIP6 models that best represent the downstream drivers of Atlantic warming. We select the model ensemble members showing the closest agreement with observed surface temperature variability over 1960–1990 in the subpolar gyre (SPG). More specifically, we use a recent index that links surface temperature in the SPG to the Atlantic Meridional Overturning Circulation (AMOC): the AMOC-SST index. The subsampled ensemble shows a better correlation with the observed AMOC-SST index over the last 35 years of the historical period (1980–2014). It also displays a reduced error and better correlation for the Atlantic Water core temperature and depth in the Eurasian Arctic Ocean when compared to reanalysis and observations. Overall, the AMOC-SST index-based selection leads to a systematic improvement in the representation of the Atlantic Water layer in the Eurasian Arctic region, suggesting a clear connection between the Arctic Ocean and surface temperature in the subpolar region, and by extension, possibly the AMOC.
1 Introduction
There is an urgent need to reduce the uncertainty in predicted Arctic Ocean climate change: it is changing more rapidly than the rest of the globe due to the “Arctic amplification” phenomenon (Rantanen et al., 2022; Serreze and Barry, 2011), and these fast changes have global repercussions (Goosse et al., 2018; Pithan and Mauritsen, 2014). Over the past decades, both models and observations have shown a positive trend in the northward transport of ocean heat to the Arctic Ocean by Atlantic inflows, which has strongly affected the Arctic climate (Årthun et al., 2012; Barton et al., 2018; Wang et al., 2020; Tsubouchi et al., 2021; Polyakov et al., 2023; Hansen et al., 2023).
The primary water mass at the Arctic intermediate depth, the Atlantic Water (AW), plays a key role in the heat budget of the Arctic Ocean (Shu et al., 2019). Research indicates that one of the main reasons for increased heat transport to the Arctic Ocean is the warmer temperatures of the AW, which are transported northward mostly through the Barents Sea, but also through the Fram Strait (Koenigk and Brodeau, 2014; Oldenburg et al., 2018). In more detail (see Supplementary Figure S1), it originates in the North Atlantic, and warm and saline AW flows into the Nordic Seas (Orvik and Niiler, 2002), with a portion entering the Barents Sea before descending into the intermediate and deeper layers of the Arctic Ocean (Maslowski et al., 2004). The remaining AW approaches the Fram Strait, where it splits into two pathways: one portion enters the Arctic Ocean, contributing to the warm AW layer, while the other recirculates within the Fram Strait as part of the West Spitsbergen Current and eventually joins the southward-flowing East Greenland Current (Hattermann et al., 2016). A recent warming trend in the AW layer of the Arctic Ocean has been observed (Polyakov et al., 2012).
The climate models in the Coupled Model Intercomparison Project (CMIP) still underestimate ocean heat transport to the Arctic (Winkelbauer et al., 2024), which could lead to an underestimation of changes in the Arctic region. They struggle with the particular configuration of this area, which displays complex bathymetry (Heuzé et al., 2023) and dynamical processes that usually require higher resolution than that typically adopted by the latest CMIP (Wang et al., 2024). The models tend to represent the Atlantic Water (AW) layer as too thick and too deep, with a large spread of temperatures that are both too warm and too cold compared to observations (Heuzé et al., 2023; Khosravi et al., 2022).
The climate models also diverge in their projections of Arctic climate change (Muilwijk et al., 2023), particularly at intermediate depths (Langehaug et al., 2023). The projected weakening of the AMOC (IPCC, 2023; Weijer et al., 2020) is expected to affect exchanges with the Arctic; however, climate models demonstrate significant differences in the projections for that part of the AMOC involving exchanges with the Arctic through ocean heat transport (Sgubin et al., 2017; Madonna and Sandø, 2022). In particular, (Pan et al., 2023) showed that the discrepancies between the model projections are strongly related to the simulated poleward ocean heat transport (OHT) from the North Atlantic, which varies significantly depending on the ocean component used by the climate model. The large group of Nucleus for European Modelling of the Ocean (NEMO)-based climate models tends to project larger increases in OHT, thus simulating stronger and more rapid Arctic climate change compared to other climate models. In the most recent version of the CMIP project (CMIP6), OHT in the models showed less inter-model spread and mean values closer to observations compared to CMIP5 models (Madonna and Sandø, 2022).
Applying external constraints to the ensemble of simulations may help reduce uncertainties in future projections and model biases regarding OHT. Through CMIP6, an impressive number of coordinated and thus comparable simulations were performed across model systems. This allows us to explore statistical sampling methods using observed metrics to enhance the skill for Arctic prediction beyond the model mean. Moreover, model and model member (simulation) selection is increasingly explored in the context of data assimilation (Ruiz et al., 2022; Le Bras et al., 2024) or emergent constraints (Tokarska et al., 2020; Ribes et al., 2021; Docquier and Koenigk, 2021; Langehaug et al., 2023). Selecting individual simulations from a model using observations provides new insights (Bonnet et al., 2021) and should be considered for models exhibiting a large spread in their ensemble (Deser et al., 2020; Mankin et al., 2020; Meccia et al., 2023). We propose to constrain part of the CMIP6 ensemble of simulations by selecting specific model ensemble members to reduce uncertainty in the representation of the subsurface Arctic Ocean.
In the selection method, we investigated the connection between the subpolar North Atlantic Ocean and the Arctic Ocean. The gyre circulation in the northern North Atlantic and its associated heat transport are recognized as significant factors in the warming of the Arctic Ocean (e.g., Jungclaus et al., 2014; Oldenburg et al., 2018; van der Linden et al., 2019). On a decadal timescale, Fan et al. (2023) showed that the subpolar gyre (SPG) signal provides predictability for salinity and temperature in the Nordic Seas. It was also found in observations (Årthun et al., 2017) and pacemaker experiments using climate models (Drews et al., 2024) that surface temperature anomalies in the Northern Atlantic have predictive potential for the northern climate.
On a longer time scale, some links can be found between the changes in ocean heat transport toward the Arctic and the variability of the Atlantic Meridional Overturning Circulation (AMOC). A proposed signature of a weakened AMOC is the cooling of the sea surface temperature (SST) of the SPG, resulting from reduced heat transport to northern latitudes (Caesar et al., 2018; Gervais et al., 2018; Saba et al., 2016). Other studies suggest that the warming hole over the past century is unlikely to be due to a slowdown of the AMOC; rather, it is a consequence of enhanced northward heat transport out of the region (Keil et al., 2020; He et al., 2022), explained by a trend toward a more frequent positive phase of the North Atlantic Oscillation (Fan et al., 2023). Nevertheless, under strong global warming and a weakened AMOC, Oldenburg et al. (2018) found in CMIP5 models an increased Arctic OHT as strengthened gyre circulations advect warmed surface waters. Heat loss to the atmosphere is reduced, leaving more heat in the subpolar ocean that contributes to enhanced ocean heat transport to the Arctic Ocean (Nummelin et al., 2017). Finally, Weijer et al. (2022) provides some evidence that the AMOC may influence the Arctic heat budget through its impact on poleward heat transport, as climate models simulating future scenarios almost unanimously project a decrease in the strength of the AMOC and often an increase in OHT into the Arctic (Hwang et al., 2011). Furthermore, as heat loss from the North Atlantic declines, it can contribute to the weakening of the AMOC (Garuba and Klinger, 2016; Gregory et al., 2016; Couldrey et al., 2021). We explore these links between the AMOC and the Arctic Ocean in this study, using a reconstructed AMOC index based on the anomaly between the SST in the SPG and the global SST (Caesar et al., 2018). The selected members are evaluated for their ability to represent the Atlantic Water layer in the Eurasian Arctic region.
In Section 2, we describe our datasets, the selection method, and the evaluation tools for the selected subset in the Arctic. Section 3 presents the results obtained for the selected model ensemble members. Finally, a discussion and conclusion summarize the study and explore future perspectives.
2 Materials and methods
2.1 Data
2.1.1 CMIP6 models
We use historical simulations under transient forcing that are available for the period 1850–2014 on the CMIP6 ESGF nodes (Eyring et al., 2016). The selection of the members occurs over the period 1960–1990, with evaluation in the Arctic spanning the period 1980–2014.
We have included the models that displayed at least 20 members, resulting in a total of 235 members constituting the working database. The models are listed and described in Table 1.
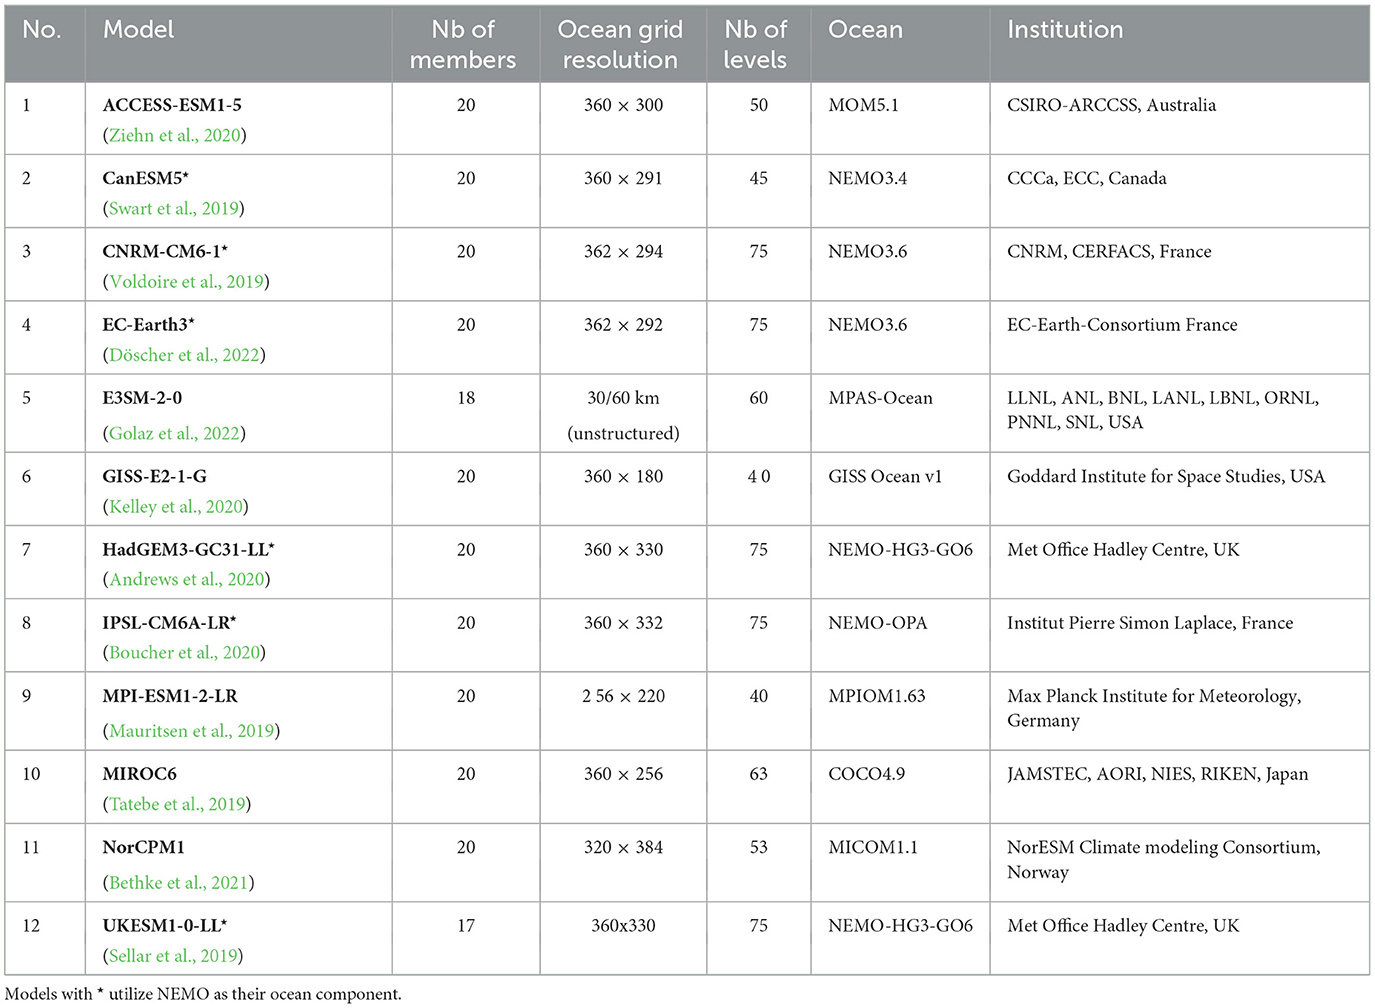
Table 1. Description of the CMIP6 models used in this study, including their respective research centers (institutions), the number of included ensemble members, and the names and resolutions of their ocean components.
2.1.2 Observations and reanalysis
2.1.2.1 HadISST
Sea Surface Temperature (SST) data are sourced from the HadISST (Hadley Centre Global Sea Ice and Sea Surface Temperature) dataset developed by Rayner et al. (2003). This dataset combines global monthly SST and sea ice concentration fields, covering the period from 1871 to the present. HadISST employs reduced space optimal interpolation for SST data collected from the Marine Data Bank (primarily ship routes) and ICOADS (International Comprehensive Ocean–Atmosphere Data Set) until 1981, followed by a blend of in-situ and adjusted satellite SSTs from 1982 onward.
2.1.2.2 EN4
EN4 (Good et al., 2013) is a global ocean subsurface temperature and salinity dataset covering the period from 1,900 to the present. It provides two main data products: (1) a database of quality-controlled in situ profiles, and (2) spatially complete analyses with a 1° × 1° horizontal resolution and 42 depth levels from 83°S to 90°N. The data sources include Argo (2,000), ASBO (Arctic Synoptic Basinwide Oceanography), GTSPP (Global Temperature and Salinity Profile Program), and WOD13 (World Ocean Database). The analyses encompass observation weights and standard error information. Due to sparse observations in certain regions, EN4 defaults to a 1970–2000 climatology. To align with the CMIP historical period delimitation, we will utilize the EN4 product from 1970 to 2014.
2.1.2.3 ORAS5
The Ocean Reanalysis System 5 (ORAS5) reanalysis dataset provides global ocean and sea-ice monthly mean data, prepared by the European Centre for the ECMWF OCEAN5 ocean analysis-reanalysis system (Copernicus, 2021). OCEAN5 (Zuo et al., 2019) utilizes the NEMO ocean model and assimilates subsurface temperature, salinity, sea-ice concentration, and sea-level anomalies. The consolidated product employs reanalysis atmospheric forcing (ERA-40 until 1978 and ERA-Interim from 1979) and reprocessed observations. The ORAS5 dataset is produced by ECMWF and funded by the Copernicus Climate Change Service. To align with the CMIP historical period delimitation, we will use ORAS5 reanalysis data covering 1979–2014.
2.2 Method
2.2.1 AWCT and AWCD definition
In this study, we define the Atlantic Water Core Temperature (AWCT) as the maximum temperature measured in the vertical direction between 200 and 900 meters (Shu et al., 2019) in the Arctic Ocean. The Atlantic Water Core Depth (AWCD) refers to the depth at which the AWCT is found. Both AWCT and AWCD are spatially averaged 2D variables evaluated along defined transects or regions.
2.2.2 Statistical tools
We use a set of statistical metrics to evaluate the skill of CMIP6 ensemble members in reproducing observed variability in the SPG and in representing Atlantic Water properties in the Arctic. Specifically, we calculate the Pearson Correlation Coefficient (PCC; Taylor, 2001) to assess the degree of linear agreement between the AMOC-SST index from model simulations and the observed index derived from HadISST over the selection period (1960–1990). This allows us to identify ensemble members that exhibit realistic temporal variability in upstream ocean conditions, which are relevant for anticipating changes in the Arctic Ocean.
To evaluate model performance in the Arctic region, we use the root mean square error (RMSE) and two of its variants: the Centered RMSE (CRMSE), which eliminates the mean to isolate differences in variability, and the Normalized RMSE (NRMSE), which scales the RMSE by the mean of the observed field for easier interpretation across variables. These metrics are applied to the AWCT and AWCD in the Eurasian Arctic Ocean over the evaluation period (1980–2014), using both ORAS5 reanalysis and EN4 observational products as references.
The combination of these metrics enables us to evaluate both temporal variability (via PCC) and absolute biases (via RMSE, CRMSE, and NRMSE), as well as to determine whether the selected model subset enhances the representation of Atlantic Water properties compared to the full ensemble. By defining pi as our predicted value at time i and oi as our observed value at time i, we have the following:
2.2.3 Member selection
We apply a constraint or selection to the 235 ensemble members from the 12 CMIP6 models detailed in Table 1. Our selection is based on an AMOC-SST index derived from SST observations (Caesar et al., 2018). This index is defined by calculating the anomaly (Figure 1, left) relative to the 1871-1900 difference between the global and SPG regions (Figure 1, right) November-May SST.
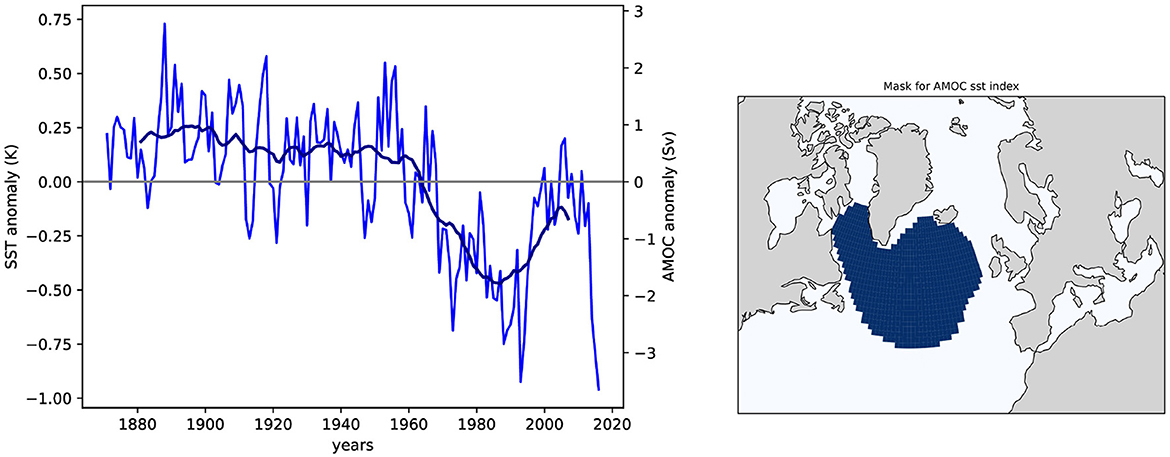
Figure 1. Description of the AMOC-SST index (annual values are in blue, while the 20-year running mean is in dark blue) as described in Caesar et al. (2018), using HadISST data. The anomaly plotted on the left is obtained by subtracting the November-May SST in the SPG (the blue zone in the right map) from the global November-May SST.
We select model members from the CMIP6 models described in Table 1 that display an AMOC-SST index with a Pearson correlation coefficient (PCC) greater than 0.5 (pval≪ 0.01) with the AMOC-SST index based on HadISST over the period from 1960 to 1990. In a tracer experiment (Wefing et al., 2021), it was found that it takes about 10 years for the Atlantic Water layer to reach the Nansen Basin (see their Figure 6) after entering the Arctic Ocean through three branches: the Norwegian Coastal Current (NCC), the Fram Strait Branch Water (FSBW), and the Barents Sea Branch Water (BSBW). Therefore, the evaluation of our selection is conducted at the end of the historical period (1980–2014) to allow for the water masses to travel and reach the Eurasian Arctic Ocean.
3 Results
To assess whether the selected ensemble members provide improved performance compared to the full ensemble, we evaluate the Atlantic Water Core Temperature (AWCT) and Core Depth (AWCD) across the Eurasian Arctic region using RMSE, NRMSE, and PCC. These metrics enable us to quantify both the magnitude of model biases and the extent to which model variability aligns with observations and reanalysis products. The results are summarized in Table 2, indicating that the selected ensemble exhibits reduced RMSE and enhanced correlation for both AWCT and AWCD, suggesting a more realistic representation of Atlantic Water properties.

Table 2. Evaluation of the AWCT (top) and AWCD (bottom) over the period 1980–2014.
3.1 AW layer in reanalysis, observation, and CMIP6 models
A warming trend is observed in the AW layer during the last few decades of the ORAS5 reanalysis (Figure 2). This finding aligns with previous studies (Richards et al., 2022; Wang et al., 2024) and emphasizes the importance of accurately representing these water masses entering the Arctic for future projections. The trend reaches 2°C in the Barents Sea and Fram Strait and is evident throughout the entire Arctic Ocean, with smaller values (< 0.5°C) along the Canadian Archipelago, except in front of the Bering Strait. The AW layer displays a cooling trend in the Canadian Basin, which may be linked to a strengthening of the Beaufort Gyre (Richards et al., 2022). However, uncertainty remains significant in ocean reanalyses for the Arctic Ocean: Rautiainen (2020) compared the temperature trends for the layer [300–700 m] in the Arctic across several reanalyses (including ORAS5) and identified some disagreements among the reanalysis products.
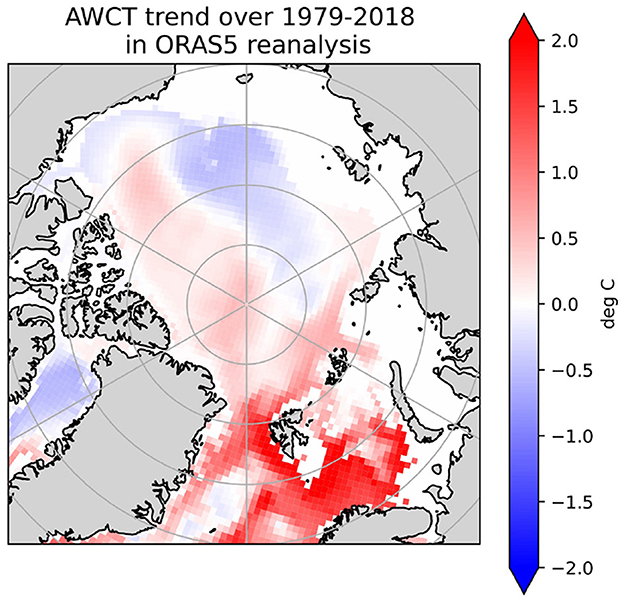
Figure 2. Trend of the AWCT in the ORAS5 reanalysis calculated from a least squares polynomial fit over the period of 1970–2018.
To assess the spread in CMIP6 models regarding the representation of the AW in the Arctic, we evaluate the AWCT and AWCD for 12 CMIP6 models (see Section 2.1) over different transects across the Arctic, following the ocean circulation of the deep waters. The top map in Figure 3a shows the AWCD averaged over 1979–2018 from the ORAS5 reanalysis. In this product, the depth of the AW layer core is about 200 meters in the Barents Sea and over the Fram Strait, reaching 500 meters in the Beaufort Sea. To capture AW flowing from the Eurasian Basin into the Amerasian Basin, the time series of the AWCT and AWCD (mean and standard deviation) averaged over the transect at the entrance of the Amundsen Basin, which is the deepest abyssal plain in the Arctic Ocean (red transect in Figure 3a), are computed and displayed in Figures 3b, c. Core depths in excess of 500 meters likely reflect limited model skill.
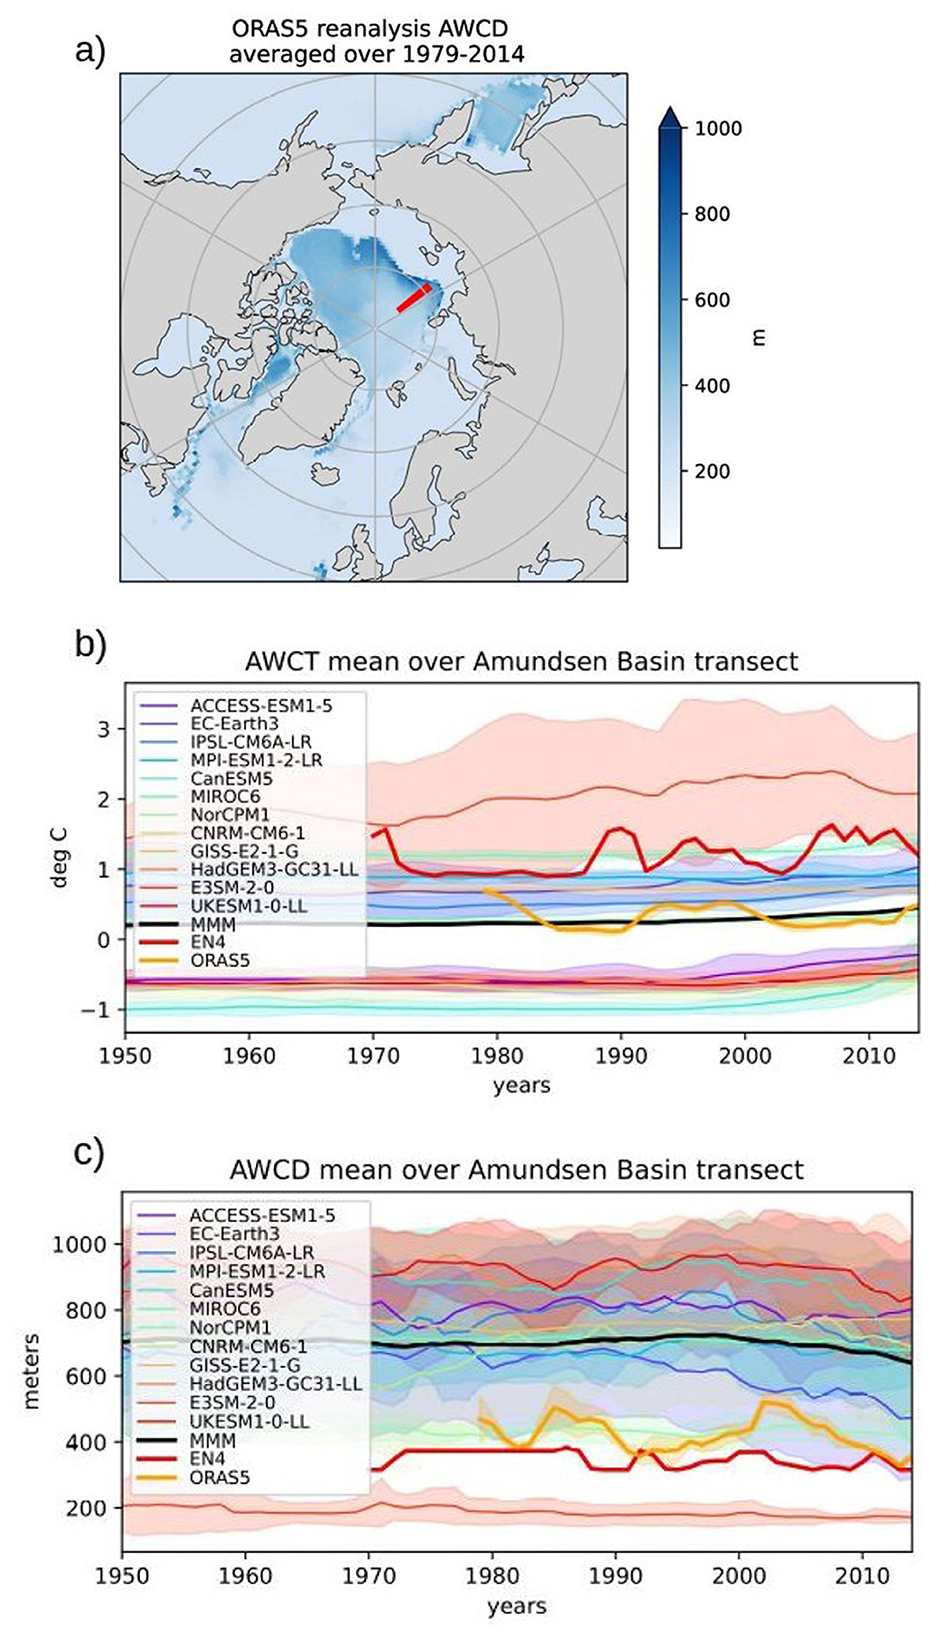
Figure 3. The top map (a) shows the mean of the AWCD for ORAS5 reanalysis from 1979 to 2014. The time series of the AWCT (b) and AWCD (c) are averaged over the transect in the Amundsen Basin, which is plotted in red in the top map. The thick lines represent the mean of the CMIP6 models, and the envelope shows the spread (one standard deviation) of the models. The thick black line represents the multi-model mean (MMM). The time series for the ORAS5 reanalysis (mean and standard deviation) are shown in orange, while the EN4 product is represented by the thick red line.
The time series in Figures 3b, c illustrate the spread of CMIP6 models (measured as one standard deviation from the ensemble mean) regarding the representation of the AW layer in the Arctic. The total ensemble spread, calculated as the standard deviation across all ensemble members, is 0.9°C for the AWCT and 246 meters for the AWCD. For the AWCT, the models with the maximum spread are E3SM-2-0 (0.9°C) and EC-Earth3 (0.36°C). The models with the minimum spread are GISS-E2-1-G (0.04°C) and NorCPM1 (0.05°C). The spread in AWCD ranges from 22 meters for the MIROC6 model to 231 meters for the CNRM-CM6-1 model.
To evaluate the CMIP6 ensemble mean bias, we estimate the AWCT and AWCD averaged over 1979–2014 for the ORAS5 reanalysis and 1970–2014 for the EN4 product (see Data section). The results are very different for the AWCT: ORAS5 has an average AWCT of 0.29°C, while the EN4 AWCT is 1.18°C. This difference of almost one degree could be explained by the fact that observations are hard to obtain in this remote region with extreme conditions. The sparsity of hydrographic profile measurements increases the uncertainties of the ocean subsurface data (Uotila et al., 2019; Zuo et al., 2019). The reanalysis and the observations agree more on the depth of the AWCT: ORAS5 has an average AWCD of 380 meters, while the EN4 average is 347 meters. From specific studies (Richards et al., 2022, their Figure 2) focusing on the AW, it seems EN4 is closer to other observational products than ORAS5 when looking at the area close to the transect in the Amundsen Basin.
The multi-model mean (MMM) AWCT has a cold bias, as it is 0.26°C over 1950-2014, and half of the models have an AWCT lower than 0°C (ACCESS-ESM1-5, CanESM5, CNRM-CM6-1, HadGEM3-GC31-LL, UKESM1-0-LL). The MMM AWCD over 1950–2014 is 700 meters, and almost every model shows a deeper AWCT except for E3SM-2-0 (205 meters), which displays a very different vertical water mass structure compared to the other CMIP6 models (see Supplementary Figure S10), and NorCPM1 (440 meters), which has the least biased AWCD.
AWCT and AWCD time series are provided for other regions (Barents Sea Opening or BSO, Fram Strait, and Makarov Basin) as Supplementary Figures S2–S4. A positive trend is evident at the end of the historical period in the AWCT over the BSO in the multi-model ensemble mean, as well as in EN4 and ORAS5. An assessment of AWCT and AWCD model means, reanalyses, and observations for different transects over the Arctic during the 1950–1980 period is provided in Supplementary Figures S5, S6. ES3M-2-0 demonstrates the most biased mean state among the various transects considered.
3.2 The model member selection
The selection method is applied to the ensemble members over the 1960-1990 period (see Section 2.2), resulting in the selection of 19 members out of 235. A Taylor diagram in Figure 4 illustrates the distribution of the members in terms of the correlation coefficient and centered RMSE (see Section 2.2). We note that the selected members, based on our correlation criteria (coarse crosses), exhibit a wide range of centered RMSE (measured by the distance to the black star). This highlights the challenge of choosing between improving correlation and reducing bias when selecting the members. The relatively small fraction of members selected (8%) suggests that this method could be tested on a larger dataset to identify more members that are well correlated with the AMOC-SST index.
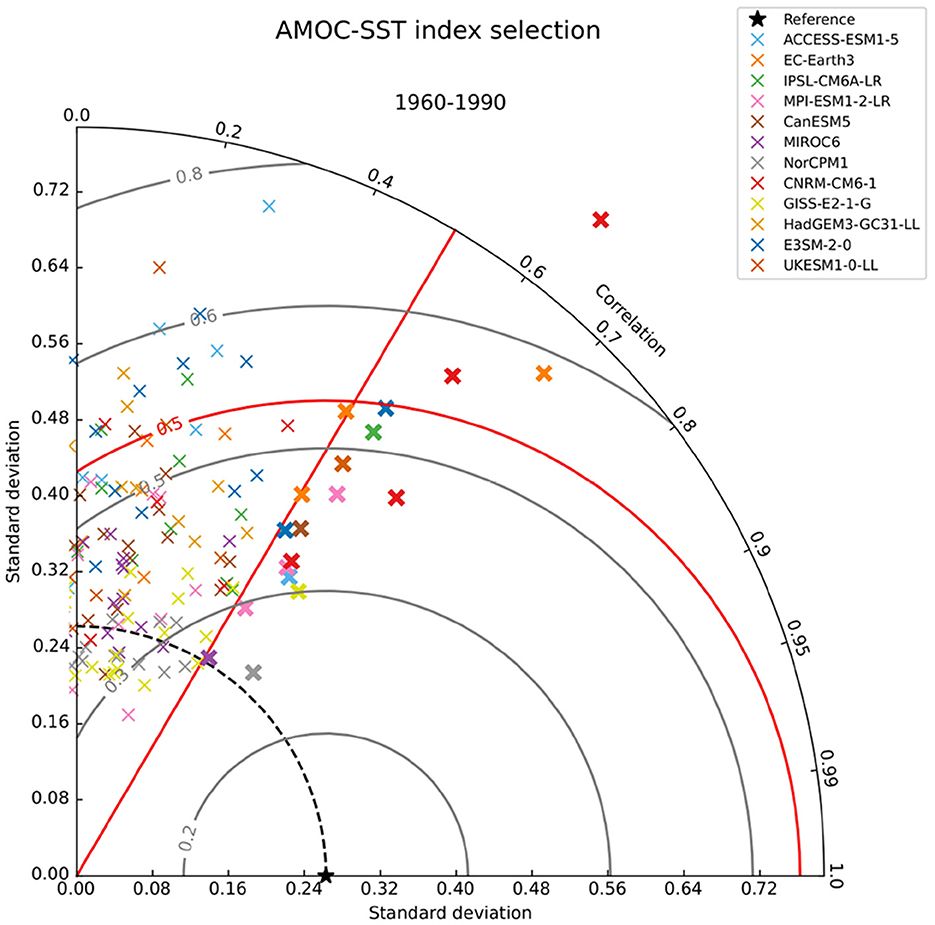
Figure 4. Taylor diagram showing the relative relationships of the climate model members based on correlations (the red segment represents the 0.5 value), standard deviations, and centered RMSE (the half circle, red for the 0.5 value). Crosses represent the CMIP6 model ensemble members. Bold crosses denote the selected members, i.e., the members with PCC > 0.5 (pval ≪0.01) with respect to the reference: the HadISST AMOC-SST index over 1960–1990.
To illustrate the sensitivity to the window period used for selection, Supplementary Figure S7 shows other periods for comparison. The number of members selected varies around 10% of the total number of members for the different time windows.
The time series of the AMOC-SST index for the ensemble mean, the selection ensemble mean, and the observations (HadISST) are presented in Figure 5. The selection ensemble mean shows a stronger correlation (PCC = 0.32) with the HadISST AMOC-SST index than the ensemble mean (PCC = 0.12) during 1980–2014 (following the selection period of 1960–1990). This persistence indicates that the selected model members may exhibit variability more akin to the observations of surface temperature in the SPG region for several decades after selection is complete. The method exhibits minimal sensitivity to the time window: when the selection is conducted over 1950–1990, the correlation for the 1980–2014 period increases from 0.12 (all members) to 0.50 (selected members) (see Supplementary Figure S8).
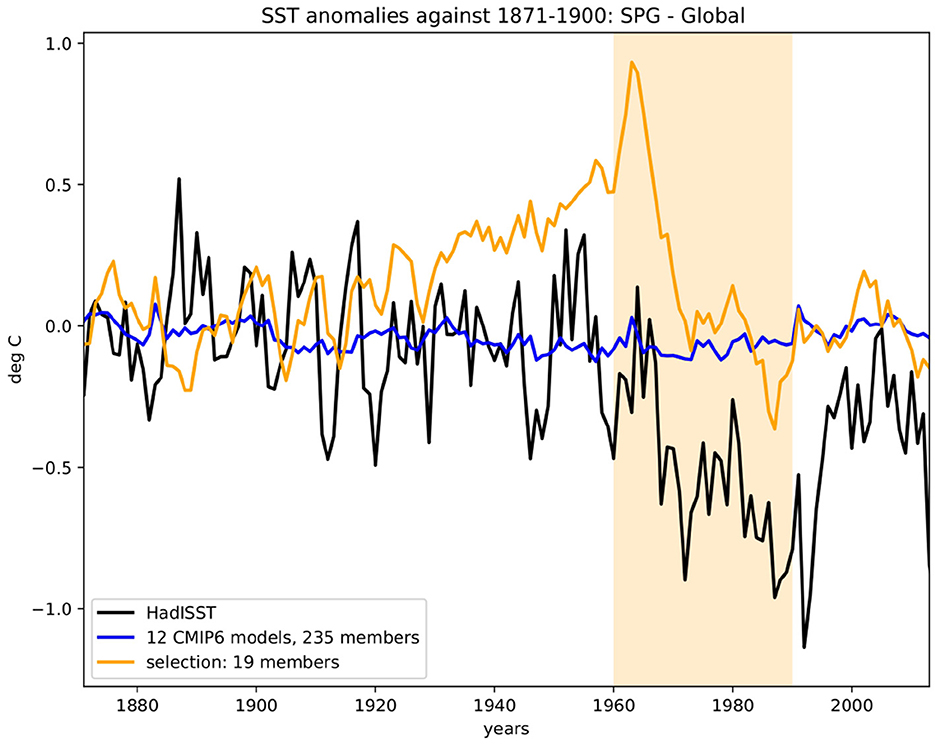
Figure 5. AMOC-SST index for the multi-model ensemble mean (blue), the observations (HadISST, black), and the ensemble mean of the selection (orange). The orange window highlights the period used for selection (1960–1990).
3.3 Evaluation of the members selected
The upstream impact of our approach is tested with a focus on the representation of the AW properties at the entrance of the Eurasian Arctic Ocean (Figure 6) over the end of the historical period [1980–2014]. Figure 6 displays a 2D map of the AWCT from the reanalysis ORAS5 for the period 1979–2018 (the entire available period), indicating a cooling of the water from the Eurasian to the Canadian Basin. An equivalent figure using the EN4 product is available in the Supplementary Figure S9.
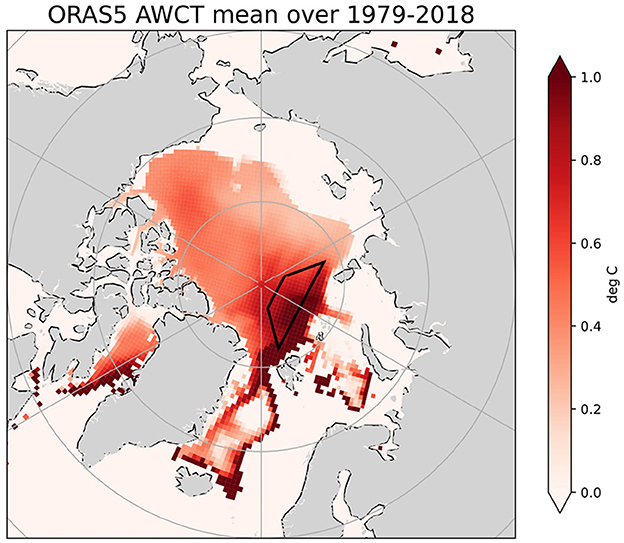
Figure 6. Averaged AWCT of the ORAS5 reanalysis over 1979 to 2018. The black trapezoid highlights the area used to assess the ensemble selection method.
The mean bias and correlation of AWCT and AWCD with respect to reanalysis (ORAS5) and observations (EN4) are calculated over the Eurasian Arctic region, as shown in Figure 6 and displayed in Table 2. The NRMSE is applied to AWCD to normalize the RMSE between 0 and 1, enhancing its readability.
Regarding the AWCT (Table 2, top), the selection ensemble mean exhibits a stronger correlation with the reanalysis ORAS5 and the EN4 observation over the Eurasian Arctic than the total ensemble. The RMSE decreases when estimated against ORAS5 and EN4 for the selection ensemble mean compared to the total ensemble mean. For the AWCD (Table 2, bottom), both correlation and error also improve when the selection ensemble mean is compared to ORAS5 and EN4.
Equivalent results are presented in the Supplementary material for another selection period (1950–1990; see Supplementary Table S1) to illustrate the sensitivity of the findings. Several other periods were tested (not shown), resulting in a systematic reduction of the RMSE and an increase in correlation with respect to reanalysis and observation for both AWCT and AWCD. However, for some selection periods, including 1950–1990, the AWCT RMSE with respect to ORAS5 was higher for the selected members. In those cases, the AW layer from the selection remains shallower (AWCD is less biased) but shows a colder AWCT than the total (original) ensemble mean (see Supplementary Figure S10).
Time series for the individual CMIP6 ensemble members are shown in Figure 7 for the AWCT (Figure 7a) and the AWCD (Figure 7b), along with the reanalysis and observations, averaged over the black trapezoid in Figure 6, which primarily corresponds to the Amundsen and Nansen Basins.
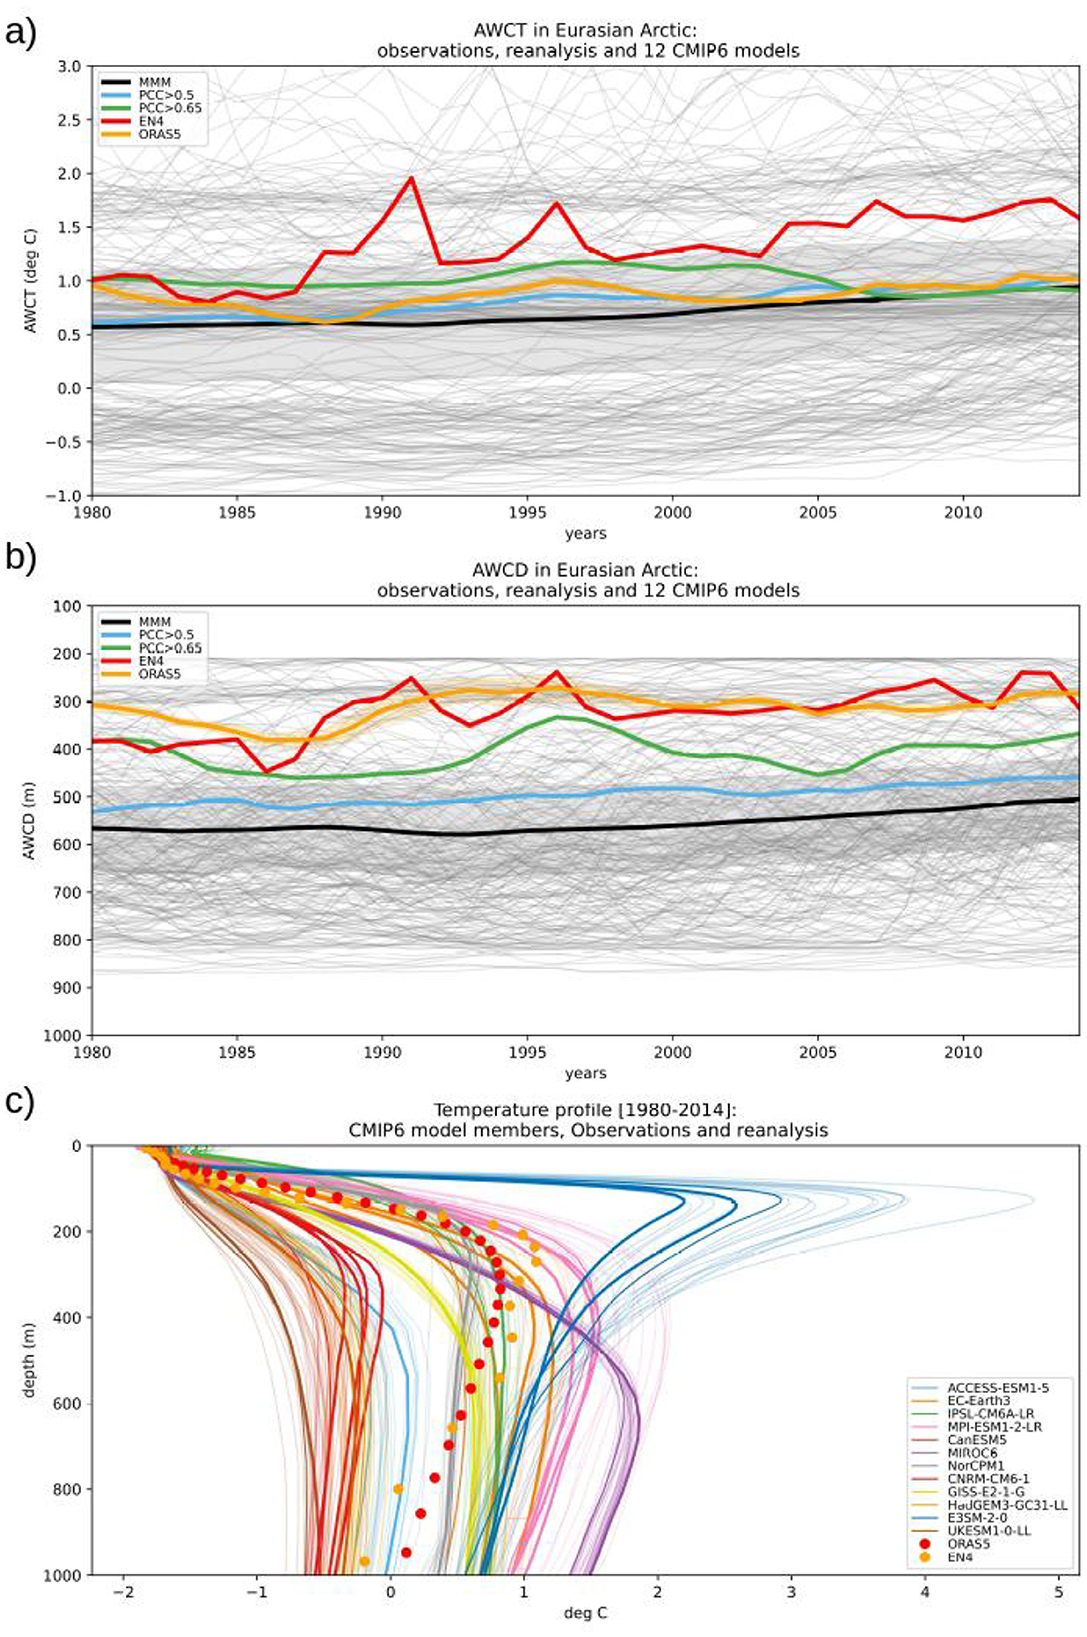
Figure 7. Time series for the AWCT (a) and AWCD (b) averaged across the region depicted in Figure 6 for the multi-model ensemble (members in gray, mean in black as MMM) and the selection ensemble mean (blue for PCC > 0.5, green for PCC > 0.65; selection period is 1960–1990), ORAS5 reanalysis (red), and observations (orange). (c) Shows the temperature profiles averaged from 1980–2014 for the ensemble members, with selected members represented by thicker lines.
The ensemble mean of the members with a significant correlation of 0.5 or higher (blue line) exhibits a warmer AWCT, aligning better with ORAS5 and EN4. Selecting the members with a correlation coefficient of 0.65 or higher (green line) positions the selection ensemble between the EN4 and ORAS5 estimates, complicating the assessment of whether the sub-selection is more or less biased. Some studies suggest that EN4 may provide a more realistic representation, whereas ORAS5 might be too cold for the AWCT (Uotila et al., 2019; Richards et al., 2022), indicating that our selection represents an improvement. After 2007, the AWCT for ORAS5, the ensemble mean, and both selection ensemble means become nearly indistinguishable.
Regarding the AWCD, the selection shows improved performance for the AWCD throughout the entire period compared to both observations and reanalysis, particularly in the decades following the selection. Increasing the threshold for the selection from 0.5 to 0.65 for the correlation coefficient minimizes the bias of the selected ensemble. Variability is also better captured, and evaluation becomes easier as observations and reanalysis are much closer in this region for estimating the AWCD.
The temperature profile from 1980 to 2014 of the ensemble members is compared to ORAS5 and EN4 for the same region (Figure 7c). Most members exhibit a core temperature that is too deep below 200 meters, a well-known bias in CMIP models (Langehaug et al., 2023; Shu et al., 2019, and see Section 1). The MIROC6 model shows warmer temperatures than observations below 300 meters, with a difference of up to 1.5°C at a depth of 1000 meters. E3SM-2-0 displays a different structure, possibly due to the unstructured grid mesh used in the ocean for this model.
4 Discussion
We have applied a selection method based on an AMOC-SST index to 235 historical simulations from 12 CMIP6 models. The selection of members aligns more closely with the observed index than the total ensemble mean in the SPG over the next 25 years after the selection period, indicating that we successfully constrained the internal variability of the model ensemble members. Additionally, the selection exhibits reduced error and better correlation for both AWCT and AWCD in the Eurasian Arctic compared to reanalysis and observations during the latter period.
While CMIP6 models are known to underestimate ocean heat transport into the Arctic, our selection method does not directly address this bias. However, the improved representation of Atlantic Water properties (AWCT and AWCD) in the selected ensemble suggests that the method goes beyond simply matching historical trends in the SPG.
The selection based on the AMOC-SST index results in consistent improvements in both the mean state and variability in downstream Arctic regions over an independent evaluation period. This indicates that the chosen members likely capture more realistic large-scale drivers of Arctic Atlantification, rather than coincidentally aligning with observed past variability. This is consistent with the understanding that the AMOC plays a central role in driving multidecadal variability in the North Atlantic, including SST and salinity patterns that influence Arctic Ocean properties (Zhang et al., 2019).
We have shown that the Atlantic Water layer in the selected ensemble consistently remains shallower and, therefore, more realistic across various selection periods. However, increasing the constraint—by selecting members with a PCC greater than 0.65 instead of 0.5—leads to a significant reduction in the number of selected members. Most members in the total ensemble exhibit a low PCC (< 0.5) with the AMOC-SST index, indicating that this method would benefit from testing with a larger ensemble size to enhance its robustness.
The correlation threshold (PCC > 0.5, p ≪ 0.01) used for ensemble member selection was chosen to ensure a statistically meaningful relationship with the observed AMOC-SST index while preserving enough members for further evaluation. Although this value is somewhat arbitrary, it reflects a moderate level of correlation that is commonly accepted in climate model evaluation. To test the sensitivity of the results, we explored alternative thresholds (e.g., PCC > 0.65), which led to fewer selected members but showed similar improvements in downstream variables (see Figure 7 and Supplementary Figure S10). In future studies, this selection approach could be expanded to include additional metrics' such as RMSE or trend agreement in key Arctic variables' to develop a more comprehensive and physically grounded ensemble selection.
One limitation of the current approach is the relatively small number of ensemble members retained after selection: only 19 out of 235 ( 8%). This strict filtering was required to ensure statistical significance (PCC > 0.5, p ≪ 0.01) and relevance to observed AMOC-SST variability. However, it does reduce the robustness of the selected ensemble and raises the possibility of overfitting to historical trends. This could limit the generalizability of the results, especially for future projections beyond the training window.
While the selected members consistently show improved performance in downstream variables (AWCT and AWCD), we consider this study a first step toward a scalable method. Future research should focus on expanding the ensemble size, applying multi-metric selection, or adopting ensemble weighting schemes. These approaches could maintain greater diversity within the ensemble while leveraging observed constraints to improve model skills in the Arctic.
An important consideration in this study is the use of two different reference datasets' ORAS5 reanalysis and the EN4 observational product, for evaluating Atlantic Water properties. Unlike purely observational datasets such as EN4, which exhibit low bias in the mean state, ORAS5 uses an ensemble-based data assimilation approach, ensuring physical consistency in ocean circulation and stratification (Carton et al., 2019). These datasets produce notable differences in the Atlantic Water Core Temperature (AWCT) in the Arctic. This highlights the inherent uncertainty in Arctic subsurface observations and reanalysis products, driven by limited in situ measurements and the application of extrapolation techniques in regions with insufficient data coverage. While these uncertainties complicate direct model evaluation, our selection method demonstrates consistent improvement in representing Atlantic Water Core Depth (AWCD) and, in most cases, AWCT relative to both ORAS5 and EN4. The agreement across multiple reference datasets suggests that the benefits of the selection are robust to the choice of validation product. Nonetheless, we acknowledge that observational uncertainty remains a key limitation in constraining model skill in the Arctic and should be accounted for in future multi-dataset evaluations.
The selection method in this study relies on the AMOC-SST index, which is derived from SPG SST anomalies and has been proposed as an observational proxy for AMOC variability (Caesar et al., 2018). This approach is motivated by evidence that SPG surface temperature variability is associated with broader Atlantic circulation changes that influence heat transport into the Arctic (e.g., Fan et al., 2023; Drews et al., 2024). However, we acknowledge that this index alone does not fully capture the complexity of the mechanisms involved in Arctic Atlantification. Processes such as salinity-driven stratification, vertical mixing, and gyre dynamics are also key contributors to Atlantic water transport.
The AMOC-SST index serves as a statistical constraint, reflecting upstream variability patterns linked to Arctic subsurface changes. Although our results suggest this approach improves agreement with observations for AW core temperature and depth, we acknowledge that future ensemble selection efforts could benefit from integrating multiple physical metrics' such as OHT estimates, salinity structure, or circulation strength—to create a more mechanistic and comprehensive framework.
Although this study focuses on the connection between multidecadal variability of SPG surface temperature and Arctic Atlantification, we acknowledge that multiple mechanisms contribute to the observed Arctic warming. For instance, the North Atlantic Oscillation (NAO) influences both oceanic and atmospheric circulation patterns, modulating heat and freshwater transport into the Arctic. Sea ice loss itself acts as both a symptom and an amplifier of warming through ice albedo feedback and changes in vertical heat fluxes. In addition, atmospheric heat transport and changes in wind-driven ocean circulation have been shown to play key roles in shaping Arctic temperature trends and variability.
The AMOC-SST index used here captures part of the decadal-scale oceanic variability linked to AMOC, but it does not encompass all relevant feedbacks or processes. Our results should therefore be interpreted as highlighting one influential pathway, rather than a comprehensive causal mechanism. Future ensemble selection frameworks could benefit from incorporating multiple observational constraints—including sea ice metrics, surface heat fluxes, and freshwater content—to better represent the interconnected drivers of Arctic change.
5 Conclusion
In conclusion, our study using CMIP6 climate models suggests that the link between the surface SPG and the Arctic region, specifically the Arctic-Atlantic connectivity, is of utmost importance for improving the representation of the Atlantic layer of the Arctic Ocean. While our findings provide a foundation for further investigation, the complex nature of these interactions highlights the need for additional research to clarify the extent and mechanisms of this relationship. Continued exploration in this area will be essential for enhancing our understanding of the Atlantic Water layer and its broader implications.
The next step in this study involves increasing the number of CMIP6 historical simulations to provide predictions with enhanced skill for the Arctic region based on the ensemble screening approach, as well as improving the robustness of the method for additional models. For evaluating the method, the selection process could also be examined in more regions along the Arctic circulation pathways. More complex selection methods might be explored, such as employing a weighted ensemble mean that incorporates weights based on trends and mean states of the AMOC-SST index, along with AWCT and AWCD in the Fram Strait and at the Barents Sea Opening. Additionally, incorporating more in-situ observations from the Arctic Data Centre (https://arcticdata.io/catalog/) could enhance the evaluation, tailored to the specific regions being studied.
Beyond ensemble selection, improving the representation of Atlantic Water in the Arctic also requires advancements in model physics. Current CMIP6 models often lack the spatial resolution necessary to capture key ocean processes, such as narrow boundary currents, mesoscale eddies, and interactions with the complex Arctic bathymetry. These limitations contribute to biases in the depth, temperature, and transport of Atlantic Water. Higher-resolution ocean components, enhanced vertical mixing schemes, and improved treatment of overflow processes at critical gateways (e.g., Fram Strait, Barents Sea Opening) are essential steps forward.
In addition, better coupling between ocean, sea ice, and atmospheric processes—particularly in the North Atlantic and Nordic Seas—would help models simulate more realistic pathways and feedbacks. We recommend that future CMIP phases continue developing eddy-permitting models and explore hybrid approaches that combine dynamical refinement with data-driven constraints. Together, these efforts could enhance both the fidelity of model outputs and the utility of ensemble screening methods such as the one presented here.
Data availability statement
Data from the current generation of global climate model simulations is available through the most recent Coupled Model Intercomparison Project Phase 6 (CMIP6) and can be accessed from Earth System Grid Federation (https://esgf-node.llnl.gov/search/cmip6/). The original contributions presented in the study are included in the article/Supplementary material, further inquiries can be directed to the corresponding author.
Author contributions
MD: Conceptualization, Formal analysis, Investigation, Methodology, Supervision, Validation, Visualization, Writing – original draft, Writing – review & editing. SO: Supervision, Validation, Writing – review & editing. HL: Supervision, Validation, Writing – review & editing. CG: Supervision, Validation, Writing – review & editing. RM: Supervision, Writing – review & editing. TT: Supervision, Validation, Writing – review & editing. SY: Writing – review & editing.
Funding
The author(s) declare that financial support was received for the research and/or publication of this article. This study was supported by the project ObsSea4Clim: “Ocean observations and indicators for climate and assessments,” that was funded by the European Union. Grant Agreement Number: 101136548. doi: 10.3030/101136548. Contribution nr. 10. Helene R. Langehaug acknowledges support from the project ArMOC (Overturning circulation in the new Arctic) with grant number 335255, funded by the Research Council of Norway. This work was also partly funded by the National Centre for Climate Research 2024 and 2025.
Conflict of interest
The authors declare that the research was conducted in the absence of any commercial or financial relationships that could be construed as a potential conflict of interest.
Generative AI statement
The author(s) declare that no Gen AI was used in the creation of this manuscript.
Publisher's note
All claims expressed in this article are solely those of the authors and do not necessarily represent those of their affiliated organizations, or those of the publisher, the editors and the reviewers. Any product that may be evaluated in this article, or claim that may be made by its manufacturer, is not guaranteed or endorsed by the publisher.
Supplementary material
The Supplementary Material for this article can be found online at: https://www.frontiersin.org/articles/10.3389/fclim.2025.1550772/full#supplementary-material
References
Andrews, M. B., Ridley, J. K., Wood, R. A., Andrews, T., Blockley, E. W., Booth, B., et al. (2020). Historical simulations with HadGEM3-GC3.1 for CMIP6. J. Adv. Model. Earth Syst. 12:e2019MS001995. doi: 10.1029/2019MS001995
Årthun, M., Eldevik, T., Smedsrud, L. H., Skagseth, Ø., and Ingvaldsen, R. B. (2012). Quantifying the influence of Atlantic heat on Barents sea ice variability and retreat. J. Clim. 25, 4736–4743. doi: 10.1175/JCLI-D-11-00466.1
Årthun, M., Eldevik, T., Viste, E., Drange, H., Furevik, T., Johnson, H. L., et al. (2017). Skillful prediction of northern climate provided by the ocean. Nat. Commun. 8:15875. doi: 10.1038/ncomms15875
Barton, B. I., Lenn, Y.-D., and Lique, C. (2018). Observed Atlantification of the Barents sea causes the polar front to limit the expansion of winter sea ice. J. Phys. Oceanogr. 48, 1849–1866. doi: 10.1175/JPO-D-18-0003.1
Bethke, I., Wang, Y., Counillon, F., Keenlyside, N., Kimmritz, M., Fransner, F., et al. (2021). NorCPM1 and its contribution to CMIP6 DCPP. Geosci. Model Dev. 14, 7073–7116. doi: 10.5194/gmd-14-7073-2021
Bonnet, R., Swingedouw, D., Gastineau, G., Boucher, O., Deshayes, J., Hourdin, F., et al. (2021). Increased risk of near term global warming due to a recent AMOC weakening. Nat. Commun. 12:6108. doi: 10.1038/s41467-021-26370-0
Boucher, O., Servonnat, J., Albright, A. L., Aumont, O., Balkanski, Y., Bastrikov, V., et al. (2020). Presentation and evaluation of the IPSL-CM6A-LR climate model. J. Adv. Modeling Earth Syst. 12:e2019MS002010. doi: 10.1029/2019MS002010
Caesar, L., Rahmstorf, S., Robinson, A., Feulner, G., and Saba, V. (2018). Observed fingerprint of a weakening Atlantic Ocean overturning circulation. Nature 556, 191–196. doi: 10.1038/s41586-018-0006-5
Carton, J. A., Penny, S. G., and Kalnay, E. (2019). Temperature and salinity variability in the soda3, ecco4r3, and oras5 ocean reanalyses, 1993–2015. J. Clim. 32, 2277–2293. doi: 10.1175/JCLI-D-18-0605.1
Copernicus (2021). “ORAS5 global ocean reanalysis monthly data from 1958 to present,” in Copernicus Climate Change Service (C3S) Climate Data Store (CDS), 10.
Couldrey, M. P., Gregory, J. M., Boeira Dias, F., Dobrohotoff, P., Domingues, C. M., Garuba, O., et al. (2021). What causes the spread of model projections of ocean dynamic sea-level change in response to greenhouse gas forcing? Clim. Dyn. 56, 155–187. doi: 10.1007/s00382-020-05471-4
Deser, C., Lehner, F., Rodgers, K. B., Ault, T., Delworth, T. L., DiNezio, P. N., et al. (2020). Insights from Earth system model initial-condition large ensembles and future prospects. Nat. Clim. Chang. 10, 277–286. doi: 10.1038/s41558-020-0731-2
Docquier, D., and Koenigk, T. (2021). Observation-based selection of climate models projects Arctic ice-free summers around 2035. Commun. Earth Environ. 2:144. doi: 10.1038/s43247-021-00214-7
Döscher, R., Acosta, M., Alessandri, A., Anthoni, P., Arsouze, T., Bergman, T., et al. (2022). The EC-earth3 earth system model for the coupled model intercomparison project 6. Geosci. Model Dev. 15, 2973–3020. doi: 10.5194/gmd-15-2973-2022
Drews, A., Schmith, T., Tian, T., Wang, Y., Devilliers, M., Keenlyside, N. S., et al. (2024). The crucial role of the subpolar North Atlantic for skillful decadal climate predictions. Geophys. Res. Lett. 51:e2024GL109415. doi: 10.1029/2024GL109415
Eyring, V., Bony, S., Meehl, G. A., Senior, C. A., Stevens, B., Stouffer, R. J., et al. (2016). Overview of the coupled model intercomparison project phase 6 (cmip6) experimental design and organization. Geosci. Model Dev. 9, 1937–1958. doi: 10.5194/gmd-9-1937-2016
Fan, H., Borchert, L. F., Brune, S., Koul, V., and Baehr, J. (2023). North Atlantic subpolar gyre provides downstream ocean predictability. NPJ Clim. Atmosph. Sci. 6:145. doi: 10.1038/s41612-023-00469-1
Garuba, O. A., and Klinger, B. A. (2016). Ocean Heat Uptake and Interbasin Transport of the Passive and Redistributive Components of Surface Heating. J. Clim. 29, 7507–7527. doi: 10.1175/JCLI-D-16-0138.1
Gervais, M., Shaman, J., and Kushnir, Y. (2018). Mechanisms governing the development of the north Atlantic warming hole in the CESM-LE future climate simulations. J. Clim. 31, 5927–5946. doi: 10.1175/JCLI-D-17-0635.1
Golaz, J.-C., Van Roekel, L. P., Zheng, X., Roberts, A. F., Wolfe, J. D., Lin, W., et al. (2022). The DOE E3SM model version 2: overview of the physical model and initial model evaluation. J. Adv. Model. Earth Syst. 14:e2022MS003156. doi: 10.1029/2022MS003156
Good, S. A., Martin, M. J., and Rayner, N. A. (2013). EN4: Quality controlled ocean temperature and salinity profiles and monthly objective analyses with uncertainty estimates. J. Geophys. Res. 118, 6704–6716. doi: 10.1002/2013JC009067
Goosse, H., Kay, J. E., Armour, K. C., Bodas-Salcedo, A., Chepfer, H., Docquier, D., et al. (2018). Quantifying climate feedbacks in polar regions. Nat. Commun. 9:1919. doi: 10.1038/s41467-018-04173-0
Gregory, J. M., Bouttes-Mauhourat, N., Griffies, S. M., Haak, H., Hurlin, W. J., Jungclaus, J., et al. (2016). The Flux-Anomaly-Forced Model Intercomparison Project (FAFMIP) contribution to CMIP6: investigation of sea-level and ocean climate change in response to CO2 forcing. Geosci. Model Dev. 9, 3993–4017. doi: 10.5194/gmd-9-3993-2016
Hansen, B., Larsen, K. M. H., Hátún, H., Olsen, S. M., Gierisch, A. M. U., Østerhus, S., et al. (2023). The Iceland-Faroe warm-water flow towards the arctic estimated from satellite altimetry and in situ observations. EGUsphere 2023, 1–42. doi: 10.5194/os-19-1225-2023
Hattermann, T., Isachsen, P. E., von Appen, W.-J., Albretsen, J., and Sundfjord, A. (2016). Eddy-driven recirculation of Atlantic water in Fram strait. Geophys. Res. Lett. 43, 3406–3414. doi: 10.1002/2016GL068323
He, C., Clement, A. C., Cane, M. A., Murphy, L. N., Klavans, J. M., and Fenske, T. M. (2022). A north Atlantic warming hole without ocean circulation. Geophys. Res. Lett. 49:e2022GL100420. doi: 10.1029/2022GL100420
Heuzé, C., Zanowski, H., Karam, S., and Muilwijk, M. (2023). The deep Arctic Ocean and fram strait in CMIP6 models. J. Clim. 36, 2551–2584. doi: 10.1175/JCLI-D-22-0194.1
Hwang, Y.-T., Frierson, D. M. W., and Kay, J. E. (2011). Coupling between Arctic feedbacks and changes in poleward energy transport. Geophys. Res. Lett. 38:4856. doi: 10.1029/2011GL048546
IPCC (2023). Ocean, Cryosphere and Sea Level Change. Cambridge: Cambridge University Press, 1211–1362. doi: 10.1017/9781009157896.011
Jungclaus, J. H., Lohmann, K., and Zanchettin, D. (2014). Enhanced 20th-century heat transfer to the Arctic simulated in the context of climate variations over the last millennium. Clim. Past 10, 2201–2213. doi: 10.5194/cp-10-2201-2014
Keil, P., Mauritsen, T., Jungclaus, J., Hedemann, C., Olonscheck, D., and Ghosh, R. (2020). Multiple drivers of the north Atlantic warming hole. Nat. Clim. Chang. 10, 667–671. doi: 10.1038/s41558-020-0819-8
Kelley, M., Schmidt, G. A., Nazarenko, L. S., Bauer, S. E., Ruedy, R., Russell, G. L., et al. (2020). GISS-E2.1: configurations and climatology. J. Adv. Model. Earth Syst. 12:e2019MS002025. doi: 10.1029/2019MS002025
Khosravi, N., Wang, Q., Koldunov, N., Hinrichs, C., Semmler, T., Danilov, S., et al. (2022). The Arctic Ocean in CMIP6 models: biases and projected changes in temperature and salinity. Earth's Fut. 10:e2021EF002282. doi: 10.1029/2021EF002282
Koenigk, T., and Brodeau, L. (2014). Ocean heat transport into the Arctic in the twentieth and twenty-first Century in EC-Earth. Clim. Dyn. 42, 3101–3120. doi: 10.1007/s00382-013-1821-x
Langehaug, H. R., Sagen, H., Stallemo, A., Uotila, P., Rautiainen, L., Olsen, S. M., et al. (2023). Constraining cmip6 estimates of arctic ocean temperature and salinity in 2025–2055. Front. Mar. Sci. 10:1211562. doi: 10.3389/fmars.2023.1211562
Le Bras, P., Sévellec, F., Tandeo, P., Ruiz, J., and Ailliot, P. (2024). Selecting and weighting dynamical models using data-driven approaches. Nonlinear Process. Geophys. 31, 303–317. doi: 10.5194/npg-31-303-2024
Madonna, E., and Sandø, A. B. (2022). Understanding differences in north Atlantic poleward ocean heat transport and its variability in global climate models. Geophys. Res. Lett. 49:e2021GL096683. doi: 10.1029/2021GL096683
Mankin, J. S., Lehner, F., Coats, S., and McKinnon, K. A. (2020). The value of initial condition large ensembles to robust adaptation decision-making. Earth's Fut. 8:e2012EF001610. doi: 10.1029/2020EF001610
Maslowski, W., Marble, D., Walczowski, W., Schauer, U., Clement, J. L., and Semtner, A. J. (2004). On climatological mass, heat, and salt transports through the Barents Sea and Fram Strait from a pan-Arctic coupled ice-ocean. J. Geophys. Res. 109:1039. doi: 10.1029/2001JC001039
Mauritsen, T., Bader, J., Becker, T., Behrens, J., Bittner, M., Brokopf, R., et al. (2019). Developments in the MPI-M earth system model version 1.2 (MPI-ESM1.2) and its response to increasing CO2. J. Adv. Modeling Earth Syst. 11, 998–1038. doi: 10.1029/2018MS001400
Meccia, V. L., Fuentes-Franco, R., Davini, P., Bellomo, K., Fabiano, F., Yang, S., et al. (2023). Internal multi-centennial variability of the Atlantic meridional overturning circulation simulated by EC-Earth3. Clim. Dyn. 60, 3695–3712. doi: 10.1007/s00382-022-06534-4
Muilwijk, M., Nummelin, A., Heuzé, C., Polyakov, I. V., Zanowski, H., and Smedsrud, L. H. (2023). Divergence in climate model projections of future arctic atlantification. J. Clim. 36, 1727–1748. doi: 10.1175/JCLI-D-22-0349.1
Nummelin, A., Li, C., and Hezel, P. J. (2017). Connecting ocean heat transport changes from the midlatitudes to the Arctic Ocean. Geophys. Res. Lett. 44, 1899–1908. doi: 10.1002/2016GL071333
Oldenburg, D., Armour, K. C., Thompson, L., and Bitz, C. M. (2018). Distinct mechanisms of ocean heat transport into the arctic under internal variability and climate change. Geophys. Res. Lett. 45, 7692–7700. doi: 10.1029/2018GL078719
Orvik, K. A., and Niiler, P. (2002). Major pathways of Atlantic water in the northern North Atlantic and Nordic Seas toward Arctic. Geophys. Res. Lett. 29:4. doi: 10.1029/2002GL015002
Pan, R., Shu, Q., Wang, Q., Wang, S., Song, Z., He, Y., et al. (2023). Future Arctic climate change in CMIP6 strikingly intensified by NEMO-family climate models. Geophys. Res. Lett. 50:e2022GL102077. doi: 10.1029/2022GL102077
Pithan, F., and Mauritsen, T. (2014). Arctic amplification dominated by temperature feedbacks in contemporary climate models. Nat. Geosci. 7, 181–184. doi: 10.1038/ngeo2071
Polyakov, I. V., Ingvaldsen, R. B., Pnyushkov, A. V., Bhatt, U. S., Francis, J. A., Janout, M., et al. (2023). Fluctuating Atlantic inflows modulate Arctic atlantification. Science 381, 972–979. doi: 10.1126/science.adh5158
Polyakov, I. V., Pnyushkov, A. V., and Timokhov, L. A. (2012). Warming of the Intermediate Atlantic Water of the Arctic Ocean in the 2000s. J. Clim. 25, 8362–8370. doi: 10.1175/JCLI-D-12-00266.1
Rantanen, M., Karpechko, A. Y., Lipponen, A., Nordling, K., Hyvärinen, O., Ruosteenoja, K., et al. (2022). The Arctic has warmed nearly four times faster than the globe since 1979. Commun. Earth Environ. 3:168. doi: 10.1038/s43247-022-00498-3
Rayner, N. A., Parker, D. E., Horton, E. B., Folland, C. K., Alexander, L. V., Rowell, D. P., et al. (2003). Global analyses of sea surface temperature, sea ice, and night marine air temperature since the late nineteenth century. J. Geophys. Res. 108:D14. doi: 10.1029/2002JD002670
Ribes, A., Qasmi, S., and Gillett, N. P. (2021). Making climate projections conditional on historical observations. Sci. Adv. 7:eabc0671. doi: 10.1126/sciadv.abc0671
Richards, A. E., Johnson, H. L., and Lique, C. (2022). Spatial and temporal variability of Atlantic water in the arctic from 40 years of observations. J. Geophys. Res. 127:e2021JC018358. doi: 10.1029/2021JC018358
Ruiz, J., Ailliot, P., Chau, T. T. T., Le Bras, P., Monbet, V., Sévellec, F., et al. (2022). Analog data assimilation for the selection of suitable general circulation models. Geosci. Model Dev. 15, 7203–7220. doi: 10.5194/gmd-15-7203-2022
Saba, V. S., Griffies, S. M., Anderson, W. G., Winton, M., Alexander, M. A., Delworth, T. L., et al. (2016). Enhanced warming of the Northwest Atlantic Ocean under climate change. J J. Geophys. Res. 121, 118–132. doi: 10.1002/2015JC011346
Sellar, A. A., Jones, C. G., Mulcahy, J. P., Tang, Y., Yool, A., Wiltshire, A., et al. (2019). UKESM1: description and evaluation of the U.K. Earth System Model. J. Adv. Model Earth Syst. 11, 4513–4558. doi: 10.1029/2019MS001739
Serreze, M. C., and Barry, R. G. (2011). Processes and impacts of Arctic amplification: a research synthesis. Glob. Planet. Change 77, 85–96. doi: 10.1016/j.gloplacha.2011.03.004
Sgubin, G., Swingedouw, D., Drijfhout, S., Mary, Y., and Bennabi, A. (2017). Abrupt cooling over the North Atlantic in modern climate models. Nat. Commun. 8:14375. doi: 10.1038/ncomms14375
Shu, Q., Wang, Q., Su, J., Li, X., and Qiao, F. (2019). Assessment of the Atlantic water layer in the Arctic Ocean in CMIP5 climate models. Clim. Dyn. 53, 5279–5291. doi: 10.1007/s00382-019-04870-6
Swart, N. C., Cole, J. N. S., Kharin, V. V., Lazare, M., Scinocca, J. F., Gillett, N. P., et al. (2019). The Canadian Earth System Model version 5 (CanESM5.0.3). Geosci. Model Dev. 12, 4823–4873. doi: 10.5194/gmd-12-4823-2019
Tatebe, H., Ogura, T., Nitta, T., Komuro, Y., Ogochi, K., Takemura, T., et al. (2019). Description and basic evaluation of simulated mean state, internal variability, and climate sensitivity in MIROC6. Geosci. Model Dev. 12, 2727–2765. doi: 10.5194/gmd-12-2727-2019
Taylor, K. E. (2001). Summarizing multiple aspects of model performance in a single diagram. J. Geophys. Res. 106, 7183–7192. doi: 10.1029/2000JD900719
Tokarska, K. B., Stolpe, M. B., Sippel, S., Fischer, E. M., Smith, C. J., Lehner, F., et al. (2020). Past warming trend constrains future warming in CMIP6 models. Sci. Adv. 6:eaaz9549. doi: 10.1126/sciadv.aaz9549
Tsubouchi, T., Våge, K., Hansen, B., Larsen, K. M. H., Østerhus, S., Johnson, C., et al. (2021). Increased ocean heat transport into the Nordic Seas and Arctic Ocean over the period 1993–2016. Nat. Clim. Chang. 11, 21–26. doi: 10.1038/s41558-020-00941-3
Uotila, P., Goosse, H., Haines, K., Chevallier, M., Barthélemy, A., Bricaud, C., et al. (2019). An assessment of ten ocean reanalyses in the polar regions. Clim. Dyn. 52, 1613–1650. doi: 10.1007/s00382-018-4242-z
van der Linden, E. C., Le Bars, D., Bintanja, R., and Hazeleger, W. (2019). Oceanic heat transport into the Arctic under high and low CO2 forcing. Clim. Dyn. 53, 4763–4780. doi: 10.1007/s00382-019-04824-y
Voldoire, A., Saint-Martin, D., Sénési, S., Decharme, B., Alias, A., Chevallier, M., et al. (2019). Evaluation of CMIP6 DECK experiments with CNRM-CM6–1. J. Adv. Model. Earth Syst. 11, 2177–2213. doi: 10.1029/2019MS001683
Wang, Q., Shu, Q., Bozec, A., Chassignet, E. P., Fogli, P. G., Fox-Kemper, B., et al. (2024). Impact of increased resolution on Arctic Ocean simulations in ocean model intercomparison project phase 2 (OMIP-2). Geosci. Model Dev. 17, 347–379. doi: 10.5194/gmd-17-347-2024
Wang, Q., Wekerle, C., Wang, X., Danilov, S., Koldunov, N., Sein, D., et al. (2020). Intensification of the Atlantic water supply to the Arctic Ocean through fram strait induced by Arctic Sea Ice Decline. Geophys. Res. Lett. 47:e2019GL086682. doi: 10.1029/2019GL086682
Wefing, A.-M., Casacuberta, N., Christl, M., Gruber, N., and Smith, J. N. (2021). Circulation timescales of Atlantic water in the arctic ocean determined from anthropogenic radionuclides. Ocean Sci. 17, 111–129. doi: 10.5194/os-17-111-2021
Weijer, W., Cheng, W., Garuba, O. A., Hu, A., and Nadiga, B. T. (2020). CMIP6 models predict significant 21st Century decline of the Atlantic meridional overturning circulation. Geophys. Res. Lett. 47:e2019GL086075. doi: 10.1029/2019GL086075
Weijer, W., Haine, T. W., Siddiqui, A. H., Cheng, W., Veneziani, M., and Kurtakoti, P. (2022). Interactions between the Arctic Mediterranean and the Atlantic meridional overturning circulation: a review. Oceanography 35, 118–127. doi: 10.5670/oceanog.2022.130
Winkelbauer, S., Mayer, M., and Haimberger, L. (2024). Validation of key Arctic energy and water budget components in CMIP6. Clim. Dyn. 62, 3891–3926. doi: 10.1007/s00382-024-07105-5
Zhang, R., Sutton, R., Danabasoglu, G., Kwon, Y.-O., Marsh, R., Yeager, S. G., et al. (2019). A review of the role of the Atlantic meridional overturning circulation in Atlantic multidecadal variability and associated climate impacts. Rev. Geophys. 57, 316–375. doi: 10.1029/2019RG000644
Ziehn, T., Chamberlain, M. A., Law, R. M., Lenton, A., Bodman, R. W., Dix, M., et al. (2020). The Australian earth system model: ACCESS-ESM1.5. J. South Hemisph. Earth Syst. Sci. 70, 193–214. doi: 10.1071/ES19035
Keywords: Arctic, Atlantic Water, subpolar gyre, AMOC, CMIP6, sea water temperature
Citation: Devilliers M, Olsen SM, Langehaug HR, Guo C, Mahmood R, Tian T and Yang S (2025) Constraining CMIP6 simulations for Atlantic Water in the Arctic using an AMOC-SST index. Front. Clim. 7:1550772. doi: 10.3389/fclim.2025.1550772
Received: 24 December 2024; Accepted: 03 April 2025;
Published: 30 April 2025.
Edited by:
Radhakrishna Basivi, National Atmospheric Research Laboratory, IndiaReviewed by:
Valerio Lembo, National Research Council (CNR), ItalyBhupendra Bahadur Singh, Indian Institute of Tropical Meteorology (IITM), India
Copyright © 2025 Devilliers, Olsen, Langehaug, Guo, Mahmood, Tian and Yang. This is an open-access article distributed under the terms of the Creative Commons Attribution License (CC BY). The use, distribution or reproduction in other forums is permitted, provided the original author(s) and the copyright owner(s) are credited and that the original publication in this journal is cited, in accordance with accepted academic practice. No use, distribution or reproduction is permitted which does not comply with these terms.
*Correspondence: Marion Devilliers, bWRlQGRtaS5kaw==