 Qi Sun
 Joël Arnault
 Patrick Laux
 Luca Glawion1,2
 Harald Kunstmann
- 1Institute of Meteorology and Climate Research, Karlsruhe Institute of Technology, Garmisch-Partenkirchen, Germany
- 2Institute of Geography, University of Augsburg, Augsburg, Germany
- 3Center for Climate Resilience, University of Augsburg, Augsburg, Germany
Hydrological models are essential tools for water resource management and for mitigating extreme hydrological events risks. Although they are crucial for flood forecasting, these models often exhibit substantial uncertainties, including input data uncertainties (e.g., precipitation) and structural uncertainties of the models themselves. This study aims to explore the implications of different precipitation datasets and hydrological model structures on streamflow simulation, by evaluating the effects of multiple precipitation products and employing an enhanced model version to reduce structural uncertainty. This study evaluated the hydrological applicability of three representative precipitation products—reanalysis-based (the land component of the fifth-generation European Reanalysis, ERA5-Land), satellite-based (Integrated Multi-satellite Retrievals for GPM, IMERG), and machine learning-based (the first deep learning based spatio-temporal downscaling of precipitation data on a global scale, spateGAN-ERA5), using the offline version of WRF-Hydro, a distributed hydrological model. Additionally, this study evaluated the performance of an enhanced version of WRF-Hydro, incorporating an overbank flow module for reducing the model structural uncertainty in a large, flood-prone tropical river basin, Irrawaddy River Basin in Myanmar. The findings indicate that: (1) Simulations driven by IMERG precipitation outperformed those driven by ERA5-Land and spateGAN-ERA5 in terms of accuracy in streamflow, with average NSE values of 0.77, compared to 0.19 and 0.09, respectively; (2) The modified model with enabled overbank flow showed consistent improvements over the default model. The average NSE improved from 0.09–0.77 (default) to 0.31–0.78 (modified); (3) The water balance analysis reveals that incorporating the overbank flow module reduces surface runoff, accompanied by an increase in soil moisture storage, and slightly enhancing underground runoff and evapotranspiration (ET) during the rainy period. After the end of the rainy period, the increase soil moisture storage gradually contributes to an increase in surface runoff. These results highlight the significant impact of accurate precipitation data and the overbank flow module on hydrological processes, particularly in flood-prone areas, and suggest that the modified model and high quality precipitation data may enhance hydrological forecasting capabilities.
1 Introduction
Water, as a vital natural resource, is under increasing pressure globally due to rising demand and limited availability, due to population growth, urbanization, and climate change (Ferguson and Gleeson, 2012; Boretti and Rosa, 2019). These challenges underscore the critical need for effective water resource management to ensure sustainable development and resilience against water-related risks. Hydrological models are essential tools for predicting water availability, optimizing resource allocation, and mitigating risks associated with extreme hydrological events such as floods and droughts (Rogelis and Werner, 2018; Lane et al., 2019; Melsen and Guse, 2019). Despite their importance, these models face significant challenges due to the substantial spatial–temporal variability of meteorological drivers (e.g., precipitation), the complexity of surface conditions (e.g., topography, land use) and complexity of hydrological processes, leading to various uncertainties in model outputs (Song et al., 2015). As summarized by previous studies (Renard et al., 2010; Troin et al., 2018; Zhang et al., 2025), these uncertainties can be broadly categorized into two main types: (1) input uncertainty, which arises from measurement, sampling limitations, varying algorithms in forcing data such as precipitation; (2) model structural uncertainty, which stems from the simplified representations of hydrological processes, as well as empirical approximations that may not fully capture the complexity of natural systems. Assessing these uncertainties is crucial for improving the predictive accuracy of hydrological models and minimizing risks associated with water resources management, flood forecasting, and climate adaptation planning.
Precipitation is one of the most critical inputs in hydrological modelling, as it significantly influences the performance of hydrological models (Li et al., 2025). Rain gauge observations provide the most direct and accurate precipitation data; however, due to the sparse and uneven spatial distribution of observation stations, as well as environmental (e.g., complex terrain and extreme events) and anthropogenic factors, data quality and stability are often affected (Li et al., 2018b; Mtibaa and Asano, 2022). With advancements in satellite observations and data assimilation techniques, two main types of precipitation products have been developed: reanalysis-based and satellite-based precipitation. The integration of the two types of precipitation data has markedly enhanced the applicability of hydrological models in simulating and predicting floods with by allowing a spatial observation of the at global and regional scales, compared to gauge-based data (Huffman et al., 2024; Wang et al., 2020; Gebrechorkos et al., 2024; Li et al., 2025). The ERA5-Land precipitation dataset—an enhanced global dataset representing the land component of the fifth generation of European Reanalysis (ERA5-Land; Muñoz-Sabater et al., 2021; 9 km approximately)—and satellite-based precipitation products, such as the latest version of the Integrated Multi-satellite Retrievals for GPM (IMERG; Huffman et al., 2024; 9 km approximately), are among the most widely utilized datasets in water resources research (Liu et al., 2021; Zhu et al., 2024). Despite their widespread application, both datasets exhibit inherent limitations that should be carefully considered in hydrological analyses. Reanalysis-based precipitation products face challenges related to data assimilation and model uncertainties (Nie and Sun, 2020), while satellite-based precipitation products are influenced by sampling uncertainties, sensor limitations, and data processing algorithms (Hussain et al., 2018; Wang et al., 2020). Previous studies have evaluated the performance of reanalysis-based and satellite-based precipitation products, including the ERA5-Land and IMERG datasets, as well as their impacts on hydrological simulations across various regions and topographies (Amorim et al., 2020; Le et al., 2020; Wang et al., 2020; Wedajo et al., 2021; Li et al., 2025; Xie et al., 2022). Especially, previous studies have examined the performance of IMERG and ERA5-Land precipitation datasets in tropical and monsoonal regions, providing insights into their suitability for hydrological modeling. For example, Le et al. (2020) compared eight satellite-based precipitation datasets across six river basins in Vietnam (tropical monsoon climate) and found that IMERG exhibited the best overall performance in streamflow simulations, indicating the robustness of its retrieval algorithm in tropical Southeast Asia. Xie et al. (2022) further highlighted spatial differences in precipitation product performance across China and demonstrated that IMERG tends to underestimate precipitation in southern regions, while ERA5-Land generally overestimates it. ERA5-Land performs better than IMERG in northern and northeastern China, whereas IMERG shows better performance in the southeast, particularly in areas with a subtropical monsoon climate. Additionally, Chang et al. (2024) assessed precipitation products in southwestern China (subtropical monsoon climate) and found that while ERA5-Land overestimated annual precipitation, IMERG performed better agreement with gauge-based data and yielded comparable or even slightly better performance in streamflow prediction. These findings underscore the importance of evaluating the applicability of precipitation datasets under monsoonal conditions. However, hydrological assessments focusing specifically on ERA5-Land and IMERG precipitation products within the Irrawaddy River Basin remain limited.
Moreover, while remote sensing provides regional to global precipitation estimates but generally lacks the fine spatial resolution compared to local radar imagery and machine learning-based downscaled data. This limitation directly affects simulation of runoff generation and streamflow aggregation, particularly in regions characterized by complex terrain or heterogeneous land surface conditions (Maina et al., 2020; Shuai et al., 2022; Wetterhall et al., 2011; Ficchì et al., 2016). To address this issue, merging satellite data with rain gauge or radar observations has been a commonly adopted approach to improve the spatial distribution of precipitation data (Ochoa‐Rodriguez et al., 2019; Mtibaa and Asano, 2022). However, these methods can be limited by the availability and quality of ground observations. Recently, machine learning approaches trained on high-resolution radar imagery have been widely adopted to overcome these limitations. Such trained downscaling models not only improve local precipitation estimates but also demonstrate the potential to be generalized and applied across different regions. Advanced downscaling approaches leveraging deep neural networks have proven to be capable of a skillful km-scale global precipitation estimates. For example, spateGAN-ERA5 (Glawion et al., 2025; 2 km) is the first deep learning-based temporal–spatial downscaling of precipitation data on a global scale. It is developed using ERA5 reanalysis data and radar imagery from DWD, and used a conditional generative adversarial neural network (cGAN) to train the model. The spateGAN-ERA5 dataset is based on machine learning algorithms trained on radar imagery, with the underlying assumption that rainband patterns can be learned by algorithms. However, the training data are limited to radar observations from Germany, which may not fully capture the spatial and temporal variability of rainband characteristics in other climatic regions (Glawion et al., 2025). Currently, the validation of spateGAN-ERA5 has been conducted primarily in regions like the United States and Australia, using open-access radar data (Glawion et al., 2025). Despite these validations, the hydrological utility of spateGAN-ERA5 remains unexplored. This study is the first to systematically evaluate the hydrological applicability of spateGAN-ERA5 in a large tropical monsoon river basin. Indirect evaluation of precipitation data performance through hydrological modelling—by comparing simulated discharge with independent hydrological observations—can provide more comprehensive and robust assessments than direct comparisons with sparse meteorological stations (Yang et al., 2014).
In addition to input data uncertainties, hydrological models themselves often exhibit limitations in capturing the full complexity of natural processes. For example, due to the non-consideration of overbank flow, when the river flow pushes over its banks, in the WRF-Hydro model, the simulated streamflow exhibit overestimated peak values (Arnault et al., 2023). Thus, an enhanced version of the hydrological model which incorporating the overbank flow module to allow for water flow between land and river in a two-way manner, has demonstrated promising performance in regions such as East and West Africa (Arnault et al., 2023; Mortey et al., 2024; Ndiaye et al., 2024). These previous studies have primarily focused on small basins, where precipitation is relatively uniformly distributed spatially within these river basins. Despite its success in these areas, this model has yet to be validated in other geographical contexts. The Irrawaddy River Basin experiences a typical tropical monsoon climate, strongly influenced by the South Asian monsoon, and exhibits substantial spatial (wet and dry zone, 500 mm to 4,000 mm) and seasonal variations (rainy and dry season, nearly 90% precipitaion within rainy season) in precipitation (Chen et al., 2020). Additionally, compared to the relatively flat terrain of and uniform land use within the small African basins, the Irrawaddy Basin exhibits a more heterogeneous topography, including mountains and low-lying delta (from 3,500 m to 500 m above mean sea level), with dense river network and diverse type of land use patterns, including forest areas, grasslands and cultivated lands (Pang et al., 2019). Hydrological processes here are influenced by not only spatial variations in precipitation, but also complex terrain, and diverse land use patterns, leading to more complex runoff generation mechanisms. Specifically, there has been no comprehensive evaluation of its performance in a large river basin—the Irrawaddy River Basin in Myanmar, where unique climatic, topographical, and land-use characteristics may present new challenges. Therefore, further validation in this region is essential to assess the model’s robustness and adaptability to different meteorological and hydrological conditions.
To evaluate the uncertainties in both precipitation inputs and hydrological model structure, this study compares hydrological simulations using multi-source precipitation datasets (reanalysis, satellite-based, and machine learning–derived) and model configurations with and without the overbank flow module in a large, flood-prone tropical river basin. To achieve this goal, we conduct a series of hydrological simulations over the poorly gauged Irrawaddy River Basin for the period 2010–2011. Specially, we: (1) evaluate the streamflow simulations using WRF-Hydro driven by three different precipitation products; (2) assess the influence of incorporating the overbank flow module on streamflow performance; (3) investigate the water balance components differences under various precipitation datasets and model configurations (i.e., default vs. overbank flow-enabled). A distributed hydrological model—WRF-Hydro is set up for the Irrawaddy River Basin, and six simulation scenarios (3 precipitation datasets × 2 model configurations) are designed to explore uncertainties in streamflow simulation. The results highlight the sensitivity of streamflow simulations to different precipitation inputs and the inclusion of the overbank flow module, offering reference for hydrological modelling in similar poorly gauged, flood-prone regions.
The remainder of the article is structured as follows: Section 2.1 introduces the study area and Section 2.2 describes the data used and Section 2.3 describes the evaluation metrics, while Section 2.4 details the hydrological model and Section 2.5 introduces the overbank flow module. Section 3 and 5 presents the results and discussion of the study, and the conclusion in Section 5.
2 Materials and methods
2.1 Study area
The Irrawaddy (also known as the Ayeyarwady) River Basin, located between 15°30′-28°50′N, 93°16′-98°42′E, is predominantly within Myanmar. Covering a total drainage area of about 410,000 km2 (60% of Myanmar’s land area, Sirisena et al., 2021), the basin runs from the north to the south of the country, ultimately discharging into the Andaman Sea (Figure 1a).
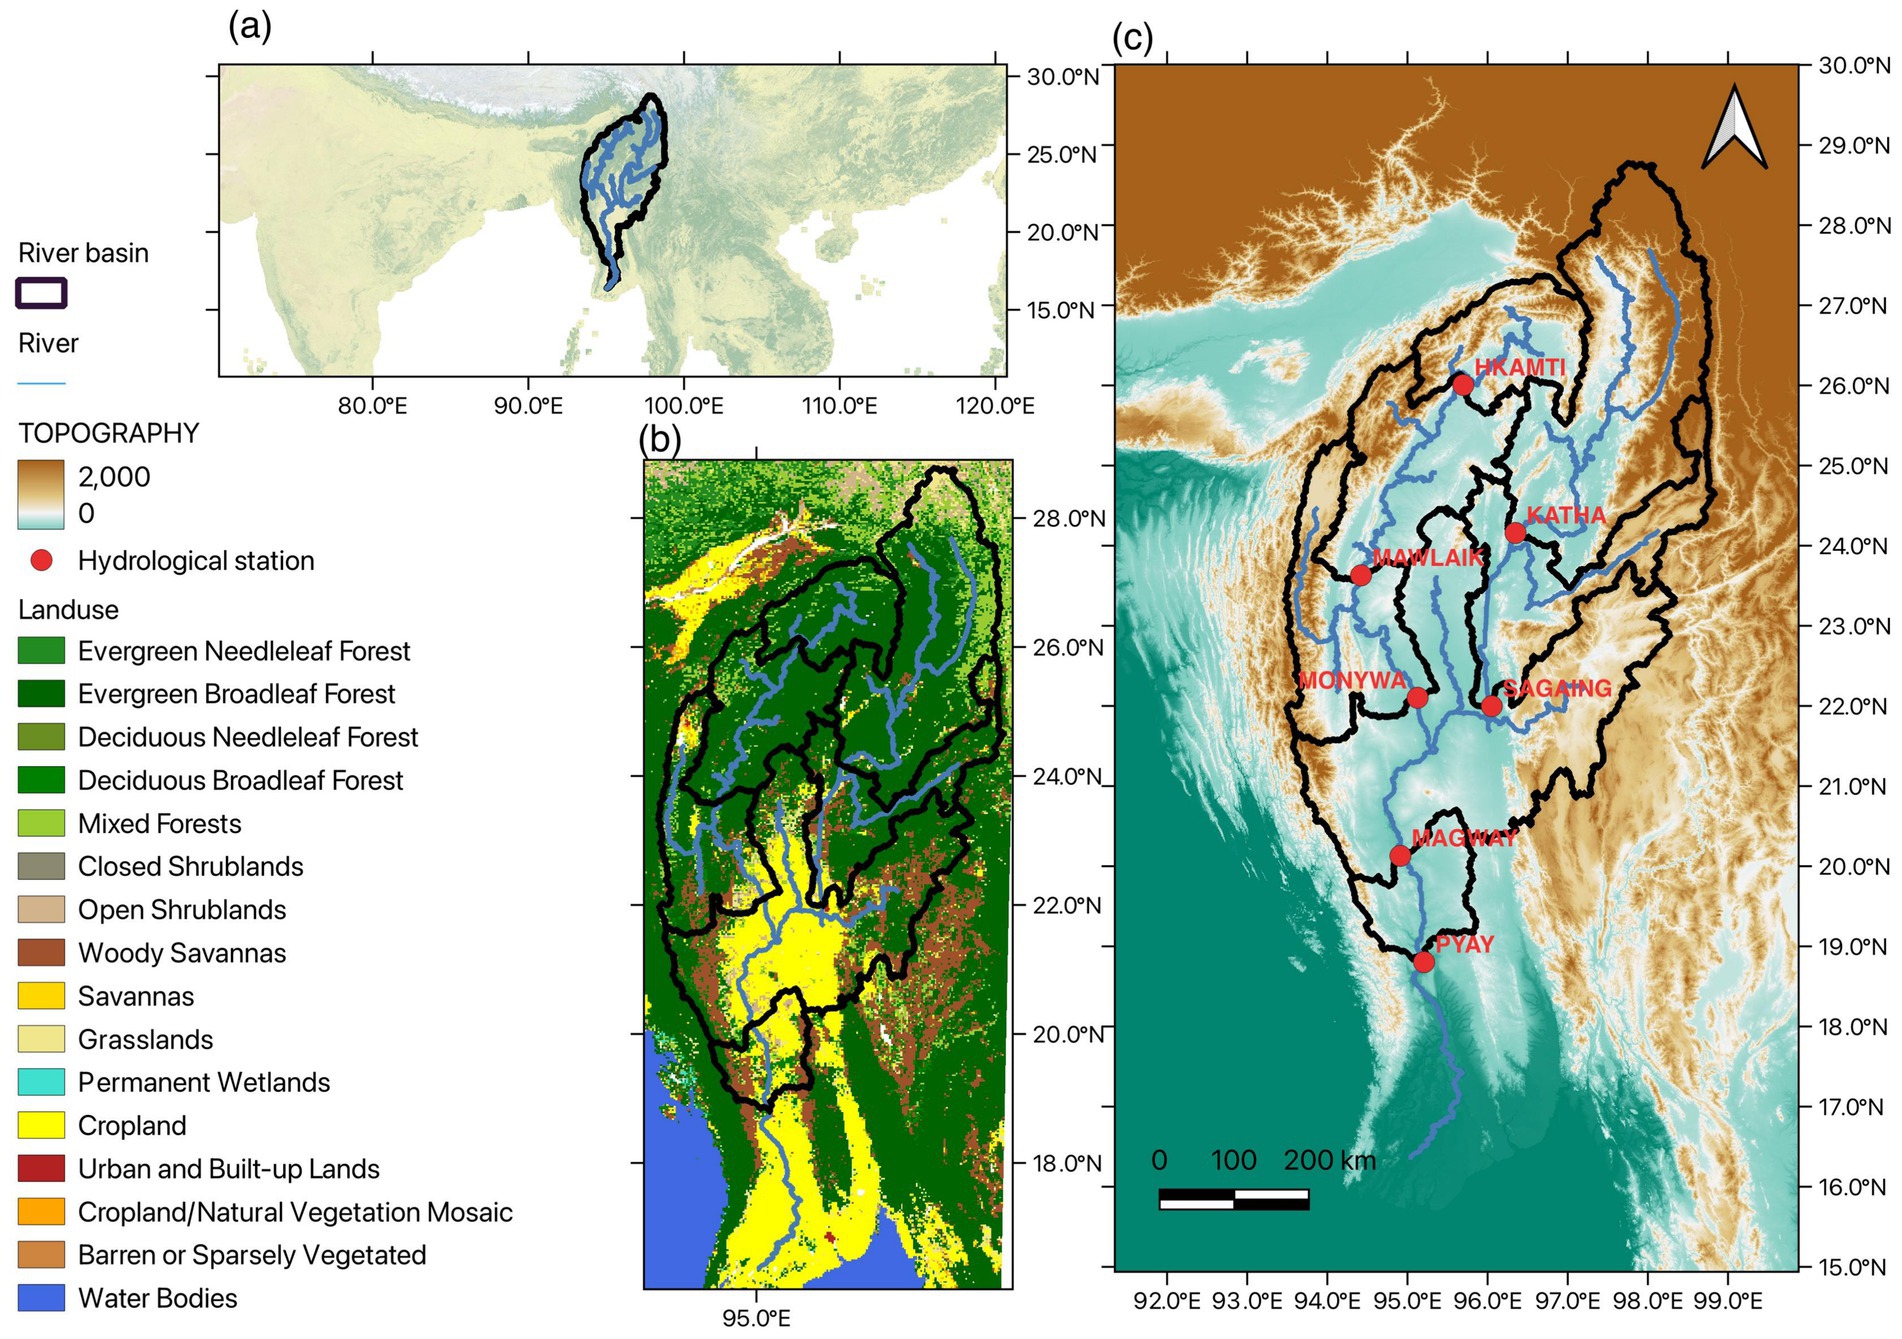
Figure 1. Location and basic characteristic of Irrawaddy River Basin. (a) Geographical location of Irrawaddy River Basin in Asia. (b) The distribution of land use types in Irrawaddy River Basin. (c) Overview of the Irrawaddy River Basin including the distribution of seven hydrological stations (red circles), and elevation. For the basin area information, see Table 2.
Land cover is dominated by forests and cropland (rain-fed) comprise more than 65% of the basin (Figure 1b). Dense forests are mainly distributed in the northern mountainous and hilly region, while croplands are mostly located in the central dry zone and deltaic plains. The basin features diverse topography, ranging from northern mountains and central plateaus to the low-lying delta in the south, which contributes to substantial hydrological and climatic variability (Figure 1c).
The Basin experiences a tropical monsoon climate, with a rainy season from May to October and a dry season extends from November to next year April. In addition to temporal variability, the spatial distribution of annual precipitation is also highly uneven, ranging from over 4,000 mm in the northern mountainous regions to around 500 mm in the central parts (Chen et al., 2020). Regarding interannual rainfall variability, Edirisinghe et al. (2023), based on CHIRPS (Climate Hazards Group InfraRed Precipitation with Station Data) observations from 1981 to 2021, reported a mean annual precipitation of approximately 1,852 mm across the Irrawaddy Basin, with a standard deviation of 152 mm and a coefficient of variation (CV) of 8.23%, indicating moderate interannual variability. The region is frequently impacted by tropical cyclones during the monsoon season, which often trigger heavy rainfall and severe flooding (Besset et al., 2017). For example, on 26 September in 2024, an estimated 1 million people across 70 out of the 330 townships in Myanmar were reportedly affected by the flooding caused by heavy monsoon rains and remnants of Typhoon Yagi (United Nations, 2024). In addition to flood disasters, this basin has experienced more droughts during 2000–2017 (Zhao et al., 2023). Under future climate scenarios, streamflow in this river basin is projected to increase overall but with greater interannual variability (Xu et al., 2024; Luo et al., 2025). These changes are expected to intensify the risks of both flooding and drought events in Irrawaddy River Basin—a basin with large population—where streamflow is directly related to food security, life security, and sustainable water resource management.
2.2 Datasets
WRF-Hydro requires static terrestrial data to describe the model domain, parameters, initial condition, such as topographic height, land use, soil type and vegetation fraction. For high-resolution global digital elevation data, this study utilizes HydroSHEDS (Hydrological data and maps based on Shuttle Elevation Derivatives at multiple Scales).1 HydroSHEDS are primarily derived its DEM from the Shuttle Radar Topography Mission (SRTM) at a resolution of 3 arc-seconds (~90 meters at the equator), with some custom-modifications (Lehner et al., 2008). The datasets are offered in resolutions of 3, 15, and 30 arc-seconds as well as 5 and 6 arc-minutes. Considering the spatial extent and complexity of the Irrawaddy River Basin, the 3 arc-second resolution DEM is selected for this study. The 3 arc-seconds DEM is processed by ArcGIS to generate accurate flow directions, delineate watersheds, extract stream and reservoir networks, produce one-dimensional parameter files for lake and stream networks, define nest grid cells for routing, and compile geographical information of lake. Additionally, lake data are incorporated using HydroLAKES (Messager et al., 2016), which provide the shoreline polygons of all global lakes. The lakes are co-registered with the global river network from HydroSHEDS database via their lake pour points. Land use and soil type information are obtained from the United States Geological Survey datasets (USGS) and the Moderate Resolution Imaging Spectroradiometer (MODIS) dataset.
Several meteorological variables are also needed to run the offline model. These include specific humidity, air temperature, downward long-wave and short-wave radiation, surface pressure, near surface u and v wind components, the precipitation rate. The primary source of meteorological data (except for precipitation), used in this study are from ERA5-Land. ERA5-Land is a near-surface meteorological reanalysis dataset developed by the European Centre for Medium-Range Weather Forecasts (ECMWF). It is generated by running high-resolution numerical simulations of the ECMWF land surface model, which is driven by downscaled meteorological forcing from the ERA5 climate reanalysis. This dataset also incorporates an elevation correction to improve the representation of near-surface thermodynamic variables (Muñoz-Sabater et al., 2021). ERA5-Land covers the period from 1950 to near-present, with a latency of approximately 2–3 months. This dataset has been widely applied in hydrology, climate modeling, and land surface process studies (Higgins et al., 2023; White et al., 2023; Xie et al., 2024).
Precipitation, as the most important input variable for hydrological modeling, were represented using three precipitation datasets in the simulations. The first precipitation dataset employed was the reanalysis-based product—ERA5-Land (Muñoz-Sabater et al., 2021). ERA5-Land provides global coverage with a spatial resolution, approximately 9 km at the equator, and a temporal resolution of 1 h as mentioned above. The second dataset was IMERG (Huffman et al., 2024), a satellite-based precipitation product that combines data from multiple passive microwave sensors and infrared observations. IMERG provides near-global coverage (60°N to 60°S) with a high temporal resolution of 30 min and a spatial resolution of 0.1° (approximately 9 km at the equator). The third dataset used was spateGAN-ERA5 (Glawion et al., 2025), a machine-learning based data, this global precipitation dataset was developed based on ERA5 reanalysis data (Hersbach et al., 2020) and trained using a conditional generative adversarial neural network (cGAN), which was exclusively calibrated on gauge-adjusted and climatology-corrected weather radar data provided by the German Meteorological Service (DWD). spateGAN-ERA5 provides precipitation estimates at a spatial resolution of 2 km and a temporal resolution of 10 min, which could provide relatively high spatial–temporal resolution input for hydrological modelling. The relevant information is summarized in Table 1.
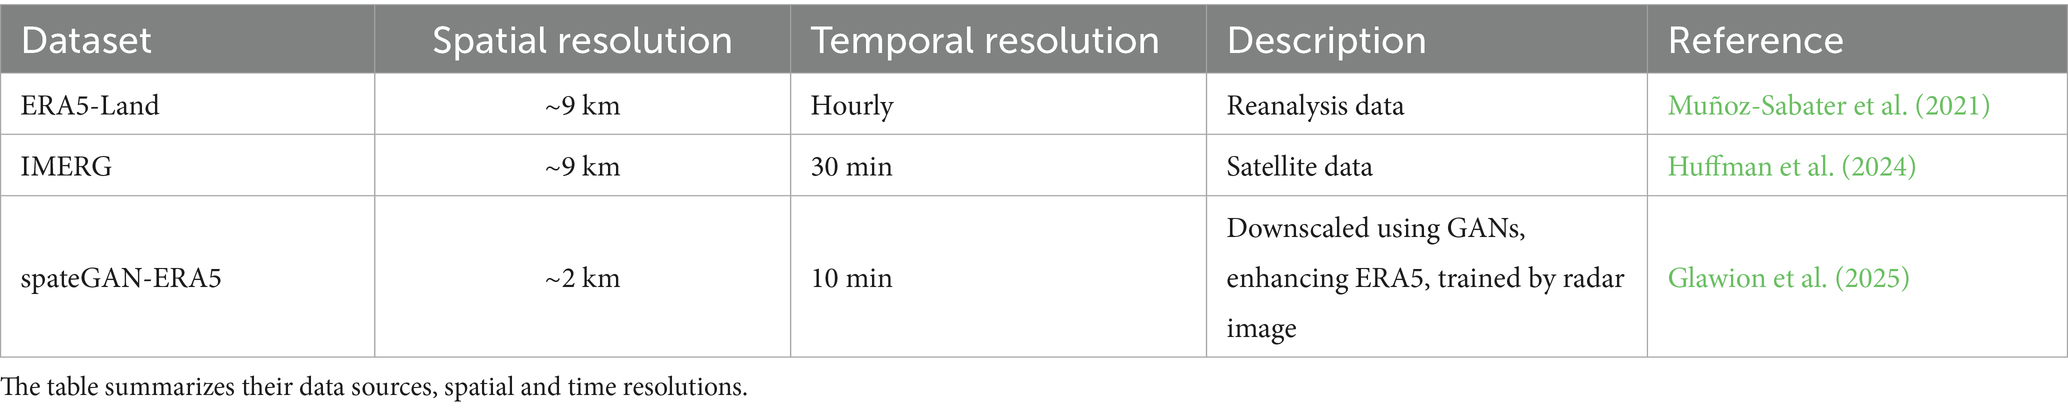
Table 1. Comparison of the three precipitation datasets employed in this study: ERA5-Land, IMERG, and spateGAN-ERA5.
The observed streamflow data were obtained from the Global Runoff Data Centre (GRDC).2 There are 7 stations (HKAMTI, MAWLAIK, MONYWA, PYAY, KATHA, SAGAING, MAGWAY) available in study region, and all of them have relatively long period observation streamflow data from 1978 to 2023. The daily streamflow data from 2010 to 2011 are used in this study. Our study focuses on a two-year simulation period due to several practical considerations: (1) Based on literature study, the Irrawaddy Basin has a mean annual precipitation of approximately 1852 mm, with a standard deviation of 152 mm and a coefficient of variation (CV) of 8.23%, indicating moderate interannual rainfall variability (Edirisinghe et al., 2023); (2) The spateGAN-ERA5 dataset used in our simulations has a very high spatial (2 km) and temporal (15 min) resolution, which demands substantial computational resources and storage; conducting longer-term simulations at this resolution over the extensive Irrawaddy River Basin (~361,000 km2) is computationally intensive and resource-demanding; (3) An additional two-year simulation for 2012–2013 was performed, and the results are broadly consistent with those from 2010 to 2011 (not shown).
ET is a key state variable in hydrological processes. To evaluate the model performance in ET, two reference ET products were used in this study. The Global Land Evaporation Amsterdam Model product (GLEAM) calculates ET from bare soil, short vegetation and vegetation with a tall canopy, and it also considers ice and snow sublimation products, based on the Priestley and Taylor (PT) evaporation model with a variety of satellite-sensor products to estimate daily evaporation at a global scale and 0.25° spatial resolution (Martens et al., 2017; Miralles et al., 2011). Based on previous study (Jia et al., 2022; Salazar-Martínez et al., 2022), compared other remote sensing-based ET products, GLEAM has the smaller bias and higher correction across between latitudes 30° S and 30° N. Another global ET product used in this study is derived from a three-temperature (3 T) model and Global Land Data Assimilation System (GLDAS) datasets. This product, hereafter referred to as ChinaET, with daily and 0.25° (Yu et al., 2022), has generally comparable performance to other common ET products and better performance under extreme weather conditions in croplands.
Soil moisture is another key state variable in hydrological processes. To evaluate the model performance in soil moisture, two reference soil moisture products were used in this study. GLDAS (Rodell et al., 2004), developed by National Aeronautics and Space Administration (NASA), using land surface models and combining satellite- and ground-based observations, provides 0.25° soil moisture estimations for 0–10 cm soil layer. This dataset is widely used in terrestrial water resources research and shows advantages in less uncertainty and effectively capturing drought events in Central Asia (Qing et al., 2022; Yu et al., 2023). Another one is from Earth System Science Data Climate Change Initiative (ESA CCI), include ACTIVE, PASSIVE and COMBINED soil moisture observations (Dorigo et al., 2017). We used daily and 0.25° COMBINED product (Preimesberger et al., 2020) in this study, which combines soil moisture observations from multiple active and passive satellite remote sensing instruments operating in the microwave spectrum. The data generally agrees well with the spatial and temporal patterns estimated by observed in-situ data and provides a long-term record for climate studies and various applications related to soil moisture dynamics (Dorigo et al., 2017; Humphrey et al., 2021).
2.3 Statistical methods
The performance of WRF-Hydro in simulating streamflow is quantitatively evaluated through several typical statistical metrics including correlation coefficient (CC), Nash Sutcliffe Efficiency (NSE), Root Mean Square Error (RMSE), Mean Absolute Error (MAE). They are defined by Equations (1–4) respectively. The CC is a statistical indicator that represents the linear relationship between simulations and observations, where the value lies between −1.0 to 1.0. A correlation of −1 signifies a perfect negative correlation, and a perfect positive correlation by 1. A correlation of 0 specifies that there is no relationship between the two variables. NSE is a commonly used metric in hydrological evaluations, which measures both the magnitude of errors and the variability of timeseries. It ranges from minus infinity to 1.0 (Nash and Sutcliffe, 1970; Liu et al., 2021). The closer the value is to 1, the better the model performance. If the value is 0, the model performance is just as good as yielding the mean observation. According to the widely cited model evaluation guidelines by Moriasi et al. (2007), hydrological model performance at the watershed scale can be considered “good” if NSE falls between 0.65 and 0.75. RMSE is a standard way to quantify the error of a model in predicting data, with a range from 0 to ∞, and 0 means there is no error. MAE quantifies the average magnitude of absolute deviations between predicted and observed values, and the ideal value is 0 too. In this study, these four metrics are selected because they could assess different aspects of model performance separately (bias, variance, correlation), compared to composite metrics. These four metrics are widely adopted in hydrological model evaluations (Liu et al., 2021; Xu et al., 2024) and enable effective comparison with existing studies in similar contexts.
Where Qobs,i denotes the i-th observed streamflow, Qmod,i denotes the i-th model simulated streamflow, Qobs,i* denotes the temporal average of observed streamflow, n is the number of days.
2.4 Model
WRF-Hydro (Gochis et al., 2025) is a distributed hydrological model, widely used for flash-flood prediction (Varlas et al., 2018; Jam-Jalloh et al., 2024), regional hydroclimate impact assessments (Fersch et al., 2020), seasonal forecasting of water resources (Cho and Kim, 2022), and land-atmosphere coupling studies (Rummler et al., 2019). The model can operate in either an offline (uncoupled) mode or a coupled mode, where it is integrated with atmospheric or Earth system models. The offline mode, which is the model configuration used in this study, utilizes one-way process using a meteorological forcing dataset. The model can simulate and predict hydrological processes at various spatial scales (from headwater catchment to continental river basin) and temporal resolutions (from minute to season). WRF-Hydro simulates key hydrological processes including surface overland flow, baseflow, subsurface flow, and channel routing. By incorporating both surface and subsurface hydrological components, the model enables a more physically realistic representation of the terrestrial water cycle. WRF-Hydro extends the traditional Noah land model by providing the framework of routing. This routing method supports differing resolutions between the land surface model (LSM) grid and the routing grid, enabling the use of high-resolution topographic and hydrological data specifically for the routing process. In this study, the LSM resolution is 3,000 m, and the routing resolution is 300 m. The high routing resolution was adopted to better capture the dense and complex river network structure and topographic variability of the Irrawaddy River Basin, which is critical for accurate simulation of flood propagation and localized hydrological responses. The default paramters of the river channels’ geometry of WRF-Hydro applied in this study, since we had no detailed data on river channel geometry parameters in this data-scarce river basin. The default parameters are widely used in hydrological modeling and are designed to represent typical channel characteristics across various stream orders. Due to the lack of meteorological observation data, we could not conduct a calibration of the WRF-Hydro parameters, which might have implications for the streamflow accuracy of the simulations. However, since the main focus of this study is set on the effects introduced by different precipitation datasets and the sensitivity of the overbank flow module, it is expected that the calibration does not affect our main conclusions. There is no spin-up range employed for warming the model, since the streamflow is quite small and equilibrium (soil moisture) quickly reached due to the start of the simulation during the dry season.
2.5 Two-way extension of the land-river water flow module
The Irrawaddy River Basin is prone to frequent flooding, often leading to overbank flow and inundation of adjacent floodplains. Although WRF-Hydro accounts for numerous hydrological processes, in its default version, the surface water enters a channel once it exceeds the retention depth and does not return to the land (Gochis et al., 2020). The model, however, does not include the overbank flow process, which can lead to unrealistically high peak discharges when compared to the gauge observation. To mitigate the problem, Arnault et al. (2023) incorporated overbank flow module in the WRF-Hydro source code, which allows for water flow between land and river in a two-way manner. In this module, the model incorporates a new parameter—the overbank flow threshold (Hthres). This parameter is used to determine whether the water head in a given channel pixel exceeds the defined threshold. If the water head exceeds Hthres, the model assumes that overbank flow occurs, subsequently the water originating from the upstream channel pixel is redirected to the adjacent land surface. To ensure mass conservation, the upstream channel flow is subsequently added to the surface water component computed by the overland flow routing module (Arnault et al., 2023). To better illustrate this process, Supplementary Figure S1 presents a schematic diagram of the overbank flow mechanism in a river–floodplain system, adapted from Arnault et al. (2023) with modifications. A detailed explanation of model modifications to enable the two-way extension of land-river water flow, along with the numerical balance achieved through the overbank flow option is provided in Arnault et al. (2023). The code is available at doi: 10.6084/m9.figshare.21063982. This advanced model was applied successfully in Nzoia river basin in tropical East Africa and Sissili-Kulpawn Basin, and Senegal River Basin in West Africa (Arnault et al., 2023; Mortey et al., 2024; Ndiaye et al., 2024).
2.6 Terrestrial water balance computation
The terrestrial water balance (TWB) can be written as follows:
The terrestrial water balance equation describes the distribution of water. Precipitation (P)—the total input of water from rain, snow, and other sources. ET (water lost to the atmosphere through evaporation and plant transpiration), surface runoff (Rs) (water flowing overland into streams and rivers), underground runoff (Rg) (groundwater contributions to flow, including baseflow), and changes in terrestrial water storage (ΔS).
3 Results
3.1 Impact of precipitation datasets on streamflow simulation
To evaluate the model performance on simulating streamflow, the Irrawaddy River Basin and its seven hydrological stations (shown in Figure 1) were selected. The spatial distribution of these stations provides relatively comprehensive coverage of the basin.
The simulated streamflow driven by three precipitation datasets—spateGAN-ERA5 (SPATE), ERA5-Land (ERA5), and IMERG—reasonably reproduce the observed temporal variations at all seven hydrological stations (Figure 2). The CC exceeded 0.80 across all stations and reached up to 0.95 at some locations, indicating a strong agreement between simulated and observed streamflow time series (Table 2). However, the simulations based on ERA5 and SPATE tend to overestimate streamflow during rainy season compared to the observed data (Figure 2). In contrast, IMERG simulation shows better performance on daily streamflow simulation, with high mean CCs (0.92) and satisfactory NSE values ranging from 0.69 to 0.89 (NSE > 0.65 indicating good model performance) and low Biases, as reflected by lower average RMSE (2,941 m/s3) and MAE (2,280 m/s3). Comparatively, ERA5 and SPATE demonstrated relatively lower CC values (0.88 and 0.85, respectively), poorer NSE ranges (−0.22 to 0.58 and −0.11 to 0.34, respectively), and higher average RMSE (5,373 m3/s and 5,685 m3/s) and MAE (3,510 m3/s and 3,597 m3/s), highlighting the relatively inferior performance of these datasets in simulating daily streamflow at the basin scale (Table 2).
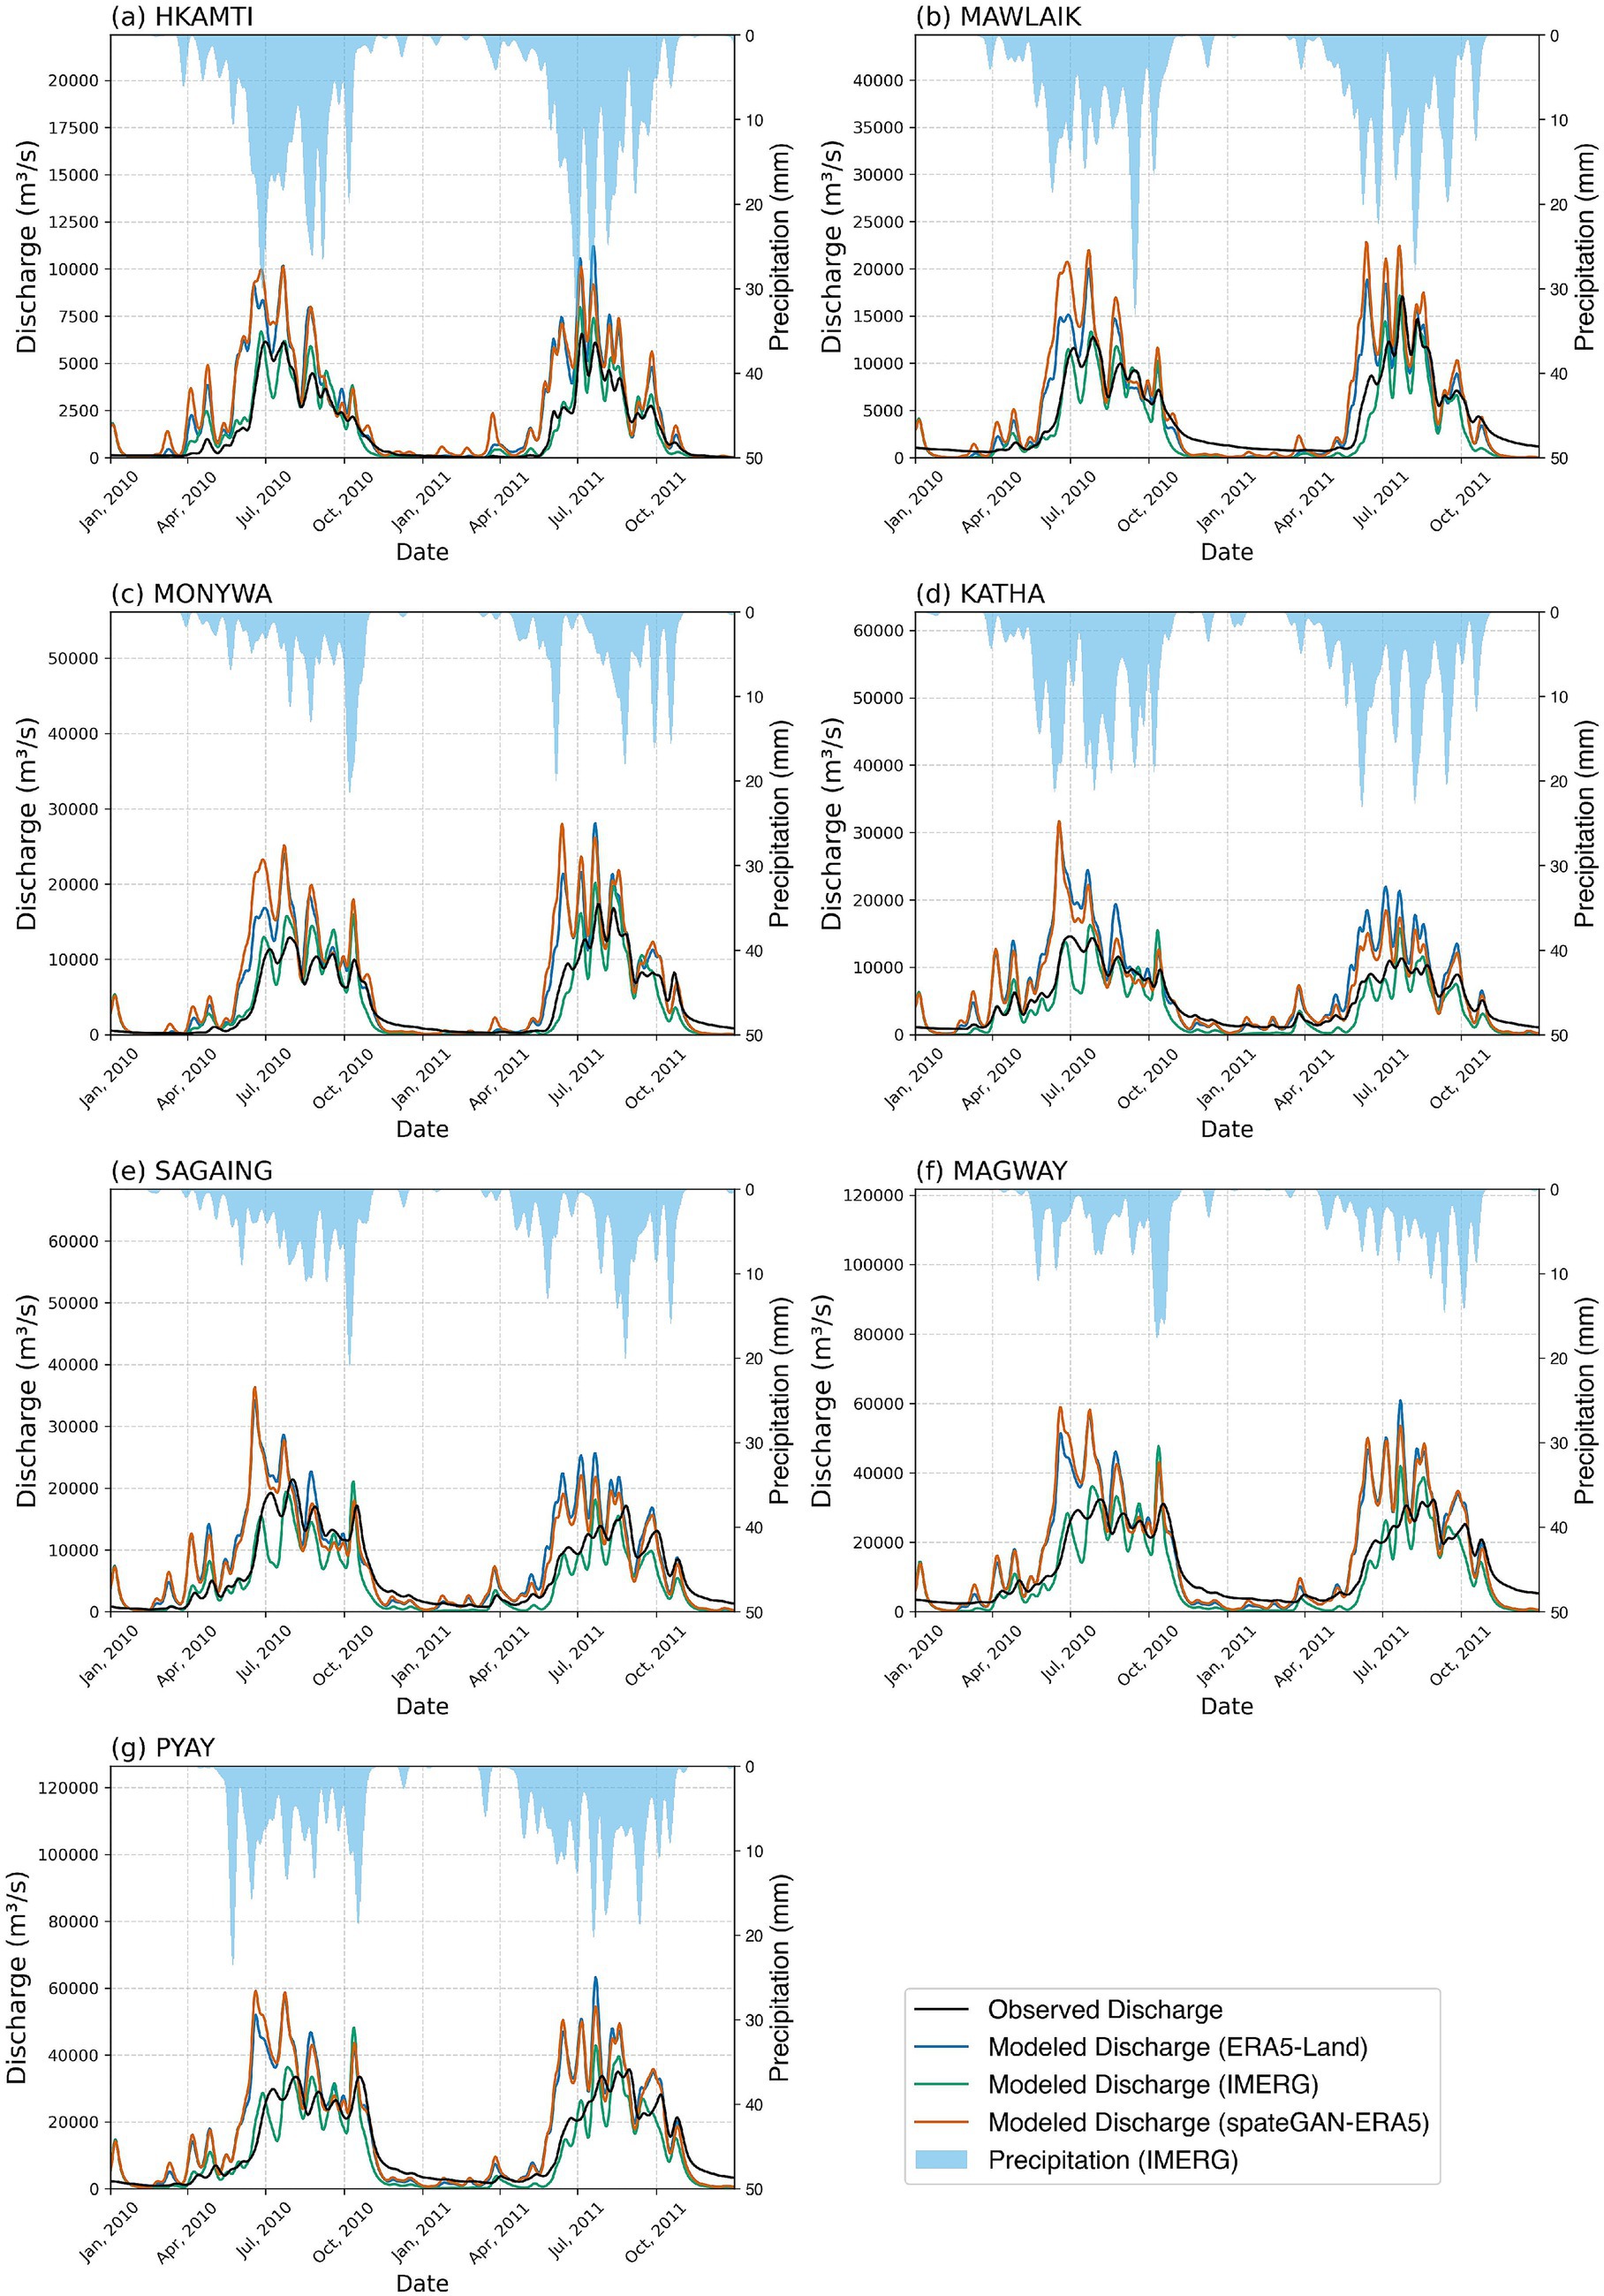
Figure 2. Hydrographs of simulated streamflow driven by precipitation inputs from ERA5-Land (blue), IMERG (green), spateGAN-ERA5 (orange), compared with observed discharge (black) at (a–g) seven stations during 2010–2011 using WRF-Hydro.
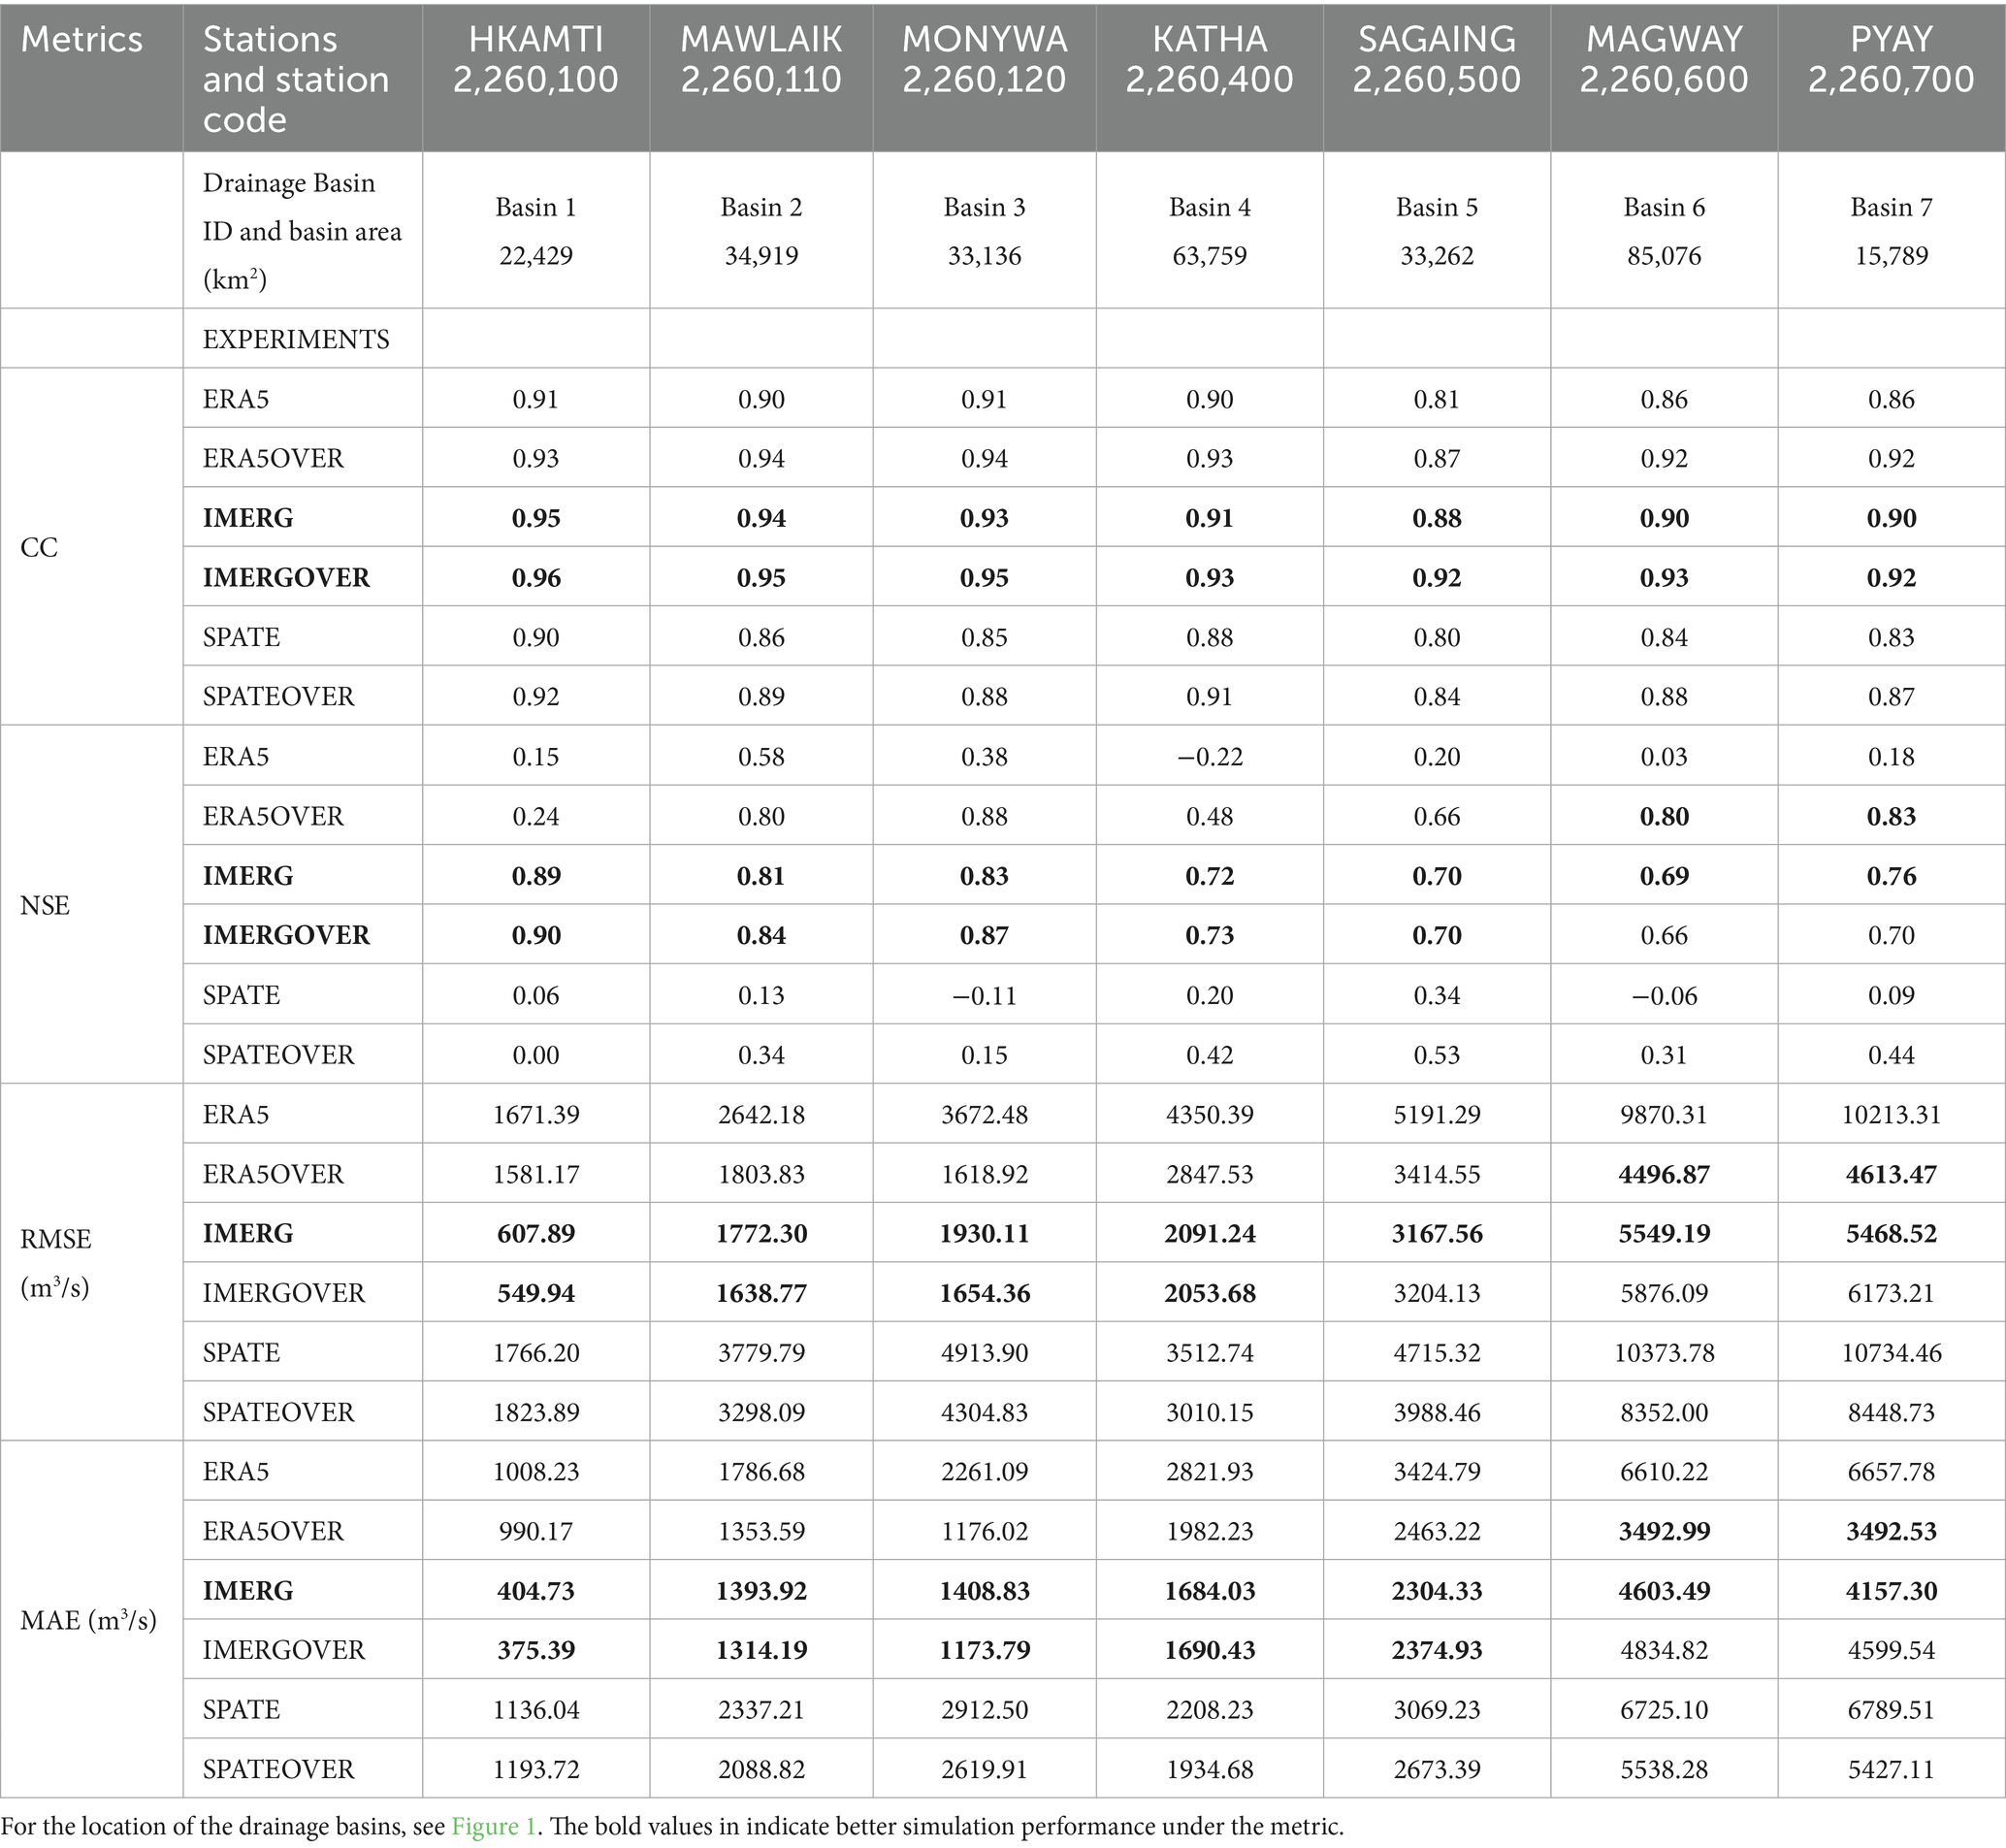
Table 2. Quantitative analysis results of model performance for daily streamflow simulation using different precipitation datasets (ERA5, SPATE, IMERG) and model configurations (default and overbank options).
To better understand the differences in the simulated streamflow, we further analyzed the annual precipitation and subbasin-averaged monthly precipitation (Figures 3, 4). Compared to IMERG, both ERA5 and SPATE significantly overestimate the annual mean precipitation in the river basin, with ERA5 overestimating by approximately 35. 33% and SPATE by about 35. 42%. The overestimation is particularly in the northern mountainous regions located upstream of the basin (Figures 3, 4a,b,d). This overestimation has a substantial impact on the larger simulated streamflow from upstream to downstream (Figures 2a–g). The performance of the precipitation-driven simulations using ERA5 and SPATE is quite similar, as the precipitation of SPATE was downscaled based on ERA5 and have quite high similarity in precipitation amount (Figures 3, 4). Although the IMERG produces relatively more accurate streamflow overall, it still overestimates peak flow values—similar to the ERA5 and SPATE, albeit to a lesser extent. This systematic overestimation across all datasets may be attributed to the absence of overbank flow processes in the default model (Arnault et al., 2023).
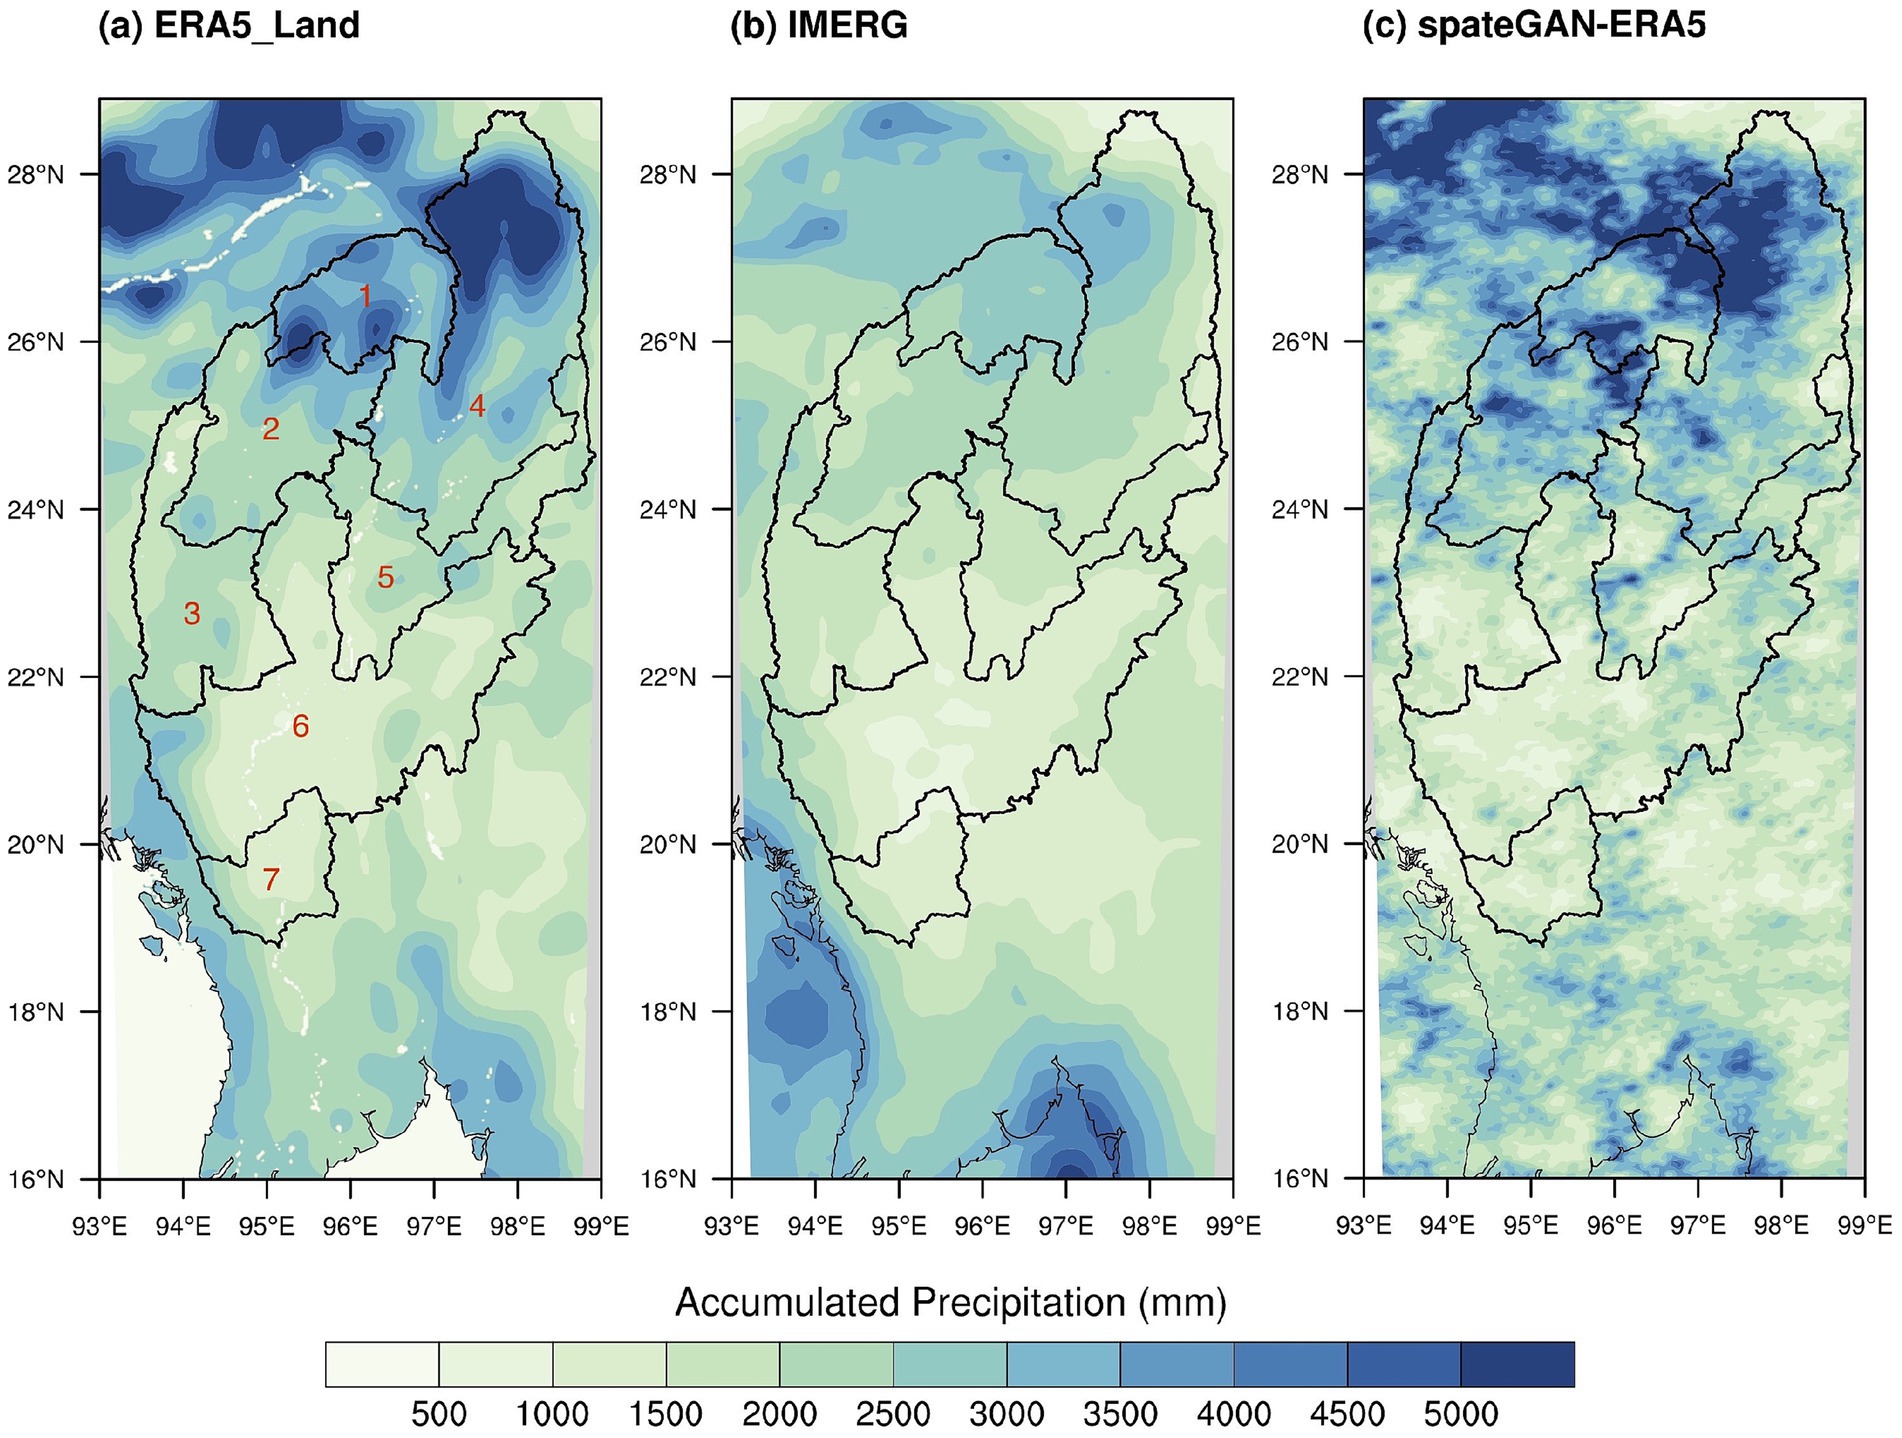
Figure 3. Annual mean precipitation (mm) distribution of datasets for 2010–2011 in the Irrawaddy River Basin: (a) ERA5-Land, (b) IMERG, and (c) spateGAN-ERA5. The red numbers in panel (a) indicate the basin identification numbers.

Figure 4. Monthly Precipitation Time Series from three precipitation datasets for (a–g) seven sub-basins in the Irrawaddy River Basin from 2010 to 2011, (h) the basin number.
3.2 Impact of overbank flow on streamflow simulation
To address the overestimation of peak streamflow values, we conducted further simulations using all three datasets—SPATE, ERA5, and IMERG—with the overbank flow module activated. The corresponding simulation scenarios are denoted as SPATEOVER, ERA5OVER, and IMERGOVER, respectively. The results of these different configurations are presented and compared in Figure 5 and Table 2 to evaluate the impact of incorporating overbank flow processes on accuracy of streamflow simulation. Simulations incorporating the overbank flow module yielded improved daily streamflow performance, as indicated by a higher mean CC (rrom 0.88 to 0.91) across the three datasets and seven stations, a reasonable average NSE (from 0.35 to 0.58), and reduced bias metrics, including lower reduced average RMSE (−23.7%) and mean MAE (−23.6%). Specifically, for the IMERGOVER simulation compare to IMERG, mean CC increased from 0.90 to 0.93, representing a 2.2% improvement. Notably, mean NSE for the upstream and midstream five stations increased from 0.79 to 0.81 (2.3%). Additionally, average RMSE and MAE across five stations decreased by 6.4 and 5.3%, respectively, although the two downstream stations exhibited slight declines in some performance metrics. Among all sites, station 3 showed a particularly pronounced improvement across all four metrics: CC rose from 0.93 to 0.95 (2.2%), NSE increased markedly from 0.83 to 0.97 (16.9%), while RMSE and MAE were reduced by 14.3 and 16.7%, respectively. The results indicate that incorporating the overbank flow module significantly mitigates the unrealistically high peaks observed in the default model, thereby enhancing the realism and accuracy of the simulated streamflow. Moreover, this study examines a large river basin, where module impacts varies across the seven gauging stations. This variability can be attributed to differing hydrological conditions at each site. As shown in Figure 5, the reduction in peak streamflow due to the inclusion of the overbank flow module is more pronounced at downstream stations (Figures 5g–i) compared to upstream stations (Figures 5a–c). Although overbank flow occurs in the upstream areas, the resulting streamflow reduction at individual upstream basins is relatively limited. However, as the river traverses multiple sub-basins, the cumulative effect of overbank flow becomes increasingly significant. This accumulation leads to a substantial attenuation of peak discharge observed at the downstream stations.
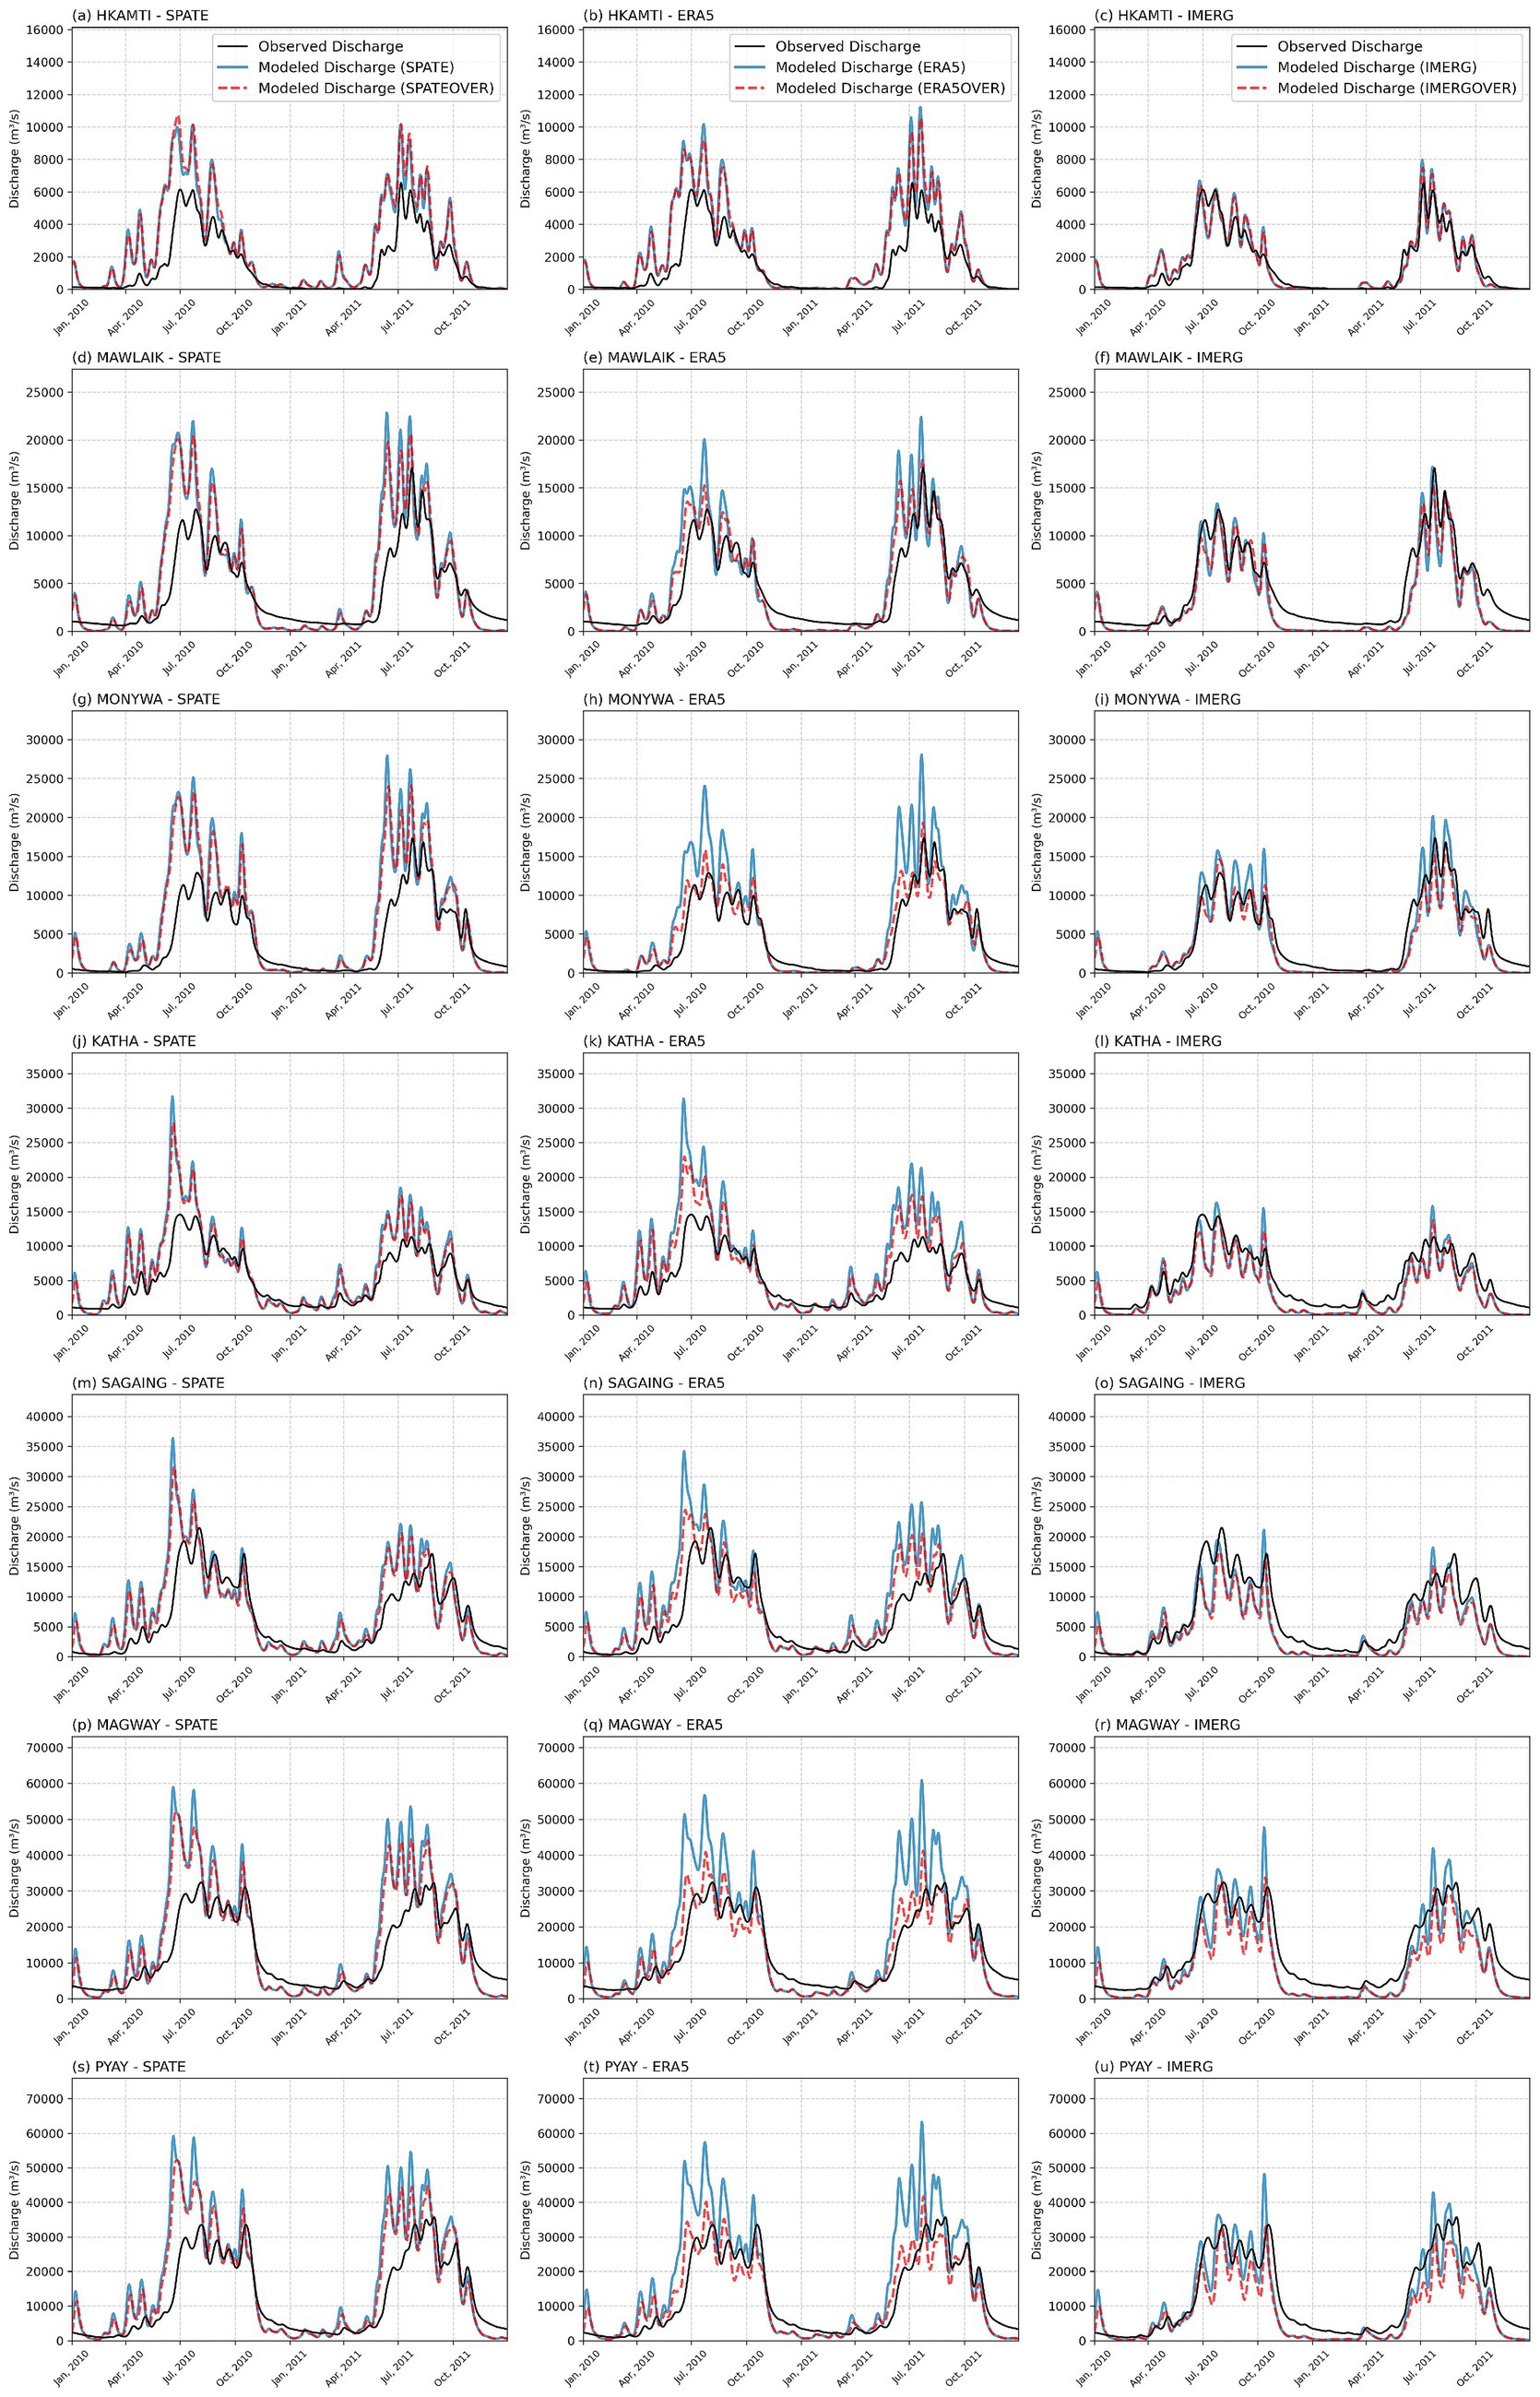
Figure 5. Hydrographs of simulated streamflow using the default model (solid blue lines) driven by three precipitation datasets—SPATE (first column), ERA5 (second column), and IMERG (third column), along with overbank flow represented by red dashed lines, are compared against observed streamflow (black) at (a–u) seven stations with WRF-Hydro during 2010–2011.
In addition to streamflow, the simulated soil moisture and ET were compared with observational products. The long-term daily mean top-layer (0–10 cm) soil moisture from WRF-Hydro (Figures 6c–e) exhibits relatively similar spatial distributions to those from the observational products GLDAS and ESACCI (Figures 6a,b). In the northern region, where precipitation is higher, soil moisture content is also greater, while in the central region, where precipitation is relatively lower, soil moisture is correspondingly lower. However, the simulations tend to overestimate top-layer soil moisture, particularly in areas with high precipitation. This is further confirmed by the basin-averaged soil moisture time series shown in Figure 7, where the simulations generally capture the temporal variations in soil moisture; however, all simulations tend to overestimate soil moisture, particularly during the rainy season. Among them, the ERA5 simulation exhibits a larger bias (0.025 m3/m3) compared to the IMERG simulation (0.020 m3/m3), which can be partly attributed to the overestimation of precipitation in the ERA5-Land dataset. Despite the relatively accurate simulated streamflow from IMERG, the model still exhibits an overestimation of soil moisture. Although there is an overestimation bias in soil moisture, the temporal variation closely matches the observations, and the magnitude of the bias is relatively small, making it generally acceptable. Additionally, different products also shows discrepancies in soil moisture estimates. The differences between the GLDAS and ESA CCI products may result from differences in their input data and retrieval algorithms.
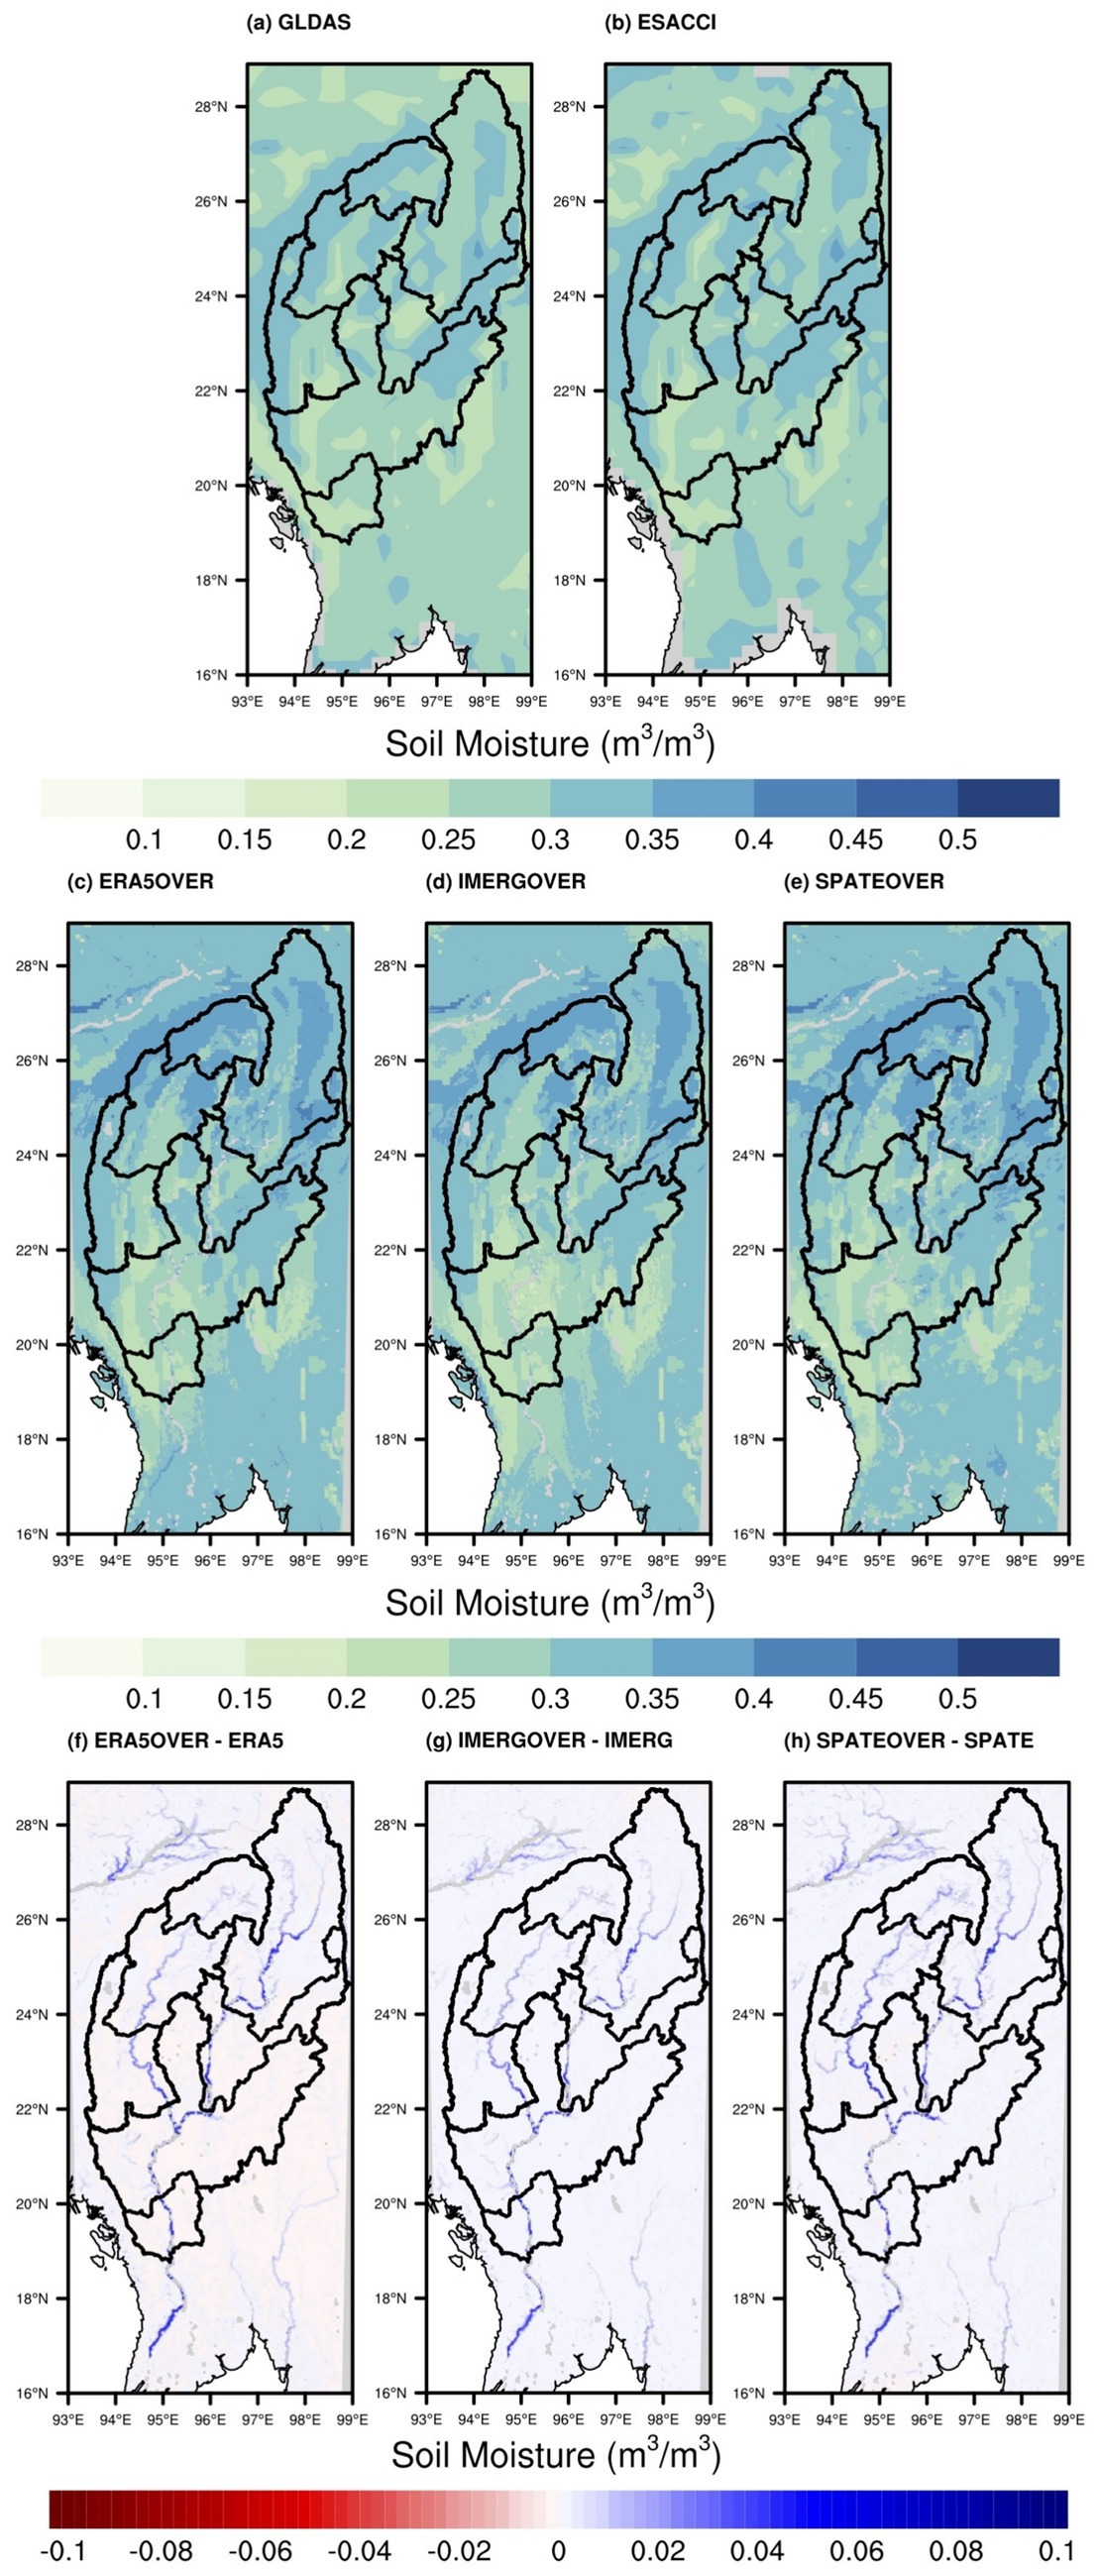
Figure 6. Spatial patterns of daily average surface (0–10 cm) soil moisture in the Irrawaddy River Basin during 2010–2011 (a,b) from the reference product GLDAS and ESA CCI; (c–e) simulated soil moisture from WRF-Hydro with the overbank flow module enabled, driven by ERA5, IMERG, and SPATE precipitation datasets; (f–h) the differences between simulations with and without the overbank flow module (overbank run minus default run).
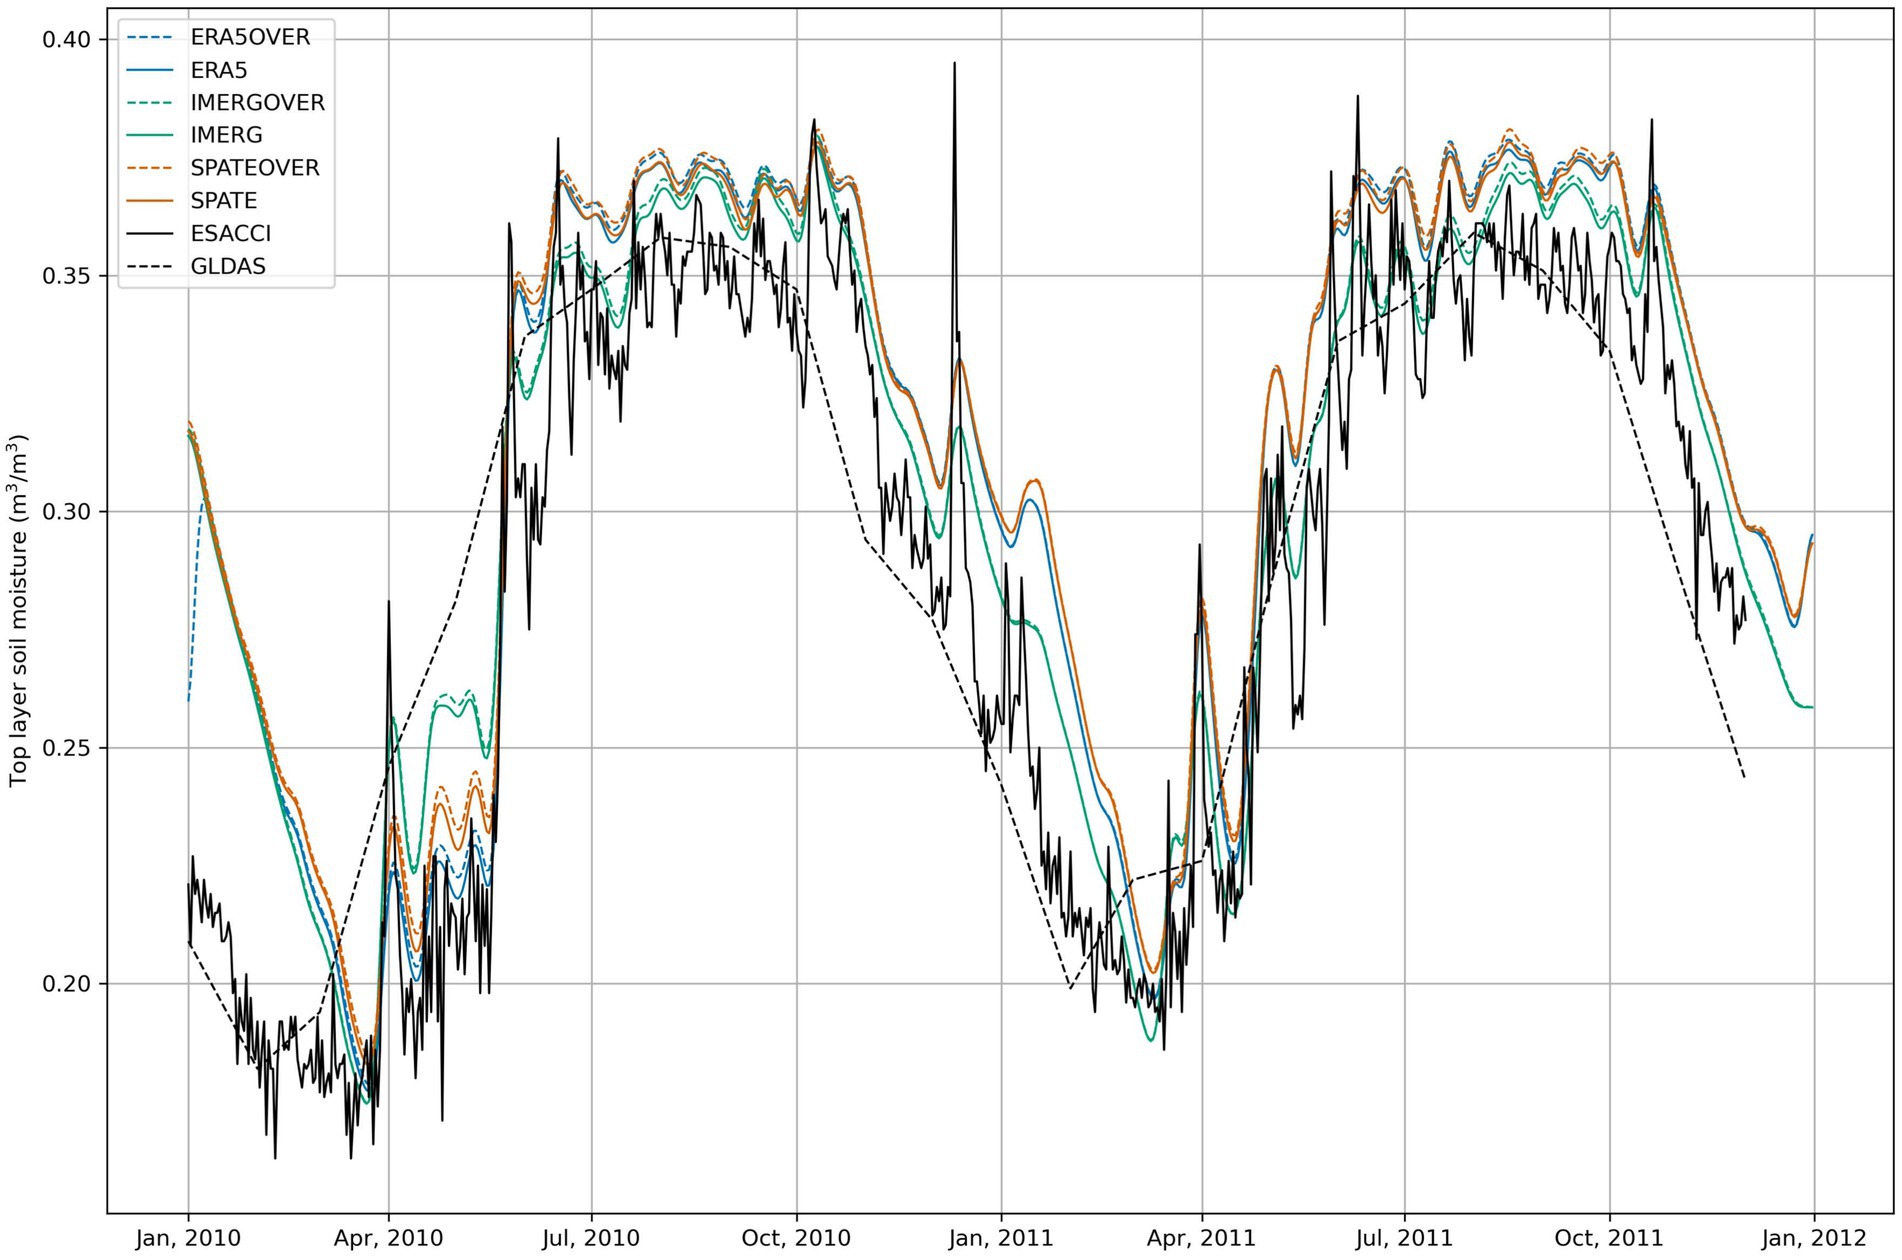
Figure 7. Comparison of observed and simulated time series of basin-averaged top-layer (0–10 cm) soil moisture in the Irrawaddy River Basin from 2010 to 2011.
The daily mean ET simulated by WRF-Hydro (Figures 8c–e) show relatively similar spatial distributions with those from the ChinaET and GLEAM datasets (Figures 8a,b). This is also further supported by the basin-averaged ET time series in Figure 9, where the simulations generally capture the temporal variability of ET. During the rainy season, simulated ET values fall within the range of the two observational products, with only minor discrepancies, typically within 1 mm/day. Some differences between ChinaET and GLEAM are also observed, which may be attributed to differences in the retrieval algorithms used in these products.
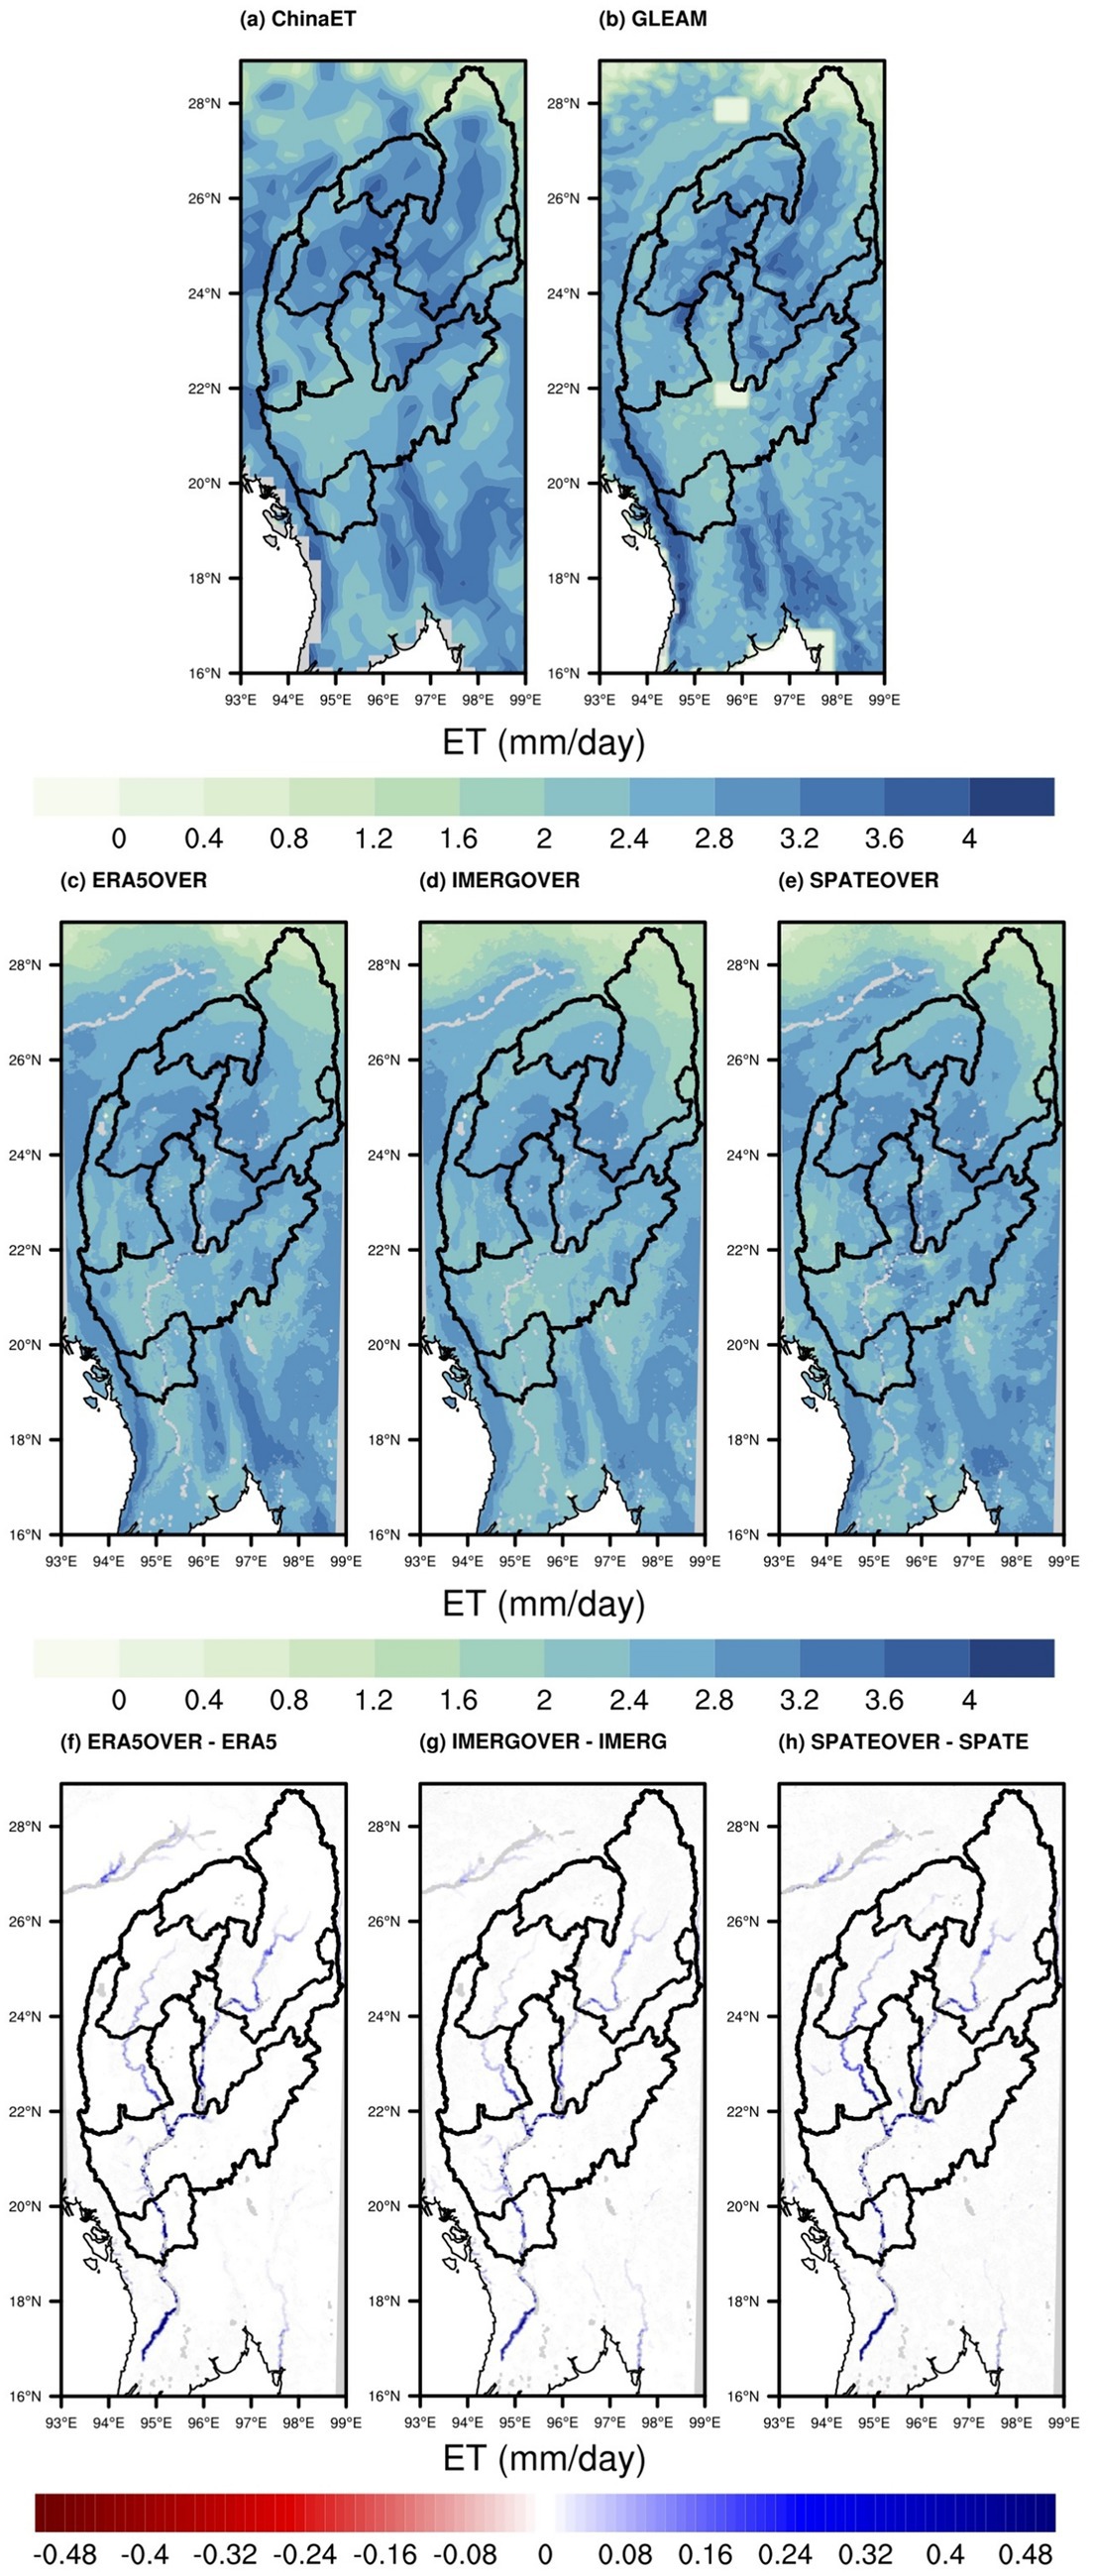
Figure 8. Spatial pattern of daily average ET (mm/day) in the Irrawaddy River Basin during 2010–2011 (a,b) from the reference product China ET and GLEAM; (c–e) simulated ET from WRF-Hydro with the overbank flow module enabled, driven by ERA5, IMERG, and SPATE precipitation datasets; (f–h) the differences between simulations with and without the overbank flow module (overbank run minus default run).
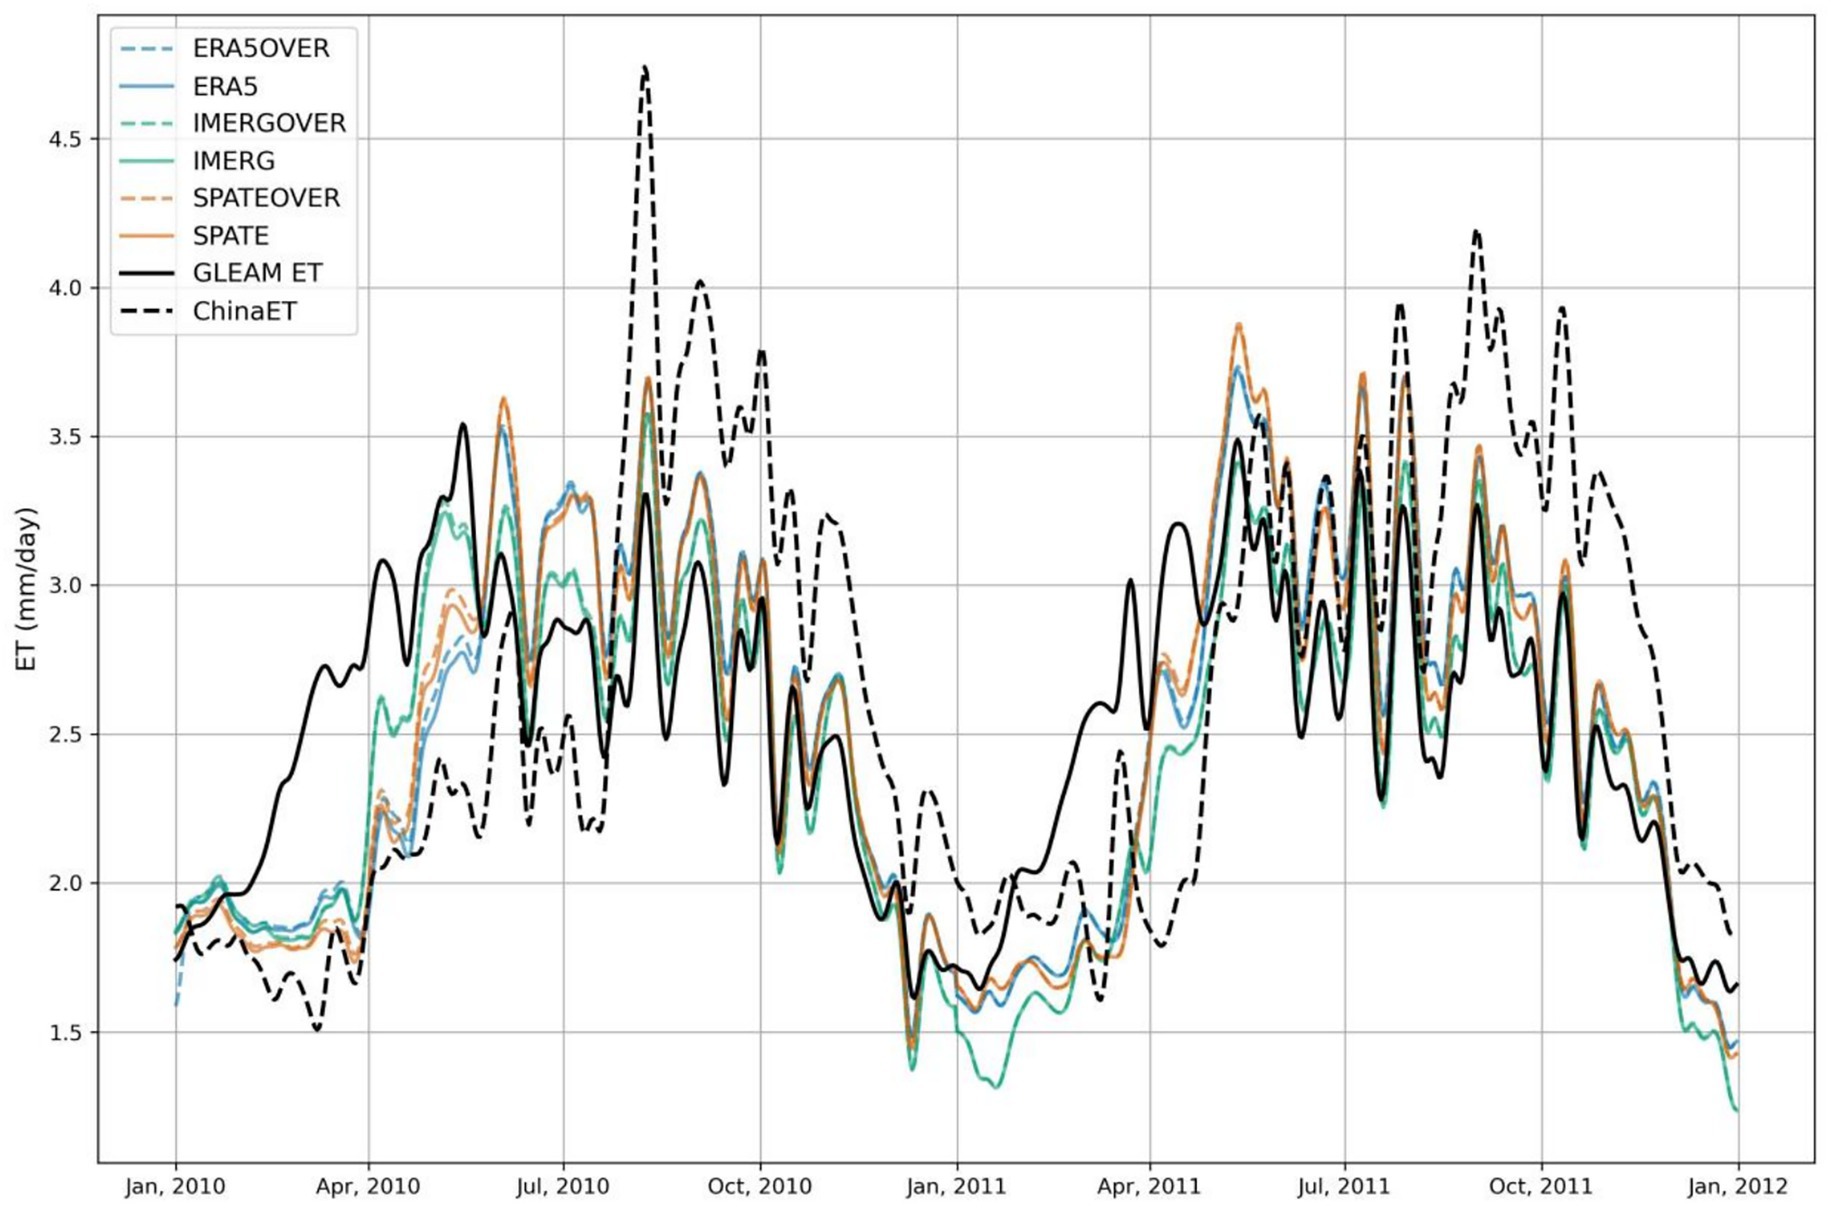
Figure 9. Comparison of observed and simulated time series of basin-averaged ET (mm/day) in the Irrawaddy River Basin from 2010 to 2011.
To further investigate the impact of incorporating the overbank module on the terrestrial water balance, Figure 10 presents the key water balance components—including precipitation, surface runoff, changes in soil moisture storage (ΔS), ET, and underground runoff—calculated according to Equation (5), as simulated by both the default WRF-Hydro model and the enhanced version with the overbank flow module activated. Figures 10a–c, which represent the results from the three precipitation datasets, all show that during the rainy season, incorporating the overbank flow module leads to a reduction in surface runoff (4.6%), accompanied by an increase in soil moisture storage (2.2%), along with slight increases in ET and underground runoff. The increased soil moisture storage during the rainy season subsequently contributes to increased surface runoff after the rainy period ends. Based on the water balance analysis, the inclusion of the overbank flow module allows a portion of river water to overflow onto adjacent land surfaces, when water depth exceed the bank depth. This process reduces surface runoff during the peak rainy months (e.g., from April onward). With this process, ET and soil moisture simultaneously slightly increasing. Some of this infiltrated water percolates into underground runoff. Later, as rainfall decreases in October, the increased soil moisture from previous overbank events contributes to increased surface runoff compared to the default simulation. These are further confirmed by Figures 6f–h, 8f–h in increased soil moisture and ET along the bank compared to the default simulation.
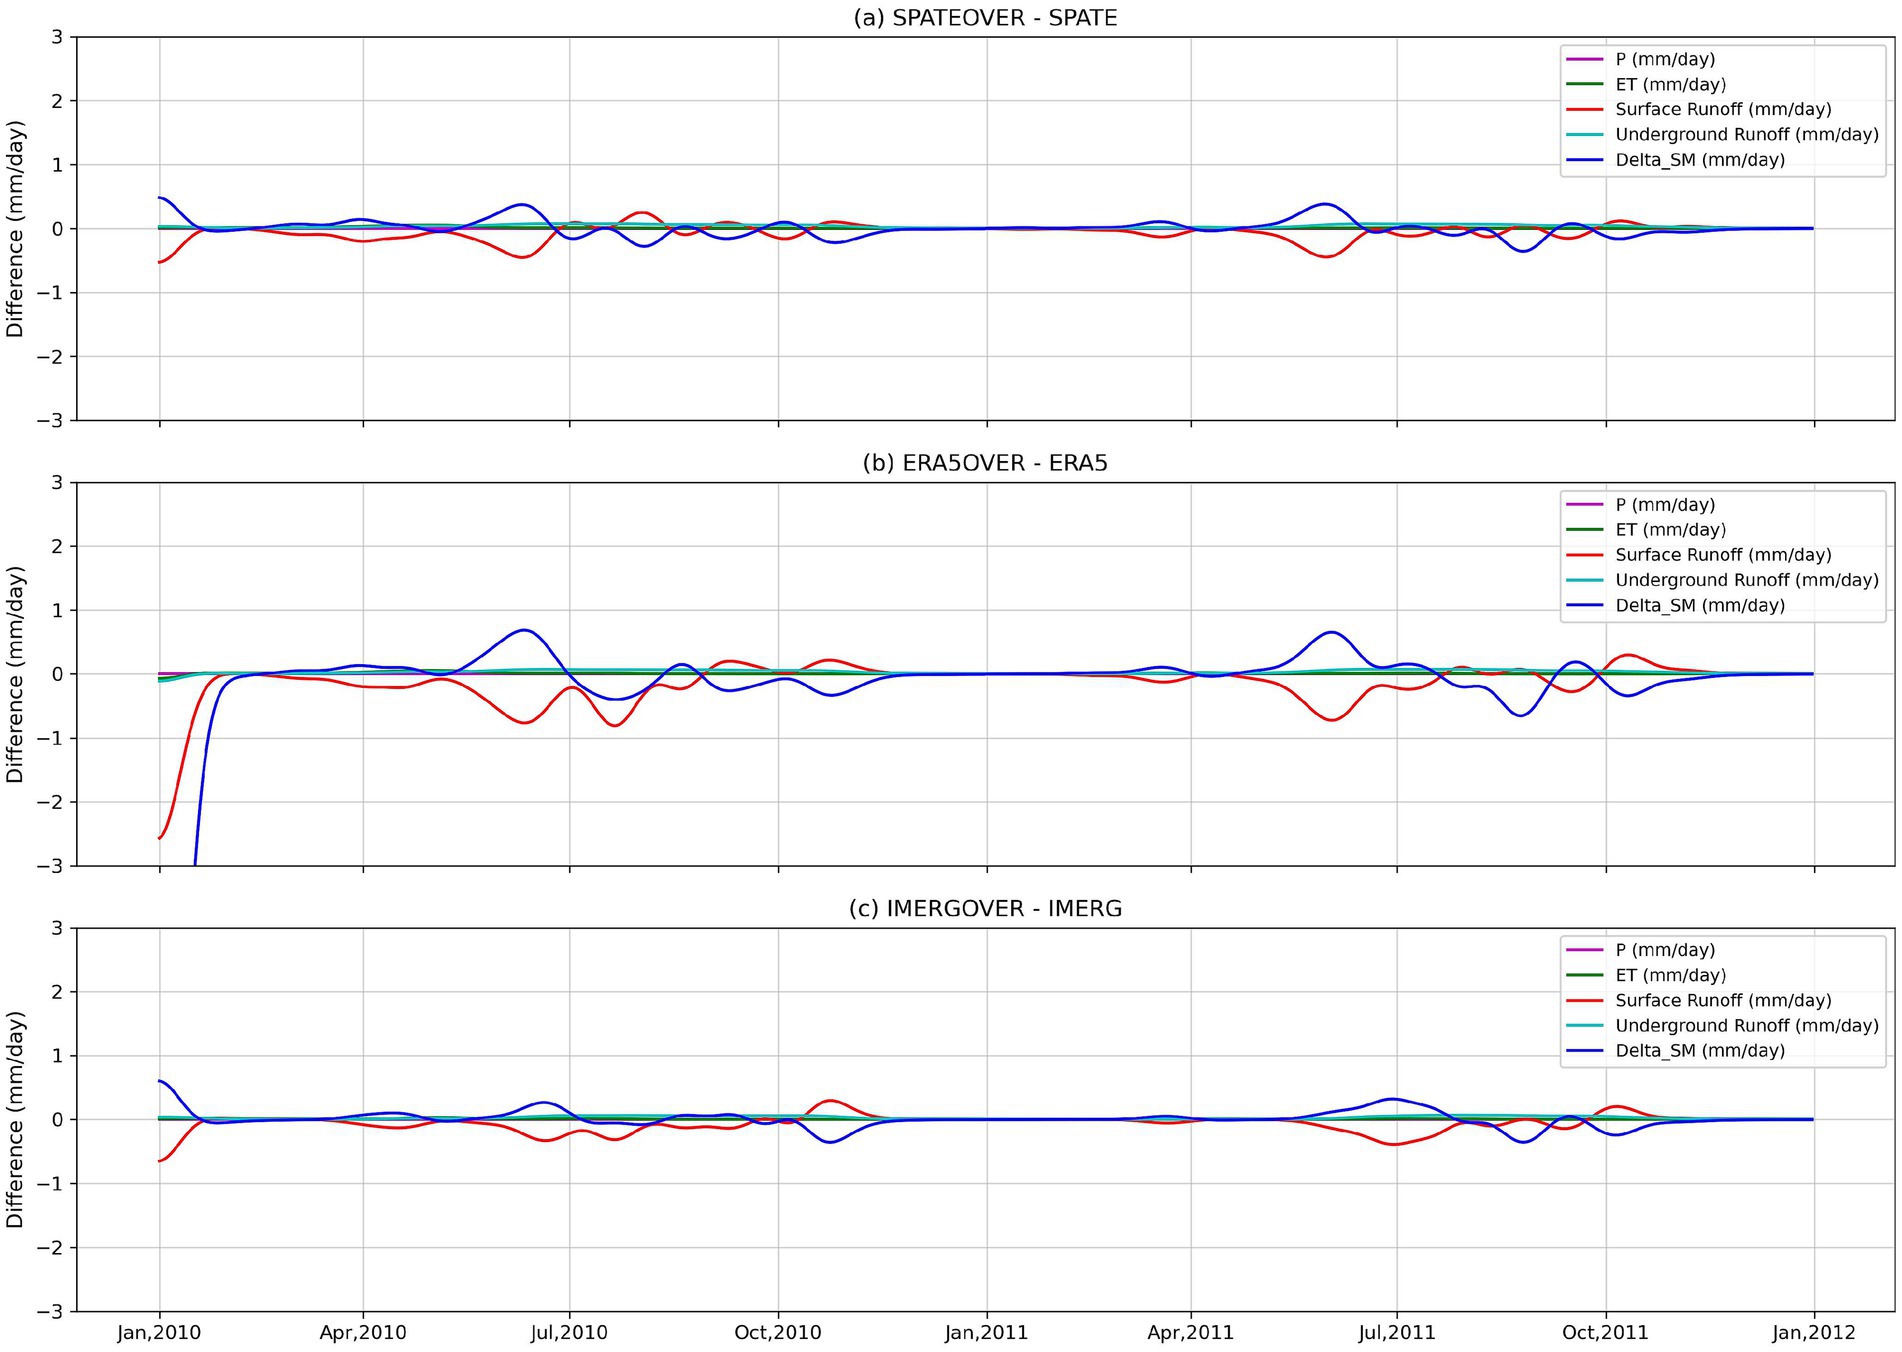
Figure 10. Differences in hydrological balance components between the overbank flow simulation and the default WRF-Hydro configuration. (a) SPATEOVER minus SPATE, (b) ERA5OVER minus ERA5, and (c) IMERGOVER minus IMERG.
After examining the variations in different water components, we further investigated the changes in soil moisture across different soil layers. The simulated changes in soil moisture for each layer are presented in Figure 11. With the exception of the first month, soil moisture content generally increases, which aligns with the trends observed in Figure 10 in soil moisture storage changes, indicating an overall increase in water storage compared to the default run. During the rainy season, the first soil layer shows a more pronounced increase in moisture content (0.0018 m3/m3) compared to the deeper layers (Layer 2: 0.0016, Layer 3: 0.0016, and Layer 4: 0.0014 m3/m3). This pattern reflects the downward infiltration of water, which subsequently enhances moisture levels in the underlying soil layers.
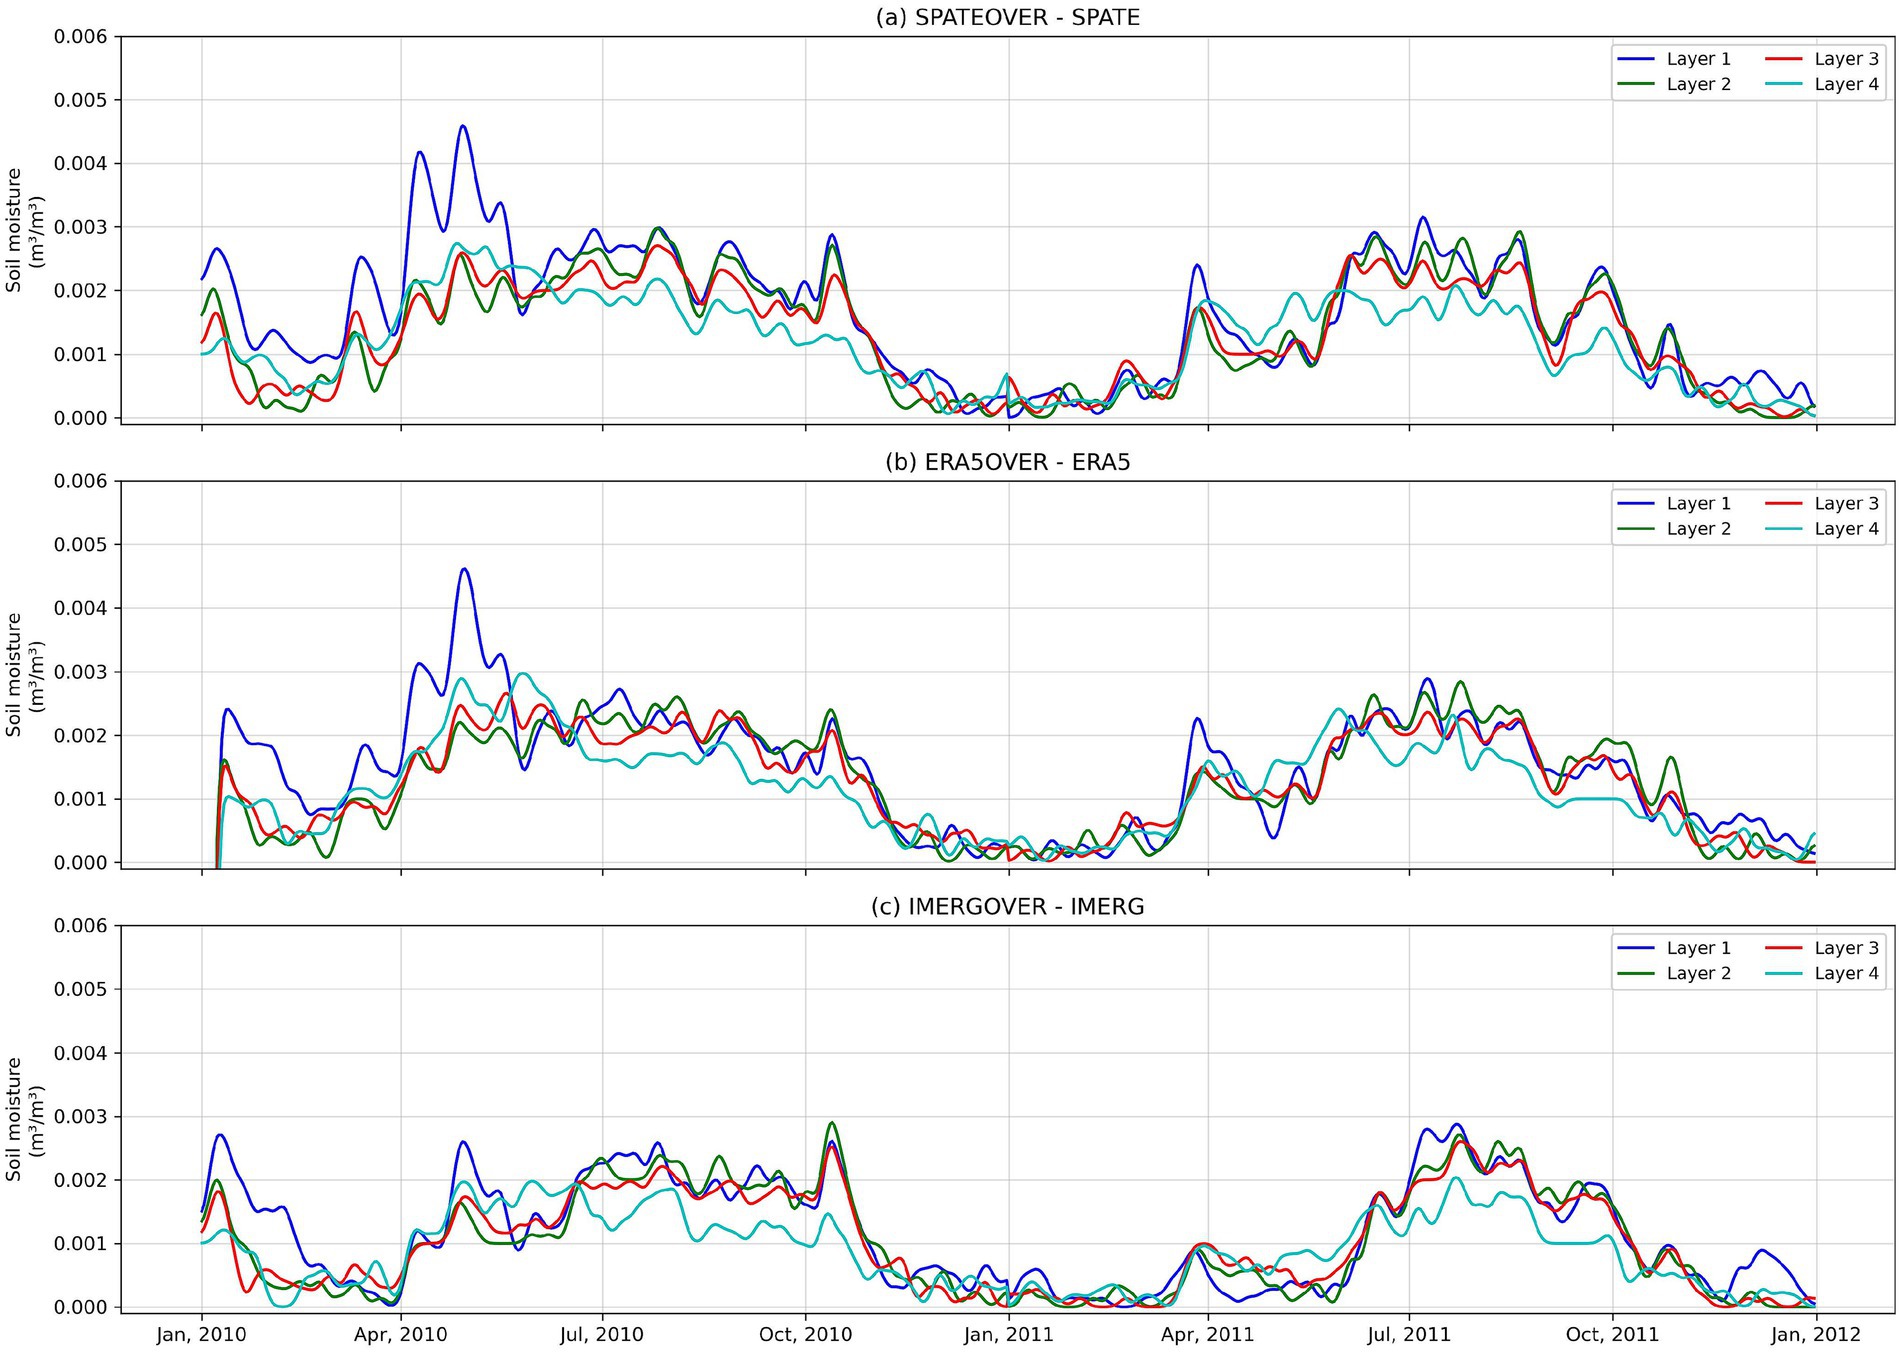
Figure 11. Time series of basin-averaged soil moisture (m3/m3). Layers 1 to 4 represent different soil depths: 10 cm (blue), 30 cm (green), 60 cm (red), and 100 cm (cyan), respectively. (a) SPATEOVER minus SPATE, (b) ERA5OVER minus ERA5, and (c) IMERGOVER minus IMERG.
4 Discussion
Accurate precipitation data is crucial for hydrological application. In this study, we investigated the effects of different precipitation inputs on simulated streamflow for a distributed hydrological model, applied to the Irrawaddy River Basin, a flood-prone region. Specifically, we compared the results from three representative precipitation products—IMERG (satellite-based), ERA5-Land (reanalysis-based), and spateGAN-ERA5 (machine learning-based dataset). We found that simulated streamflow driven by ERA5-Land and spateGAN-ERA5 precipitation shows significant overestimation compared to observed streamflow, primarily due to its overestimation of precipitation. A similar wet bias in ERA5-Land data has also been observed in other wetter and more complex terrain regions, such as Turkey, the Qilian Mountains, parts of Southeast Asia such as Indonesia, as well as neighboring areas such as China and Nepal (Amjad et al., 2020; Jiang et al., 2021; Li et al., 2025; Guo et al., 2024; Jiang et al., 2021; Chang et al., 2024; Xie et al., 2022; Linarka et al., 2025; Khadka et al., 2022) and IMERG performs better compared to ERA5-Land over subregions of subtropical and tropical monsoon climate (Tang et al., 2020; Chang et al., 2024). The overestimation of ERA5-Land may related to the model physics schemes (eg., microphysics and cumulus parameterization) and the data assimilation techniques (Jiang et al., 2021). Additionally, the lack of observational data in this region, along with topographic impacts, may also contribute to this issue. The obvious overestimation need caution when applying ERA5-Land in hydrological applications in these regions. The pronounced overestimation in the northern mountainous regions, which are located upstream of the river, has a considerable impact not only on upstream flow but also on midstream and downstream streamflow simulations—areas that has large populations and agricultural production. This study further underscores the importance of the accurate of precipitation input for data-scare regions.
Besides, spateGAN-ERA5, which is based on ERA5 data and utilizes a machine learning method along with radar information to downscale reanalysis data, offers relatively higher spatial–temporal resolution compared to ERA5. In our study, the results indicate that the downscaling process causes only minor changes in precipitation amount, resulting in similar simulated streamflow between the two datasets. However, spateGAN-ERA5 exhibits notable differences in the spatial precipitation patterns compared to ERA5-Land (Figure 3), which in turn affect the performance of the overbank flow module. Where precipitation spatial patterns vary greatly, show substantial differences in surface runoff spatial patterns (Figure 12) and overbank flow intensities—for example, in sub-basin 2. We found that these significant spatial differences in surface runoff distribution, driven by precipitation spatial distributation, alter the simulated overbank flow and consequently impact streamflow simulations (Figure 5). Specifically, compared to ERA5-Land—where precipitation, e.g., is concentrated upstream along the channel in sub-basin 2, resulting in earlier runoff entering the channel—spateGAN-ERA5 precipitation is more loosely distributed across sub-basin 2, thus the runoff entering the channel relatively at downstream within this sub-basin. As water flows downstream within this sub-basin into the relatively narrow channel, overbank flow along the banks is pronounced in simulations driven by ERA5-Land, whereas it is comparatively weaker in simulations driven by spateGAN-ERA5. Even with similar overall precipitation amounts, differences in spatial distribution can have a significant impact on flood simulations.
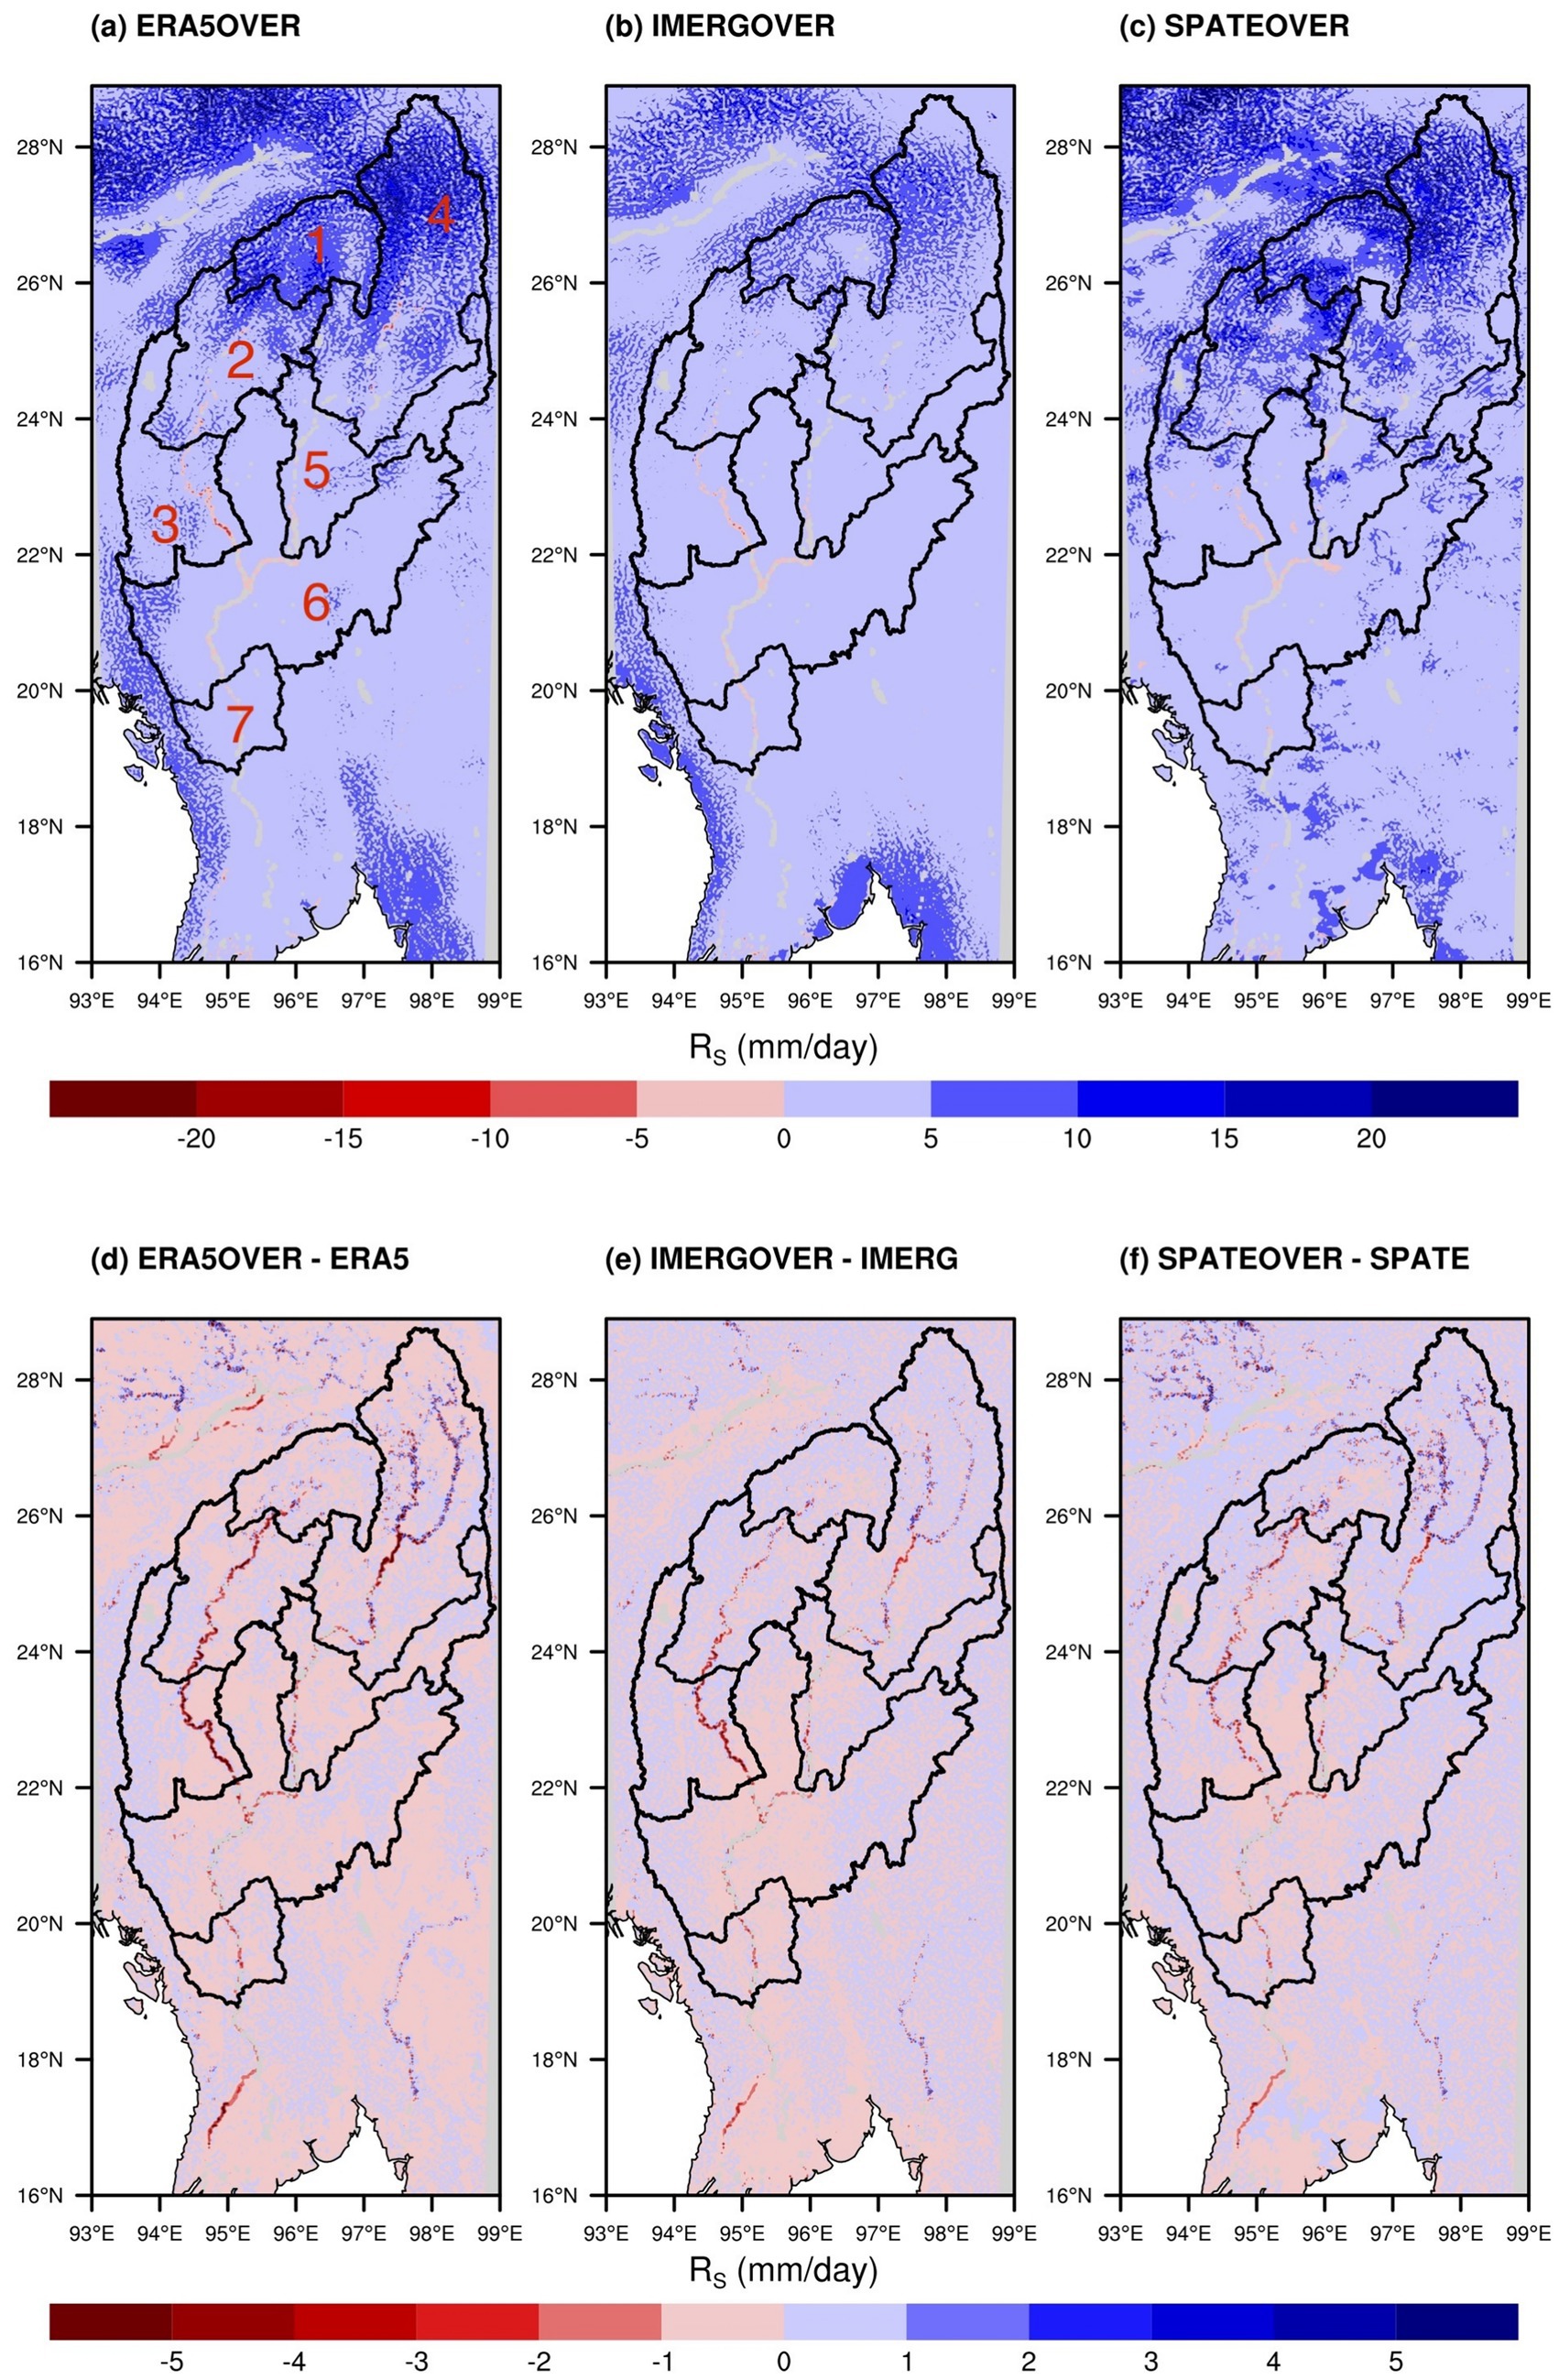
Figure 12. Spatial pattern of simulated daily average surface runoff (mm/day) in the Irrawaddy River Basin during 2010–2011 (a–c) from WRF-Hydro with the overbank flow module enabled, driven by ERA5, IMERG, and SPATE precipitation datasets; (d–f) the differences between simulations with and without the overbank flow module (overbank run minus default run). The red numbers in panel (a) indicate the basin identification numbers.
The substantial differences in the annual spatial precipitation patterns between the downscaled spateGAN-ERA5 data and ERA5-Land are likely attributable to the cumulative effects of high-frequency (10-min interval) downscaling. The machine-learning model learns the spatial distribution of precipitation bands from radar imagery, and the convective downscaling process may enhance the estimation of convective precipitation. This refinement could improve upon the relatively coarse spatial distribution in ERA5-Land, which is limited by model resolution and interpolation gaps due to sparse gauge stations. However, since the radar data used for training the machine learning model, is primarily derived from Europe, it may not be fully representative of the climate in our study region, which is largely influenced by the monsoon and has significant climatic differences. Therefore, incorporating more radar data from South Asia into the downscaling process may help to better represents the spatial pattern of precipitation in this region.
The quality of IMERG precipitation can largely be affected by the complex radiative environment created by topography and cloud, which significantly affects passive microwave retrievals, thereby impairing the accuracy of precipitation detection and evaporation of precipitation before it is detected by stations also has impacts (Xu et al., 2019). Incorporating additional meteorological station precipitation observations would further enhance the validation in this study.
In addition, we conducted streamflow simulations using both the default WRF-Hydro configuration and an enhanced model incorporating the overbank flow module. The results demonstrated that the overbank configuration effectively mitigates unrealistic peak flows in the simulated streamflow, yielding outputs that align more closely with observations. These findings are consistent with previous studies (Arnault et al., 2023; Mortey et al., 2024; Ndiaye et al., 2024), which also reported that the inclusion of overbank flow processes in WRF-Hydro substantially improves streamflow representation in African basins such as the Nzoia, Sissili-Kulpawn, and Senegal River basins. For instance, Arnault et al. (2023) implemented an overbank flow routing option in WRF-Hydro, resulting in a marked improvement in daily discharge performance, with the NSE increasing from −2.69 to 0.30 in the Nzoia Basin. Similarly, Mortey et al. (2024) employed a two-way river-land interaction configuration, improving the NSE from −0.34 to 0.47 in the Kulpawn Basin. However, these prior studies were limited to relatively small basins with only one gauging station for validation.
In contrast, our study was conducted over a large, flood-prone river basin with seven hydrological stations distributed across upstream, midstream, and downstream locations. The results revealed that incorporating the overbank flow module led to a notable improvement in streamflow simulation accuracy, with the average NSE improved from 0.09–0.77 (default) to 0.31–0.78 (modified). This underscores the broader applicability and robustness of the overbank flow module in complex basin-scale hydrological modeling. Additionally, we also investigated overbank process on water balance. The simulated changes were hydrologically consistent with the expected behavior during flood events. Specifically, during high-flow periods, water exits the river channel as river losses, some of which is temporarily stored on land surfaces (bank storage), contributing to increased ET and infiltration into the soil profile (overbank infiltration). This infiltration increases soil water storage and subsequently leads to increased underground runoff. These findings are in line with Doble et al. (2012), who highlighted that episodic aquifer recharge from overbank flooding represents a significant often overlooked component of the water balance. Furthermore, this module provides potential for simulating floodplain inundation, provided that spatially explicit flood extent data are available for validation. Overall, this study highlights the importance of incorporating overbank flow processes into distributed hydrological models such as WRF-Hydro, particularly for accurately representing streamflow dynamics and water balance components in large, flood-prone basins.
There are some limitations in this study. First, we did not conduct a calibration of WRF-Hydro parameters due to the lack of meteorological observation data. Moreover, the primary objective of this study was to evaluate the uncertainties introduced by different precipitation datasets and to assess the sensitivity of the overbank flow module. As reported by Arnault et al. (2023), traditional parameter tuning—including most sensitive parameters such as the percolation rate, runoff-infiltration partitioning, lateral hydraulic conductivity, overland roughness, retention depth, and river roughness (Manning’s coefficients) has been shown to be insufficient in fully addressing the problem of unrealistically high peak discharges. While the lack of calibration may reduce the accuracy of streamflow simulations, it allows for a controlled evaluation of the precipitation-driven and structural improvements introduced by the overbank flow module.
Second, the absence of critical observational data—such as station-based precipitation, flood occurrence locations, inundation depths, and in situ soil moisture and ET measurements—limits the ability to perform more detailed validations. Consequently, we used observed discharge as a indirect indicator to evaluate the precipitation products. Additionally, uncertainties in soil moisture and ET products, which arises from their respective input data and algorithms, may also have influence the evaluation results. For example, in this river basin, the temporal correlation coefficients between GLEAM and ChinaET is only 0.44, indicating that the two ET products respond differently to seasonal or interannual variability. The spatial correlation coefficients reaches 0.60, indicating the products shows higher agreement in spatial pattern. Although the simulated results reasonably captured the spatial pattern of soil moisture and ET products, it tended to overestimated in soil moisture content across the basin. Similar overestimation has been reported by Liu et al. (2021) in the Xijiang River Basin, potentially related to inaccuracies in soil type representation, which affect water redistribution and infiltration processes within the model (Liu et al., 2021; Zhang et al., 2023). Therefore, improving soil type characterization and parameterization should be considered in future studies to enhance the accuracy of hydrological simulations.
Furthermore, due to lack of the information of dam operation records, reservoir capacities, and irrigation withdrawals, the model does not explicitly account for these anthropogenic influences. This omission may partially explain some of the model biases—particularly the underestimation of low flows in our study and potential misattribution of error sources to precipitation inputs alone. However, compared to other major rivers in Asia, Myanmar’s river systems remain relatively unregulated (Hedley et al., 2010). Several large dams, including the Myitsone and Tamanthi projects on the mainstream of the Irrawaddy River, have been canceled or postponed (Lazarus et al., 2018; Taft and Evers, 2016). Despite the presence of several small dams (Lazarus et al., 2018), previous studies have shown that these dams exert minimal influence on streamflow—typically within ±2%—their location on low-order tributaries and the basin’s low overall degree of regulation (Phy et al., 2024). Future modeling efforts should account for its potential hydrological impacts. Additionally, the irrigation mainly happened within sub-basin 6 and 7, where most of the cropland is located. It is predominantly practiced during the dry season using canals to pump water from the river to the fields. This may influence the dry-season streamflow simulations. However, since our study focuses on the peak flows and the overbank flows that occur during the rainy season, the overall impact of irrigation on the main findings might be limited. Besides, groundwater withdrawals in the dry zone are comparatively limited, with an estimated annual recharge of approximately 4,770 Mm3 and a total withdrawal of approximately 770 Mm3 (Taft and Evers, 2016). HIC (2017) estimated and compared the annual flows under a water resources development scenario—including domestic use, irrigation, and reservoir storage totaling 20 km3—with a no-development scenario and found only a 2% difference in discharge along the Irrawaddy mainstream. Lastly, the ground water coupling (Rummler et al., 2022) and crop vegetation dynamics (Warrach-Sagi et al., 2022) may further influence model performance and should also be considered in future research to enhance the accuracy and reliability of the streamflow simulation.
In this study, we focused on the enhanced version of WRF-Hydro driven by multi-source precipitation datasets and conducted water balance analysis. Although a hindcast evaluation was not performed in the current work, improvements in the water balance—particularly in soil moisture simulation—are crucial for future flood forecasting. For example, Wyatt et al. (2020) demonstrated that in-situ soil moisture data improve seasonal streamflow forecast accuracy in rainfall-dominated watersheds. Visweshwaran et al. (2022) applied a novel Forward Sensitivity Method (FSM) for soil moisture assimilation to enhance streamflow forecasting. Moreover, soil moisture is widely used in machine learning-based models to train and improve streamflow forecasts (Kumar et al., 2021). Above all, a more realistic water balance simulation is beneficial for streamflow forecasting accuracy.
5 Conclusion
This study aims to evaluate uncertainties arising from both precipitation inputs and hydrological model structure by comparing simulations driven by multi-source precipitation datasets—reanalysis, satellite-based, and machine learning–derived—and model configurations with and without an overbank flow module. This assessment is conducted over the large, flood-prone, and poorly gauged Irrawaddy River Basin during 2010–2011. Specifically, we:
1. Evaluated streamflow simulation accuracy using three precipitation datasets. IMERG-driven simulations achieved NSE values ranging from 0.69 to 0.89, corresponding to improvements of approximately 150–190% relative to spateGAN-ERA5 (−0.22 to 0.58) and 235–260% relative to ERA5-Land (−0.11 to 0.34), respectively.
2. Assessed the impact of incorporating the overbank flow module. The modified model with enabled overbank flow showed consistent improvements over the default model. The average NSE improved from 0.09–0.77 (default) to 0.31–0.78 (modified), representing an improvement of approximately 100 to 245%. The most significant NSE improvement occurred at Station 6 (ERA5-Land), where NSE increased from 0.03 to 0.80, indicating enhanced accuracy and reliability.
3. Analyzed water balance component changes due to model modifications. The water balance analysis reveals that incorporating the overbank flow module reduces surface runoff (4.6%), accompanied by an increase in soil moisture storage (2.2%), and slightly enhancing underground runoff and ET during the rainy period. After the end of the rainy period, the increase soil moisture storage gradually contributes to an increase in surface runoff.
Overall, these results highlight the substantial influence of both accurate precipitation inputs and model enhancements (such as overbank flow module) on improving hydrological simulations in a large river basin. These findings underscore the importance of incorporating such elements to better represent complex hydrological processes, particularly in flood-prone regions, and strengthen its forecasting capability for water resource management. For future work, building upon the improved hydrological model incorporating the overbank flow module, future research will focus on integrating seasonal-to-subseasonal (S2S) forecast data to investigate of the modified model’s capability in hydrological predictions and flood risk early warning in the Irrawaddy basin. Additionally, the more comprehensive representation of water cycle processes in the modified model provides an opportunity for coupled WRF-Hydro simulations with more realstic water cycle modeling and advance our understanding of hydrological dynamics in complex river basins.
Data availability statement
The raw data supporting the conclusions of this article will be made available by the authors, without undue reservation.
Author contributions
QS: Methodology, Data curation, Visualization, Conceptualization, Validation, Writing – original draft, Software, Investigation, Formal analysis, Writing – review & editing. JA: Methodology, Conceptualization, Supervision, Writing – review & editing, Investigation, Formal analysis, Writing – original draft, Software. PL: Project administration, Writing – review & editing, Funding acquisition, Writing – original draft, Supervision. LG: Writing – review & editing, Writing – original draft, Data curation. HK: Funding acquisition, Supervision, Writing – review & editing, Project administration, Writing – original draft.
Funding
The author(s) declare that financial support was received for the research and/or publication of this article. QS is supported financially by the China Scholarship Council (CSC). JA is supported financially by German Research Foundation (DFG) through funding of the COSMIC Sense project. This article was supported by the Karlsruhe Institute of Technology (KIT) through its Open Access Publishing Fund.
Acknowledgments
The simulations were conducted on the Linux cluster at KIT/ IMK-IFU in Garmisch-Partenkirchen. We would like to thank the two reviewers for their valuable comments and constructive suggestions, which have helped us improve the quality of this manuscript.
Conflict of interest
The authors declare that the research was conducted in the absence of any commercial or financial relationships that could be construed as a potential conflict of interest.
Generative AI statement
The authors declare that no Gen AI was used in the creation of this manuscript.
Any alternative text (alt text) provided alongside figures in this article has been generated by Frontiers with the support of artificial intelligence and reasonable efforts have been made to ensure accuracy, including review by the authors wherever possible. If you identify any issues, please contact us.
Publisher’s note
All claims expressed in this article are solely those of the authors and do not necessarily represent those of their affiliated organizations, or those of the publisher, the editors and the reviewers. Any product that may be evaluated in this article, or claim that may be made by its manufacturer, is not guaranteed or endorsed by the publisher.
Supplementary material
The Supplementary material for this article can be found online at: https://www.frontiersin.org/articles/10.3389/fclim.2025.1644481/full#supplementary-material
Footnotes
References
Amjad, M., Yilmaz, M. T., Yucel, I., and Yilmaz, K. K. (2020). Performance evaluation of satellite-and model-based precipitation products over varying climate and complex topography. J. Hydrol. 584:124707. doi: 10.1016/j.jhydrol.2020.124707
Amorim, J. D. S., Viola, M. R., Junqueira, R., Oliveira, V. A. D., and Mello, C. R. D. (2020). Evaluation of satellite precipitation products for hydrological modeling in the Brazilian Cerrado biome. Water 12:2571. doi: 10.3390/w12092571
Arnault, J., Mwanthi, A. M., Portele, T., Li, L., Rummler, T., Fersch, B., et al. (2023). Regional water cycle sensitivity to afforestation: synthetic numerical experiments for tropical Africa. Front. Clim. 5:1233536. doi: 10.3389/fclim.2023.1233536
Besset, M., Anthony, E. J., Dussouillez, P., and Goichot, M. (2017). The impact of cyclone nargis on the ayeyarwady (irrawaddy) river delta shoreline and nearshore zone (myanmar): towards degraded delta resilience? Comptes. Rendus. Géoscience. 349, 238–247. doi: 10.1016/j.crte.2017.09.002
Boretti, A., and Rosa, L. (2019). Reassessing the projections of the world water development report. NPJ Clean Water. 2:15. doi: 10.1038/s41545-019-0039-9
Chang, Y., Qi, Y., and Wang, Z. (2024). Comprehensive evaluation of IMERG, ERA5-land and their fusion products in the hydrological simulation of three karst catchments in Southwest China. J. Hydrol. Regional Stud. 52:101671. doi: 10.1016/j.ejrh.2024.101671
Chen, D., Li, X., Saito, Y., Liu, J. P., Duan, Y., Liu, S., et al. (2020). Recent evolution of the Irrawaddy (Ayeyarwady) Delta and the impacts of anthropogenic activities: a review and remote sensing survey. Geomorphology 365:107231. doi: 10.1016/j.geomorph.2020.107231
Cho, K., and Kim, Y. (2022). Improving streamflow prediction in the WRF-hydro model with LSTM networks. J. Hydrol. 605:127297. doi: 10.1016/j.jhydrol.2021.127297
Doble, R. C., Crosbie, R. S., Smerdon, B. D., Peeters, L., and Cook, F. J. (2012). Groundwater recharge from overbank floods. Water Resour. Res. 48:1441. doi: 10.1029/2011WR011441
Dorigo, W., Wagner, W., Albergel, C., Albrecht, F., Balsamo, G., Brocca, L., et al. (2017). ESA CCI soil moisture for improved earth system understanding: state-of-the art and future directions. Remote Sens. Environ. 203, 185–215. doi: 10.1016/j.rse.2017.07.001
Edirisinghe, M., Alahacoon, N., Ranagalage, M., and Murayama, Y. (2023). Long‐term rainfall variability and trends for climate risk management in the summer monsoon region of Southeast Asia. Adv. Meteorol. 2023:2693008. doi: 10.1155/2023/2693008
Ferguson, G., and Gleeson, T. (2012). Vulnerability of coastal aquifers to groundwater use and climate change. Nat. Clim. Chang. 2, 342–345. doi: 10.1038/nclimate1413
Fersch, B., Senatore, A., Adler, B., Arnault, J., Mauder, M., Schneider, K., et al. (2020). High-resolution fully coupled atmospheric–hydrological modeling: a cross-compartment regional water and energy cycle evaluation. Hydrol. Earth Syst. Sci. 24, 2457–2481. doi: 10.5194/hess-24-2457-2020
Ficchì, A., Perrin, C., and Andréassian, V. (2016). Impact of temporal resolution of inputs on hydrological model performance: an analysis based on 2400 flood events. J. Hydrol. 538, 454–470. doi: 10.1016/j.jhydrol.2016.04.016
Gebrechorkos, S. H., Leyland, J., Dadson, S. J., Cohen, S., Slater, L., Wortmann, M., et al. (2024). Global-scale evaluation of precipitation datasets for hydrological modelling. Hydrol. Earth Syst. Sci. 28, 3099–3118. doi: 10.5194/hess-28-3099-2024
Glawion, L., Polz, J., Kunstmann, H., Fersch, B., and Chwala, C. (2025). Global spatio-temporal ERA5 precipitation downscaling to km and sub-hourly scale using generative AI. NPJ Clim Atmos Sci 8:219. doi: 10.1038/s41612-025-01103-y
Gochis, D.J., Barlage, M., Cabell, R., Casali, M., Dougherty, E., Dugger, A., et al. (2025). The WRF-Hydro® Modeling System Technical Description (Version 5.4). NCAR Technical Note. Available online at: https://wrf-hydro.readthedocs.io/en/latest/ (Accessed August 27, 2025).
Gochis, D. J., Barlage, M., Cabell, R., Casali, M., Dugger, A., FitzGerald, K., et al. (2020). The WRF-Hydro® modeling system technical description, (Version 5.2.0). NCAR Technical Note. 108. Available online at: https://ral.ucar.edu/sites/default/files/public/projects/wrf-hydro/technical-description-user-guide/wrf-hydrov5.2technicaldescription.pdf
Guo, C., Ning, N., Guo, H., Tian, Y., Bao, A., and De Maeyer, P. (2024). Does ERA5-land effectively capture extreme precipitation in the Yellow River Basin? Atmos. 15:1254. doi: 10.3390/atmos15101254
Hedley, P. J., Bird, M. I., and Robinson, R. A. (2010). Evolution of the Irrawaddy delta region since 1850. Geogr. J. 176, 138–149. doi: 10.1111/j.1475-4959.2009.00346.x
Hersbach, H., Bell, B., Berrisford, P., Hirahara, S., Horányi, A., Muñoz-Sabater, J., et al. (2020). The ERA5 global reanalysis. Q. J. R. Meteorol. Soc. 146, 1999–2049. doi: 10.1002/qj.3803
HIC (2017). Ayeyarwady State of the Basin Assessment (SOBA) 2017: Synthesis Report. Yangon, Myanmar: Hydro-Informatics Centre.
Higgins, S. I., Conradi, T., and Muhoko, E. (2023). Shifts in vegetation activity of terrestrial ecosystems attributable to climate trends. Nat. Geosci. 16, 147–153. doi: 10.1038/s41561-022-01114-x
Huffman, G. J., Stocker, E. F., Bolvin, D. T., Nelkin, E. J., and Tan, J. (2024). GPM IMERG Final Precipitation L3 1 day 0.1 degree x 0.1 degree V07 (Updated irregularly) [Dataset]. Boulder, Colorado, USA: Research Data Archive at the National Center for Atmospheric Research, Computational and Information Systems Laboratory.
Humphrey, V., Berg, A., Ciais, P., Gentine, P., Jung, M., Reichstein, M., et al. (2021). Soil moisture–atmosphere feedback dominates land carbon uptake variability. Nature 592, 65–69. doi: 10.1038/s41586-021-03325-5
Hussain, Y., Satgé, F., Hussain, M. B., Martinez-Carvajal, H., Bonnet, M. P., Cárdenas-Soto, M., et al. (2018). Performance of CMORPH, TMPA, and PERSIANN rainfall datasets over plain, mountainous, and glacial regions of Pakistan. Theor. Appl. Climatol. 131, 1119–1132. doi: 10.1007/s00704-016-2027-z
Jam-Jalloh, S. U., Liu, J., Wang, Y., and Liu, Y. (2024). Coupling WRF with HEC-HMS and WRF-hydro for flood forecasting in typical mountainous catchments of northern China. Nat. Hazards Earth Syst. Sci. 24, 3155–3172. doi: 10.5194/nhess-24-3155-2024
Jia, Y., Li, C., Yang, H., Yang, W., and Liu, Z. (2022). Assessments of three evapotranspiration products over China using extended triple collocation and water balance methods. J. Hydrol. 614:128594. doi: 10.1016/j.jhydrol.2022.128594
Jiang, Q., Li, W., Fan, Z., He, X., Sun, W., Chen, S., et al. (2021). Evaluation of the ERA5 reanalysis precipitation dataset over Chinese mainland. J. Hydrol. 595:125660. doi: 10.1016/j.jhydrol.2020.125660
Khadka, A., Wagnon, P., Brun, F., Shrestha, D., Lejeune, Y., and Arnaud, Y. (2022). Evaluation of ERA5-land and HARv2 reanalysis data at high elevation in the upper Dudh Koshi basin (Everest region, Nepal). J. Appl. Meteorol. Climatol. 61, 931–954. doi: 10.1175/JAMC-D-21-0091.1
Kumar, A., Ramsankaran, R. A. A. J., Brocca, L., and Muñoz-Arriola, F. (2021). A simple machine learning approach to model real-time streamflow using satellite inputs: demonstration in a data scarce catchment. J. Hydrol. 595:126046. doi: 10.1016/j.jhydrol.2021.126046
Lane, R. A., Coxon, G., Freer, J. E., Wagener, T., Johnes, P. J., Bloomfield, J. P., et al. (2019). Benchmarking the predictive capability of hydrological models for river flow and flood peak predictions across over 1000 catchments in Great Britain. Hydrol. Earth Syst. Sci. 23, 4011–4032. doi: 10.5194/hess-23-4011-2019
Lazarus, K. M., Corbett, M., Cardinale, P., Lin, N. S., Noeske, T., and Kumar, V. (2018). Strategic Environmental Assessment of the Myanmar Hydropower Sector. Washington, DC: International Finance Corporation.
Le, M. H., Lakshmi, V., Bolten, J., and Du Bui, D. (2020). Adequacy of satellite-derived precipitation estimate for hydrological modeling in Vietnam basins. J. Hydrol. 586:124820. doi: 10.1016/j.jhydrol.2020.124820
Lehner, B., Verdin, K., and Jarvis, A. (2008). New global hydrography derived from spaceborne elevation data. EOS Trans. Am. Geophys. Union 89, 93–94. doi: 10.1029/2008EO100001
Li, D., Christakos, G., Ding, X., and Wu, J. (2018). Adequacy of TRMM satellite rainfall data in driving the SWAT modeling of Tiaoxi catchment (Taihu lake basin, China). J. Hydrol. 556, 1139–1152. doi: 10.1016/j.jhydrol.2017.01.006
Li, Y., Yang, M., Wan, G., Man, Y., and Wang, X. (2025). Coupled statistical analysis and hydrological simulation to evaluate the performance of satellite and reanalysis precipitation products in the Qilian Mountains, Northwest China. Clim. Dyn. 63:134. doi: 10.1007/s00382-025-07607-w
Linarka, U. A., Tambunan, M. P., Kusratmoko, E., and Latifah, A. L. (2025). “Assessing the spatiotemporal precipitation trends from ERA5-Land over Indonesia region” in IOP Conference Series: Earth and Environmental Science (Bristol, UK: IOP Publishing), 012046.
Liu, S., Wang, J., Wei, J., and Wang, H. (2021). Hydrological simulation evaluation with WRF-hydro in a large and highly complicated watershed: the Xijiang River basin. J Hydrol. Regional Stud. 38:100943. doi: 10.1016/j.ejrh.2021.100943
Luo, X., Yuan, X., Guo, Z., Lu, Y., Li, C., and Peng, L. (2025). Hydrological response of the Irrawaddy River under climate change based on CV-LSTM model. Water 17:134. doi: 10.3390/w17040134
Maina, F. Z., Siirila-Woodburn, E. R., and Vahmani, P. (2020). Sensitivity of meteorological-forcing resolution on hydrologic variables. Hydrol. Earth Syst. Sci. 24, 3451–3474. doi: 10.5194/hess-24-3451-2020
Martens, B., Miralles, D. G., Lievens, H., Van Der Schalie, R., De Jeu, R. A., Fernández-Prieto, D., et al. (2017). GLEAM v3: satellite-based land evaporation and root-zone soil moisture. Geosci. Model Dev. 10, 1903–1925. doi: 10.5194/gmd-10-1903-2017
Melsen, L. A., and Guse, B. (2019). Hydrological drought simulations: how climate and model structure control parameter sensitivity. Water Resour. Res. 55, 10527–10547. doi: 10.1029/2019WR025230
Messager, M. L., Lehner, B., Grill, G., Nedeva, I., and Schmitt, O. (2016). Estimating the volume and age of water stored in global lakes using a geo-statistical approach. Nat. Commun. 7:13603. doi: 10.1038/ncomms13603
Miralles, D. G., Holmes, T. R. H., De Jeu, R. A. M., Gash, J. H., Meesters, A. G. C. A., and Dolman, A. J. (2011). Global land-surface evaporation estimated from satellite-based observations. Hydrol. Earth Syst. Sci. 15, 453–469. doi: 10.5194/hess-15-453-2011
Moriasi, D. N., Arnold, J. G., Van Liew, M. W., Binger, R. L., Harmel, R. D., and Veith, T. L. (2007). Model evaluation guidelines for systematic quantification of accuracy in watershed simulations. Trans. ASABE 50, 885–900. doi: 10.13031/2013.23153
Mortey, E. M., Arnault, J., Inoussa, M. M., Madougou, S., Annor, T., Laux, P., et al. (2024). Regional climate response to land cover change in tropical West Africa: a numerical sensitivity experiment with ESA land cover data and advanced WRF-Hydro. Front. Water 6:1372333. doi: 10.3389/frwa.2024.1372333
Mtibaa, S., and Asano, S. (2022). Hydrological evaluation of radar and satellite gauge-merged precipitation datasets using the SWAT model: case of the Terauchi catchment in Japan. J. Hydrol. Regional Stud. 42:101134. doi: 10.1016/j.ejrh.2022.101134
Muñoz-Sabater, J., Dutra, E., Agustí-Panareda, A., Albergel, C., Arduini, G., Balsamo, G., et al. (2021). ERA5-land: a state-of-the-art global reanalysis dataset for land applications. Earth Syst. Sci. Data 13, 4349–4383. doi: 10.5194/essd-13-4349-2021
Nash, J. E., and Sutcliffe, J. V. (1970). River flow forecasting through conceptual models part I—a discussion of principles. J. Hydrol. 10, 282–290. doi: 10.1016/0022-1694(70)90255-6
Ndiaye, A., Arnault, J., Mbaye, M. L., Sy, S., Camara, M., Lawin, A. E., et al. (2024). Potential contribution of land cover change on flood events in the Senegal River basin. Front. Water 6:1447577. doi: 10.3389/frwa.2024.1447577
Nie, Y., and Sun, J. (2020). Evaluation of high-resolution precipitation products over Southwest China. J. Hydrometeorol. 21, 2691–2712. doi: 10.1175/JHM-D-20-0045.1
Ochoa‐Rodriguez, S., Wang, L. P., Willems, P., and Onof, C. (2019). A review of radar‐rain gauge data merging methods and their potential for urban hydrological applications. Water Resour. Res. 55, 6356–6391. doi: 10.1029/2018WR02333
Pang, Z., Wei, Q., Liu, J., Fu, J., Li, L., and Cao, D. (2019). Remote Sensing Investigation of Land Use Status of Irrawaddy River Basin. Yokohama, Japan: IGARSS 2019–2019 IEEE International Geoscience and Remote Sensing Symposium, 6409–6412.
Phy, S. R., Arias, M. E., Lee, E., Jayasinghe, S., Laverde-Barajas, M., and Koster, R. D. (2024). Recent streamflow variability linked to climate, dam operations, and land cover change in the Irrawaddy River, Southeast Asia [Preprint]. SSRN. Available online at: https://papers.ssrn.com/sol3/papers.cfm?abstract_id=5286858 (Accessed August 27, 2025).
Preimesberger, W., Scanlon, T., Su, C. H., Gruber, A., and Dorigo, W. (2020). Homogenization of structural breaks in the global ESA CCI soil moisture multisatellite climate data record. IEEE Trans. Geosci. Remote Sens. 59, 2845–2862. doi: 10.1109/TGRS.2020.3012896
Qing, Y., Wang, S., Ancell, B. C., and Yang, Z. L. (2022). Accelerating flash droughts induced by the joint influence of soil moisture depletion and atmospheric aridity. Nat. Commun. 13:1139. doi: 10.1038/s41467-022-28752-4
Renard, B., Kavetski, D., Kuczera, G., Thyer, M., and Franks, S. W. (2010). Understanding predictive uncertainty in hydrologic modeling: the challenge of identifying input and structural errors. Water Resour. Res. 46:W05521. doi: 10.1029/2009WR008328
Rodell, M., Houser, P. R., Jambor, U. E. A., Gottschalck, J., Mitchell, K., Meng, C. J., et al. (2004). The global land data assimilation system. Bull. Am. Meteorol. Soc. 85, 381–394. doi: 10.1175/BAMS-85-3-381
Rogelis, M. C., and Werner, M. (2018). Streamflow forecasts from WRF precipitation for flood early warning in mountain tropical areas. Hydrol. Earth Syst. Sci. 22, 853–870. doi: 10.5194/hess-22-853-2018
Rummler, T., Arnault, J., Gochis, D., and Kunstmann, H. (2019). Role of lateral terrestrial water flow on the regional water cycle in a complex terrain region: investigation with a fully coupled model system. J. Geophys. Res. Atmos. 124, 507–529. doi: 10.1029/2018JD029004
Rummler, T., Wagner, A., Arnault, J., and Kunstmann, H. (2022). Lateral terrestrial water fluxes in the LSM of WRF-hydro: benefits of a 2D groundwater representation. Hydrol. Process. 36:e14510. doi: 10.1002/hyp.14510
Salazar-Martínez, D., Holwerda, F., Holmes, T. R., Yépez, E. A., Hain, C. R., Alvarado-Barrientos, S., et al. (2022). Evaluation of remote sensing-based evapotranspiration products at low-latitude eddy covariance sites. J. Hydrol. 610:127786. doi: 10.1016/j.jhydrol.2022.127786
Shuai, P., Chen, X., Mital, U., Coon, E. T., and Dwivedi, D. (2022). The effects of spatial and temporal resolution of gridded meteorological forcing on watershed hydrological responses. Hydrol. Earth Syst. Sci. 26, 2245–2276. doi: 10.5194/hess-26-2245-2022
Sirisena, T. A. J. G., Maskey, S., Bamunawala, J., and Ranasinghe, R. (2021). Climate change and reservoir impacts on 21st-century streamflow and fluvial sediment loads in the Irrawaddy River, Myanmar. Front. Earth Sci. 9:644527. doi: 10.3389/feart.2021.644527
Song, X., Zhang, J., Zhan, C., Xuan, Y., Ye, M., and Xu, C. (2015). Global sensitivity analysis in hydrological modeling: review of concepts, methods, theoretical framework, and applications. J. Hydrol. 523, 739–757. doi: 10.1016/j.jhydrol.2015.02.013
Taft, L., and Evers, M. (2016). A review of current and possible future human–water dynamics in Myanmar's river basins. Hydrol. Earth Syst. Sci. 20, 4913–4928. doi: 10.5194/hess-20-4913-2016
Tang, G., Clark, M. P., Papalexiou, S. M., Ma, Z., and Hong, Y. (2020). Have satellite precipitation products improved over last two decades? A comprehensive comparison of GPM IMERG with nine satellite and reanalysis datasets. Remote Sens. Environ. 240:111697. doi: 10.1016/j.rse.2020.111697
Troin, M., Arsenault, R., Martel, J. L., and Brissette, F. (2018). Uncertainty of hydrological model components in climate change studies over two Nordic Quebec catchments. J. Hydrometeorol. 19, 27–46. doi: 10.1175/JHM-D-17-0002.1
United Nations. (2024). Myanmar flood situation report 3 (27 September 2024). United Nations in Myanmar. Available online at: https://myanmar.un.org/en/279958-myanmar-flood-situation-report-3-27-september-2024 (Accessed March 15, 2025)
Varlas, G., Katsafados, P., Papadopoulos, A., and Korres, G. (2018). Implementation of a two-way coupled atmosphere-ocean wave modeling system for assessing air-sea interaction over the Mediterranean Sea. Atmos. Res. 208, 201–217. doi: 10.1016/j.atmosres.2017.08.019
Visweshwaran, R., Ramsankaran, R. A. A. J., Eldho, T. I., and Lakshmivarahan, S. (2022). Sensitivity-based soil moisture assimilation for improved streamflow forecast using a novel forward sensitivity method (FSM) approach. Water Resour. Res. 58:e2021WR031092. doi: 10.1029/2021WR031092
Wang, N., Liu, W., Sun, F., Yao, Z., Wang, H., and Liu, W. (2020). Evaluating satellite-based and reanalysis precipitation datasets with gauge-observed data and hydrological modeling in the Xihe River basin, China. Atmos. Res. 234:104746. doi: 10.1016/j.atmosres.2019.104746
Warrach-Sagi, K., Ingwersen, J., Schwitalla, T., Troost, C., Aurbacher, J., Jach, L., et al. (2022). Noah-MP with the generic crop growth model Gecros in the WRF model: effects of dynamic crop growth on land-atmosphere interaction. J. Geophys. Res. Atmos. 127:e2022JD036518. doi: 10.1029/2022JD036518
Wedajo, G. K., Muleta, M. K., and Awoke, B. G. (2021). Performance evaluation of multiple satellite rainfall products for Dhidhessa River basin (DRB), Ethiopia. Atmos. Meas. Tech. 14, 2299–2316. doi: 10.5194/amt-14-2299-2021
Wetterhall, F., He, Y., Cloke, H., and Pappenberger, F. (2011). Effects of temporal resolution of input precipitation on the performance of hydrological forecasting. Adv. Geosci. 29, 21–25. doi: 10.5194/adgeo-29-21-2011
White, R. H., Anderson, S., Booth, J. F., Braich, G., Draeger, C., Fei, C., et al. (2023). The unprecedented Pacific northwest heatwave of June 2021. Nat. Commun. 14:727. doi: 10.1038/s41467-023-36289-3
Wyatt, B. M., Ochsner, T. E., Krueger, E. S., and Jones, E. T. (2020). In-situ soil moisture data improve seasonal streamflow forecast accuracy in rainfall-dominated watersheds. J. Hydrol. 590:125404. doi: 10.1016/j.jhydrol.2020.125404
Xie, J., Liu, X., Jasechko, S., Berghuijs, W. R., Wang, K., Liu, C., et al. (2024). Majority of global river flow sustained by groundwater. Nat. Geosci. 17, 770–777. doi: 10.1038/s41561-024-01483-5
Xie, W., Yi, S., Leng, C., Xia, D., Li, M., Zhong, Z., et al. (2022). The evaluation of IMERG and ERA5-land daily precipitation over China with considering the influence of gauge data bias. Sci. Rep. 12:8085. doi: 10.1038/s41598-022-12307-0
Xu, F., Guo, B., Ye, B., Ye, Q., Chen, H., Ju, X., et al. (2019). Systematical evaluation of GPM IMERG and TRMM 3B42V7 precipitation products in the Huang-Huai-Hai plain, China. Remote Sens 11:697. doi: 10.3390/rs11060697
Xu, Y., Lin, K., Hu, C., Wang, S., Wu, Q., Zhang, J., et al. (2024). Interpretable machine learning on large samples for supporting runoff estimation in ungauged basins. J. Hydrol. 639:131598. doi: 10.1016/j.jhydrol.2024.131598
Yang, Y., Wang, G., Wang, L., Yu, J., and Xu, Z. (2014). Evaluation of gridded precipitation data for driving SWAT model in area upstream of three gorges reservoir. PLoS One 9:e112725. doi: 10.1371/journal.pone.0112725
Yu, T., Bao, A., Zhang, J., Tu, H., Chen, B., De Maeyer, P., et al. (2023). Evaluating surface soil moisture characteristics and the performance of remote sensing and analytical products in Central Asia. J. Hydrol. 617:128921. doi: 10.1016/j.jhydrol.2022.128921
Yu, L., Qiu, G. Y., Yan, C., Zhao, W., Zou, Z., Ding, J., et al. (2022). A global terrestrial evapotranspiration product based on the three-temperature model with fewer input parameters and no calibration requirement. Earth Syst. Sci. Data 14, 3673–3693. doi: 10.5194/essd-14-3673-2022 2022.
Zhang, Z., Laux, P., Baade, J., Arnault, J., Wei, J., Wang, X., et al. (2023). Impact of alternative soil data sources on the uncertainties in simulated land-atmosphere interactions. Agric. For. Meteorol. 339:109565. doi: 10.1016/j.agrformet.2023.109565
Zhang, Y., Ye, A., Li, J., Nguyen, P., Analui, B., Hsu, K., et al. (2025). Improve streamflow simulations by combining machine learning pre-processing and post-processing. J. Hydrol. 655:132904. doi: 10.1016/j.jhydrol.2025.132904
Zhao, Y., Xu, C., Liu, Y., An, W., and Guo, Z. (2023). Irrawaddy River experienced more frequent hydrological drought events with global warming: evidence from a 400-year tree ring oxygen isotope record. Catena 232:107455. doi: 10.1016/j.catena.2023.107455
Keywords: WRF-Hydro, precipitation, overbank flow, flood, Irrawaddy River Basin
Citation: Sun Q, Arnault J, Laux P, Glawion L and Kunstmann H (2025) Assessing the role of precipitation inputs and overbank flow in hydrological modeling: a case study of the Irrawaddy River Basin in Myanmar using WRF-Hydro. Front. Clim. 7:1644481. doi: 10.3389/fclim.2025.1644481
Edited by:
Matthew Collins, University of Exeter, United KingdomReviewed by:
Pabitra Gurung, DWB Consulting Services Ltd., CanadaGabriel Narváez, Centre National de Recherches Météorologiques (CNRM), France
Copyright © 2025 Sun, Arnault, Laux, Glawion and Kunstmann. This is an open-access article distributed under the terms of the Creative Commons Attribution License (CC BY). The use, distribution or reproduction in other forums is permitted, provided the original author(s) and the copyright owner(s) are credited and that the original publication in this journal is cited, in accordance with accepted academic practice. No use, distribution or reproduction is permitted which does not comply with these terms.
*Correspondence: Qi Sun, cWkuc3VuQGtpdC5lZHU=