 Pengfei Wang
 Xinpeng Chen
 Jinan Shen1*
- 1College of Intelligent Systems Science and Engineering, Hubei Minzu University, Enshi, China
- 2School of Cyber Science and Engineering, Sichuan University, Chengdu, China
With the advancement of Internet of Things (IoT) technology, the continuous growth of IoT systems has resulted in the accumulation of massive amounts of data. Consequently, there has been a sharp increase in network attacks, highlighting the need for enhanced network security methods. Network intrusion detection systems play a crucial role in network security. Compared to the traditional approach of using single time-series models to process traffic data, this study innovatively proposes an RMCLA (Residual Network and Multi-scale Convolution Long Short-Term Memory with Attention Mechanisms) network intrusion detection system optimized with attention and residual mechanisms. This model converts traffic data into feature images and enhances the feature contrast through histogram equalization. It then utilizes the powerful performance of convolutional networks to extract abnormal feature points. The attention module and residual network enhance the focus on abnormal points, reducing feature loss and redundancy, thereby achieving effective classification of traffic image processing. We conducted experiments on the CIC-IDS2017 and UNSW-NB15 datasets and compared our model with the latest research models. This study highlights the potential of combining deep learning techniques with advanced attention and residual networks to enhance network security in IoT environments. The results show that combining image recognition with attention-residual optimization can effectively improve network intrusion detection capabilities.
1 Introduction
With the rapid popularization of 5G and the swift development of smart devices, these devices are now ubiquitous in daily life. The IoT market is currently growing at a rate of 16.7%, and its net value is expected to exceed $300 billion. The vast amount of data transmission is accompanied by ever-present cybersecurity threats. Incidents of information leakage, hacking, and data theft have become commonplace, resulting in significant economic and privacy losses (Bataev et al., 2020).
As cyber-attack methods continue to evolve, designing the optimal ML (Machine Learning) -based NIDS (Network Intrusion Detection System) model has become a prolonged battle. Often, there’s a trade-off between high efficiency and insufficient accuracy, or adequate accuracy but inadequate time efficiency. To optimize model performance, researchers have devised many approaches such as feature selection, data augmentation, classification algorithms, and hybrid algorithms, all aimed at achieving a more effective NIDS model. With the development of deep learning (DL), the field of image processing has blossomed, and researchers have gradually begun exploring methods to apply image processing to NIDS. To convert traffic data into image features, researchers have come up with various methods. The most common approach is transforming traffic data from one-dimensional arrays into multidimensional matrices. For instance, the method used by Li et al. (2023), while highly efficient, can harm the correlation between features.
On the other hand, as noted by Rajaby and Sayedi (2022), the use of Fourier domain-based image transformation for big data may introduce complexity issues, increasing the difficulty of model training and reducing the performance of prediction results. Additionally, solving traffic detection problems through image processing still has substantial room for improvement. Simple lCNN (Convolutional Neural Network) layers have limited receptive fields, making it difficult to learn deeper feature relationships in traffic feature maps, ultimately constraining the model’s performance.
This paper designs a new hybrid model named RMCLA (Residual Network and Multi-scale Convolution Long Short-Term Memory with Attention Mechanisms). It uses multi-scale CNN to process traffic image features and BiLSTM (Bidirectional Long Short-Term Memory) to handle traffic time-series features. A residual network is incorporated to enhance model stability and prevent information loss and gradient explosion. Various attention hybrid modules are integrated to improve the model’s learning and filtering capabilities, increase focus on important features, and reduce the weight of less significant features. The main contributions of our work are summarized as follows:
1. The RMCLA hybrid model is designed to significantly enhance the capability of traffic image processing. The multi-scale-CNN has a much broader receptive field compared to traditional convolution layers of the same dimension, greatly improving the ability to handle traffic images. By using BiLSTM to learn the temporal features of traffic, the issue of losing feature association information during the conversion of traffic data to traffic images is resolved.
2. Histogram equalization is applied during the mapping of traffic features to traffic feature images, greatly increasing the contrast between traffic image features. This makes data features clearer and easier for the model to extract and learn.
3. Residual network modules and various hybrid attention modules are added to optimize the model. The residual network enhances the model’s stability and ensures no loss of information. The channel-spatial attention and temporal attention modules effectively address the balance of different channel features during image processing, accurately capturing both local important information and global feature information, and simultaneously strengthening the learning of data feature connections. The self-attention module reduces the model’s parameter dimensions, thereby improving the overall convergence capability of the model.
The remainder of this paper is organized as follows: Section 2 provides a brief overview of related topics. Section 3 elaborates on the network structure of the RMCLA model in detail. Section 4 introduces the experimental setup and dataset processing. Section 5 analyzes the experimental results. Finally, Section 6 concludes the paper.
2 Related works
Traditional machine learning techniques have been widely applied in the detection of anomalous network traffic. Approaches such as naive Bayes (Huang, 2022; Zhang et al., 2018), k-means (Wang L. et al., 2021; Khaoula and Mohamed, 2022), random forest (Farnaaz and Jabbar, 2016; Zhang et al., 2008), support vector machine (Zhang et al., 2019; Ikram and Kumar, 2017), XGBoost (Le et al., 2022; Talukder et al., 2022), and decision tree (Kevric et al., 2017; Louk and Tama, 2022) have demonstrated success in the detection of anomalous network traffic. With the advancement of internet technology, the scale of network traffic has significantly increased and continues to grow rapidly. In the face of such vast and complex network traffic, traditional machine learning techniques are becoming increasingly limited, such as the limitation of computing power, which makes it difficult to deal with high-dimensional complex data, and the dependence on data structure has poor scalability and generalization ability. With the success of deep learning-based image processing methods in various fields, a considerable number of image processing-based methods have emerged in the field of traffic detection.
Chen et al. (2020) introduced a convolution-based model for anomalous traffic detection. In their approach, they input features into a module consisting of two convolutional layers and classified them through a fully connected layer. The model achieved an accuracy of 96.5% on the CIC-IDS2017 dataset. Their model is characterized by its simplicity, utilizing only two convolutional layers to capture spatial features, but it has the limitation of a narrower receptive field.
Li et al. (2020) proposed a deep learning intrusion detection method utilizing a multi-CNN fusion approach. This method comprehensively learns spatial features at multiple scales and demonstrates high accuracy and low complexity on the NSLKDD dataset.
Sun et al. (2020) compared CNN image processing-based models with traditional traffic sequence processing-based models. They proved that CNN image processing methods have significant advantages over traditional traffic sequence processing. They then combined the two structures, first using CNN to process traffic feature maps and then employing LSTM for temporal feature extraction. The hybrid model was shown to have a clear advantage over single processing models, achieving an accuracy of 98.67% on the CIC-IDS2017 dataset. However, the design of the model was overly simplistic, merely performing a straightforward concatenation without further exploiting the advantages of the hybrid model.
Bowen et al. (2023) introduced a hybrid model that first uses CNN to process image features, then compresses the feature images into sequence strings for BiLSTM to learn the relationships between features. This method yielded positive results across five datasets, including UNSW-NB15 and CIC-IDS2017. Compared to the previous research, this approach included more pooling layers, batch normalization layers, and two BiLSTM layers to learn sequence relationships. However, the use of CNN layers was rather thin, resulting in a simplistic treatment of traffic image features.
Halbouni et al. (2022) developed a hybrid CNN-LSTM model that converts features into traffic feature maps, which are then inputted into the CNN. After extracting spatial relationships from the feature maps, LSTM layers are used to capture the sequence relationships between features. Unlike the previous study, this module is repeated three times, incrementally increasing the kernel size each time to expand the model’s receptive field. The final prediction results are output through a DNN layer and softmax. This model’s effectiveness was validated on the CIC-IDS2017, UNSW-NB15, and WSN-DS datasets. The issue is that the cross-feature extraction might result in information loss and lacks methods to filter between minor and major features.
Relevant research shows that traditional sequence models for extracting traffic features are far less effective than converting traffic data into traffic feature maps and extracting features through CNN convolution. Furthermore, when learning relationships between traffic image features, traditional CNN convolution has limitations. It cannot capture and understand global and local features effectively, and it struggles to learn their relationships, leaving substantial room for improvement.
This paper proposes the RMCLA model, which enhances the extraction capability of traffic image features through multi-scale convolution and reinforces the relationship between local and global features using attention mechanisms. It assigns weights to important and less significant features.
3 Methodology
The overall structure of the RMCLA model is shown in Figure 1. It mainly consists of two MCL (Multi-scale Convolutional Long Short-Term Memory) modules, two Attention modules, two ResNet (Residual Network) residual networks, a fully connected layer, and a Softmax layer. The MCL module includes parallel multi-scale CNN layers and BiLSTM layers, with the dimensions of the two MCL modules increasing sequentially. To enhance the model’s deep learning capabilities and prevent issues such as learning degradation and gradient explosion, ResNet residual network modules are incorporated. Additionally, to increase the weight of important data features and reduce the learning of secondary features, an Attention module is integrated after the MCL module. Experimental results show that the model’s detection performance surpasses most baseline models.
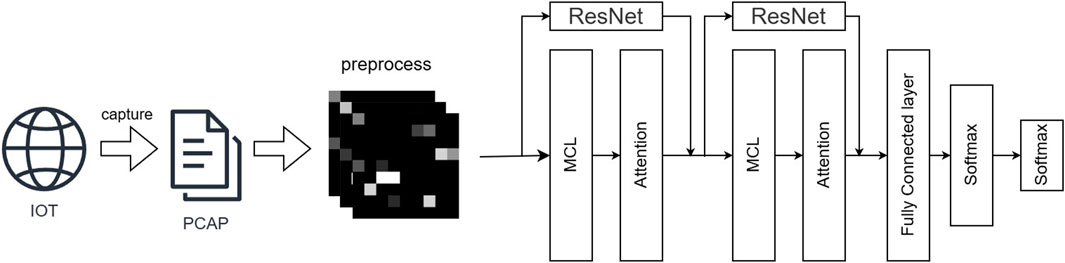
Figure 1. Overall structure of the model.
In existing research models, networks often consist solely of either LSTM or CNN, making it difficult to comprehensively capture spatiotemporal features. There are also hybrid models that incorporate both LSTM and CNN. However, these models typically first use CNN layers to extract spatial features and then use LSTM layers to extract temporal features, which can lead to insufficient temporal feature extraction and consequently affect the model’s learning capability. Additionally, the insufficient depth of the network model can reduce the ability to capture complex relationships in traffic data structures. To address these issues, we propose the MCL module, which includes parallel multi-scale CNN convolution layers and a double-layer LSTM structure, enabling more efficient capture of data features with differnt emotions as well as temporal and spatial dimensions. The multi-scale CNN convolution and double-layer LSTM structure are shown in Figure 2.
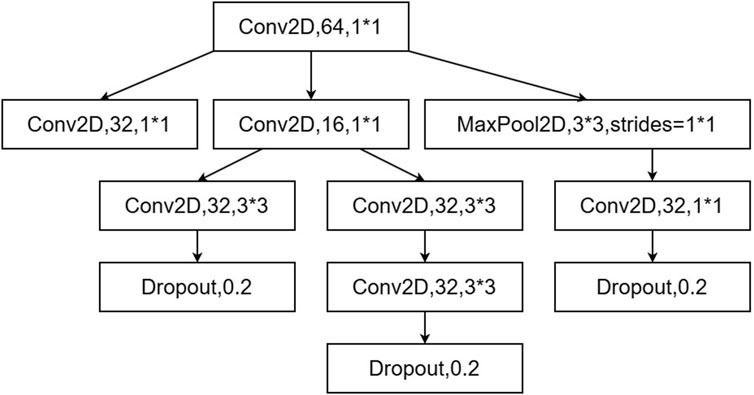
Figure 2. Structure of the multi-scale convolution.
3.1 Multi-scale convolution
CNNs are capable of capturing local features within data, meaning they can effectively handle input data with spatial correlations, such as adjacent pixels in images. Compared to traditional CNN structures, the MCL utilizes an updated multi-scale convolutional structure, which employs convolutional kernels of different sizes simultaneously to extract multi-scale features, thereby capturing more detailed information and contextual relationships. Traditional CNN structures typically use a single kernel size per layer, resulting in relatively limited feature extraction capabilities. By processing multiple convolutional kernels and pooling operations in parallel, MCL can integrate various spatial features and demonstrate stronger learning abilities in handling complex network traffic data. Compared to deeper and larger convolutional layers capable of dealing with more complex data traffic features, MCL consumes less hardware performance and requires less time. Taking the one-dimensional convolution as an example, the calculation formula is as follows Equation 1, where
In this context:
3.2 Attention mechanisms
Due to the model’s parallel simultaneous use of BiLSTM and Multi-Scale Convolutional Neural Networks (MCNN), it comprehensively extracts traffic data, making it less prone to missing crucial features. However, this design choice also introduces the challenge of parameter explosion. The model’s convergence is highly challenging; therefore, we propose an optimization scheme using attention mechanisms. After extracting spatial features with MCNN, we link the channel spatial attention mechanism to perform weight selection on the spatial features, increasing the weight of important features and reducing the attention to secondary features. After BiLSTM extracts the temporal features, a temporal attention mechanism is applied to perform weight selection on the temporal features, similar to the spatial features. Finally, to reduce the number of parameters and improve the model’s convergence capability, a self-attention mechanism is introduced. This mechanism performs another round of feature selection on temporal and spatial features, focusing more on the correlations between the data, thereby enhancing the model’s ability to learn deeper links within the data. The flow structure of these attention mechanisms is shown in Figures 3, 4.
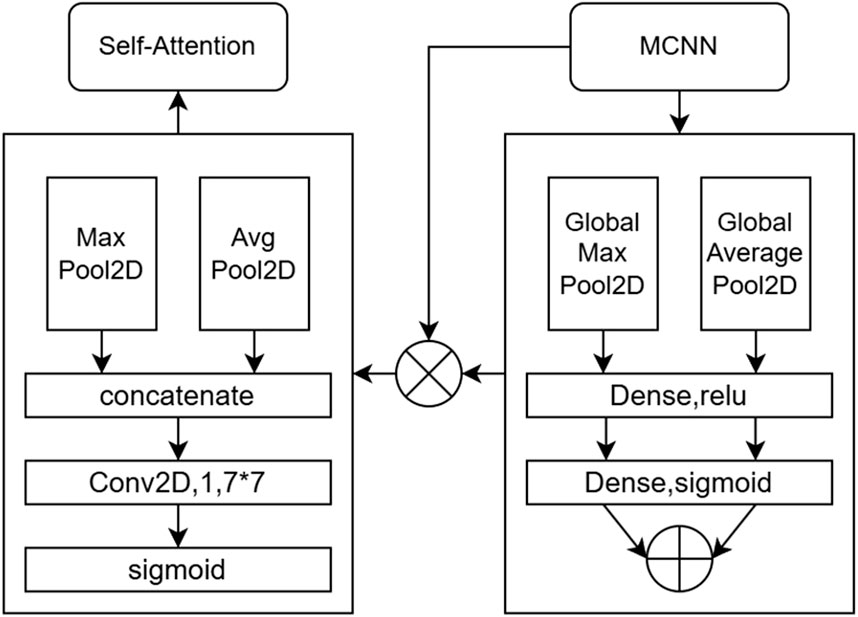
Figure 3. Channel spatial attention mechanism.
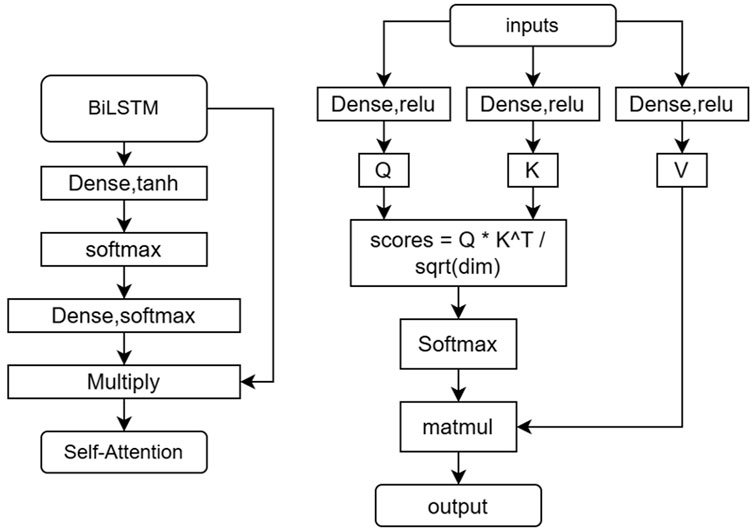
Figure 4. Temporal attention and Self-attention mechanism.
3.2.1 Channel spatial attention mechanism
The process of the channel spatial attention mechanism is as follows:
The input features
The subsequent multiplication of the channel attention weights
Finally, the spatial attention feature weights
3.2.2 Temporal attention mechanism
Here’s the translation of the process of the time attention mechanism: First, attention weights are generated through a Dense layer. The output dimension of this layer is 1, with a tanh activation function. Apply the Softmax activation function to the flattened attention to normalize the attention weights, ensuring that their sum equals 1, which enhances the model’s stability. Allocate weights to the feature dimensions. Adjust the dimensions of attention to match the input dimensions through another Dense layer, and use the Softmax activation function. This step ensures that the dimensions of the attention weights match the number of input features, and the weights are normalized through Softmax so that they can be safely applied to the input features. Use a Multiply layer to multiply the input by the attention weights to generate the weighted output.
3.2.3 Self-attention mechanism
The process structure of the self-attention mechanism is as follows: Import the input data features into three dense layers to generate the query vector (Q), key vector (K), and value vector (V). These layers use the ReLU activation function. Calculate the dot product based on the values of Q and K as shown in formula 8.
Use the softmax function to normalize the attention score matrix, enhancing the model’s stability. Finally, use the attention weights to perform a weighted sum on the value vector, obtaining the weighted sum, which represents the data features after processing by the self-attention mechanism.
3.3 Residual network
The ResNet module achieves residual connection by concatenating the input tensor and the convolutional feature map. This retains input information, prevents gradient vanishing problems, and enhances feature extraction capabilities, thereby improving the model’s performance and stability. The first convolutional layer uses 64 filters, each with a size of 3, and the output tensor’s spatial dimensions are the same as those of the input tensor. This layer extracts local features from the input tensor. Batch normalization is applied to standardize the convolutional output, stabilize data distribution, accelerate training convergence, and improve the model’s generalization ability. Subsequently, the ReLU activation function introduces non-linearity to the model, helping it learn more complex features. The Dropout layer with a dropout rate of 0.2 prevents overfitting, forcing the model to learn more robust features. The second convolutional layer uses 32 filters, each with a size of 3, maintaining the same spatial dimensions as the input tensor. Batch normalization is applied again to stabilize the data distribution. The input tensor is then concatenated with the output features of the previous convolutional layers along the last dimension. This concatenation retains input information while introducing new features. The final convolutional layer uses 64 filters to process the concatenated feature map again.
4 Experiment setup
In this section, we outline the hardware and software configurations employed for the experiments, detail the chosen dataset for our investigation, and elucidate the methodology adopted for dataset preprocessing.
4.1 Experiment configuration
Our experiments were conducted on a computer equipped with an AMD Ryzen 596,00X processor and an Nvidia GeForce RTX 4070 graphics card. The system had 32 GB of RAM and ran on the Windows 11 operating system. We implemented the proposed model using TensorFlow 2.6.0. Python 3.9.0 was chosen as the programming language for executing the program, and the main software packages utilized included Numpy, Keras, Pandas, Sklearn, and Matplotlib. The model was trained over 10 epochs, with a dropout rate of 0.4, a learning rate of 0.001, and a batch size of 32. The optimization algorithm used was Adam. The parameters of the MCNN module are referenced as shown in the structural diagram. The hidden layer of BiLSTM has 64 units. In the channel attention module, the parameters of the dense layers are channels//8 and channels, respectively. In the spatial attention module, the kernel sizes of AvgPool2D and MaxPool2D are (1, channels) with strides of (1,1). The output of the two-dimensional convolutional layer is 1, with a kernel size of 7 × 7. In the self-attention module, the dense layers for computing Q, K, and V use ReLU activation functions, with an output size of 32.
4.2 Dataset
Compared to the widely used NSL-KDD and KDD CUP99 datasets in many studies, we have chosen more recent datasets that frequently appear in the latest research findings, as they are often used to demonstrate the latest achievements in deep learning anomaly traffic detection. Additionally, this choice allows for a more direct and meaningful comparison with other state-of-the-art models across various performance metrics. The UNSW-NB15 Dataset is a compilation of raw network data packets crafted by the University of South Wales. This dataset is designed to create a blend of modern normal network activity and synthetic contemporary attack behavior. It encompasses nine types of attacks, including Fuzzers, Analysis, Backdoors, DoS, Exploits, Generic, Reconnaissance, Shellcode, and Worms, resulting in a total of 10 classes of traffic and 49 features. We have summarized and analyzed the raw data, presenting the findings in the following Table 1.

Table 1. UNSW-NB15 dataset analyzed.
The CIC-IDS2017 dataset was curated by the Canadian Institute for Cybersecurity (CIC) using the B-Profile system, which simulates a network environment with a continuous variety of traffic attacks over a 5-day period. This dataset serves as a popular training resource, containing both benign and up-to-date common attacks, resembling real-world data (PCAPs). It encompasses a total of 15 labels, including 14 network attacks and normal traffic, such as Botnet, Web Attack Brute Force, DoS, DDoS, Infiltration, Heartbleed, Bot, PortScan, and other common attacks based on the McAfee report of 2016. Furthermore, it includes 15 labels for traffic based on the results of network traffic analysis performed by CICFlowMeter. The analysis incorporates labeled flows derived from timestamps, source and destination IP addresses, source and destination ports, protocols, and attacks, all presented in CSV files. We also have summarized and analyzed the raw data, presenting the findings in the following Table 2.
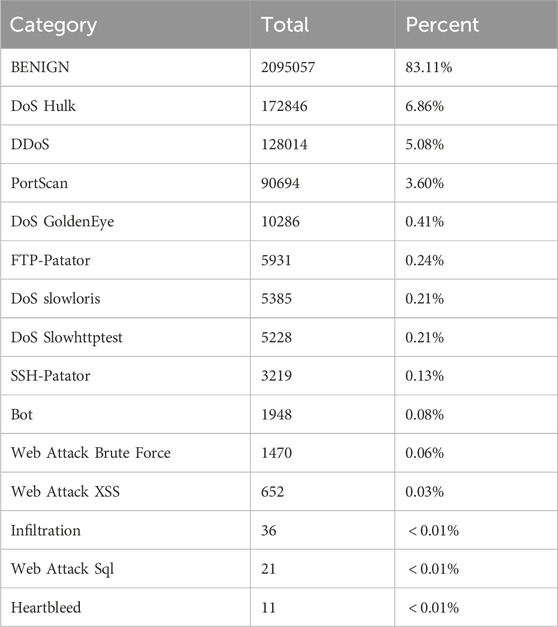
Table 2. CIC-IDS2017 dataset analyzed.
The method for converting traffic data into traffic images in this paper is as follows:
Step 1: Slice traffic packets Split the PCAP file to extract various features of network traffic data, such as packet length, timestamp, IP address, port number, protocol type, etc.
Step 2: Clean up the flow Remove IP addresses, MAC addresses, duplicate data, missing data, and other redundant information. Convert character-type data into numerical values using one-hot encoding to facilitate model computation. Apply max-min normalization to scale all data to the range of 0–1.
Step 3: Generate images Multiply the normalized data by 255 to facilitate conversion into image data. The data is then sliced into N bytes (where n is the edge length of the grayscale image, N = n2). If the file length is greater than N, it is truncated; if less than N, zero-padding is applied. The one-dimensional data of length N is then converted into an n*n two-dimensional grayscale image.
Step 4: Histogram equalization Certain areas in the original image may have details that are not apparent due to grayscale values being concentrated in a narrow range. Histogram equalization optimizes the original traffic feature map by redistributing the grayscale values, making them more uniform. This enhances the image contrast, clarifying details and better reflecting the information within the data.
Below is the calculation process of histogram equalization Equation 9: Firstly, calculate the cumulative histogram of the original traffic image. Here,
Then, normalize the cumulative histogram. To map the grayscale values to a new range, the cumulative distribution function
Finally, map to new grayscale values. The final equalized image grayscale value
As shown in Figure 5, using the CIC-IDS2017 dataset as an example, the differences between the original traffic images and the histogram-equalized traffic images are illustrated. The first row displays the original traffic feature images, while the second row shows the traffic feature images after enhancement. It is evident that the enhanced feature images have higher contrast and clearer details, which better reflect the information contained in the data.
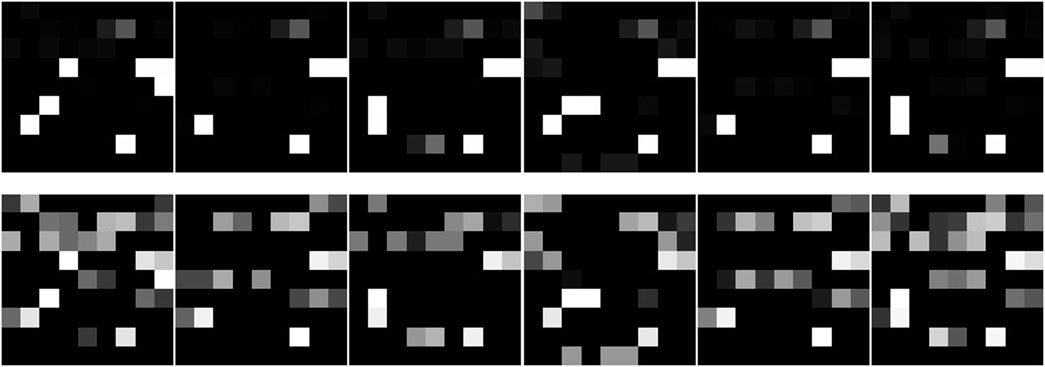
Figure 5. Original traffic image and equalized grayscale image.
In addition to the conversion of traffic images, the extreme imbalance of the dataset is also a characteristic of traffic data. Some specific anomalous traffic samples are very rare, making it difficult for the model to learn. For example, in the CIC-IDS2017 dataset, the sample proportions of Heartbleed, Infiltration, and DoS are very low. Therefore, this paper uses the Borderline-SMOTE oversampling method to adjust the data distribution of the dataset. In our experiments, we used 60% of the data as the training set, 20% as the validation set, and 20% as the test set.
4.3 Evaluation
We use accurac Equation 12, precision Equation 13, recall Equation 14, and F1 score Equation 15 to evaluate the effectiveness of the model. The specific formulas for these metrics are as follows:
These metrics are calculated using the following variables:True Positives (TP): Positive samples correctly predicted as positive by the model. False Positives (FP): Negative samples predicted as positive by the model. False Negatives (FN): Positive samples predicted as negative by the model. True Negatives (TN): Negative samples correctly predicted as negative by the model.
5 Experiments and analysis of results
We conducted binary and multi-class classification experiments on our model using the UNSW-NB15 and CIC-IDS2017 datasets. The confusion matrices for different datasets were presented, and data comparisons were made with existing research models. The results demonstrate that our model achieves the best performance compared to current research models. Additionally, on the CIC-IDS2017 dataset, we performed ablation experiments on the spatiotemporal fusion model without the attention mechanism. The comparison shows that the attention mechanism significantly enhances the model’s performance.
5.1 Analysis of classification results
5.1.1 Analysis of binary classification results
The binary classification results of our experiments on the CIC-IDS2017 dataset are shown in Table 3. The overall accuracy for binary classification reached 99.86%. The performance is outstanding with a precision of 99.31%, recall of 100%, and an F1-score of 99.66%.
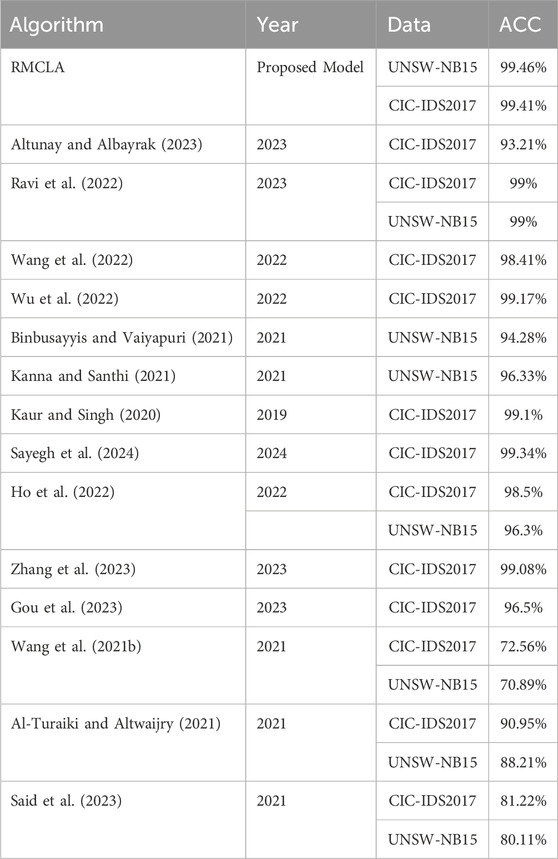
Table 3. Comparison of binary classification experiments with other models.
5.1.2 Analysis of multi-class classification results
As shown in Table 4, the classification performance of the model for all traffic categories on the CIC-IDS2017 dataset is impressive. For the majority class samples, the results are particularly outstanding, with the precision for the benign class reaching 99.89%, recall at 99.71%, and F1 score at 99.8%. For DDoS, DoS Hulk, and PortScan classes, all three metrics are around 99%.
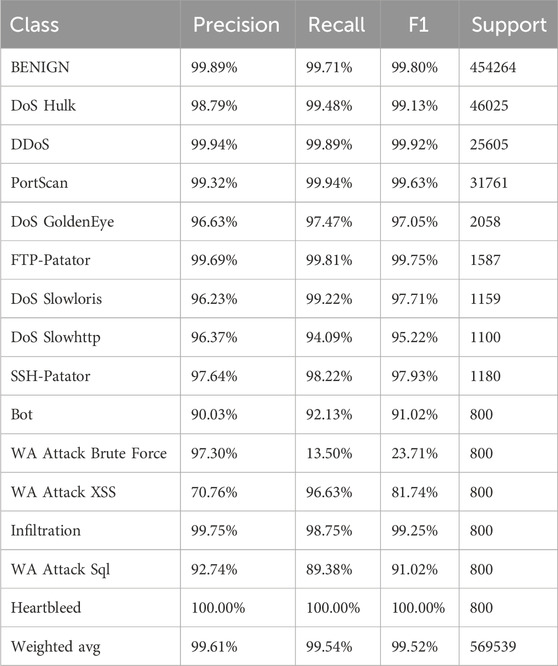
Table 4. Multi-class classification results on the CIC-IDS2017 dataset.
For the mid-frequency traffic categories, the model still demonstrates good classification performance. The three metrics for DoS GoldenEye, DoS Slowhttp, and DoS Slowloris are all above 96%. The classification performance for FTP-Patator is excellent, indicating that the features of this category are highly distinctive and well captured by the model, with precision, recall, and F1 scores reaching 99.69%, 99.81%, and 99.75%, respectively. The classification performance for SSH-Patator is also very good, with all three metrics around 98%.
After oversampling the six minority class labels, most of them showed satisfactory performance. For the bot class, the precision, recall, and F1 scores reached 90.03%, 89.8%, and 91.02%, respectively. The Heartbleed class achieved 100% in all three metrics. For the Infiltration class, the precision, recall, and F1 scores reached 99.75%, 98.75% and 99.25%, respectively.
WA Brute, WA Sql, and WA XSS classes are similar types of traffic data and their distinction tests the model’s performance. Two of them performed well; the WA XSS class had precision, recall, and F1 scores of 70.76%, 96.63%, and 81.74%, respectively, while the WA Sql class had scores of 92.74%, 89.38%, and 91.02%, respectively, both around 90%. The WA Brute class had a precision of 97.30%, but only a recall of 13.50%, indicating that while most predictions for WA Brute were correct (low false positives), the model missed many actual WA Brute samples (high false negatives). This overall suggests that there are few false positives for WA Brute, but many samples of this class are missed, likely due to confusion with the other two WA classes.
The UNSW-NB15 dataset has been available for quite some time, but due to the extreme imbalance in the number of classes and the lack of distinctive features in the class data, multi-class classification testing on this dataset has always been a challenging task. According to Table 5, the multiclassification accuracy is 86.1%, and the weighted averages of precision, recall, and F1 are 94.32%, 86.1%, and 87.9%, respectively. Given the nature of multiclassification, the overall indices can be influenced by both a small number of samples and the majority of samples. Therefore, it is crucial to examine the performance of each class individually.
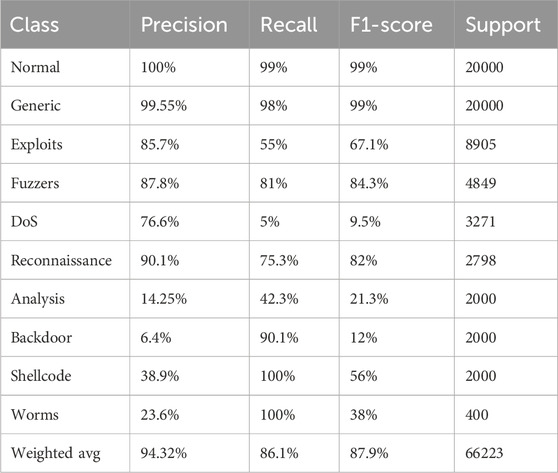
Table 5. Multiclass classification on the balanced UNSW-NB15 dataset.
Observing the results, the accuracy for normal traffic is 100%, with precision, recall, and F1 all exceeding 99%. The generic class attack, representing the majority class sample, also achieves precision, recall, and F1 scores above 99%, indicating effective detection for the majority class.
For minority samples, using the Borline-SMOTE oversampling algorithm can generate boundary samples to extend their number in the training sample. Experimental results show that most minority samples exhibit good detection effectiveness, with recall values of 100% for Worms and Shellcode. Additionally, the recall values for Backdoor, Reconnaissance and Analysis surpass 75%, demonstrating effective detection for these minority classes as well.
We present the confusion matrices both with and without the added attention mechanism. Figure 6 illustrates the confusion matrix for the CIC-IDS2017 dataset using the RMCLA model after incorporating the attention mechanism. The matrix exhibits a distinctly clear diagonal, indicating that nearly all categories achieve satisfactory classification results. Figure 7 displays the confusion matrix without the inclusion of the attention mechanism. By comparing these two figures, it is evident that the model’s performance prior to adding the attention mechanism was suboptimal, with numerous misclassification issues observed. Following the integration of the attention mechanism, the classification performance across all categories, including the minority class, demonstrates significant improvement. The recognition rate of minority class samples improved significantly, with bot reaching 0.78, heartbleed 1.00, infiltration 0.99, and substantial improvements in the classification performance of the three web attack labels: WA Sql improved from 0.57 to 0.91, WA Brute from 0.27 to 0.55, and WA XSS from 0.54 to 0.75.

Figure 6. Confusion matrix for CICIDS2017.
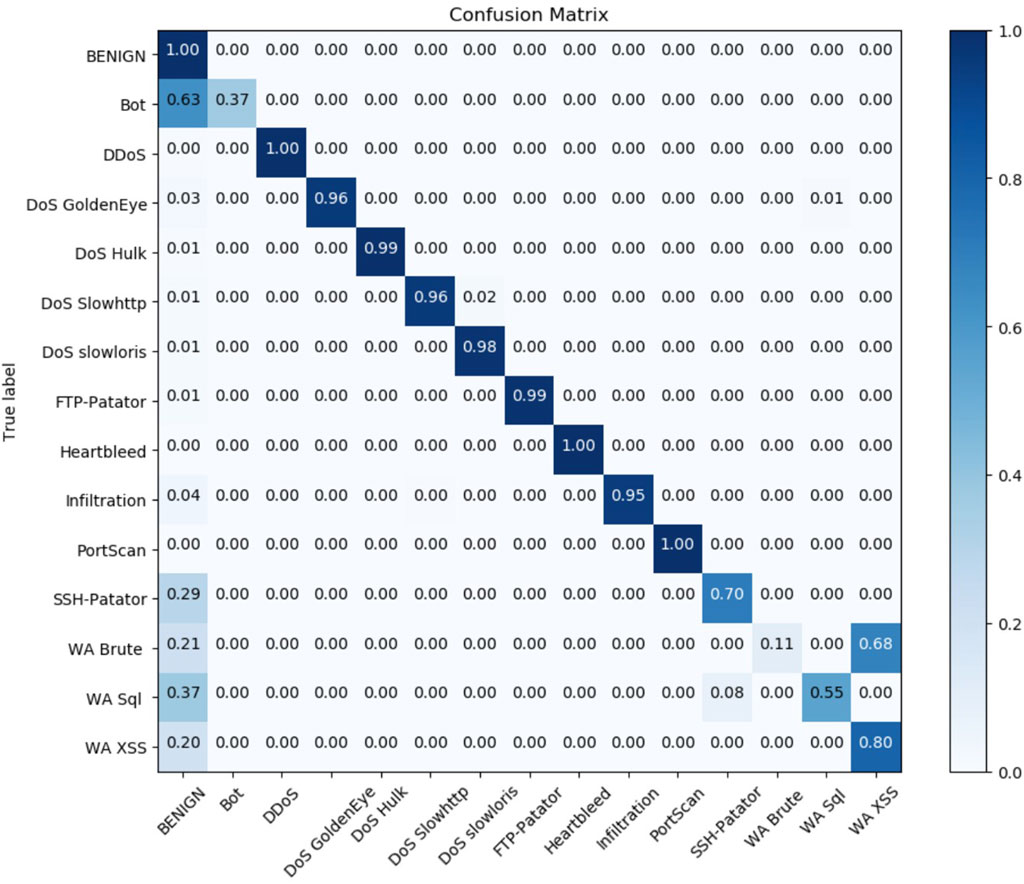
Figure 7. Confusion matrix for CICIDS2017 without attention mechanism.
5.2 Ablation experiments
5.3 Comparison classification with other models
We conducted ablation experiments on our model and additionally tested the multi-class performance of models without the attention module, without the spatial attention module, without the channel attention module, without the temporal attention module, without the self-attention module, and without data balancing. The results are shown in Table 6. It can be observed that after removing the entire attention module, the model performance significantly declined, with accuracy (acc) dropping to 99.73%, precision dropping to 97.5%, and recall dropping to 97.2%. When either the channel attention mechanism or the spatial attention mechanism was removed, the performance difference was not substantial, with both fluctuating around 99%. However, after removing the temporal attention mechanism, the model’s ability to learn temporal features decreased, leading to a noticeable decline in overall model performance, with most metrics falling below 99%. We also examined the impact of dataset balancing methods on model performance. The results indicate that severe data imbalance greatly affects the training effectiveness of the model, with a metric gap of about 2% before and after balancing.
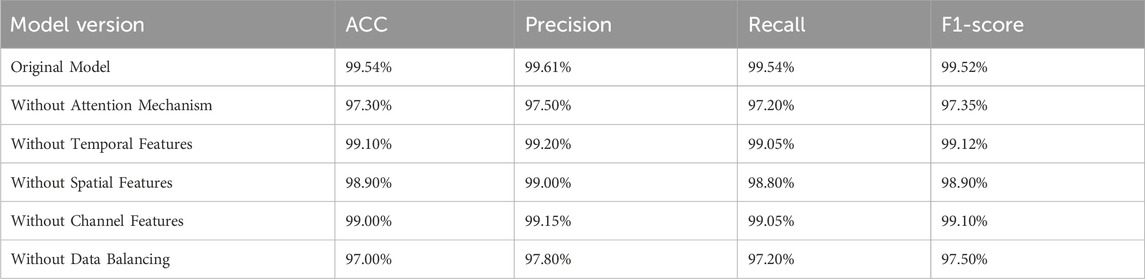
Table 6. Different Versions of the Model for temporal attention module on CIC-IDS2017 Dataset.
We also compared the multi-class classification results of the two datasets from existing research. As shown in Table 7, we listed the experimental results both with and without the attention mechanism. It can be seen that on the CIC-IDS2017 dataset, most models can achieve accuracy rates above 90%, but few reach above 99%. The RMCLA model achieved an accuracy of 99.54%, which is the best among the many models. The performance on the UNSW-NB15 dataset varied greatly, with significant differences, for example, DNN only achieved 66% accuracy, while HC-DTTSVM reached 81.7%. This demonstrates that training on the UNSW-NB15 dataset is very challenging, especially in the field of multi-class classification where it is difficult to achieve 90%. The RMCLA model achieved an accuracy of 86.1%, placing it at the forefront.
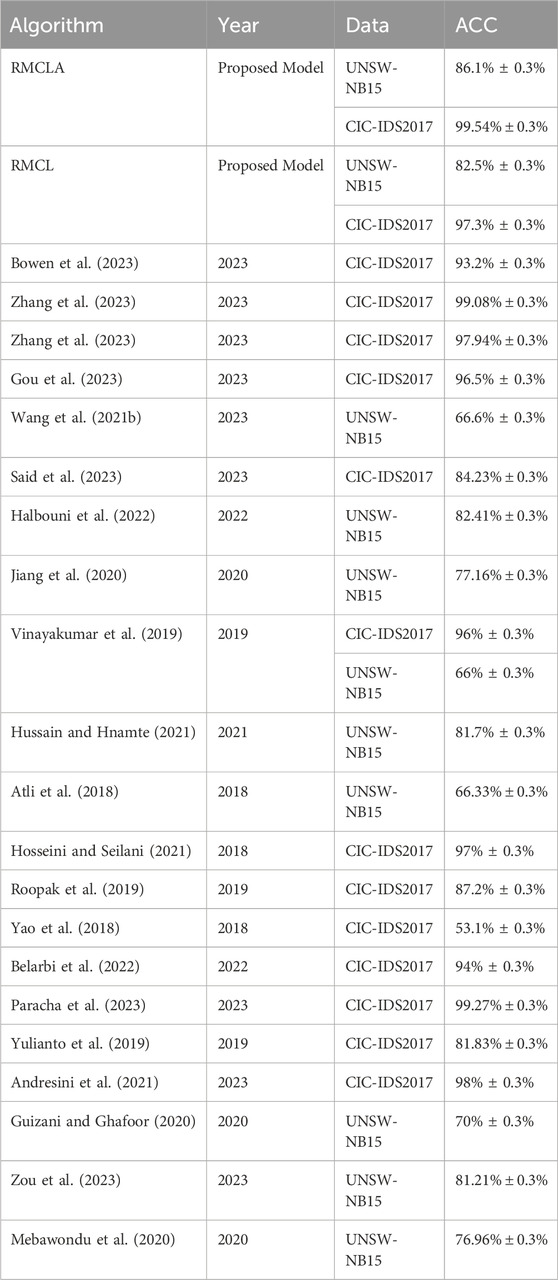
Table 7. Comparison of multiclass classification experiments with other models.
5.4 Comparison of training times
We have also listed the training times of our model and the training times of models from other literature, as shown in Table 8. It can be seen that our training time has certain advantages when compared with larger models, such as LeNet: 1411s, CNN-LSTM: 1229s, CNN-BILSTM: 2000s. Our model takes less time than these. However, compared to smaller models with fewer parameters, the training time is relatively longer, such as CNN: 297s. Nevertheless, as demonstrated in the experimental comparisons in previous chapters, our model has certain advantages over many of the latest models, and its accuracy has been affirmed. In comparison, the accuracy of CNN is far inferior to ours, making the longer training time worthwhile.
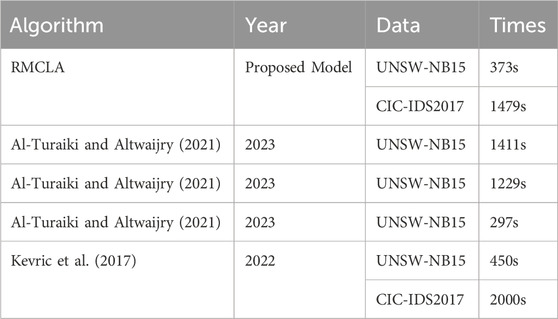
Table 8. Comparison of training times with other models.
6 Conclusion and future work
This paper proposes and designs the RMCLA network intrusion detection system, which first converts traffic data into grayscale images, followed by histogram equalization, significantly enhancing the contrast of the traffic feature images. This makes the data features clearer and easier for the model to extract. To address the loss of data association information, a BiLSTM layer is added to effectively solve this issue. To overcome the simplistic convolution extraction methods, the paper designs a multi-scale convolution module. Compared to convolution layers at the same level, this module has a wider receptive field, achieving results that would otherwise require deeper convolution layers, while significantly reducing the number of parameters. Subsequently, the residual network mechanism is added to prevent information loss while enhancing model stability and preventing gradient vanishing or explosion. Additionally, multiple attention mechanisms are incorporated to filter and select the features extracted by the convolutions, increasing the model’s focus on important features and reducing the weight of less significant ones, greatly improving the model’s accuracy. Finally, the self-attention mechanism reduces the overall parameters of the model, improving its operational efficiency. Experimental results demonstrate that the proposed model outperforms the vast majority of existing models. On the CIC-IDS2017 data set, the accuracy of binary classification experiment results of the model reached 99.86%, the precision rate was 99.31%, the recall rate was 100%, and the F1 score was 99.66%. The weighted precision rate, the recall rate and the F1 score of the multi-classification experiment results reached 99.61%, 99.54% and 99.52%, respectively. The vast majority of abnormal traffic accuracy is more than 96%. For the UNSW-NB15 dataset, the weighted precision rate, recall rate and F1 score reached 94.32%, 86.1% and 87.9%, respectively. The accuracy rate of identifying normal traffic reached 100%, and the accuracy rate, recall rate and F1 score were all above 99%. On these data sets, the model can effectively identify the abnormal attack traffic. The model effectively identifies anomalous attack traffic across these datasets, demonstrating superior generalization and robustness.
At present, although the model has achieved high accuracy in most categories, it is still inadequate in a few minority classes of attacks, such as WA Brute, WA XSS in CIC-IDS2017 and Backdoor, Analysis and Worms in UNSW-NB15. This is mainly because the features of a few class samples are hard to distinguish, making it challenging for the model to capture the complex patterns of these classes during training. Future work will focus on further improving the model’s ability to identify a few types of attack traffic, as well as optimizing the model’s ability to detect and prevent new attacks in real time. Future work will consider the use of more advanced techniques to increase the diversity of a few class samples, as well as the continuous optimization of the model structure and the addition of new modules to improve its recognition accuracy, which will be the focus of future research directions.
Data availability statement
The datasets presented in this study can be found in online repositories. The names of the repository/repositories and accession number(s) can be found below: https://www.unb.ca/cic/datasets/ids-2017.html. https://research.unsw.edu.au/projects/unsw-nb15-dataset.
Author contributions
PW: Conceptualization, Data curation, Formal Analysis, Investigation, Methodology, Project administration, Resources, Software, Validation, Visualization, Writing – original draft, Writing – review and editing. XC: Conceptualization, Data curation, Formal Analysis, Investigation, Methodology, Validation, Visualization, Writing – review and editing. JS: Conceptualization, Funding acquisition, Supervision, Writing – review and editing. ZX: Conceptualization, Supervision, Resources, Writing – review and editing. FL: Investigation, Supervision, Writing – review and editing. QD: Data curation, Formal Analysis, Investigation, Writing – review and editing.
Funding
The author(s) declare that financial support was received for the research and/or publication of this article. This work was supported in part by the National Natural Science Foundation of China under Grant 62262020, and in part by the National Natural Science Foundation of HuBei (2020CFB326).
Conflict of interest
The authors declare that the research was conducted in the absence of any commercial or financial relationships that could be construed as a potential conflict of interest.
Generative AI statement
The author(s) declare that no Generative AI was used in the creation of this manuscript.
Publisher’s note
All claims expressed in this article are solely those of the authors and do not necessarily represent those of their affiliated organizations, or those of the publisher, the editors and the reviewers. Any product that may be evaluated in this article, or claim that may be made by its manufacturer, is not guaranteed or endorsed by the publisher.
References
Altunay, H. C., and Albayrak, Z. (2023). A hybrid cnn+ lstm-based intrusion detection system for industrial iot networks. Eng. Sci. Technol. Int. J. 38, 101322. doi:10.1016/j.jestch.2022.101322
Al-Turaiki, I., and Altwaijry, N. (2021). A convolutional neural network for improved anomaly-based network intrusion detection. Big Data 9, 233–252. doi:10.1089/big.2020.0263
Andresini, G., Appice, A., and Malerba, D. (2021). Nearest cluster-based intrusion detection through convolutional neural networks. Knowledge-Based Syst. 216, 106798. doi:10.1016/j.knosys.2021.106798
Atli, B. G., Miche, Y., Kalliola, A., Oliver, I., Holtmanns, S., and Lendasse, A. (2018). Anomaly-based intrusion detection using extreme learning machine and aggregation of network traffic statistics in probability space. Cogn. Comput. 10, 848–863. doi:10.1007/s12559-018-9564-y
Bataev, A. V., Zhuzhoma, I., and Bulatova, N. N. (2020). “Digital transformation of the world economy: evaluation of the global and Russian internet of things markets,” in 2020 9th international conference on industrial technology and management (ICITM) (IEEE), 274–278.
Belarbi, O., Khan, A., Carnelli, P., and Spyridopoulos, T. (2022). “An intrusion detection system based on deep belief networks,” in International conference on science of cyber security (Springer), 377–392.
Binbusayyis, A., and Vaiyapuri, T. (2021). Unsupervised deep learning approach for network intrusion detection combining convolutional autoencoder and one-class svm. Appl. Intell. 51, 7094–7108. doi:10.1007/s10489-021-02205-9
Bowen, B., Chennamaneni, A., Goulart, A., and Lin, D. (2023). Blocnet: a hybrid, dataset-independent intrusion detection system using deep learning. Int. J. Inf. Secur. 22, 893–917. doi:10.1007/s10207-023-00663-5
Chen, L., Kuang, X., Xu, A., Suo, S., and Yang, Y. (2020). “A novel network intrusion detection system based on cnn,” in 2020 eighth international conference on advanced cloud and big data (CBD) (IEEE), 243–247.
Farnaaz, N., and Jabbar, M. A. (2016). Random forest modeling for network intrusion detection system. Procedia Comput. Sci. 89, 213–217. doi:10.1016/J.PROCS.2016.06.047
Gou, W., Zhang, H., and Zhang, R. (2023). Multi-classification and tree-based ensemble network for the intrusion detection system in the internet of vehicles. Sensors 23, 8788. doi:10.3390/s23218788
Guizani, N., and Ghafoor, A. (2020). A network function virtualization system for detecting malware in large iot based networks. IEEE J. Sel. Areas Commun. 38, 1218–1228. doi:10.1109/jsac.2020.2986618
Halbouni, A., Gunawan, T. S., Habaebi, M. H., Halbouni, M., Kartiwi, M., and Ahmad, R. (2022). Cnn-lstm: hybrid deep neural network for network intrusion detection system. IEEE Access 10, 99837–99849. doi:10.1109/access.2022.3206425
Ho, C. M. K., Yow, K.-C., Zhu, Z., and Aravamuthan, S. (2022). Network intrusion detection via flow-to-image conversion and vision transformer classification. IEEE Access 10, 97780–97793. doi:10.1109/access.2022.3200034
Hosseini, S., and Seilani, H. (2021). Anomaly process detection using negative selection algorithm and classification techniques. Evol. Syst. 12, 769–778. doi:10.1007/s12530-019-09317-1
Huang, Y. (2022). “Network intrusion detection method based on naive bayes algorithm,” in 2022 6th asian conference on artificial intelligence technology (ACAIT), 1–10. doi:10.1109/ACAIT56212.2022.10137846
Hussain, J., and Hnamte, V. (2021). “A novel deep learning based intrusion detection system: software defined network,” in 2021 International Conference on innovation and intelligence for informatics, computing, and technologies (3ICT) (IEEE), 506–511.
Ikram, S. T., and Kumar, C. (2017). Intrusion detection model using fusion of chi-square feature selection and multi class svm. J. King Saud. Univ. Comput. Inf. Sci. 29, 462–472. doi:10.1016/J.JKSUCI.2015.12.004
Jiang, K., Wang, W., Wang, A., and Wu, H. (2020). Network intrusion detection combined hybrid sampling with deep hierarchical network. IEEE access 8, 32464–32476. doi:10.1109/access.2020.2973730
Kanna, P. R., and Santhi, P. (2021). Unified deep learning approach for efficient intrusion detection system using integrated spatial–temporal features. Knowledge-Based Syst. 226, 107132. doi:10.1016/j.knosys.2021.107132
Kaur, S., and Singh, M. (2020). Hybrid intrusion detection and signature generation using deep recurrent neural networks. Neural Comput. Appl. 32, 7859–7877. doi:10.1007/s00521-019-04187-9
Kevric, J., Jukic, S., and Subasi, A. (2017). An effective combining classifier approach using tree algorithms for network intrusion detection. Neural Comput. Appl. 28, 1051–1058. doi:10.1007/s00521-016-2418-1
Khaoula, R., and Mohamed, M. (2022). “Improving intrusion detection using pca and k-means clustering algorithm,” in 2022 9th international conference on wireless networks and mobile communications (WINCOM), 1–5. doi:10.1109/WINCOM55661.2022.9966426
Le, T.-T.-H., Oktian, Y., and Kim, H. (2022). Xgboost for imbalanced multiclass classification-based industrial internet of things intrusion detection systems. Sustainability 14, 8707. doi:10.3390/su14148707
Li, D., Dong, X., Gao, J., and Hu, K. (2023). Abnormal traffic detection based on attention and big step convolution. IEEE Access 11, 64957–64967. doi:10.1109/access.2023.3289200
Li, Y., Xu, Y., Liu, Z., Hou, H., Zheng, Y., Xin, Y., et al. (2020). Robust detection for network intrusion of industrial iot based on multi-cnn fusion. Measurement 154, 107450. doi:10.1016/j.measurement.2019.107450
Louk, M., and Tama, B. A. (2022). Dual-ids: a bagging-based gradient boosting decision tree model for network anomaly intrusion detection system. Expert Syst. Appl. 213, 119030. doi:10.1016/j.eswa.2022.119030
Mebawondu, J. O., Alowolodu, O. D., Mebawondu, J. O., and Adetunmbi, A. O. (2020). Network intrusion detection system using supervised learning paradigm. Sci. Afr. 9, e00497. doi:10.1016/j.sciaf.2020.e00497
Paracha, M. A., Sadiq, M., Liang, J., Durad, M. H., and Sheeraz, M. (2023). Multi-layered filtration framework for efficient detection of network attacks using machine learning. Sensors 23, 5829. doi:10.3390/s23135829
Rajaby, E., and Sayedi, S. M. (2022). A structured review of sparse fast fourier transform algorithms. Digit. Signal Process. 123, 103403. doi:10.1016/j.dsp.2022.103403
Ravi, V., Chaganti, R., and Alazab, M. (2022). Recurrent deep learning-based feature fusion ensemble meta-classifier approach for intelligent network intrusion detection system. Comput. Electr. Eng. 102, 108156. doi:10.1016/j.compeleceng.2022.108156
Roopak, M., Tian, G. Y., and Chambers, J. (2019). “Deep learning models for cyber security in iot networks,” in 2019 IEEE 9th annual computing and communication workshop and conference (CCWC) (IEEE), 0452–0457.
Said, R. B., Sabir, Z., and Askerzade, I. (2023). Cnn-bilstm: a hybrid deep learning approach for network intrusion detection system in software defined networking with hybrid feature selection. IEEE Access 11, 138732–138747. doi:10.1109/access.2023.3340142
Sayegh, H. R., Dong, W., and Al-madani, A. M. (2024). Enhanced intrusion detection with lstm-based model, feature selection, and smote for imbalanced data. Appl. Sci. 14, 479. doi:10.3390/app14020479
Sun, P., Liu, P., Li, Q., Liu, C., Lu, X., Hao, R., et al. (2020). Dl-ids: extracting features using cnn-lstm hybrid network for intrusion detection system. Secur. Commun. Netw. 2020, 1–11. doi:10.1155/2020/8890306
Talukder, M. A., Hasan, K. F., Islam, M. M., Uddin, M. A., Akhter, A., Yousuf, M. A., et al. (2022). A dependable hybrid machine learning model for network intrusion detection. ArXiv abs/2212.04546 72, 103405. doi:10.1016/j.jisa.2022.103405
Vinayakumar, R., Alazab, M., Soman, K. P., Poornachandran, P., Al-Nemrat, A., and Venkatraman, S. (2019). Deep learning approach for intelligent intrusion detection system. Ieee Access 7, 41525–41550. doi:10.1109/access.2019.2895334
Wang, L., Yang, J., Xu, X., and Wan, P. (2021a). Mining network traffic with the k -means clustering algorithm for stepping-stone intrusion detection. Wirel. Commun. Mob. Comput. 2021. doi:10.1155/2021/6632671
Wang, N., Chen, Y., Xiao, Y., Hu, Y., Lou, W., and Hou, Y. T. (2022). Manda: on adversarial example detection for network intrusion detection system. IEEE Trans. Dependable Secure Comput. 20, 1139–1153. doi:10.1109/tdsc.2022.3148990
Wang, Z., Zeng, Y., Liu, Y., and Li, D. (2021b). Deep belief network integrating improved kernel-based extreme learning machine for network intrusion detection. IEEE Access 9, 16062–16091. doi:10.1109/access.2021.3051074
Wu, Z., Zhang, H., Wang, P., and Sun, Z. (2022). Rtids: a robust transformer-based approach for intrusion detection system. IEEE Access 10, 64375–64387. doi:10.1109/access.2022.3182333
Yao, Y., Su, L., and Lu, Z. (2018). “Deepgfl: deep feature learning via graph for attack detection on flow-based network traffic,” in MILCOM 2018-2018 IEEE military communications conference (MILCOM) (IEEE), 579–584.
Yulianto, A., Sukarno, P., and Suwastika, N. A. (2019). Improving adaboost-based intrusion detection system (ids) performance on cic ids 2017 dataset. In J. Phys. Conf. Ser., 1192, 012018, doi:10.1088/1742-6596/1192/1/012018
Zhang, B., Liu, Z., Jia, Y., Ren, J., and Zhao, X. (2018). Network intrusion detection method based on pca and bayes algorithm. Secur. Commun. Netw. 2018, 1–11. doi:10.1155/2018/1914980
Zhang, J., Zhang, X., Liu, Z., Fu, F., Jiao, Y., and Xu, F. (2023). A network intrusion detection model based on bilstm with multi-head attention mechanism. Electronics 12, 4170. doi:10.3390/electronics12194170
Zhang, J., Zulkernine, M., and Haque, A. (2008). Random-forests-based network intrusion detection systems. IEEE Trans. Syst. Man, Cybern. Part C Appl. Rev. 38, 649–659. doi:10.1109/TSMCC.2008.923876
Zhang, Y., Yang, Q., Lambotharan, S., Kyriakopoulos, K., Ghafir, I., and AsSadhan, B. (2019). “Anomaly-based network intrusion detection using svm,” in 2019 11th international conference on wireless communications and signal processing (WCSP), 1–6. doi:10.1109/WCSP.2019.8927907
Keywords: intrusion detection system, deep learning, convolutional neural network, image processing, long short-term memory, attention mechanism, multiclass classification accuracy
Citation: Wang P, Chen X, Shen J, Xu Z, Liang F and Du Q (2025) Abnormal traffic detection based on image recognition and attention-residual optimization. Front. Commun. Netw. 6:1546936. doi: 10.3389/frcmn.2025.1546936
Received: 22 January 2025; Accepted: 22 April 2025;
Published: 12 May 2025.
Edited by:
Oluwakayode Onireti, University of Glasgow, United KingdomReviewed by:
Ji Changpeng, Liaoning Technical University, ChinaRubina Nasir, Air University, Pakistan
Firas Saidi, University of Technology Bahrain, Bahrain
Copyright © 2025 Wang, Chen, Shen, Xu, Liang and Du. This is an open-access article distributed under the terms of the Creative Commons Attribution License (CC BY). The use, distribution or reproduction in other forums is permitted, provided the original author(s) and the copyright owner(s) are credited and that the original publication in this journal is cited, in accordance with accepted academic practice. No use, distribution or reproduction is permitted which does not comply with these terms.
*Correspondence: Pengfei Wang, cGZ3YW5nQGhibXp1LmVkdS5jbg==; Jinan Shen, c2hlbmppbmFuQGhibXp1LmVkdS5jbg==