- Department of Computer Science and Engineering, Khulna University of Engineering and Technology, Khulna, Bangladesh
Introduction: Accurate and efficient automated diagnosis of Diabetic Retinopathy (DR) and Age-related Macular Degeneration (AMD) is crucial for addressing these leading causes of vision loss worldwide. Driven by the potential to improve early detection and patient outcomes, this study proposes a comprehensive system for diagnosing and grading these conditions.
Methods: Our approach combines image enhancement techniques, automated lesion localization, and disease severity classification. The study utilizes both established benchmark datasets and four newly proposed datasets to ensure robust evaluation.
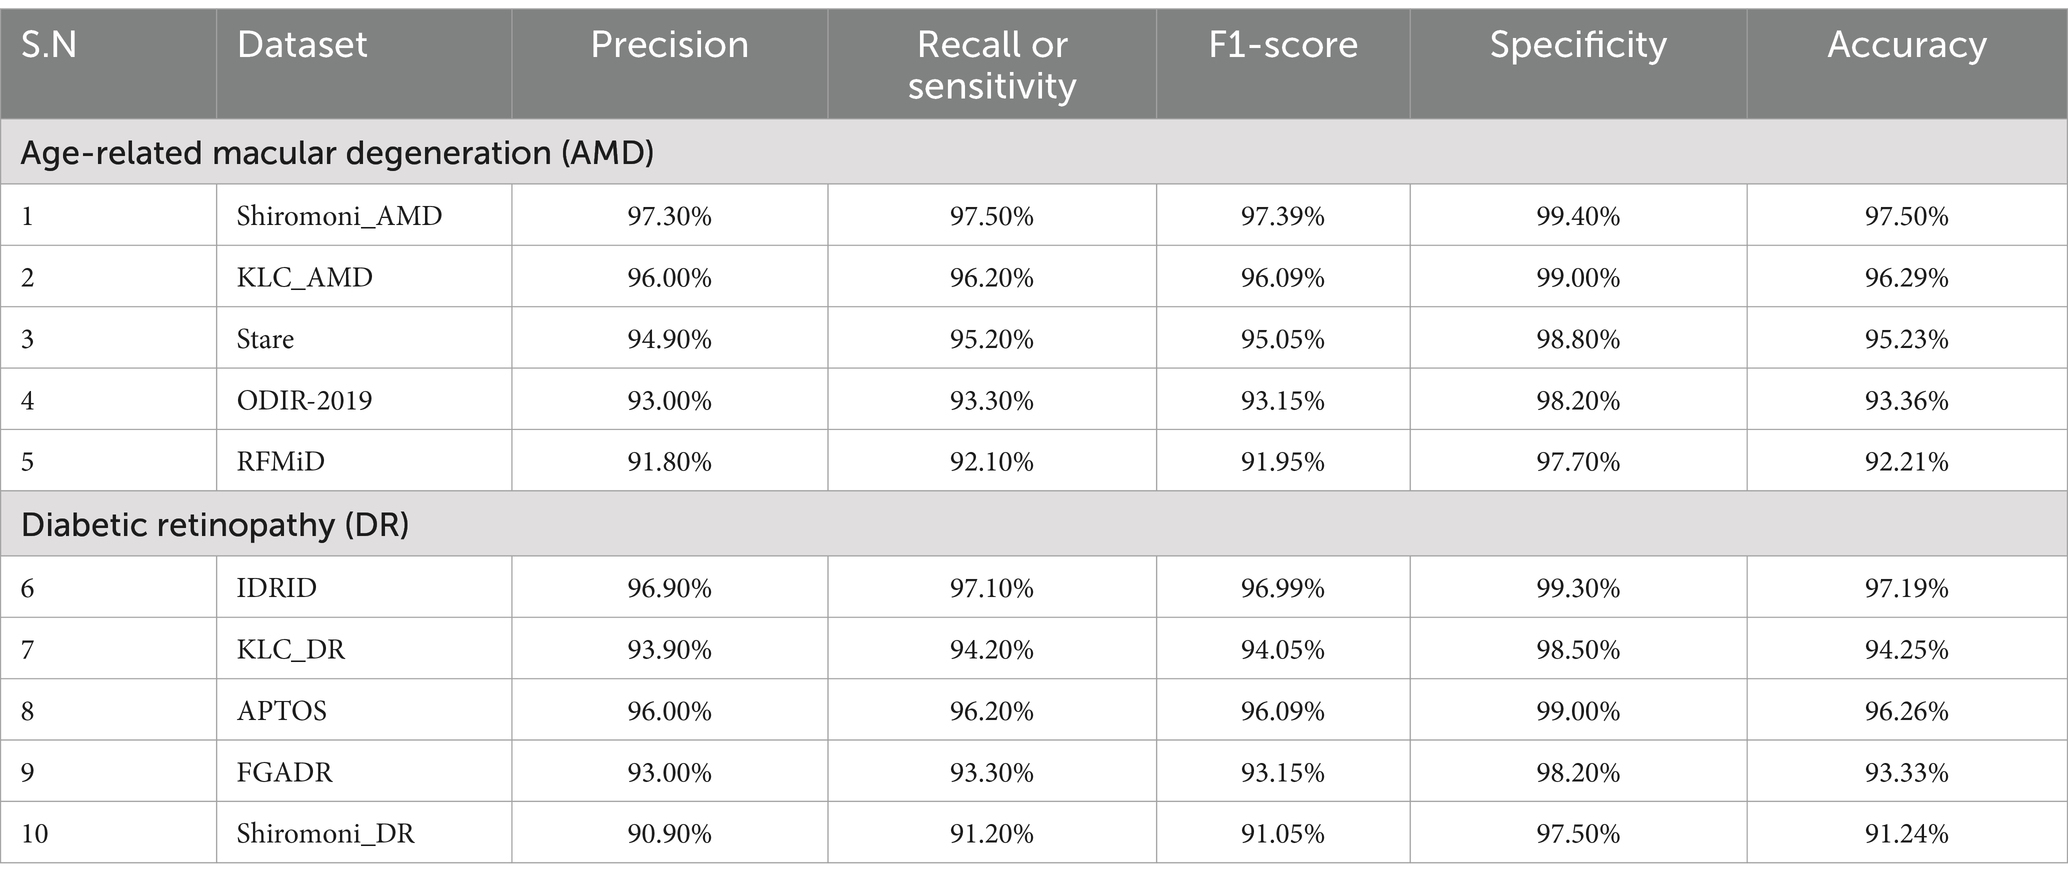
Results: The localization model achieved exceptional performance with mAP scores of up to 98.71% for AMD on the Shiromoni_AMD dataset and 97.21% for DR on the KLC_DR dataset. Similarly, the severity classification model demonstrated high accuracy, reaching 99.42% for AMD on the Stare dataset and 98.81% for DR on the KLC_DR dataset. Comparative analysis shows that our proposed methods often surpass existing state-of-the-art approaches, demonstrating more consistent performance across diverse datasets and eye conditions.
Discussion: This research represents a significant advancement in automated ophthalmic diagnosis, potentially enhancing clinical practice and improving accessibility to eye care worldwide. Our findings pave the way for more accurate, efficient, and widely applicable automated screening tools for retinal diseases.
1 Introduction
Age-related macular degeneration (AMD) and diabetic retinopathy (DR) are the two leading causes of blindness and vision loss in the world. The timely identification and precise grading of these conditions are crucial for appropriate intervention and efficient management. The emergence of deep learning techniques has spurred interest in developing automated systems tailored for grading and lesion localization within retinal images. DR, in particular, holds the distinction of being the most prevalent cause of vision impairment and irreversible blindness among the working-age population (Ning et al., 2010), with projections indicating a staggering rise to over 693 million cases by 2045 (Cho et al., 2018). Timely diagnosis of DR can significantly mitigate vision impairment, characterized by symptoms such as blurred vision, floaters, and sudden vision loss. DR manifests through various abnormal signs within the retina, including hemorrhages, microaneurysms, neovascularization (both NVD and NVE), Intraretinal Microvascular Anomalies (IRMA), as well as complex and soft exudates (Zago et al., 2020). Hard exudates, distinguished by their bright yellow hue and waxy appearance, form on the retina due to vessel blood leakage. Conversely, soft exudates manifest as white lesions on the retina arising from arterial occlusion. Hemorrhages result from blood leakage from compromised vessels, presenting as dark red spots. Microaneurysms, characterized by small red dots on the retina, arise from distortions in vessel boundaries. Intraretinal microvascular abnormalities denote abnormal branching or dilation of existing blood vessels (capillaries) within the retina. Neovascularization in diabetic retinopathy involves the abnormal growth of new blood vessels either on the optic disc (NVD) or elsewhere in the retina (NVE), with untreated cases leading to vision impairment. The abnormal signs of DR depend on the five severity stages of DR shown in Table 1.
Figures 1, 2 illustrate representative images of the retinal abnormalities corresponding to the severity stages outlined in Table 1.
Retinal fundus images often suffer from quality variations due to uneven illumination, low contrast, and noise artifacts—challenges exacerbated by differences in imaging devices, operator expertise, and patient-specific factors (e.g., cataracts or corneal opacities). These variations can obscure subtle pathological features, such as early microaneurysms in DR (often <50 μm) or small drusen in AMD (63–125 μm), leading to missed diagnoses or delayed interventions. Image enhancement is critical to standardizing input quality and amplifying discriminative features for automated systems. Prior studies demonstrate that preprocessing techniques like low-complexity algorithm can improve low-contrast images (Aamir et al., 2023) and another study use Illumination boost and Non-linear stretching (Aamir et al., 2022). However, conventional methods risk over-amplifying noise or distorting anatomical structures. Our modified CLAHE algorithm addresses these limitations by employing bicubic interpolation to preserve edge details while adaptively enhancing contrast, ensuring subtle lesions remain visible without introducing artifacts.
AMD arises from the degeneration of the macula, the central region of the retina. The intermediate stage of AMD is characterized by extensive medium-sized (63–125 μm) drusen or at least one large (>125 μm) drusen or geographic atrophy not involving the fovea. Drusen consists of long-spacing collagen and phospholipid vesicles between Bruch’s membrane (the choriocapillaris’ basement membrane) and the retinal pigment epithelium’s basement membrane (RPE). Advanced AMD manifests as macular damage through either choroidal neovascularization (“wet”) or geographic atrophy (GA) of the RPE involving the macula’s center (“dry”) form. Both advanced forms can result in the rapid or gradual loss of visual acuity, with the wet form replacing photoreceptors with scar tissue and the dry form degenerating photoreceptors within roughly circular regions (diameters > ~175 m) of hypopigmentation, depigmentation, or the apparent absence of the RPE (Bird et al., 1995). Presently, it is estimated that between 1.75 and 3 million individuals in the United States have some form of advanced-stage AMD (Bressler, 2004). AMD primarily affects the macula, which is responsible for sharp central vision. Symptoms vary depending on the disease type and stage. Notably, Dry AMD (Early Stage) may cause blurred or distorted central vision, while Wet AMD (Advanced Stage) can lead to sudden and severe loss of central vision, distortion of straight lines, and the emergence of blind spots or dark areas in the central field of vision. There are five globally recognized severity stages of AMD based on drusen size (Ferris et al., 2013). The severity stages of AMD based on the drusen size are shown in Table 2.
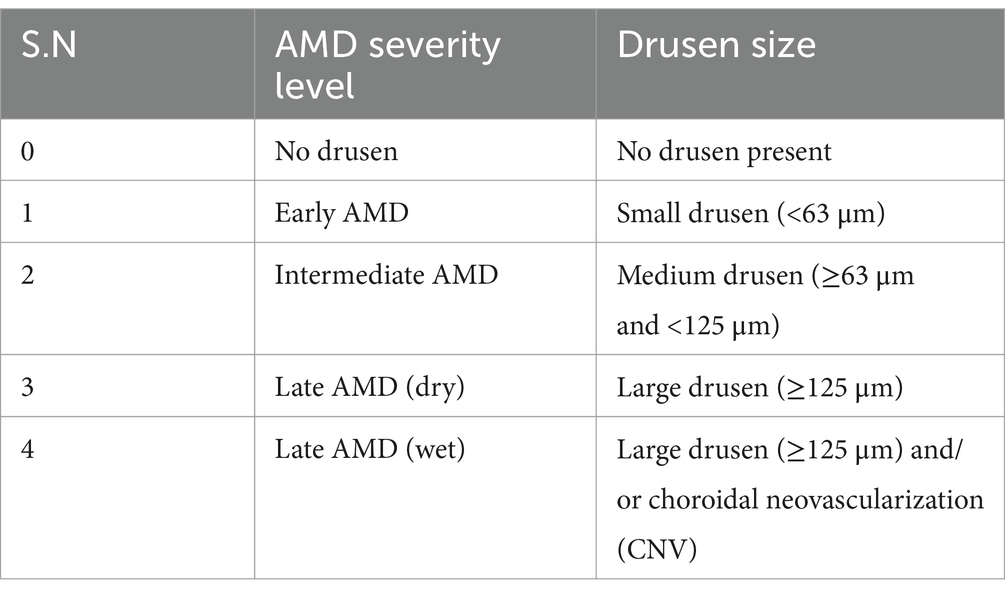
Table 2. The severity stages of AMD (Ferris et al., 2013).
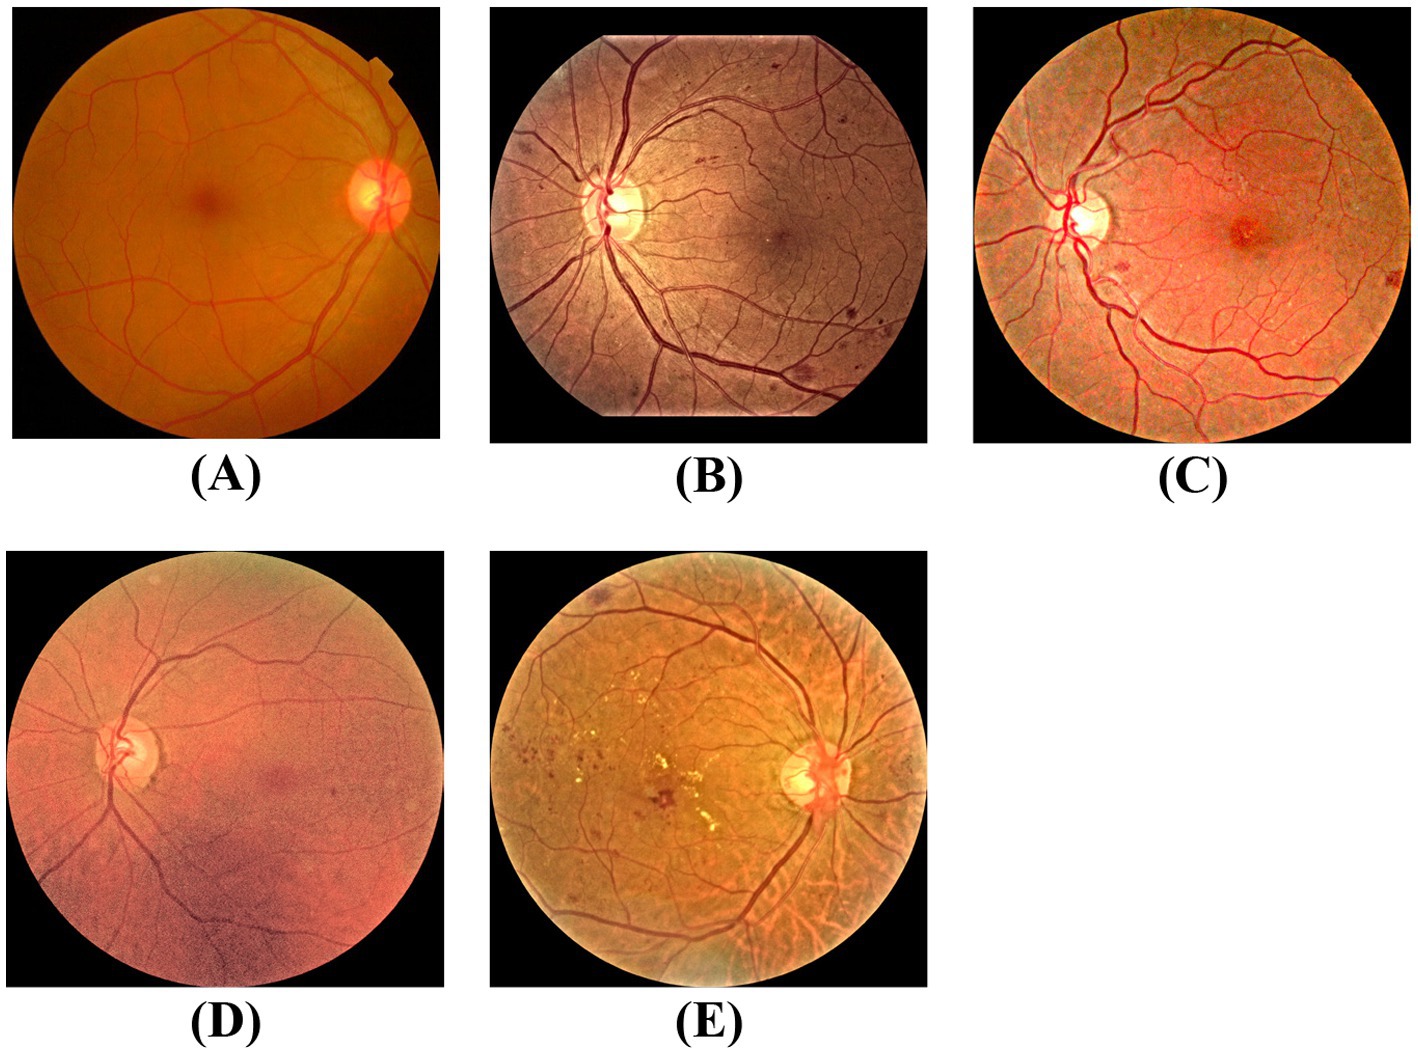
Sample images of every abnormal sign of AMD are shown in Figure 3.
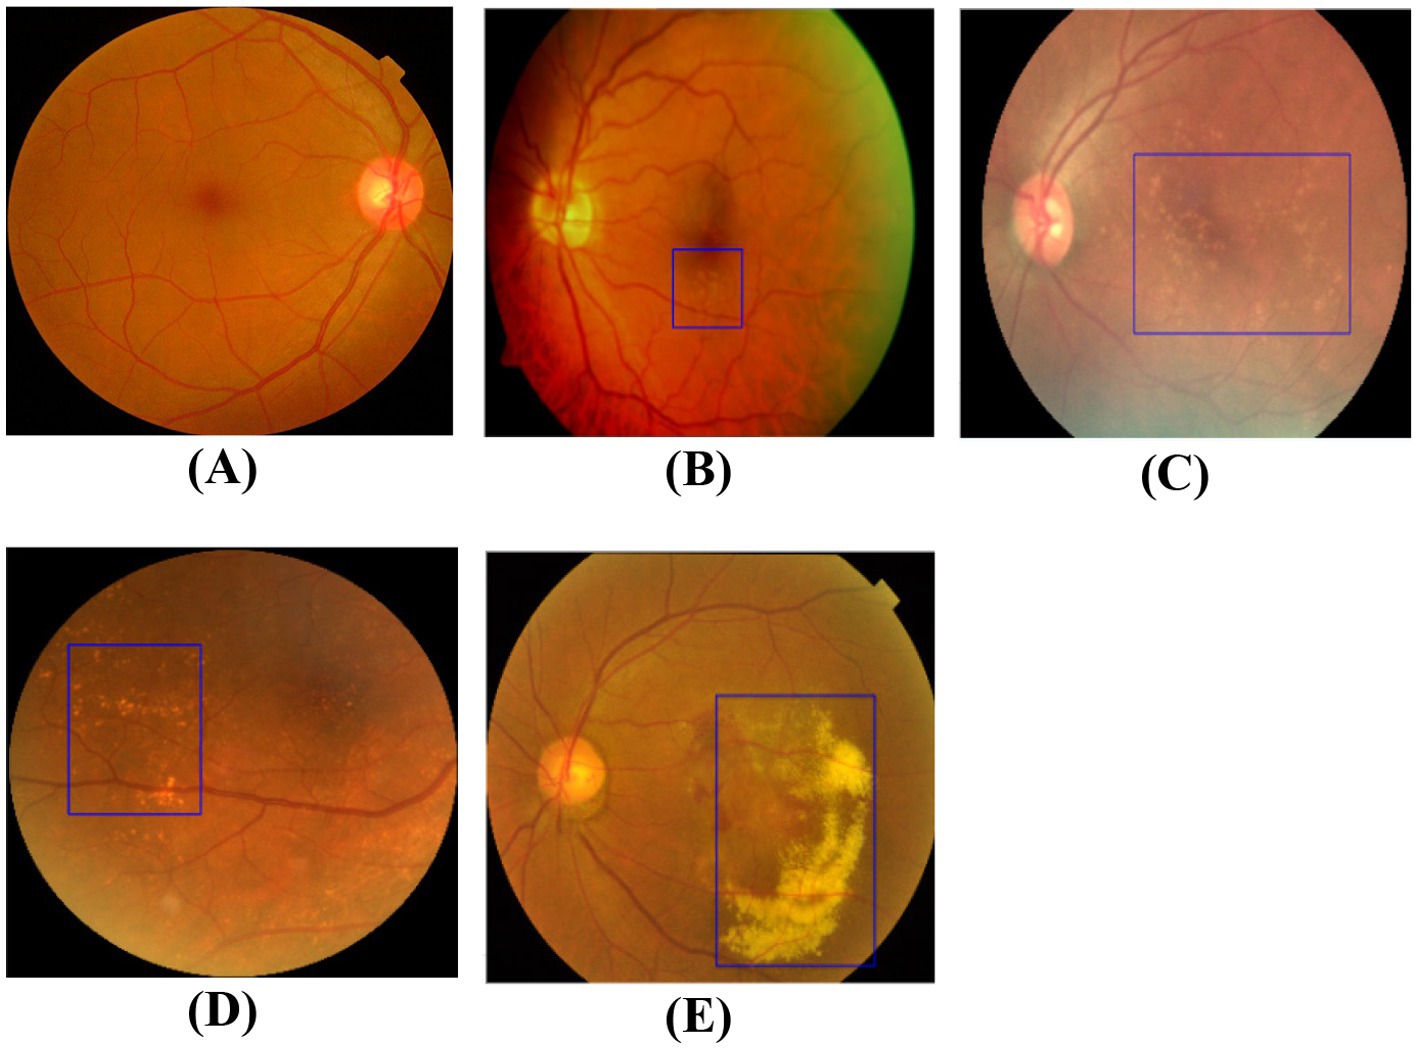
Figure 3. The AMD severity stage: (A) no AMD, (B) early AMD, (C) intermediate AMD, (D) late AMD (dry), (E) late AMD (wet).
The advancement of deep learning models for DR and AMD detection has dramatically benefited from the availability of large-scale, well-annotated datasets. However, the effectiveness of these datasets can be impeded by various factors, including inconsistent annotations, limited data diversity, and the presence of noise or artifacts. Recent studies underscore the necessity for robust and standardized datasets to ensure developed models’ reliable performance and generalization (Peng et al., 2019; Abushawish et al., 2024). This study utilized 10 datasets, with five dedicated to AMD and another to DR. Among them, six were gathered from existing research—four for AMD and another four for DR—while the remaining four were our proposed datasets, two for AMD and two for DR.
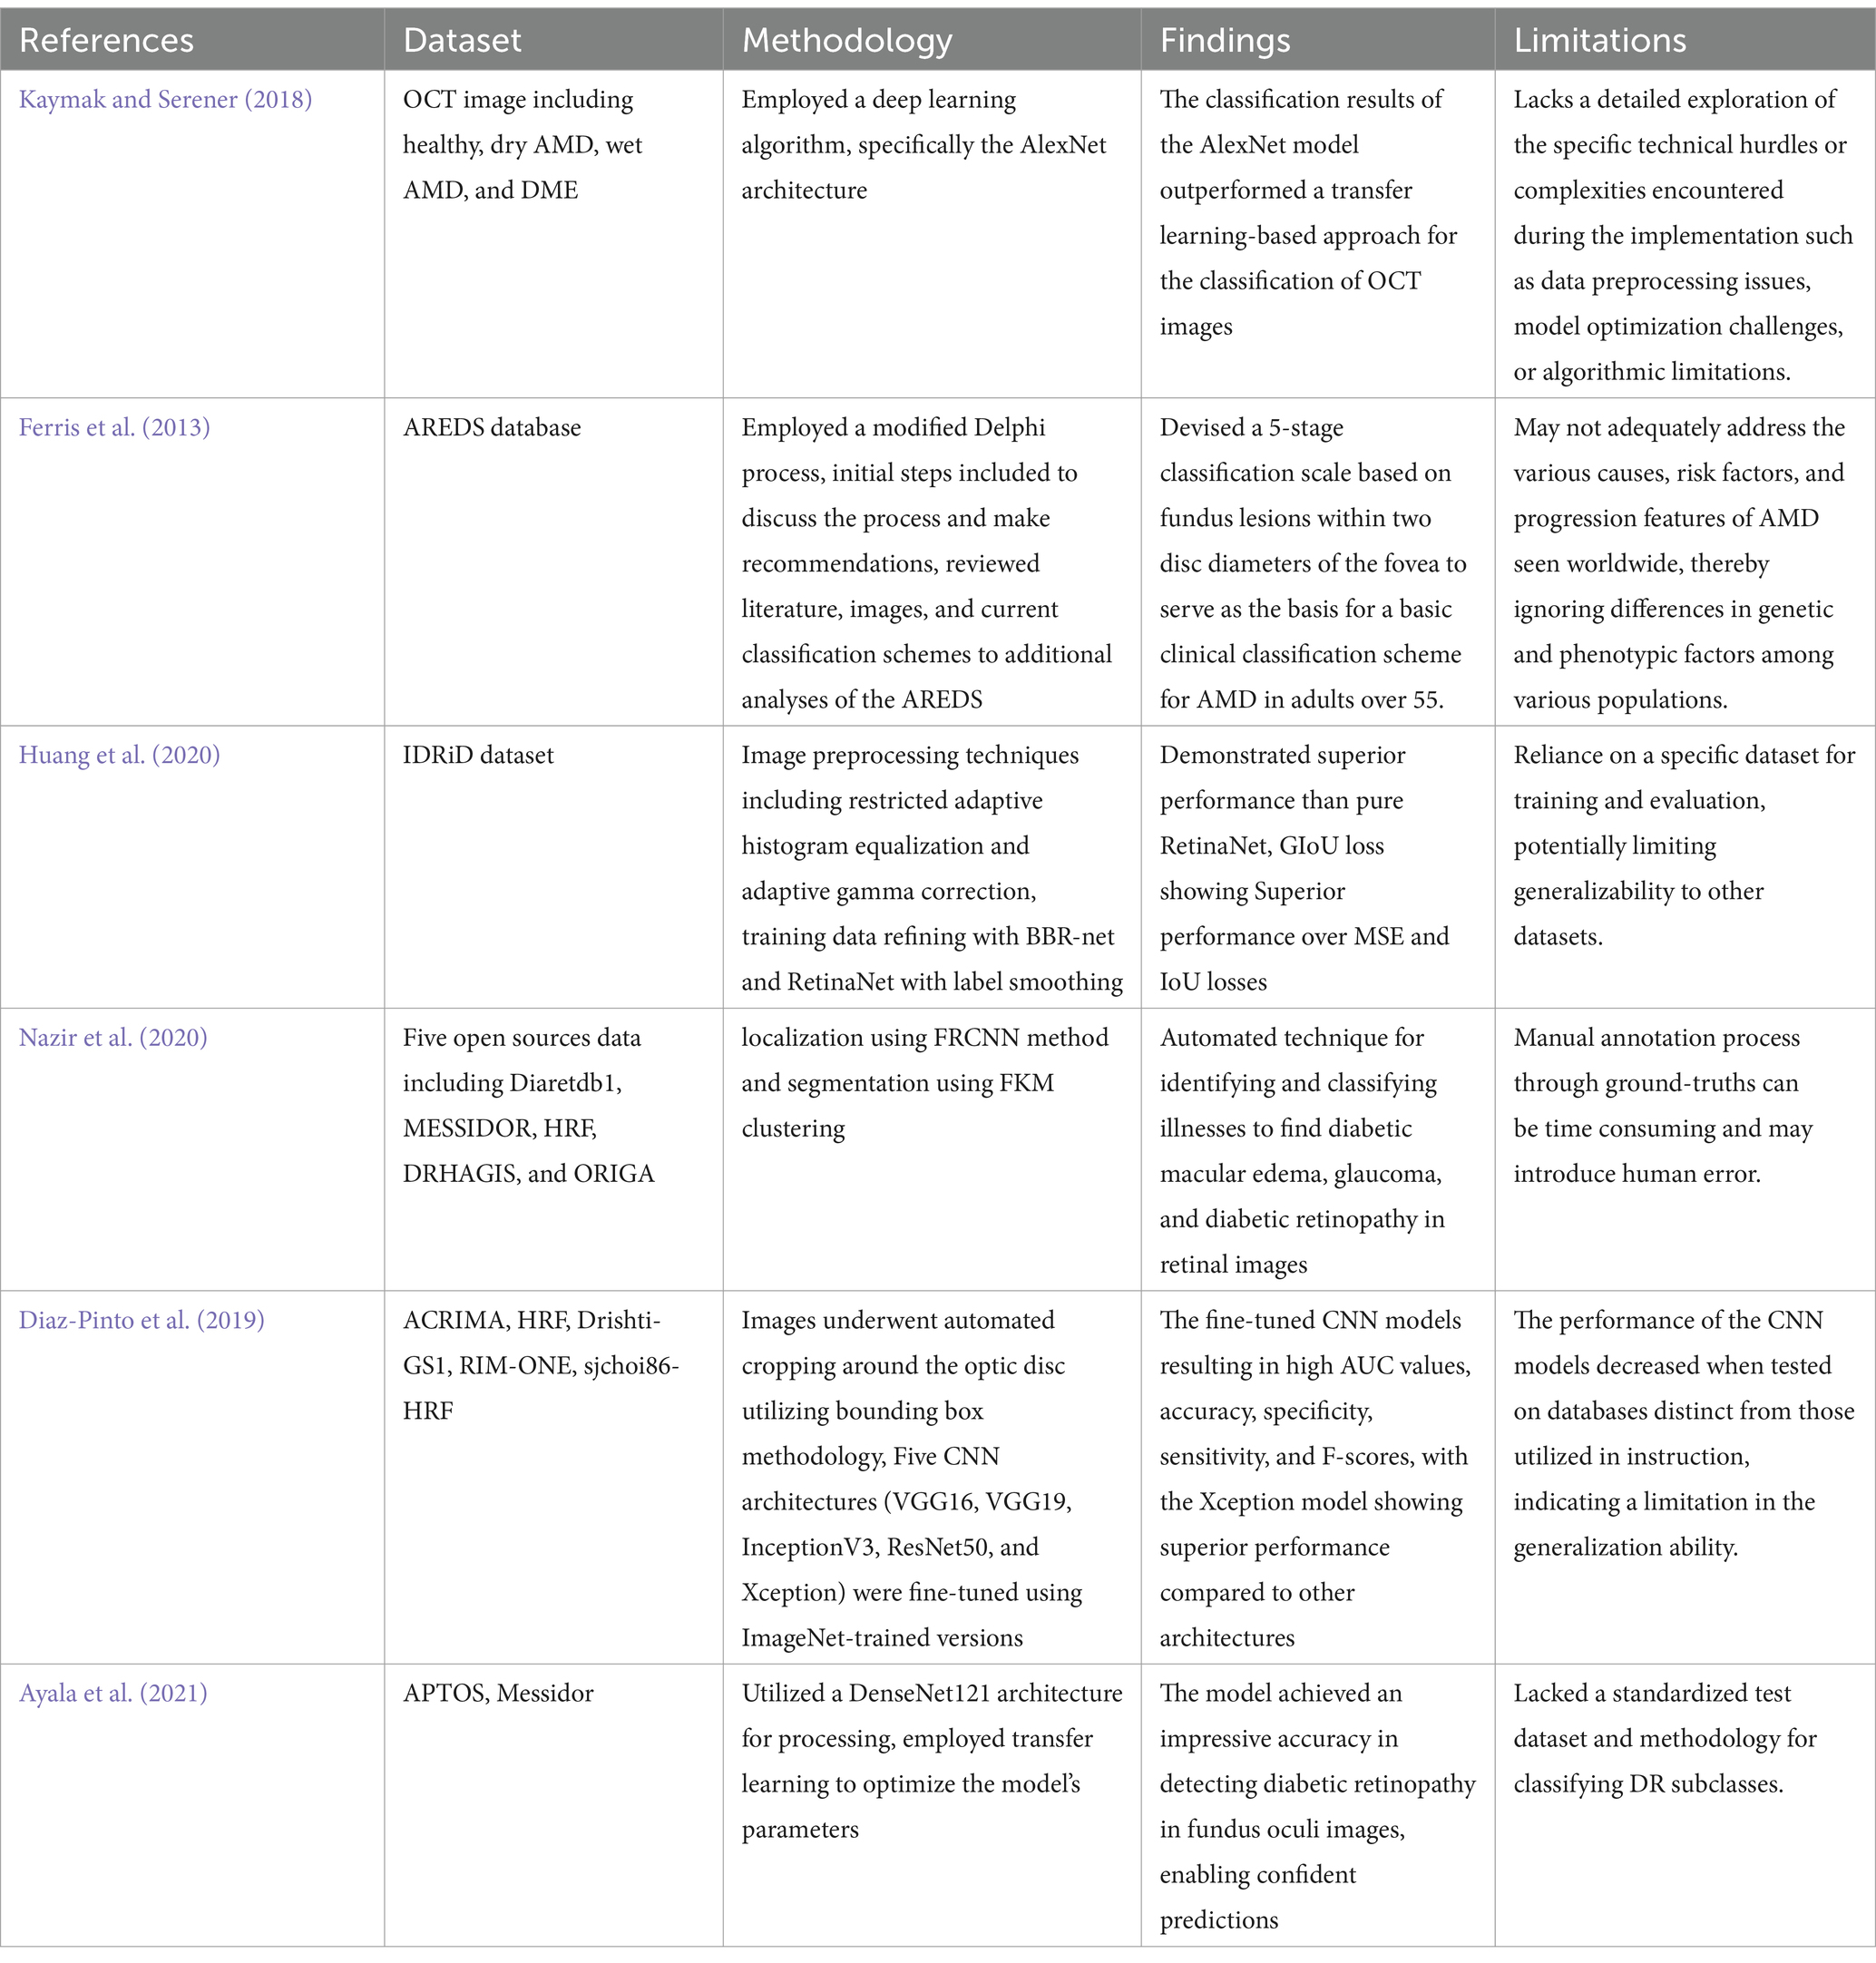
While numerous studies have explored the application of deep learning techniques for automated grading of DR and AMD, as well as lesion and drusen localization, there is a need for further investigation into the interpretability and explainability of these models in medical applications. Techniques such as Convolutional Neural Networks (CNNs) (Gulshan et al., 2016), Transfer Learning (Tan et al., 2017), and Ensemble Models (Qummar et al., 2019) have been widely employed, and object detection models like YOLO (Redmon et al., 2016), Faster R-CNN (Ren et al., 2015), and Mask R-CNN (He et al., 2017) have shown promising results in lesion and drusen localization and segmentation tasks. While most existing efforts have focused on identifying the presence of DR and AMD, a crucial gap remains in determining the various stages of these conditions. Additionally, limited work has been done on classifying and localizing all types of DR lesions and AMD drusen, which is essential for practical clinical applications (Girard et al., 2019). Many existing studies focus on either grading or lesion and drusen localization, but few have addressed both tasks simultaneously (Samek et al., 2017). Furthermore, the generalization capabilities of these models across diverse datasets and populations remain a concern (Kaushik et al., 2021). Recent advances in computational modeling, such as the Shrewd model for COVID-19 (Ashraf et al., 2022), demonstrate the efficacy of integrating dynamic simulations and real-time data to predict disease progression. Similarly, our multi-model framework applies these principles to ophthalmic diagnostics, combining YOLO-based lesion localization and hybrid ConvSVM-RF classification to achieve high-precision severity grading in DR and AMD. Existing research to detect the presence of DR and AMD, as well as localize the DR lesions and AMD drusen, is summarized in Table 3.
This study proposes a comprehensive automated screening system that utilizes a novel 6L-ConvSVM-RF model to determine the stages of AMD and DR, as well as localize the associated drusen and lesions. Additionally, this system incorporates a Contrast-Limited Adaptive Histogram Equalization (CLAHE) method to enhance image contrast and detail visibility. Simultaneously, it leverages state-of-the-art object detection models, including YOLOv8, YOLOv7, and YOLOv5, with instance segmentation capabilities to localize all types of DR lesions and AMD drusen. This proposed approach aims to emulate the diagnostic methodology of ophthalmologists by enabling the localization of DR lesions and AMD drusen, identifying their types, and determining the exact stage of DR and AMD. The system’s use of advanced deep learning techniques, such as the 6L-ConvSVM-RF model, not only facilitates an accurate and streamlined diagnostic process but also significantly improves patient care and treatment outcomes. Furthermore, this system addresses the limitations of existing works by combining grading and lesion/drusen localization tasks, while leveraging advanced deep learning techniques to enhance generalization and interpretability.
Our research endeavors aim to make significant advancements in diagnosing sight-threatening eye diseases, particularly diabetic retinopathy (DR) and age-related macular degeneration (AMD). Our contributions focus on enhancing the capabilities and accuracy of grading and diagnosing these conditions through the following approaches:
• Proposing a 6L-ConvSVM-RF Model: This proposed model combines the strengths of Convolutional Neural Networks (CNN), Support Vector Machines (SVM), and Random Forests (RF) to create a robust and accurate classification system for determining the stages of AMD and DR.
• Proposing a modified Contrast-Limited Adaptive Histogram Equalization (CLAHE) model: This modified CLAHE model is designed to enhance the contrast and visibility of details in retinal images, improving the overall image quality and facilitating better lesion and drusen detection.
• Applying Yolo Model: The study leverages state-of-the-art object detection models, including YOLOv8, YOLOv7, and YOLOv5, with instance segmentation capabilities, to accurately localize and segment all types of DR lesions and AMD drusen within retinal images.
• Applying a Grading System: Acknowledging the significance of accurate and comprehensive grading, our study employs an existing grading system that categorizes disease severity into multiple levels. This multi-level classification approach enhances diagnostic precision and specificity. For AMD, the system classifies severity into four distinct levels, while a similar multi-level classification system is introduced for DR.
• Proposing four New Datasets: Recognizing the crucial role of high-quality data in training and evaluating deep learning models, our study introduces four new datasets specifically tailored for AMD and DR. These datasets encompass diverse and representative examples of these diseases, facilitating robust model training and evaluation.
• Using Multiple Datasets: Besides the newly created datasets, our study leverages multiple existing datasets relevant to AMD and DR. This approach exposes the models to various image variations and pathological features, enhancing their generalization capabilities across diverse data.
• The combined contributions of this study address the challenges faced by existing diagnosis systems and traditional deep-learning approaches. We aim to significantly advance the grading and diagnosis of sight-threatening eye diseases. Our efforts promise to enhance patient care and clinical outcomes by improving disease detection and assessment accuracy and efficiency.
1.1 Key innovations and advancements
This study advances automated diagnosis of DR and AMD through four pivotal innovations:
Enhanced Image Preprocessing: Our modified CLAHE algorithm replaces bilinear with bicubic interpolation, reducing artifacts and improving edge preservation (Section 2.1). Quantitative improvements in PSNR (2.01%), SSIM (1.94%), and entropy (1.49%) directly enhance lesion visibility for downstream tasks.
Hybrid Classification Architecture: The 6L-ConvSVM-RF model uniquely combines CNNs, SVMs, and RFs to leverage their complementary strengths—CNNs for hierarchical feature extraction, SVMs for high-dimensional decision boundaries, and RFs for ensemble-based robustness (Section 2.3). This hybrid approach achieves up to 99.42% accuracy in severity grading, outperforming single-model frameworks.
Advanced Localization with YOLO: By integrating YOLOv8’s anchor-free detection and instance segmentation capabilities, alongside YOLOv5 and YOLOv7 for comparative analysis, our system localizes subtle lesions (e.g., microaneurysms < 63 μm) with a state-of-the-art mAP of 98.71% using YOLOv8, enabling precise disease staging (Section 2.2).
Novel, Clinically Validated Datasets: Our proposed datasets address geographic and phenotypic diversity gaps in existing repositories, with annotations validated by retinal specialists (Section 3.2.2). These datasets enable robust generalization across populations, as evidenced by consistent performance on external benchmarks.
The rest of the paper is arranged as follows: Section 2 describes the methodology of the proposed study, Section 3 shows the results and discussions, Section 4 compares with the previous study, and finally, Section 5 draws the conclusion.
2 Methodology
Driven by the urgent need to enhance the diagnosis and management of sight-threatening eye diseases, our methodology presents a comprehensive and innovative approach to improving the grading and lesion localization of DR and AMD. By seamlessly integrating state-of-the-art object detection models, advanced image enhancement techniques, and a novel classification framework, we aim to revolutionize the field of ophthalmological diagnostics. The workflow encompasses several meticulously designed stages, including data preparation, image preprocessing, object detection and localization, grading, and model training and evaluation. The following sections offer a comprehensive analysis of each stage, highlighting the innovative contributions and advancements proposed in this study, as illustrated in Figure 4.
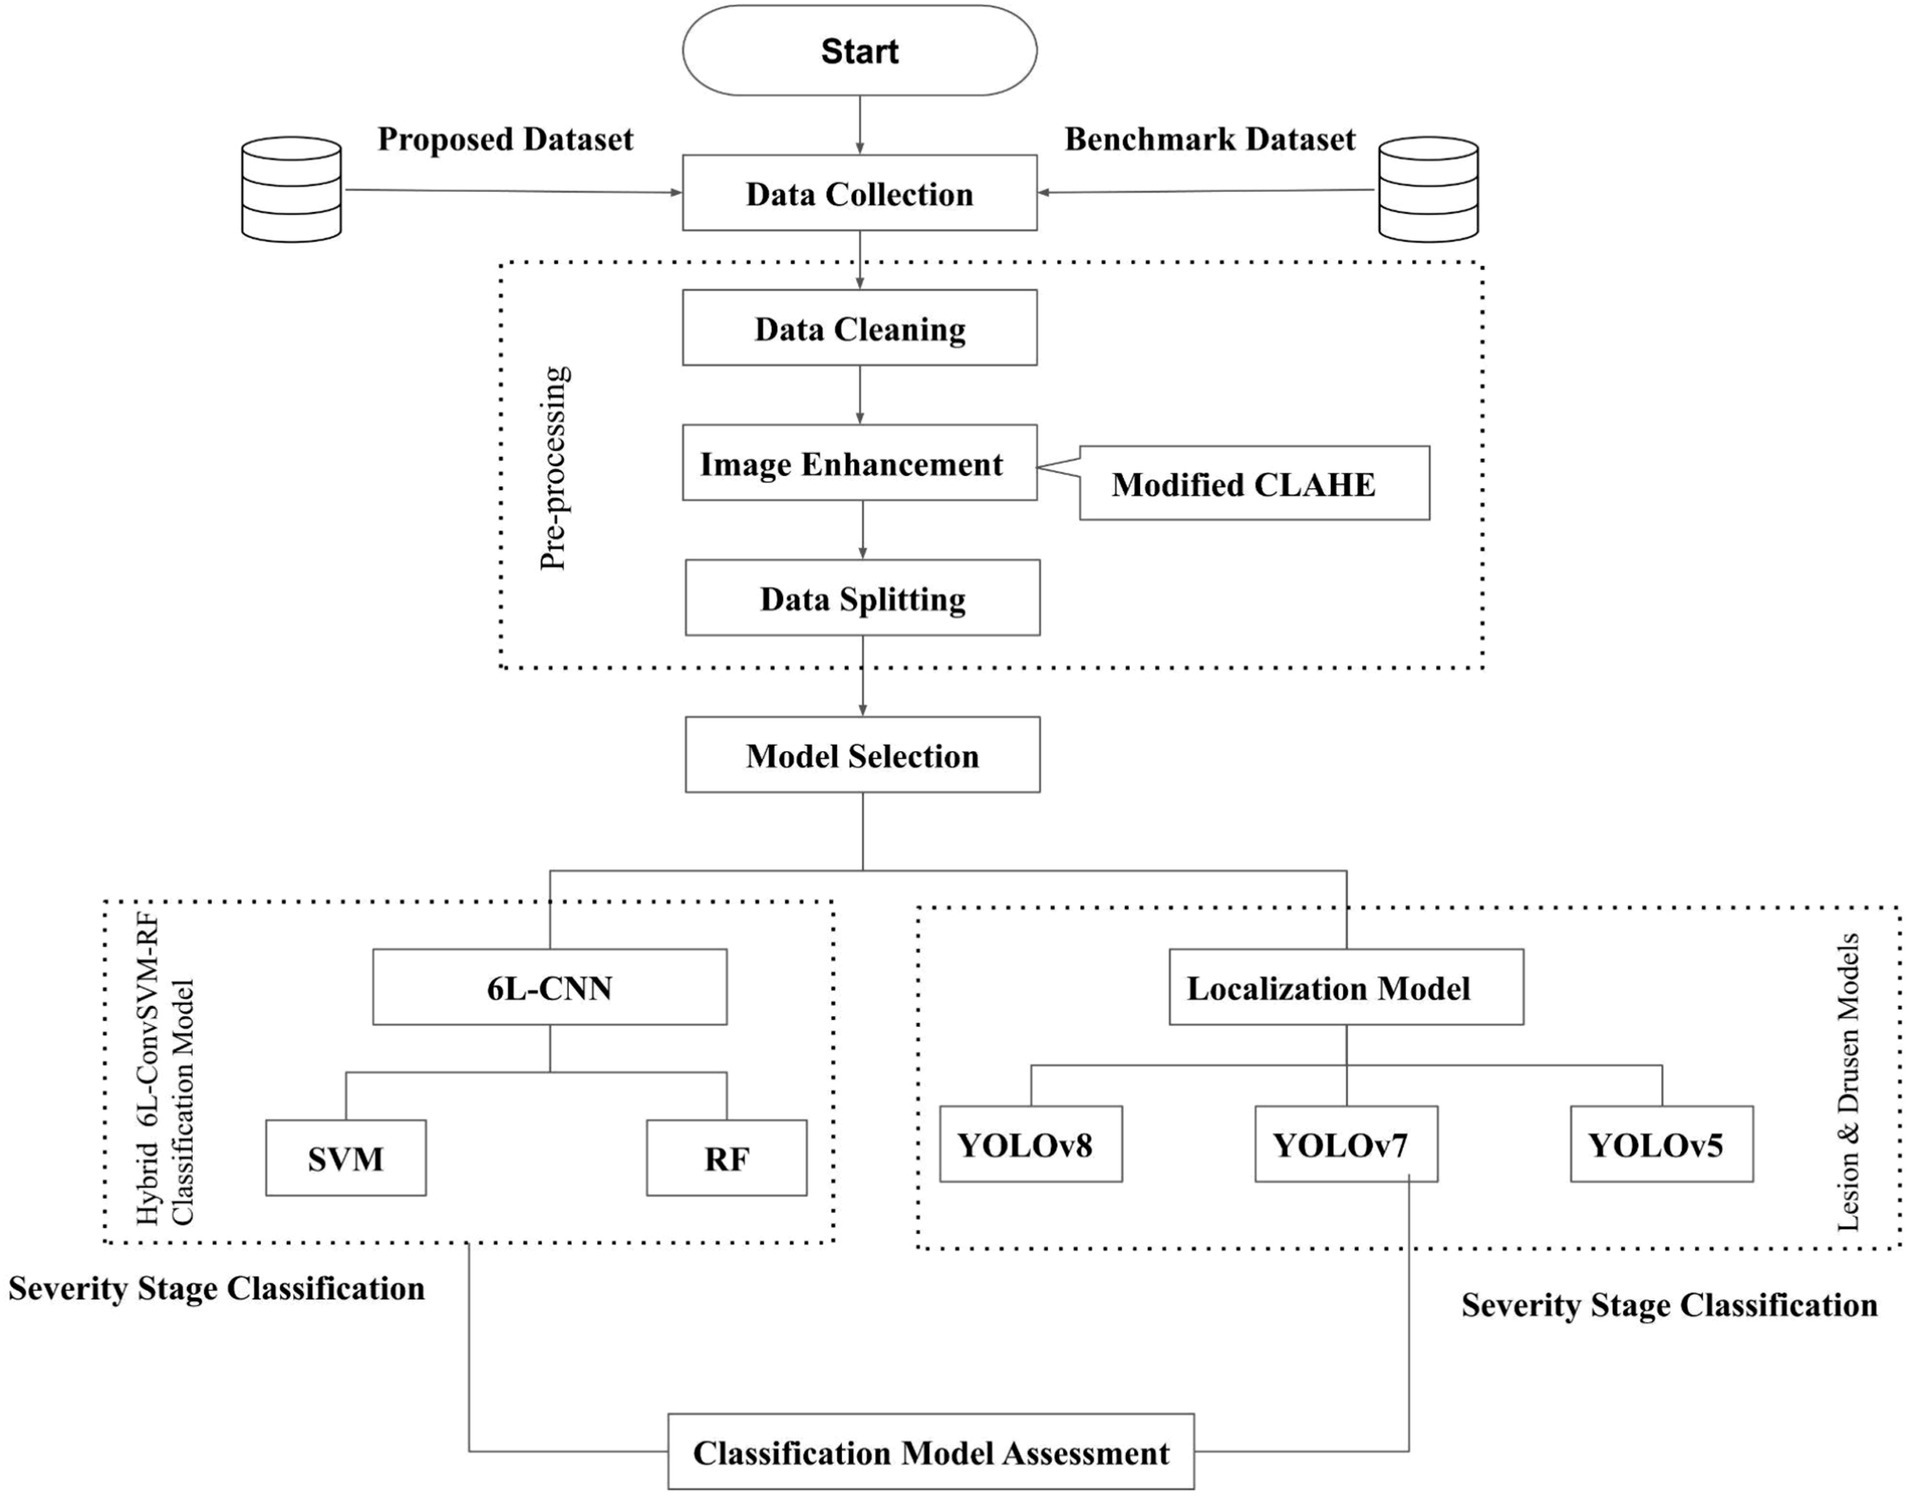
Figure 4. Comprehensive framework of the proposed AMD and DR classification and localization system.
2.1 Image enhancement
To improve the overall image quality and facilitate better lesion and drusen detection, we propose a modified Contrast-Limited Adaptive Histogram Equalization (CLAHE) model. This modified CLAHE model enhances the contrast and visibility of details in retinal images.
2.1.1 Original CLAHE
The CLAHE algorithm divides an input image into small, non-overlapping tiles (e.g., 8 × 8 or 16 × 16 pixels) and computes a histogram for each tile to represent pixel intensity distribution. A contrast-limiting step is applied to prevent noise amplification by setting a clip limit on the histogram. Excess values are redistributed across bins. A transformation function, based on the contrast-limited histogram, is used to map input pixel intensities to enhanced output values. Bilinear interpolation smooths transitions between tiles, ensuring uniform contrast enhancement without artifacts. CLAHE enhances local contrast while controlling over-enhancement and noise, with optional post-processing steps like edge sharpening or noise reduction.
2.1.2 Modified CLAHE
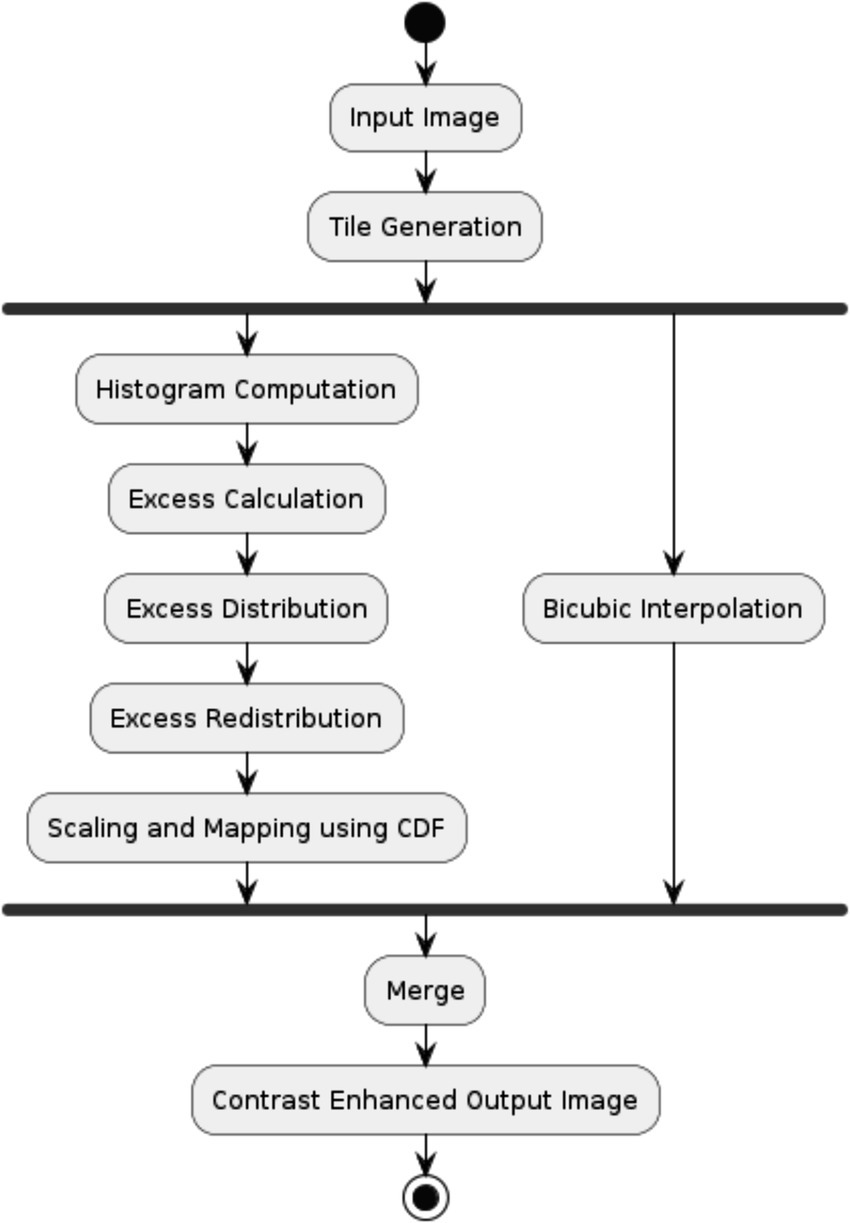
The modified Contrast Limited Adaptive Histogram Equalization (CLAHE) algorithm follows the same fundamental steps as the original algorithm, with the primary change being the replacement of bilinear interpolation with bicubic interpolation for interpolating the transformation functions across tile boundaries. The modified CLAHE figure represents Figure 5. The CLAHE algorithm has three major parts: tile generation, histogram equalization, and interpolation. The input image is first divided into sections. Each section is called a tile. Histogram equalization is then performed on each tile using a predefined clip limit. Histogram equalization consists of five steps: histogram computation, excess calculation, excess distribution, excess redistribution, and scaling and mapping using a cumulative distribution function (CDF). The histogram is computed as a set of bins for each tile. Histogram bin values above the clip limit are accumulated and distributed into other containers. CDF is then calculated for the histogram values. CDF values of each tile are scaled and mapped using the input image pixel values. In the modified algorithm, bicubic interpolation is employed instead of using bilinear interpolation to interpolate the transformation functions across tile boundaries. Bicubic interpolation is a more advanced technique that considers a larger neighborhood of pixels and utilizes bicubic polynomial functions for interpolation. This method can provide smoother transitions and potentially better image quality compared to bilinear interpolation, reducing artifacts or abrupt changes in the contrast between neighboring tiles. The resulting tiles are stitched together using bicubic interpolation to generate an output image with improved contrast. After interpolating the transformation functions using bicubic interpolation, each pixel in the input image is mapped to a new intensity value using the interpolated transformation function corresponding to its location. The transformed pixel intensities form the contrast-enhanced output image. Using bicubic interpolation in the modified CLAHE algorithm is expected to improve image quality by reducing potential artifacts or abrupt changes in contrast that may arise from bilinear interpolation. Bicubic interpolation can better preserve edge details and produce smoother transitions between tiles, resulting in a more natural, visually appealing, contrast-enhanced output image.
2.1.3 Mathematical calculation
The mathematical calculations for the modified CLAHE algorithm can be broken down into several key steps:
I Histogram Computation:
For each tile, the histogram is computed as:
In Equation (1), where represents the histogram value for the ith intensity level. is the number of possible intensity levels (typically 256 for an 8-bit image). represents the number of pixels in the tile that have the intensity value i.
II Clip Limit Application:
A clip limit C is defined as:
In Equation (2), where N is the total number of pixels in the tile, L is the number of possible intensity levels, and α is the clip factor (typically between 2 and 4).
III Excess Calculation and Redistribution:
The excess E for each bin is calculated as:
In Equation (3), E(i) represents the excess for each bin i.
The total excess is then redistributed equally among all bins:
In Equation (4), H(i) represents the histogram value for intensity level i.
IV Cumulative Distribution Function (CDF) Calculation:
The CDF for each tile is computed as:
In Equation (5), CDF(i) represents the Cumulative Distribution Function for intensity level i.
V Transformation Function:
The transformation function for each tile is:
In Equation (6), T(i) represents the Transformation function for intensity level i.
VI Bicubic Interpolation:
For a pixel (x, y) located between four neighboring tiles, the output intensity is calculated using bicubic interpolation:
In Equation (7), where are the 16 bicubic coefficients, and and are the normalized distances to the tile centers.
The bicubic coefficients are determined by solving a system of equations that ensure continuity of the function and its first derivatives at the known points.
VII Final Pixel Mapping:
Each input pixel I(x,y) is mapped to an output pixel O(x,y) using the interpolated transformation function:
In Equation (8), where g is the bicubic interpolation function and T is the transformation function.
This mathematical framework ensures that the contrast enhancement is applied adaptively across the image while maintaining smooth transitions between tiles through bicubic interpolation. The clip limit prevents over-enhancement of noise, while the bicubic interpolation helps preserve edge details and reduce artifacts that might arise from more straightforward interpolation methods.
2.2 Severity stages detection and localization
Our study utilizes state-of-the-art object detection models, including YOLOv8, YOLOv7, and YOLOv5, with instance segmentation capabilities, to accurately localize and segment all types of DR lesions and AMD drusen within retinal images. These models are trained on the combined dataset, including the newly collected and existing datasets.
2.2.1 Instance segmentation
Instance segmentation is a computer vision task that combines object detection and semantic segmentation. It involves identifying individual objects in an image, classifying them, and delineating their precise boundaries at the pixel level. In the context of our study, instance segmentation is employed to localize accurately and segment individual lesions and drusen associated with DR and AMD, respectively. Among the various approaches to instance segmentation, we use a detection-based instance segmentation technique, which leverages the capabilities of object detection models like YOLOv8, YOLOv7, and YOLOv5. This approach first detects the bounding boxes around the objects of interest (lesions or drusen) using the object detection component of the model. Subsequently, a separate segmentation branch predicts pixel-wise masks for each detected object within its respective bounding box.
The detection-based instance segmentation process can be broken down into the following steps:
a Object Detection:
The object detection component of the model, such as YOLOv8, YOLOv7, or YOLOv5, identifies the bounding boxes enclosing the objects of interest (lesions or drusen) in the input image.
b Region Proposal Generation:
For each detected bounding box, a region proposal is generated, defining the area within the bounding box where the segmentation branch will operate.
c Pixel-wise Segmentation:
The segmentation branch of the model processes the region proposal and predicts a pixel-wise mask, delineating the precise boundaries of the object within the bounding box.
d Instance Association:
Predicted pixel-wise masks are linked to corresponding detected objects, segmenting individual lesions or drusen. This approach combines object detection for localization with semantic segmentation for precise boundaries. It enables accurate delineation of individual pathological features, crucial for assessing DR and AMD severity and progression, improving diagnosis and treatment planning.
2.2.2 Detection-based instance segmentation with YOLOv8, YOLOv7, and YOLOv5
The selection of YOLOv8, YOLOv7, and YOLOv5 for lesion detection and instance segmentation was strategically motivated by their complementary strengths in medical image analysis. YOLOv8 represents the latest evolution in the YOLO architecture, offering enhanced feature extraction capabilities through its sophisticated backbone network and improved performance on small object detection—a crucial consideration for identifying subtle retinal lesions. YOLOv7 provides exceptional accuracy in instance segmentation tasks while maintaining computational efficiency, making it particularly valuable for processing high-resolution fundus images. YOLOv5 contributes robust performance stability and proven reliability in medical imaging applications, serving as a validated baseline for comparison. This multi-model approach enables comprehensive validation of our findings while leveraging the unique advantages of each architecture. The combination of these models allows us to address the inherent challenges in retinal image analysis, including varying lesion sizes, complex morphological features, and the need for precise boundary delineation.
2.2.3 YOLOv5 model
The YOLOv5 model, central to our detection and segmentation tasks, combines a strong backbone for feature extraction with a multi-scale feature fusion neck. Its dual-headed design supports both object detection and instance segmentation, using dense prediction for bounding boxes and classification, while a segmentation branch generates pixel-wise masks. A multitask loss function optimizes detection and segmentation, with post-processing like non-maximum suppression and mask refinement improving accuracy. The data augmentation pipeline enhances model robustness, making this modified YOLOv5 well-suited for detecting DR lesions and AMD drusen, potentially advancing ophthalmic diagnosis and patient care.
2.2.4 YOLOv7 model
YOLOv7, a cutting-edge object detection model, enhances detection and segmentation of DR lesions and AMD drusen in our study. It includes an advanced backbone for feature extraction and a neck component using techniques like BiFPN or ECA for multi-scale feature fusion. Its dual-headed design supports object detection and instance segmentation, with dense predictions for bounding boxes and a segmentation branch for high-resolution masks. The model uses advanced loss functions and post-processing techniques like non-maximum suppression and mask refinement to boost accuracy. A data augmentation pipeline enhances robustness, making YOLOv7 ideal for retinal pathology detection and improving automated diagnosis in ophthalmology.
2.2.5 YOLOv8 model
YOLOv8, the latest in the YOLO series, offers significant improvements in detecting and segmenting DR lesions and AMD drusen. It features an advanced backbone with efficient convolutions and attention mechanisms for enhanced feature extraction, while the neck uses techniques like BiFPN or ECA for multi-scale feature fusion. YOLOv8 natively supports instance segmentation, efficiently integrating detection and segmentation. It employs a dense prediction strategy for generating bounding boxes, classification scores, and segmentation masks simultaneously. With advanced loss functions, post-processing, and a robust data augmentation pipeline, YOLOv8 promises exceptional accuracy, potentially transforming retinal pathology diagnosis and patient care.
2.3 Proposed 6L-ConvSVM-RF model
We propose a novel 6L-ConvSVM-RF Model that combines the strengths of Convolutional Neural Networks (CNN), Support Vector Machines (SVM), and Random Forests (RF) to create a robust and accurate classification system for determining the stages of AMD and DR. The development of our 6L-ConvSVM-RF Model was motivated by the need to overcome limitations in existing single-architecture approaches to retinal disease classification. The integration of CNN, SVM, and RF components creates a synergistic system that capitalizes on each algorithm’s strengths: CNNs excel at hierarchical feature extraction from complex visual data, SVMs provide optimal hyperplane separation for multi-class classification, and Random Forests offer robust performance through ensemble decision-making. The 6-layer CNN architecture was specifically designed to balance feature extraction depth with computational efficiency. This design choice was informed by extensive experimentation showing that six convolutional layers provide optimal performance for retinal image analysis, capturing both fine-grained lesion characteristics and broader contextual features without overfitting. The subsequent integration of SVM and RF classifiers enhances the model’s ability to handle class imbalance and make more robust predictions based on the extracted features.
2.3.1 Architecture of 6-layer-convolutional neural networks
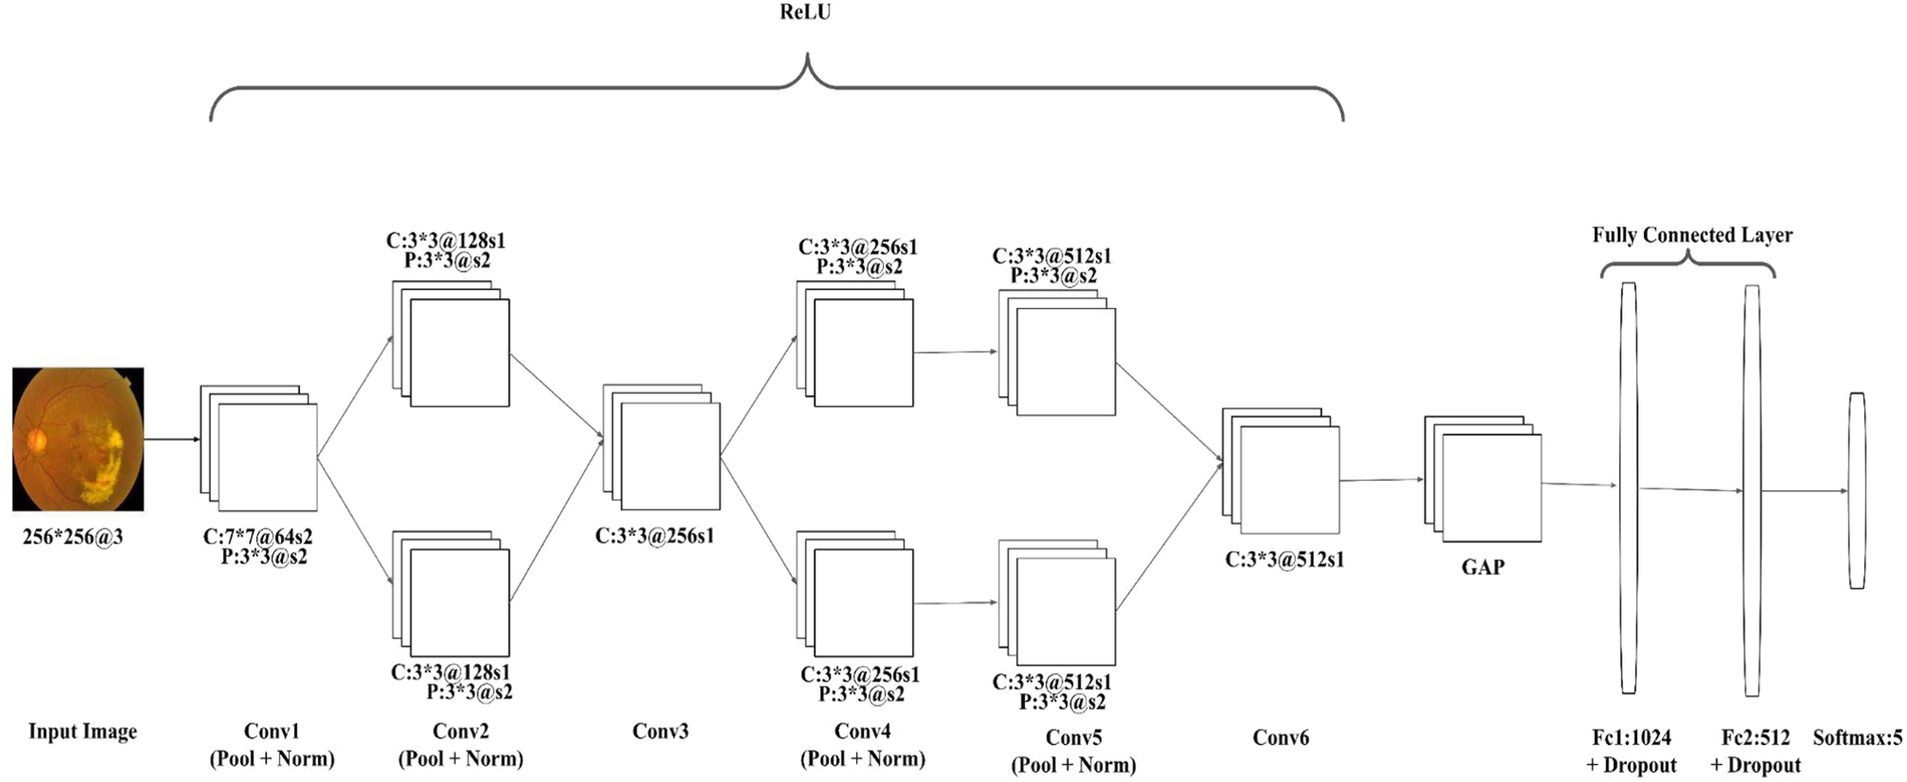
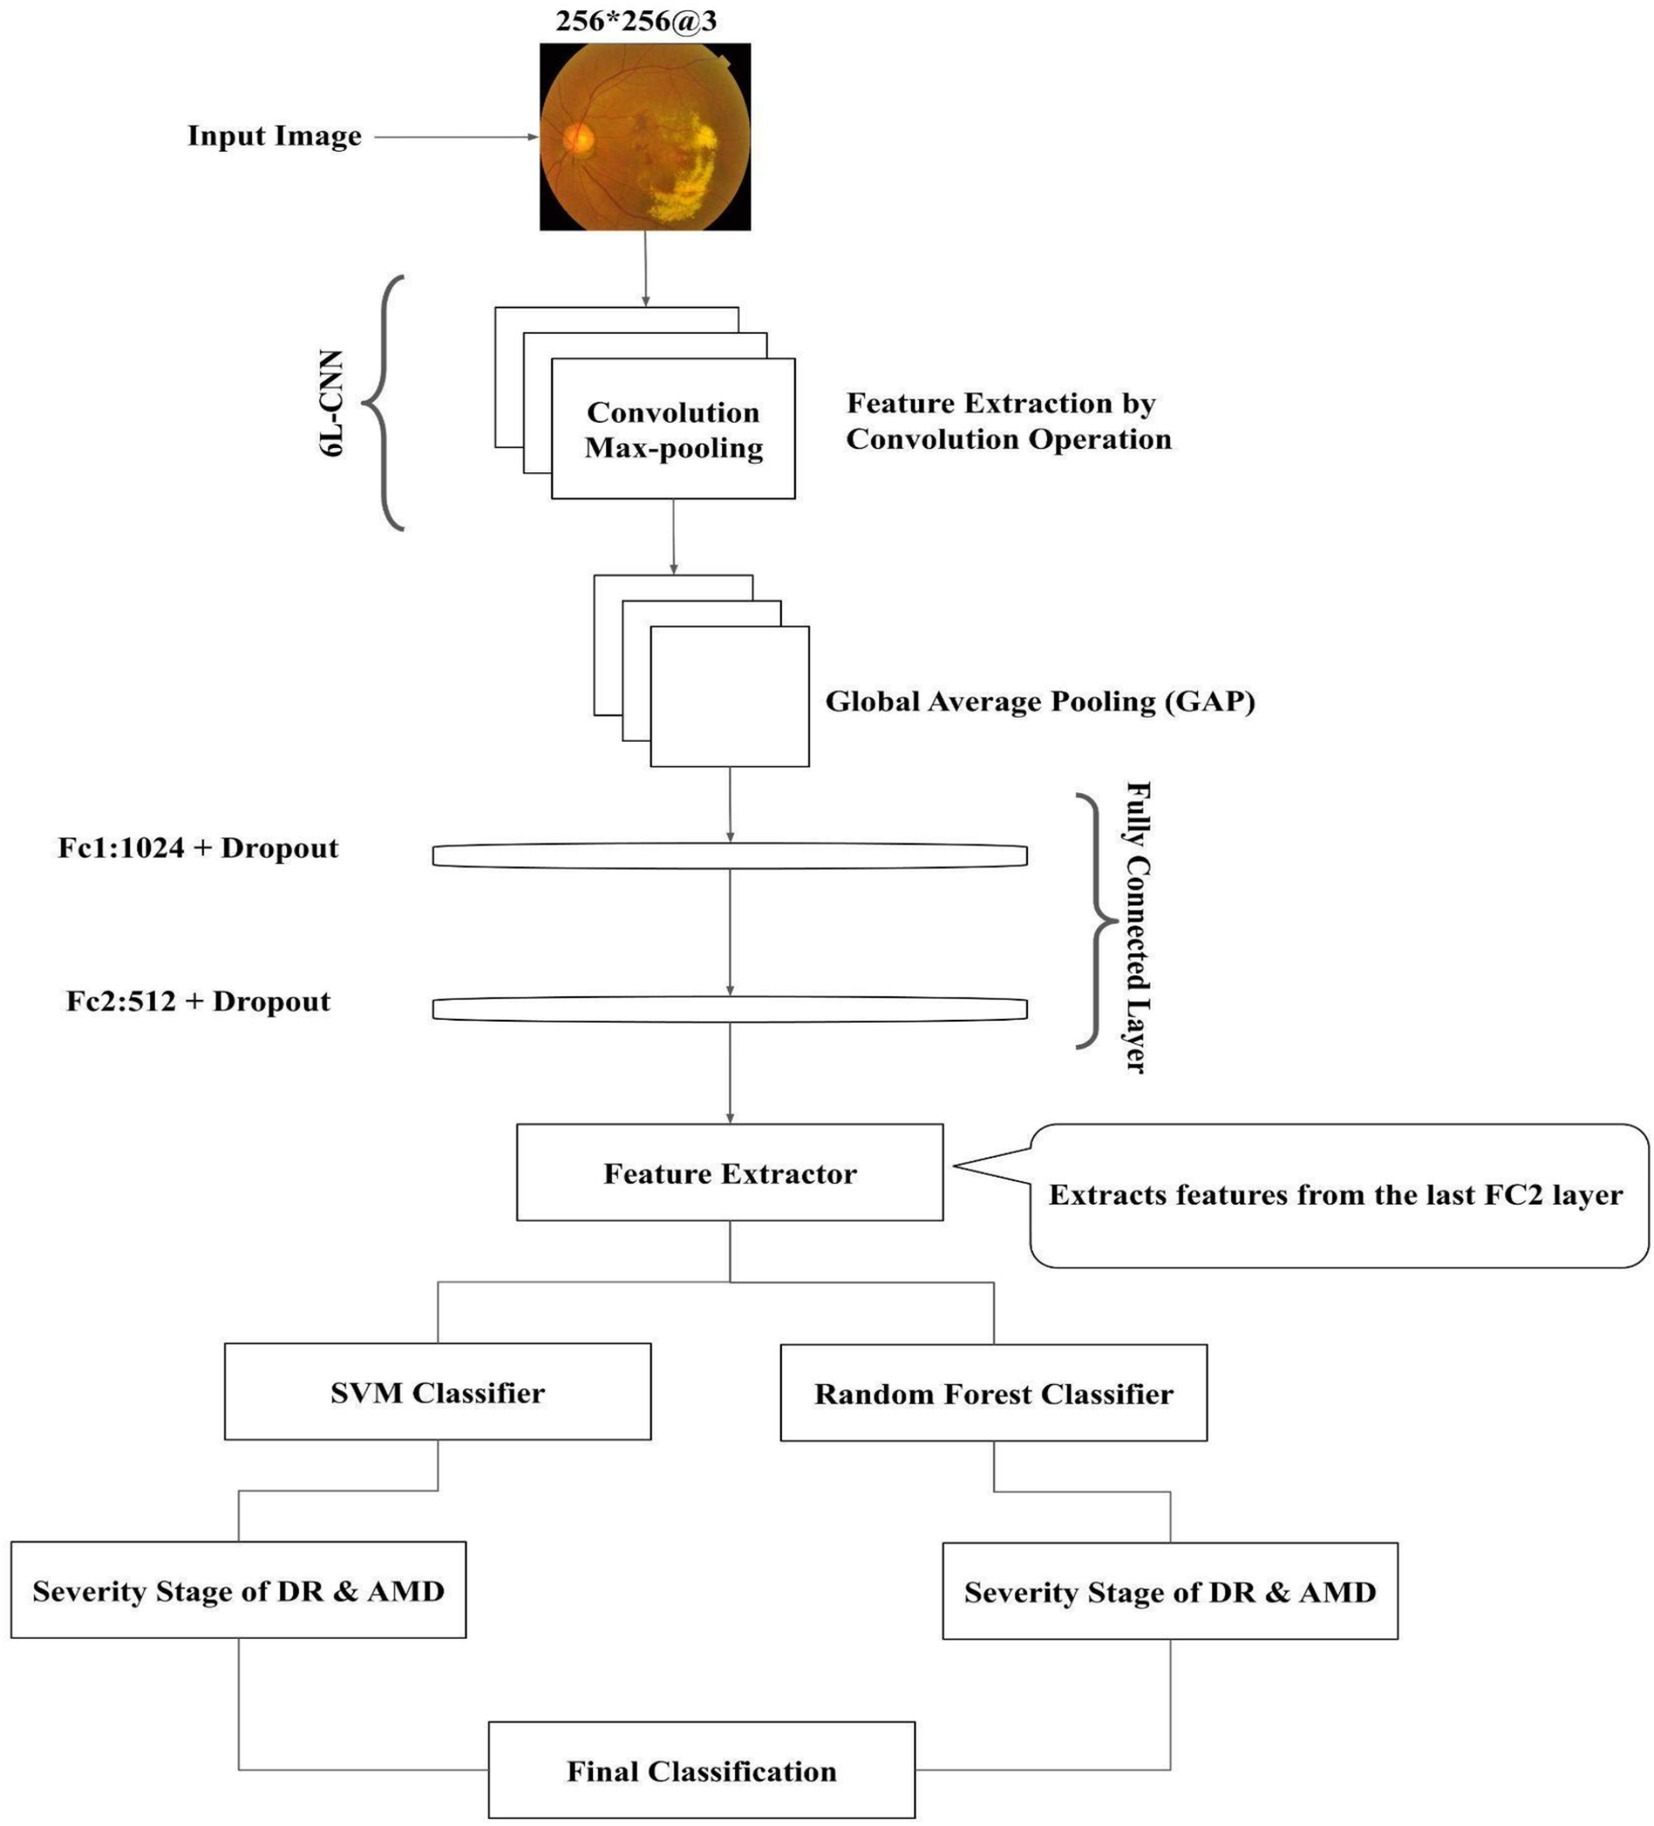
The core component of our proposed 6L-ConvSVM-RF Model is a robust and efficient Convolutional Neural Network (CNN) architecture meticulously designed to extract discriminative features from retinal images for accurate classification of AMD and DR stages. This CNN architecture consists of six convolutional layers, multiple pooling layers, and two fully connected layers strategically stacked to create a robust and comprehensive feature extraction pipeline, represented by Figure 6.
The convolutional layers form the backbone of the CNN, which is responsible for capturing spatial and hierarchical patterns within the input images. Our architecture begins with a first convolutional layer comprising 64 kernels of size 7 × 7 with a stride of 2, acting as low-level feature detectors. The subsequent convolutional layers increase in complexity, with Conv2 and Conv4 featuring two parallel sets of 128 and 256 filters, each of size 3 × 3. Conv3 uses 256 filters, while Conv5 and Conv6 employ 512 filters each, all with a 3 × 3 kernel size. This progressive increase in filter numbers allows for capturing increasingly complex and abstract features as the network deepens. We employ max pooling layers strategically throughout the network to enhance the robustness and translation invariance of the extracted features. The first max pooling layer follows Conv1, using a 3 × 3 window with a stride of 2. Subsequent pooling layers are paired with Conv2, Conv4, and Conv5, using similar 3 × 3 windows with stride 2, effectively reducing spatial dimensions while retaining the most salient features. The rectified linear unit (ReLU) activation function is employed after all convolutional and fully connected layers, introducing non-linearity and facilitating the learning of complex mappings between the input and output spaces. ReLU’s ability to handle sparse representations and its computational efficiency make it a powerful choice for our CNN architecture. Following the convolutional and pooling layers, a Global Average Pooling layer is introduced to reduce spatial dimensions before the fully connected layers. Two fully connected layers with 1,024 and 512 units are then incorporated, integrating and combining the high-level features extracted from the previous layers. These fully connected layers, followed by ReLU activation and dropout, act as feature extractors, preparing the extracted features for subsequent classification by the SVM and RF models. The CNN model processes input images with a resolution of 256 × 256 pixels and three color channels. The output layer uses a softmax activation with 5 units, corresponding to different classes or severity stages of AMD or DR. This configuration balances computational efficiency and preserves crucial image details, enabling accurate feature extraction and classification. The 6-layer Convolutional Neural Network architecture, with its carefully crafted design and optimization strategies, forms the backbone of our proposed 6L-ConvSVM-RF Model. Its depth, parallel processing capabilities, and strategic use of pooling and activation functions enable robust feature extraction, laying the foundation for accurate classification of AMD and DR stages by the subsequent SVM and RF components.
2.3.2 Support vector machines
The 6L-ConvSVM-RF Model integrates Support Vector Machines (SVM) with CNN-based feature extraction to enhance the classification of AMD and DR stages. SVMs excel at creating optimal hyperplanes in high-dimensional spaces, making them ideal for complex disease stage differentiation. The model employs carefully selected kernel functions, such as radial basis function (RBF) or polynomial kernels, to map CNN-extracted features into higher-dimensional spaces, capturing intricate patterns. Hyperparameter optimization, including the regularization parameter (C) and kernel parameters, balances model complexity and generalization performance. This integration offers several benefits: it leverages SVM’s discriminative power in high-dimensional spaces, enhances model robustness and generalization, and improves the interpretability of classification decisions. By combining CNN feature extraction with SVM classification, the 6L-ConvSVM-RF Model capitalizes on the strengths of both techniques, enabling accurate and reliable classification of AMD and DR stages.
2.3.3 Random forests
The 6L-ConvSVM-RF Model incorporates Random Forests (RF) as an additional classification component, complementing CNN’s feature extraction and SVM’s classification capabilities. Random Forests, an ensemble learning method, combines multiple decision trees to achieve robust classification. In our model, the RF component processes the CNN-extracted features in parallel with the SVM, constructing an ensemble of trees trained on random feature subsets and bootstrapped data samples. This approach enhances pattern recognition and reduces overfitting risks. Through rigorous cross-validation, we optimize key RF hyperparameters, including the number of trees, maximum tree depth, and features considered for node splitting. The RF component excels at handling high-dimensional, non-linear data and modeling complex feature interactions. It also offers interpretability and feature importance estimation, providing insights into discriminative features for AMD and DR staging. By integrating Random Forests, our model gains an additional layer of robustness and diversity, leveraging the collective strength of multiple classifiers for more accurate and reliable disease stage classification.
2.3.4 Hybrid architecture of 6L-ConvSVM-RF
The proposed 6L-ConvSVM-RF Model represents a novel and robust hybrid architecture that synergistically combines the strengths of Convolutional Neural Networks (CNN), Support Vector Machines (SVM), and Random Forests (RF). This unique combination of techniques leverages the discriminative feature extraction capabilities of CNNs with the robust classification performance of SVMs and the ensemble learning power of Random Forests, creating a comprehensive and accurate system for determining the stages of AMD and DR. Figure 7 represents the proposed hybrid architecture.
The 6L-ConvSVM-RF Model is built on a 6-Layer Convolutional Neural Network (CNN) architecture, designed to extract high-level, discriminative features from retinal images. This CNN component captures spatial and hierarchical patterns within the input data, providing a rich representation of pathological features associated with AMD and DR. The extracted features are then fed into two parallel classification components: Support Vector Machines (SVM) and Random Forests (RF). The SVM component constructs high-dimensional hyperplanes to optimally separate the extracted features into their respective classes, representing various stages of AMD and DR. By using carefully selected kernel functions and optimized hyperparameters, the SVM effectively captures non-linear relationships and handles high-dimensional feature spaces, ensuring precise classification boundaries. Simultaneously, the Random Forests component builds an ensemble of decision trees, each trained on a randomly selected subset of features and a bootstrapped sample of the training data. This ensemble approach introduces diversity among individual trees, enhancing the model’s ability to capture complex patterns and reducing overfitting risks. The RF component also offers interpretability and feature importance estimation, contributing to a deeper understanding of underlying disease mechanisms. The outputs of the SVM and RF components are combined through a sophisticated fusion strategy, which may include majority voting, weighted averaging, or advanced techniques like stacking or blending. This fusion leverages the strengths of both classifiers to produce a final classification decision. By integrating CNN feature extraction with SVM and Random Forests classification, the 6L-ConvSVM-RF Model offers a comprehensive and robust solution for accurately classifying AMD and DR stages. This hybrid architecture leverages the complementary strengths of each technique, mitigating limitations and enhancing overall classification performance. The model’s interpretability also provides insights into disease mechanisms, potentially informing future research and more targeted diagnostic and treatment strategies.
3 Result and discussion
Our proposed methodology for enhanced grading and lesion localization of diabetic retinopathy (DR) and age-related macular degeneration (AMD) was evaluated using a comprehensive set of metrics. These metrics were chosen to assess each component of our pipeline: image enhancement, lesion detection and segmentation, and disease classification. For DR lesions and AMD drusen detection using YOLO models (YOLOv8, YOLOv7, and YOLOv5), we employed precision, recall, mean Average Precision (mAP), and Intersection over Union (IoU). Our modified Contrast-Limited Adaptive Histogram Equalization (CLAHE) model was evaluated using Peak Signal-to-Noise Ratio (PSNR), Structural Similarity Index (SSIM), Contrast Improvement Index (CII), Entropy, and Mean Square Error (MSE). The classification stage was assessed using accuracy, precision, recall, specificity, sensitivity, and F1-score analysis. This comprehensive evaluation approach allows us to rigorously evaluate each component’s performance, identify strengths, and pinpoint areas for improvement. The following sections present detailed results for each set of metrics, analyzing our models’ performance and comparing them with existing state-of-the-art approaches.
3.1 Evaluation metrics
3.1.1 Detecting and segmenting DR lesions and AMD drusen
a) Precision:
Precision measures the accuracy of positive predictions. It represents the proportion of correctly identified lesions or drusen among all the detections made by the model.
In Equation (9), where (True Positives) are correctly identified lesions/drusen, and (False Positives) are incorrectly identified lesions/drusen.
b) Recall:
Recall measures the completeness of positive predictions. It represents the proportion of actual lesions or drusen in the image that were correctly identified by the model.
In Equation (10), where (True Positives) are correctly identified lesions/drusen, and (False Negatives) are missed lesions/drusen.
c) IoU (intersection over Union):
In Equation (11), measures the overlap between the predicted segmentation mask and the ground truth mask.
d) mAP (mean average precision):
provides a single metric that balances precision and recall across all lesion types. It’s calculated over a range of threshold.
In Equation (12), where is the number of classes (types of lesions/drusen).
3.1.2 For CLAHE (image enhancement evaluation)
a) Peak signal-to-noise ratio (PSNR):
measures the ratio between the maximum possible signal power and the power of distorting noise.
In Equation (13), where is the maximum possible pixel value, and is the Mean Squared Error.
b) Structural similarity index (SSIM):
assesses the similarity of two images in terms of luminance, contrast, and structure.
In Equation (14), where are luminance, contrast, and structural components, respectively. Also are α > 0, β > 0, γ > 0 denote the relative importance of each of the metrics.
c) Entropy:
measures the average amount of information contained in the image.
In Equation (15), where is the probability of pixel intensity i.
d) Mean square error (MSE):
measures the average squared difference between the enhanced and original images.
In Equation (16), where and are the original and enhanced images, respectively, and , are image dimensions.
3.1.3 For classification
a) Accuracy:
In Equation (17), is the proportion of correct predictions (both true positives and true negatives) among the total number of cases examined.
b) Precision:
measures the accuracy of positive predictions. It represents the proportion of correctly identified severity stages among all the detections made by the model.
In Equation (18), where (True Positives) are correctly identified severity stages, and (False Positives) are incorrectly identified severity stages.
c) Recall or Sensitivity:
measures the completeness of positive predictions. It represents the proportion of actual severity stages in the image that were correctly identified by the model.
In Equation (19), where (True Positives) are correctly identified severity stages, and (False Negatives) are missed severity stages.
d) Specificity:
In Equation (20), measures the proportion of actual negatives that are correctly identified.
e) F1-score:
In Equation (21), is the harmonic mean of precision and recall, providing a single score that balances both metrics.
3.2 Training methodology and parameters
The training of our models was conducted using a systematic approach to ensure reproducibility and optimal performance. For all experiments, we utilized NVIDIA RTX 3090 GPUs with 26GB memory. The training process was implemented using Tensorflow framework.
3.2.1 YOLO models implementation
The YOLO models (v8, v7, and v5) were trained using the following specifications: For object detection tasks, we employed a batch size of 12 with an initial learning rate of 0.01, utilizing the Adam optimizer with weight decay of 0.0005. The models were trained for 100 epochs, implementing a cosine learning rate scheduler. Data augmentation techniques included random horizontal flips (probability 0.5), random rotation (±15 degrees), and random brightness and contrast adjustments (±0.2). The input images were resized to 640 × 640 pixels while maintaining the aspect ratio through padding.
3.2.2 6L-ConvSVM-RF model implementation
Our proposed 6L-ConvSVM-RF model’s training was conducted in multiple stages to optimize each component: The CNN component was trained using a batch size of 16 with an initial learning rate of 0.001, employing the Adam optimizer with momentum 0.9. We implemented an early stopping mechanism with a patience of 10 epochs, monitoring validation loss. The learning rate was reduced by a factor of 0.1 when validation loss plateaued for 5 epochs. For the SVM component, we utilized a Radial Basis Function (RBF) kernel with C = 1.0 and gamma = “scale.” The features extracted from the CNN were normalized using standard scaling before being fed into the SVM classifier. The Random Forest classifier was configured with 100 trees, maximum depth of 10, and minimum samples split of 2. Feature importance was calculated using the Gini importance metric.
3.2.3 Data processing specifications
All models were trained using an 80-10-10 split for training, validation, and testing sets, respectively. The split was stratified to maintain class distribution across all sets. We employed 10-fold cross-validation during development to ensure robust performance evaluation.
3.3 Dataset preparation
In this study, we utilize existing and newly collected datasets to train and evaluate our proposed models for the grading and localization of DR and AMD. To ensure a comprehensive and diverse representation of these diseases, we have collected two new datasets designed explicitly for AMD and DR. These datasets encompass various disease severity levels and pathological features, facilitating robust model training and evaluation.
3.3.1 Benchmark dataset
The study utilizes several datasets for classifying and detecting diabetic retinopathy (DR) and age-related macular degeneration (AMD). The Asia Pacific Tele-Ophthalmology Society 2019 Blindness Detection (APTOS 2019 BD) dataset, containing 3,662 high-resolution retinal images from rural India, categorizes DR into five severity levels and is available on Kaggle (APTOS, 2019). The Indian Diabetic Retinopathy Image Dataset (IDRiD) includes 516 eye images with DR and Diabetic Macular Edema (DME) severity information (Porwal et al., 2018). It features three sub-challenges: lesion segmentation, DR and DME classification, and optic disc and fovea localization. The Fine-Grained Annotated Diabetic Retinopathy (FGADR) dataset comprises 2,842 images with detailed lesion annotations (Zhou et al., 2020). It focuses on lesion segmentation, DR grading, and multi-disease estimation using transfer learning. The STARE (Structured Analysis of the Retina) dataset, initiated in 1975 and released in 2000, contains 400 raw images (STARE, 2000). For this study, 42 images were used for AMD classification and object detection. The Ocular Disease Intelligent Recognition (ODIR) dataset includes images from 5,000 people across Chinese medical centers (ODIR, 2019). It categorizes images into eight different labels including AMD and other eye conditions. The study used 842 images from this dataset for AMD analysis. The Retinal Fundus Multi-Disease Image Dataset (RFMiD) contains 3,200 images categorized into 45 different types of diseases (Pachade et al., 2021). For this study, 169 images were used to classify and detect AMD objects. These diverse datasets provide a comprehensive foundation for developing and evaluating algorithms for the detection and classification of various eye diseases, particularly DR and AMD. They offer a range of image qualities, disease severities, and annotation types, enabling researchers to create more robust and accurate diagnostic tools for ophthalmology.
3.3.2 Proposed dataset
A meticulous approach was adopted to gather the dataset, involving the acquisition of six benchmark datasets from existing research sources and creating four proprietary datasets. The four custom-proposed datasets were carefully collected under the observations of three medical experts from two local hospitals named Khulna Eye Hospital and Laser Center Limited, Khulna, Bangladesh, and Khulna BNSB Eye Hospital, Badamtola, Khulna, Bangladesh, ensuring that they are representative of real-world scenarios. The labeling experts carefully observed the detection process, annotations, and lesion detection procedures. Around 8,000 fundus photographs were collected related to multiple eye diseases from Khulna Eye Hospital and Laser Center Limited (KLC), Khulna, Bangladesh, from which 3,400 images were utilized for DR lesion detection and classification purposes and 340 images were used for AMD lesion detection and classification. Around 10,000 images were collected from Khulna BNSB Eye Hospital, Badamtola (Shiromoni), Khulna, Bangladesh, from which 3,100 images were utilized for DR lesion detection and classification purposes and 461 images were used for AMD lesion detection and classification purposes. The dataset collection procedure was conducted from December 2022 to July 2024. The proposed dataset distribution is shown in Table 4.

Table 4. Distribution of images across datasets in the proposed multi-dataset approach for AMD and DR classification.
3.3.3 Annotation
Our study employed a thorough pixel-level annotation process for AMD drusen and DR lesions in retinal images, producing a high-quality ground truth dataset. Trained observers, guided by expert ophthalmologists, used LabelImg software to precisely mark drusen and DR features such as microaneurysms, hemorrhages, and exudates. Each annotated image was then reviewed by a panel of retinal specialists, who verified accuracy, identified missed features, refined ambiguous cases, and ensured consistency across the dataset. Expert discussions helped resolve discrepancies, resulting in reliable and comprehensive annotations. These ground truth images, as shown in Figure 8, form the foundation for developing and evaluating our detection and classification algorithms, improving the reliability of our diagnostic model.
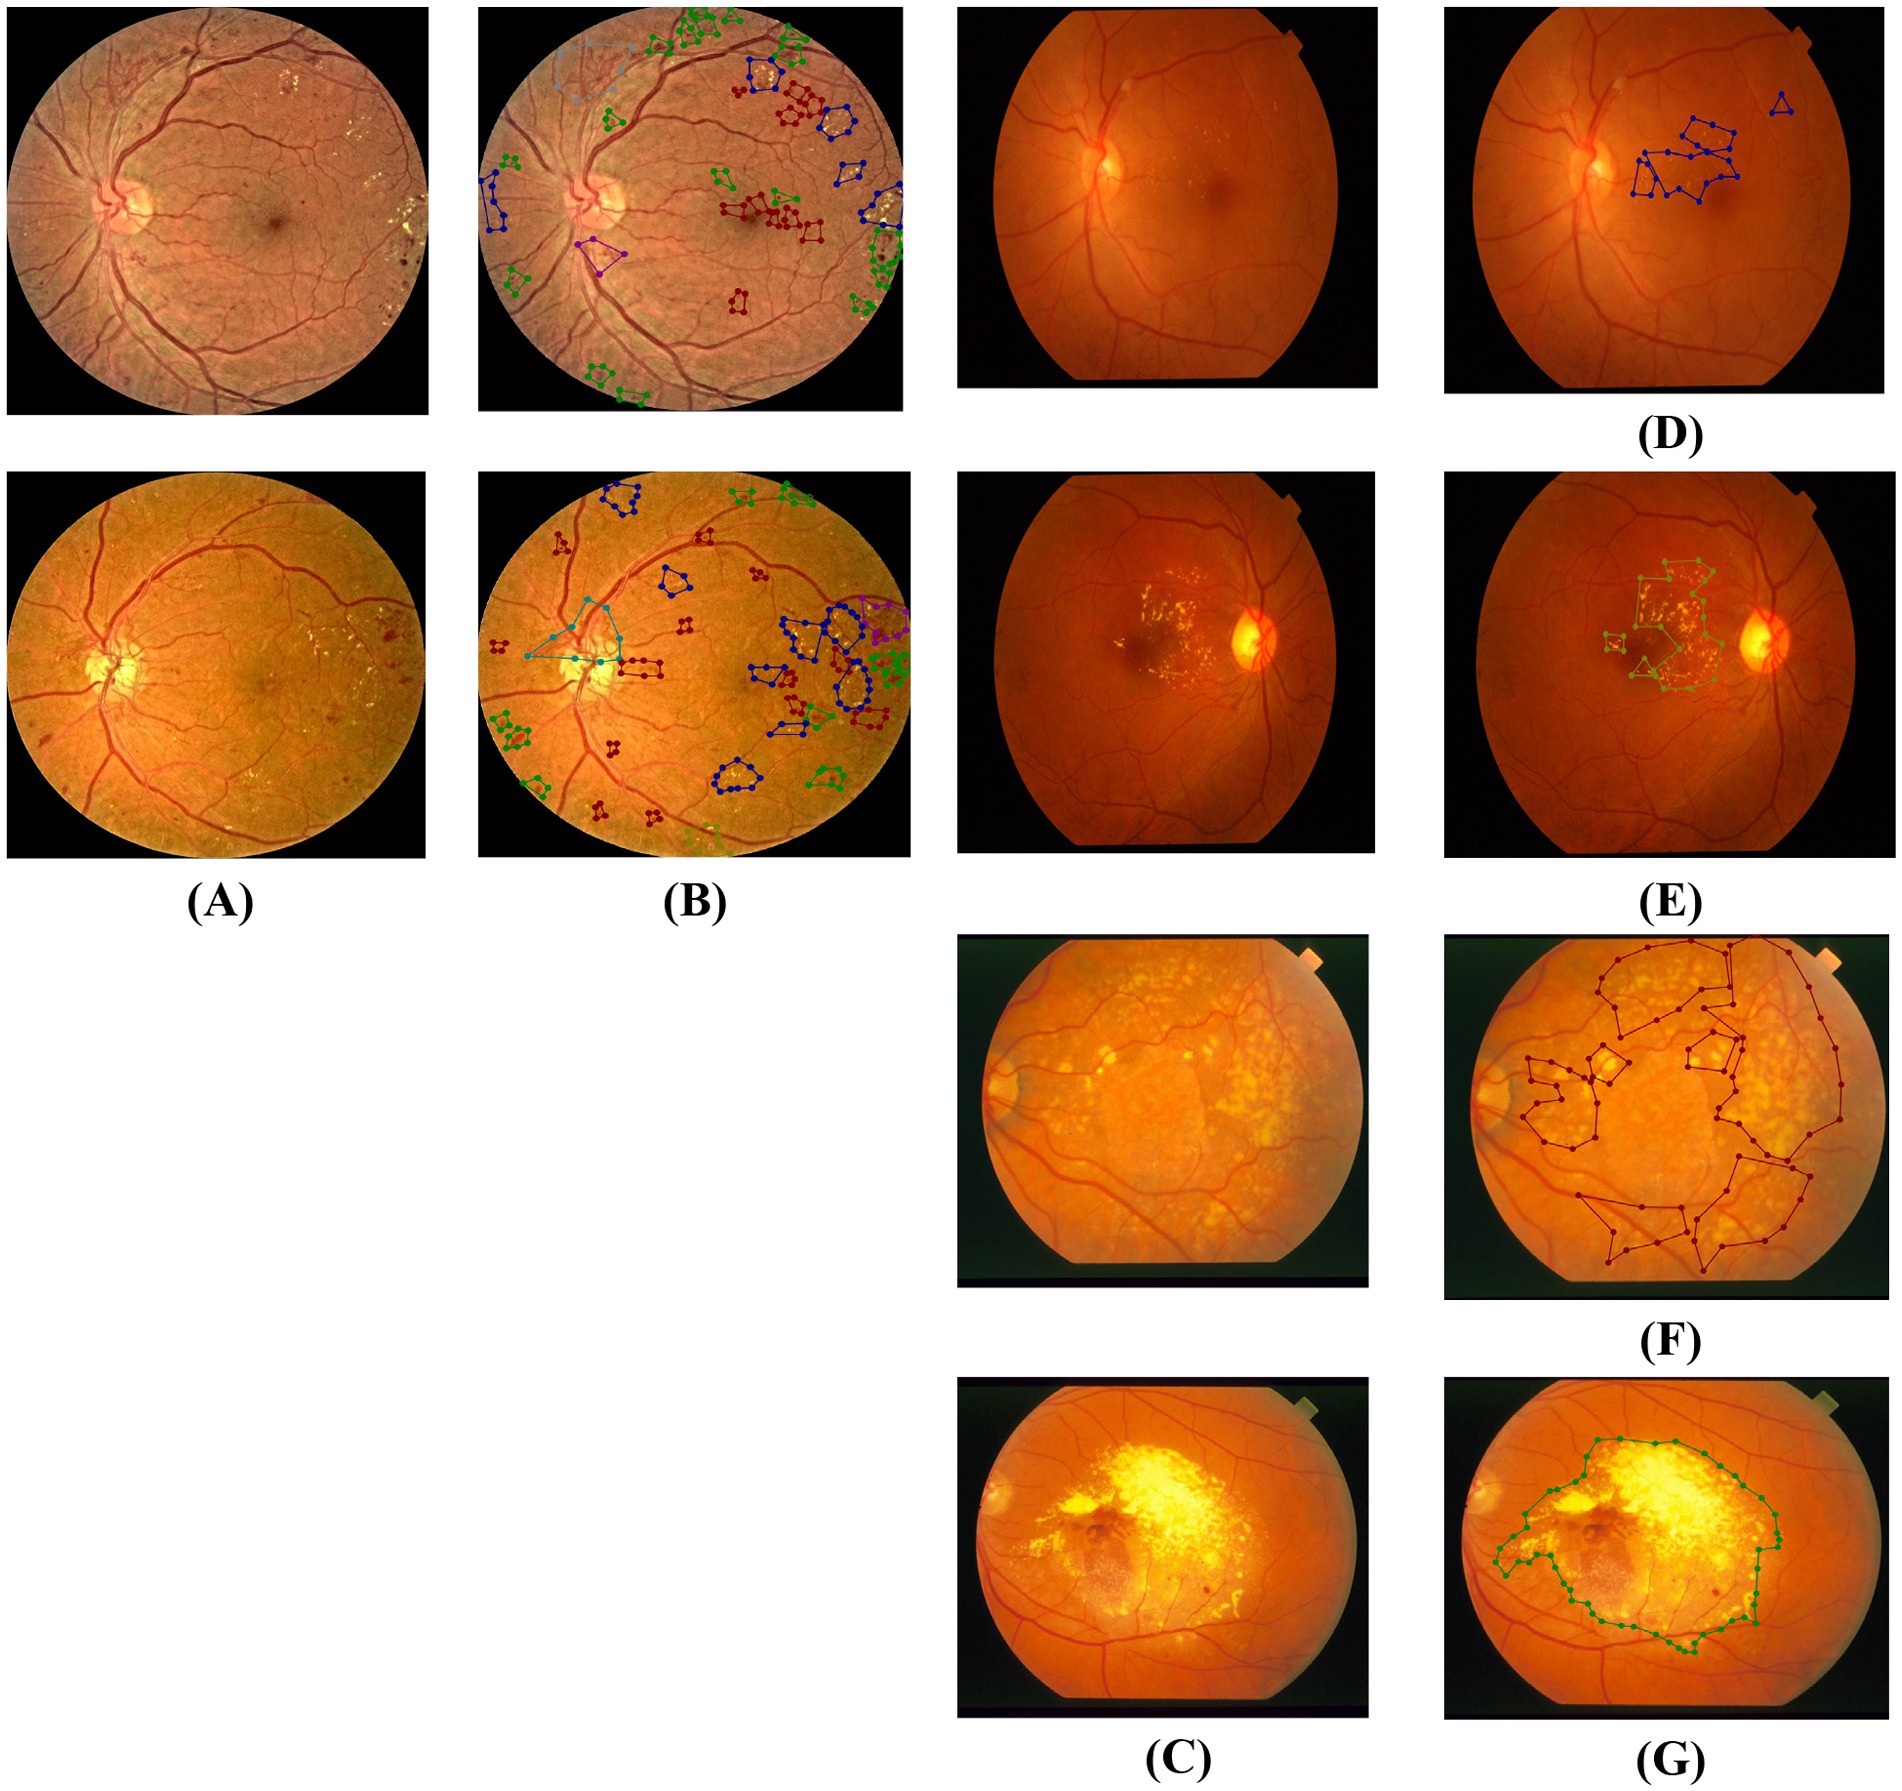
Figure 8. (A) Input images related to DR. (B) Localization results of DR regions: red color shows microaneurysms, deep green color shows hemorrhages, blue color shows hard exudates, sky color shows neovascularizations, purple color shows IRMA, and light green color shows soft exudates. (C) Input images related to AMD. (D) Localization results of AMD regions: blue color shows early AMD. (E) Light green color shows intermediate AMD. (F) Red color shows late AMD (Dry). (G) Deep green color shows late AMD (wet).
3.4 Performance analysis of modified CLAHE
Implementing bicubic interpolation in our modified CLAHE algorithm has yielded notable enhancements in image quality and information preservation, as evidenced by quantitative metrics and visual assessment. Table 5 showcases the performance improvements across multiple metrics: Mean Squared Error (MSE) decreased by 1% to 1.63%, indicating better preservation of image details; Peak Signal-to-Noise Ratio (PSNR) increased by 1.36% to 2.01%, signifying higher quality reconstruction; Structural Similarity Index (SSIM) improved by 0.0013% to 1.94%, suggesting enhanced structural integrity; and Entropy increased by 0.017% to 1.49%, pointing to better information content preservation.
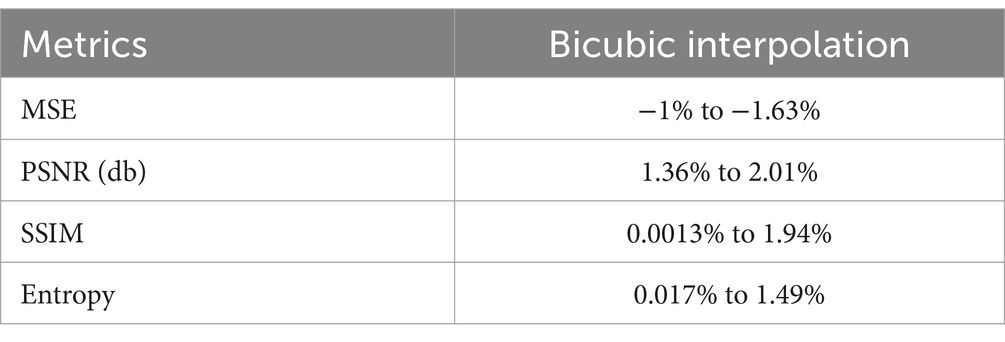
Table 5. Performance improvement ranges of modified CLAHE (bicubic interpolation) compared to original CLAHE (bilinear interpolation) across all datasets.
Visually, Figure 9 demonstrates the superior contrast enhancement achieved by bicubic interpolation compared to bilinear interpolation, with noticeably improved lesion visibility, better-preserved edge details, and reduced artifacts. These improvements have significant clinical implications, potentially leading to more accurate classification of disease severity stages, enhanced lesion localization, earlier detection of mild cases, and reduced false positives/negatives in diagnosis. The modified CLAHE algorithm thus provides a robust foundation for subsequent analysis steps in our diagnostic system, aligning well with our goal of enhancing the grading and lesion localization capabilities for diabetic retinopathy and age-related macular degeneration.

Figure 9. Visual comparison of original image, CLAHE with bilinear interpolation, and modified CLAHE with bicubic interpolation.
3.5 Analysis of AMD drusen and DR lesion localization using YOLO models
In this section, we comprehensively evaluate drusen and lesion localization results obtained from the YOLOv8, YOLOv7, and YOLOv5 models. Our analysis focuses on these models’ performance in detecting and segmenting pathological features associated with AMD and DR across multiple datasets, including our proposed Shiromoni_AMD, Shiromoni_DR and KLC_AMD, KLC_DR datasets.
3.5.1 YOLOv8 model performance for AMD drusen and DR lesion localization
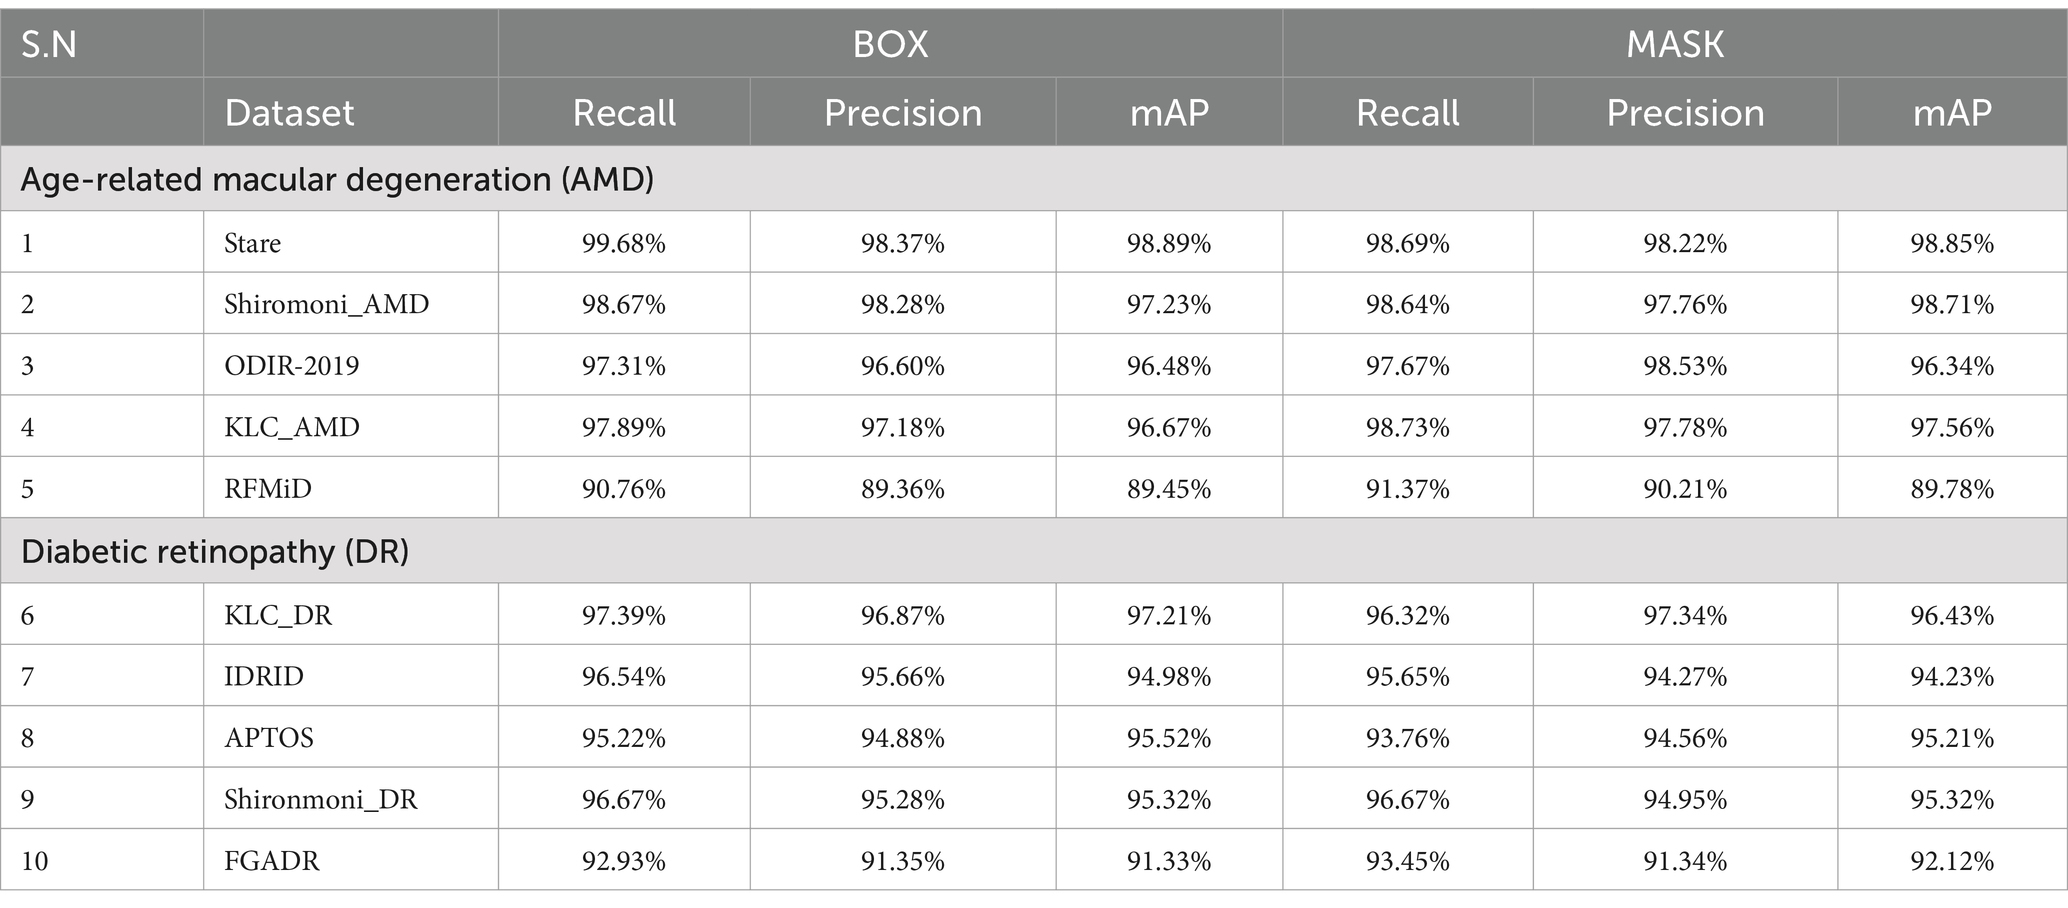
The YOLOv8 model demonstrates exceptional performance in localizing drusen and lesions for both AMD and DR, with particularly notable results on our proposed datasets, Shiromoni_AMD, Shiromoni_DR and KLC_AMD, KLC_DR. The Shiromoni_AMD dataset yields impressive results for AMD, with mAP scores of 97.23% for bounding box detection and 98.71% for mask segmentation. Similarly, for DR, the KLC_DR dataset shows strong performance with mAP scores of 97.21% for bounding boxes and 96.43% for masks. These high scores on our custom datasets highlight the model’s effectiveness on carefully curated and annotated images, likely due to the datasets’ high quality and representative sampling of pathological features. The model’s performance varies across other datasets, with the highest mAP for AMD observed in the Stare dataset (98.89% for BOX, 98.85% for MASK) and the lowest in the RFMiD dataset (89.45% for BOX, 89.78% for MASK). For DR, the highest performance outside our proposed dataset is seen in the APTOS dataset (95.52% for BOX, 95.21% for MASK), while the lowest is in the FGADR dataset (91.33% for BOX, 92.12% for MASK). This variation could be attributed to differences in image quality, annotation consistency, and the complexity of pathological features across datasets. The YOLOv8 model’s overall solid performance can be attributed to its advanced architecture, which includes improved feature extraction and efficient anchor-free detection. Its ability to process high-resolution images enables accurate detection of small lesions and drusen, reflected in high recall rates (up to 99.68% for AMD Stare dataset and 97.39% for DR KLC_DR dataset). The model’s consistent performance across bounding box and mask metrics demonstrates its capability to locate and accurately segment regions of interest, which is crucial for precise severity assessment in retinal pathologies. Despite some variability, the robustness of the YOLOv8 model is evident in its strong performance across diverse datasets, underscoring its potential for reliable application in medical imaging for AMD and DR diagnosis. The detailed results of the YOLOv8 model’s performance are presented in Table 6.
3.5.2 YOLOv7 model performance for AMD drusen and DR lesion localization
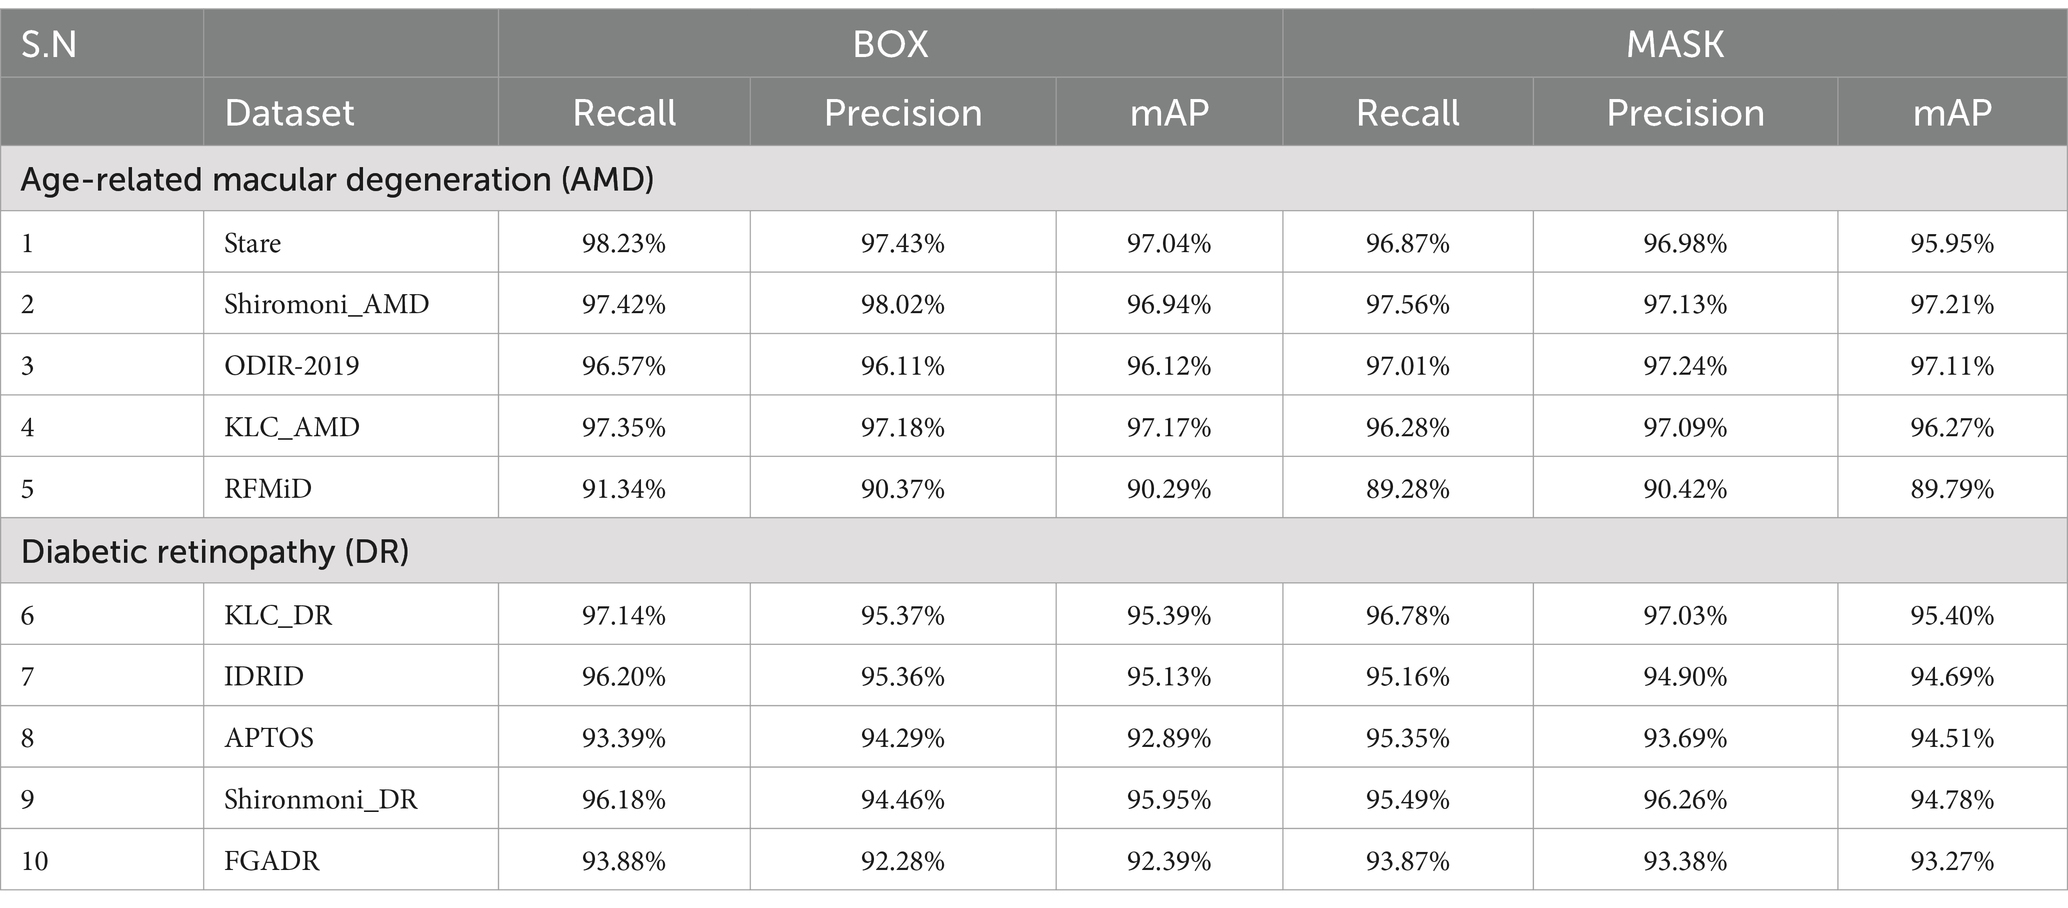
The YOLOv7 model demonstrates strong performance in localizing lesions and drusen for AMD and DR across various datasets, as shown in Table 7. The model achieves high accuracy for AMD, with mAP scores ranging from 90.29% to 97.04% for bounding box detection and 89.79% to 95.95% for mask segmentation. The DR results are similarly impressive, with mAP scores ranging from 92.39% to 95.39% for bounding boxes and 93.27% to 95.40% for masks. Notably, our proposed Shiromoni_AMD dataset yields excellent results for AMD, with mAP scores of 96.94% for bounding box detection and 97.21% for mask segmentation, showcasing the model’s effectiveness on this carefully curated dataset. For DR, our proposed KLC_DR dataset also shows strong performance with mAP scores of 95.39% for bounding boxes and 95.40% for masks. The YOLOv7 model’s robust performance can be attributed to its advanced architecture, which includes improvements in feature extraction and object detection mechanisms. The highest recall rates (up to 98.23% for AMD and 97.14% for DR) indicate the model’s ability to accurately detect a wide range of lesions and drusen, including smaller or less prominent ones. The model’s consistent performance across both bounding box (BOX) and mask (MASK) metrics demonstrates its capability to locate and accurately segment regions of interest. This is particularly evident in the high precision scores (MASK), reaching up to 97.24% for AMD and 97.03% for DR. While there is some variability across datasets, with slightly lower performance on the RFMID dataset for AMD (mAP of 90.29% for BOX and 89.79% for MASK) and the FGADR dataset for DR (mAP of 92.39% for BOX and 93.27% for MASK), the overall results remain robust. This variability may be due to specific challenges in these datasets, such as image quality or the subtlety of pathological features. The YOLOv7 model’s strong performance across both AMD and DR tasks underscores its versatility and potential for reliable application in medical imaging for retinal disease diagnosis. Its high accuracy across diverse datasets suggests good generalization capabilities, which are crucial for real-world clinical applications.
3.5.3 YOLOv5 model performance for AMD drusen and DR lesion localization
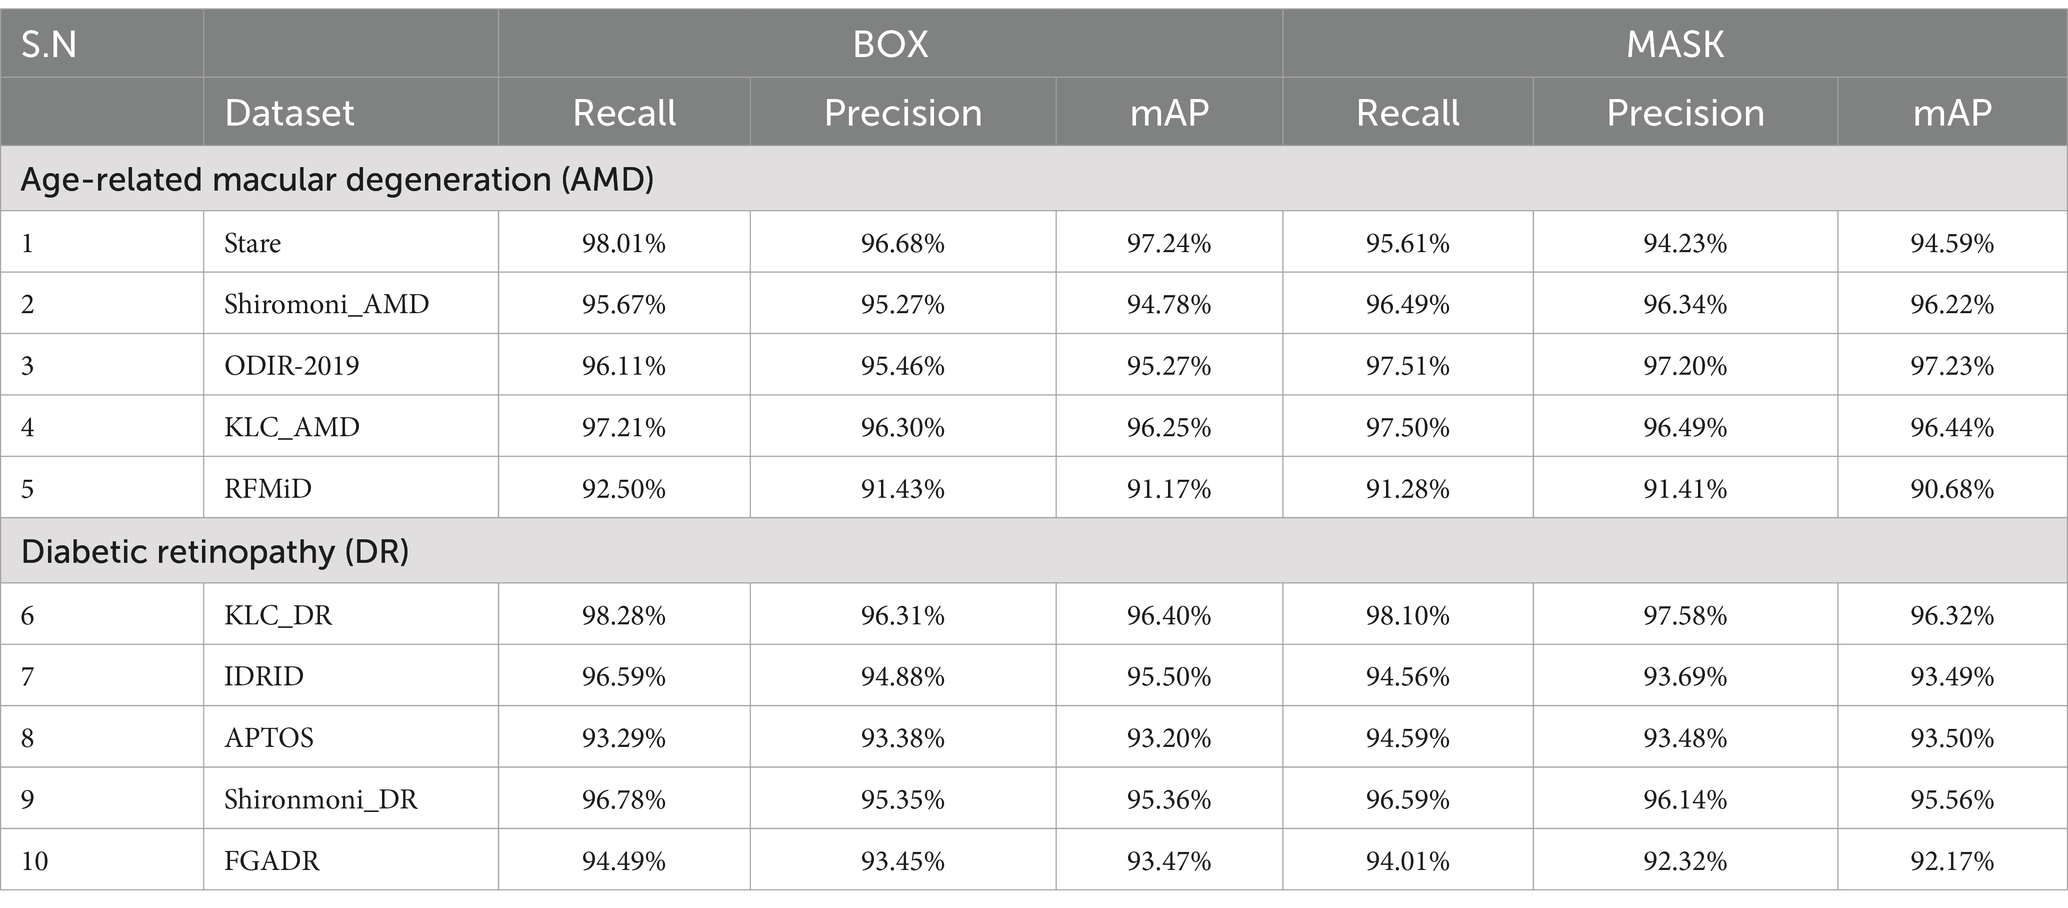
The YOLOv5 model demonstrates robust performance in localizing lesions and drusen for both AMD and DR across various datasets, as evidenced by Table 8. The model achieves high accuracy for AMD, with mAP scores ranging from 91.17% to 97.24% for bounding box detection and 90.68% to 97.23% for mask segmentation. The DR results are similarly strong, with mAP scores ranging from 93.20% to 96.40% for bounding boxes and 92.17% to 96.32% for masks. Our proposed datasets show auspicious results. The Shiromoni_AMD dataset for AMD yields excellent performance with mAP scores of 94.78% for bounding box detection and 96.22% for mask segmentation. Our KLC_DR dataset demonstrates outstanding results for DR with mAP scores of 96.40% for bounding boxes and 96.32% for masks, showcasing the highest performance among all DR datasets for this model. The YOLOv5 model’s strong performance can be attributed to its refined architecture and efficient object detection mechanisms. High recall rates, reaching up to 98.01% for AMD and 98.28% for DR, indicate the model’s proficiency in detecting a wide range of lesions and drusen, including those that may be less prominent. Precision scores are consistently high across datasets, with up to 96.68% for AMD and 96.31% for DR, demonstrating the model’s ability to accurately identify and segment regions of interest with minimal false positives. This is particularly crucial in medical imaging applications where precision is paramount. While there is some variability across datasets, with slightly lower performance on the RFMiD dataset for AMD (mAP of 91.17% for BOX and 90.68% for MASK), the overall results remain robust. This variability may be attributed to specific challenges in certain datasets, such as image quality variations or subtle pathological features. In comparison to YOLOv7 and YOLOv8, the YOLOv5 model shows competitive performance, particularly excelling in specific datasets like KLC for DR. This demonstrates that despite being an earlier version, YOLOv5 remains a viable and effective option for medical image analysis tasks, especially when computational resources may be a consideration.
YOLOv8, the most recent iteration, demonstrated superior overall performance across datasets, particularly in recall and precision for AMD and DR. Its advanced architecture allowed for highly accurate bounding box detection and mask segmentation, making it the top performer in most scenarios. YOLOv7 showed robust performance, closely trailing YOLOv8 in many metrics. It demonstrated strong generalization capabilities across diverse datasets and maintained high accuracy in localization and segmentation tasks. This model proved to be a reliable option, balancing cutting-edge performance with computational efficiency. Despite being an earlier iteration, YOLOv5 demonstrated impressive performance, particularly excelling on our custom datasets, such as KLC_DR for diabetic retinopathy analysis. Its strong performance, especially in precision and recall for specific datasets, underscores its continued relevance in medical image analysis tasks. This model offers a good balance of accuracy and computational efficiency, making it a viable choice for resource-constrained environments. Across all three models, we observed consistently high performance on our proposed four datasets, validating the quality and representativeness of these custom datasets for AMD and DR analysis. The slight variations in performance across different datasets highlight the importance of diverse training data in developing robust models for clinical applications.
3.6 Proposed 6L-ConvSVM-RF model performance analysis
3.6.1 Random forest model performance analysis
The Random Forest (RF) model demonstrates robust performance in classifying both AMD and DR across various datasets, as evidenced by Table 9. For AMD, the model achieves high accuracy, ranging from 92.37% to 99.42%, with exceptional performance on the Stare dataset (99.42% accuracy). Our proposed Shiromoni_AMD dataset shows strong results with 98.90% accuracy, validating its quality for AMD classification. In DR classification, accuracies range from 92.11% to 98.81%. Notably, our proposed KLC_DR dataset demonstrates excellent performance for DR with 98.81% accuracy. The model’s consistently high performance across both diseases indicates its robustness and generalizability. High specificity scores (97.70% to 99.80%) across all datasets suggest the model’s strong ability to correctly identify negative cases, which is crucial for minimizing false positives in medical diagnostics. The balanced precision and recall, resulting in high F1 scores, further underscore the model’s reliability for clinical applications. The success of our proposed datasets, Shiromoni_AMD for AMD and KLC_DR for DR, can be attributed to several factors. First, these datasets were carefully curated to include a diverse range of disease presentations, ensuring a comprehensive representation of various stages and manifestations. Second, the high-quality annotations and standardized imaging protocols used in creating these datasets likely contributed to the model’s strong performance. Additionally, the datasets may capture unique characteristics of AMD and DR that are particularly well-suited to Random Forest classification, such as distinct texture patterns or spatial arrangements of lesions.
The bar chart (Figure 10) compares accuracy rates across various datasets for age-related macular degeneration (AMD) and diabetic retinopathy (DR) classification. The visualization consists of two side-by-side graphs, each depicting the performance for one of the eye conditions. For AMD, the chart shows consistently high accuracy across all datasets, with the Stare dataset achieving the highest rate at 99.42%, closely followed by the proposed Shiromoni_AMD dataset at 98.90%. The RFMiD dataset, while still performing well, shows the lowest accuracy for AMD at 92.37%. In the DR classification chart, the proposed KLC_DR dataset leads with an impressive 98.81% accuracy, with the IDRID dataset following closely at 98.25%. Interestingly, the Shiromoni_DR dataset, which excelled in AMD classification, shows the lowest accuracy for DR at 92.11%, though this is still a respectable performance. Overall, the chart illustrates the model’s robust performance across diverse datasets, with accuracy consistently above 92% for both conditions. It also highlights the strong performance of the newly proposed datasets (Shiromoni for AMD and KLC for DR), underscoring their valuable contribution to automated eye disease diagnosis.
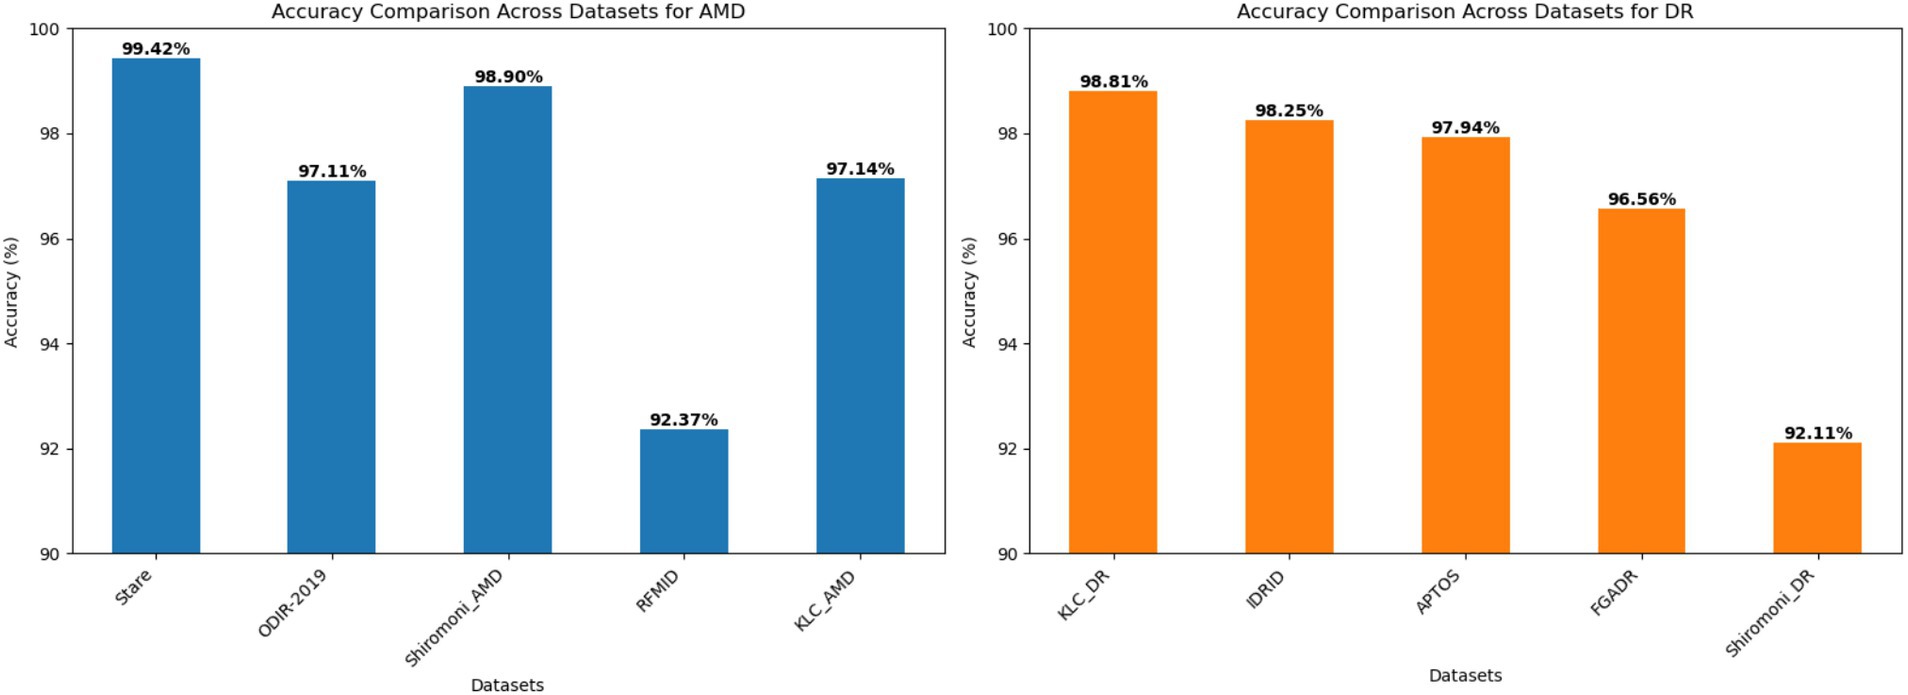
Figure 10. Accuracy comparison of 6L-CNN-RF model for AMD and DR classification across multiple datasets.
3.6.2 Support vector machine model performance analysis
The Support Vector Machine (SVM) model demonstrates excellent performance across both AMD and DR datasets, as shown in Table 10. Our proposed Shiromoni_AMD dataset achieves the highest scores across all metrics for AMD, with an impressive 97.50% accuracy, 97.39% F1-Score and 99.40% Specificity. The dataset, KLC_AMD which we also proposed, shows strong performance for AMD, with the second-highest scores in most metrics. Among benchmark datasets for AMD, Stare exhibits the highest F1-Score (95.05%), while RFMD shows the lowest (91.95%). In the case of DR, our KLC_DR dataset performs well with a 94.05% F1-Score and 98.50% Specificity. The IDRID benchmark dataset shows the highest performance for DR with a 96.99% F1-Score and 99.30% Specificity. Interestingly, our Shiromoni_DR dataset, while excelling in AMD, shows the lowest performance among DR datasets with a 91.05% F1-Score and 97.50% Specificity. The strong performance of our proposed datasets, particularly Shiromoni_AMD and KLC_AMD for AMD, can be attributed to several factors. First, we ensured high-quality image acquisition and preprocessing techniques, which likely enhanced the model’s ability to extract relevant features. Second, we carefully curated diverse and representative cases, allowing the model to learn from various pathological presentations. Third, we implemented accurate and consistent labeling practices, providing the model with reliable ground truth data. Lastly, we may have included challenging cases that improved the model’s generalization capabilities. The SVM model’s ability to achieve high specificity (97.50%–99.40% across all datasets) is particularly noteworthy, as it indicates a low false positive rate. This is crucial in medical diagnostics to avoid unnecessary treatments or patient anxiety. The variation in performance across different datasets highlights the importance of using diverse data sources for robust evaluation. The SVM’s inherent strengths in handling high-dimensional data and finding optimal decision boundaries can explain our proposed method’s success. Combining this with our carefully prepared datasets creates a synergy that results in highly accurate classifications. The model’s ability to perform well across multiple datasets suggests good generalization, essential for real-world application in diverse clinical settings.
The bar chart (Figure 11) illustrates the performance of the 6L-CNN-SVM model in classifying AMD and DR across various datasets. For AMD, the model demonstrates consistently high accuracy, with the Shiromoni_AMD dataset achieving the best result at 97.50%, closely followed by the KLC_AMD dataset at 96.29%. While not leading, the Stare dataset still shows a 95.23% accuracy. Even the lowest-performing RFMiD dataset maintains a respectable 92.21% accuracy for AMD. The model exhibits similarly robust performance in DR classification, with the IDRiD dataset leading at 97.19% accuracy, followed closely by APTOS at 96.26%. Interestingly, the KLC_DR dataset demonstrates a substantial 94.25% accuracy for DR classification, while the Shiromoni_DR dataset records the lowest DR accuracy at 91.24% despite its exceptional performance in AMD detection. Overall, the visualization underscores the 6L-CNN-SVM model’s consistently high performance across diverse datasets, with accuracy above 91% for both eye conditions. This chart effectively demonstrates the model’s robustness and generalizability in automated eye disease diagnosis while highlighting the varying challenges presented by different datasets.
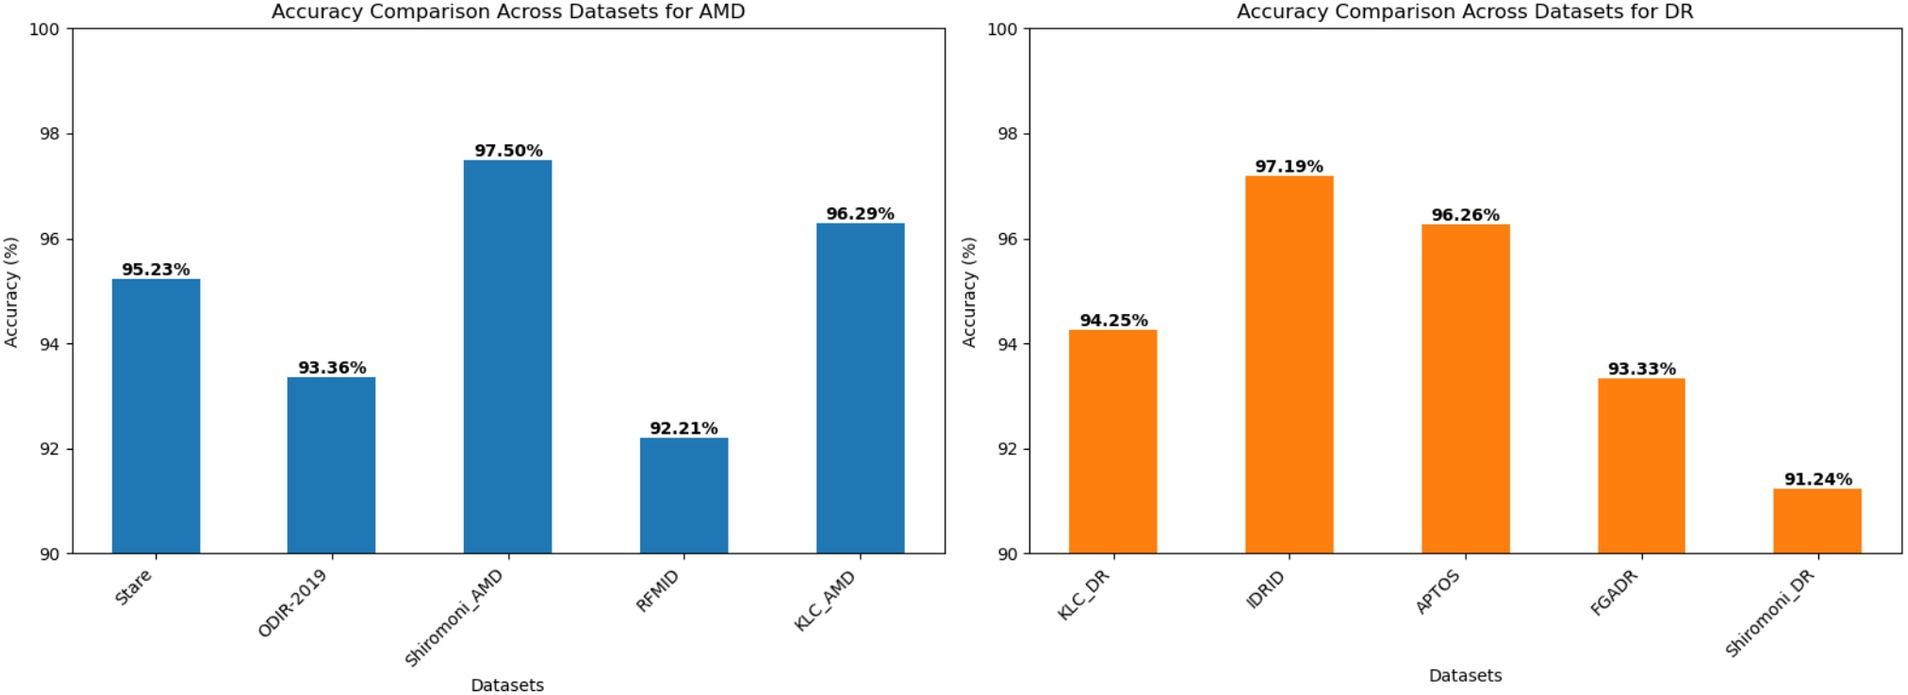
Figure 11. Accuracy comparison of 6L-CNN-SVM model for AMD and DR classification across multiple datasets.
3.7 Performance discussion across the all model
This study on enhancing grading and lesion localization for DR and AMD demonstrates key advancements across image enhancement, lesion detection, and disease classification models. The modified CLAHE algorithm, incorporating bicubic interpolation, improved image quality and information preservation. Key metrics showed improvement: MSE decreased by 1%–1.63%, PSNR increased by 1.36%–2.01%, SSIM improved by 0.0013%–1.94%, and entropy increased by 0.017%–1.49%. These enhancements set a strong foundation for diagnostic analysis. Among the YOLO models, YOLOv8 consistently outperformed others, achieving 98.89% mAP for AMD on the Stare dataset and 97.21% mAP for DR on the KLC_DR dataset. Its lowest performance was 89.45% mAP for AMD on the RFMiD dataset and 91.33% mAP for DR on the FGADR dataset. YOLOv7 and YOLOv5 followed similar patterns, with their best performance on the Stare and KLC datasets, and the lowest on RFMiD and FGADR, possibly due to more challenging cases in these datasets. The classification models, 6L-Conv-SVM and 6L-Conv-RF, also performed well, with 6L-Conv-RF showing superior results. It achieved 99.42% accuracy and 99.35% F1-score for AMD on the Stare dataset and 98.81% accuracy and 98.99% F1-score for DR on the KLC_DR dataset. The 6L-Conv-SVM model’s best performance was 97.50% accuracy for AMD on the Shiromoni_AMD dataset and 97.19% for DR on the IDRID dataset. Lower performances on RFMiD for AMD and Shiromoni _DR for DR indicate these datasets might contain more challenging cases. Overall, the study highlights the strong performance of the proposed models, especially the modified CLAHE for image enhancement, YOLOv8 for lesion detection, and 6L-Conv-RF for classification. These techniques hold potential for improving the accuracy and efficiency of eye disease diagnosis in clinical settings.
3.8 Potential limitation and theoretical, technical bias consideration
Acknowledging the potential limitations in dataset representation, we have undertaken deliberate strategies to enhance our model’s generalizability across diverse populations. Our research strategy incorporated multiple datasets from different geographical regions to minimize potential demographic biases. Specifically, we curated datasets (Shiromoni_DR, KLC_DR, Shiromoni_AMD, KLC_AMD) that include samples from varied ethnic backgrounds, ensuring a more comprehensive representation. However, we recognize that further improvements are necessary. To address potential generalizability challenges, we propose a multi-pronged approach for future research: (1) continuously expand our datasets to include more diverse demographic representations, (2) conduct external validation studies across different healthcare settings and geographic regions, and (3) implement rigorous cross-validation techniques that systematically assess performance variations across different population subgroups. Additionally, we recommend collaborative efforts with international healthcare institutions to collect more representative datasets that capture the nuanced variations in retinal imaging across different populations. While our current results are promising, demonstrating high performance across multiple datasets, we are committed to an ongoing process of model refinement and validation to ensure its clinical reliability and applicability across diverse patient populations.
4 Comparative analysis of the proposed study performance against existing research
The proposed study demonstrates robust performance in drusen and lesion localization and severity stage classification for AMD and DR, as shown in Table 11. Comparing these results to existing research, our proposed models show competitive or superior performance. Nazir et al. (2021) achieved 97.93% and 98.10% accuracy for DR and DME detection, comparable to our YOLOv8 model’s performance, particularly for AMD on the Shiromoni_AMD dataset. The 6L-CN-RF (6-layer Convolutional Network with Random Forest) model excels in severity stage classification, achieving high accuracy, F1 scores, and recall rates. AMD on the KLC_AMD dataset attains 97.14% accuracy, 96.99% F1-score, and 97.10% recall. The performance is even better for DR on the KLC_DR dataset, with 98.81% accuracy, 98.99% F1-score, and 98.68% recall. These results outperform several existing studies, such as Govindaiah et al. (2018), which achieved 92.5% accuracy for AMD classification, and Mohanty et al. (2023), which reported 79.50% and 97.30% accuracy for DR classification. Alyoubi et al. (2021) reported an mAP of 0.216 for DR lesion detection using a YOLOv3 model, which is significantly lower than our YOLO models’ performance. It’s worth noting that some existing studies reported higher accuracies in specific scenarios. For example, Pham et al. (2020) achieved 99.5% accuracy for AMD drusen segmentation, and Motozawa et al. (2019) reported 99.0% accuracy for their first model in AMD classification. However, our proposed methods demonstrate more consistent high performance across different eye conditions and datasets. The proposed study’s models show particular strength in maintaining high performance across various metrics and datasets, suggesting robust and reliable performance in diverse clinical scenarios. This comprehensive approach to both localization and classification tasks positions the proposed methods as potentially valuable tools for improving the accuracy and efficiency of eye disease diagnosis in clinical settings.

Table 11. Quantitative evaluation of proposed and existing research for drusen/lesion localization and severity stage classification in AMD and DR.
5 Conclusion
This study presents significant advancements in the automated diagnosis and grading of diabetic retinopathy (DR) and age-related macular degeneration (AMD), two leading causes of vision loss globally. By integrating state-of-the-art deep learning techniques with novel approaches in image enhancement and classification, we have developed a robust and accurate system for lesion localization and severity grading. Our modified CLAHE algorithm demonstrated improved image enhancement, with increases in PSNR (up to 2.01%), SSIM (up to 1.94%), and entropy (up to 1.49%). The YOLOv8 model achieved exceptional performance for lesion and drusen localization, with mAP scores of up to 98.71% for AMD on the Shiromoni_AMD dataset and 97.21% for DR on the KLC_DR dataset. Our novel 6L-ConvSVM-RF model excelled in severity classification, achieving up to 99.42% accuracy for AMD on the Stare dataset and 98.81% for DR on our proposed KLC_DR dataset. These results often surpass existing state-of-the-art approaches, demonstrating more consistent high performance across different eye conditions and datasets. Introducing our custom Shiromoni_AMD, Shiromoni_DR, and KLC_AMD, KLC_DR datasets proved valuable, consistently yielding high performance across various models and tasks. Our comprehensive evaluation, employing various performance metrics across multiple datasets, provides a thorough understanding of model capabilities and allows reliable comparisons with existing methods. These advancements have significant implications for clinical practice, potentially aiding early diagnosis and streamlining the screening process. However, our study has some limitations. The models’ performance on extremely rare or atypical cases of DR and AMD may need further investigation. Additionally, while our datasets are diverse, expanding them to include a broader range of ethnic and demographic representations could further improve generalizability. Future work should focus on addressing these limitations, as well as exploring the integration of clinical metadata to enhance diagnostic accuracy. Furthermore, extensive clinical validation studies in real-world settings are necessary to assess the system’s practical efficacy fully. Despite these challenges, this research represents a significant step forward in the automated diagnosis and grading of DR and AMD, moving us closer to improving eye care accessibility and patient outcomes worldwide.
Data availability statement
The datasets presented in this study can be found in online repositories. The names of the repository/repositories and accession number(s) can be found at: https://drive.google.com/drive/folders/1zqfnHXztIvDNp8EuIRVSWHEBt9TEHe9f.
Ethics statement
Written informed consent was obtained from the individual(s) for the publication of any potentially identifiable images or data included in this article.
Author contributions
RR: Conceptualization, Investigation, Methodology, Resources, Software, Visualization, Writing – original draft. PC: Data curation, Formal analysis, Investigation, Project administration, Supervision, Validation, Writing – review & editing.
Funding
The author(s) declare that financial support was received for the research and/or publication of this article. This research was funded by the Information and Communication Technology Division (ICTD), Government of Bangladesh (GO: 1280101-120008431-3821117).
Acknowledgments
The author thanks to Dr. Md. Salauddin Rahmatullah [MBBS, DCO, FICS (USA), Fellow (Pediatric Eye Diseases & Cross Eye, India)] Consultant Khulna Eye Hospital and Laser Center, Khulna, Bangladesh; Md. Dr. Abul Kalam Azad [MBBS, DCO, Fellow Medical Retina (IIEI&H)] Consultant Vitrio-Retina Department, Khulna BNSB Eye Hospital, Badamtola, Shiromoni, Khulna, Bangladesh; Dr. Md. Asif Hasan (Assistant Surgeon) Khulna BNSB Eye Hospital, Badamtola, Shiromoni Khulna, Bangladesh who helped in collecting the dataset, severity classification, suggestive lesion and drusen localization process and annotation.
Conflict of interest
The authors declare that the research was conducted in the absence of any commercial or financial relationships that could be construed as a potential conflict of interest.
Publisher’s note
All claims expressed in this article are solely those of the authors and do not necessarily represent those of their affiliated organizations, or those of the publisher, the editors and the reviewers. Any product that may be evaluated in this article, or claim that may be made by its manufacturer, is not guaranteed or endorsed by the publisher.
References
Aamir, M., Rahman, Z., Abro, W. A., Bhatti, U. A., Dayo, Z. A., and Ishfaq, M. (2023). Brain tumor classification utilizing deep features derived from high-quality regions in MRI images. Biomed Signal Process Control. 85:104988. doi: 10.1016/j.bspc.2023.104988
Aamir, M., Rahman, Z., Dayo, Z. A., Abro, W. A., Uddin, M. I., Khan, I., et al. (2022). A deep learning approach for brain tumor classification using MRI images. Comput. Electr. Eng. 101:108105. doi: 10.1016/j.compeleceng.2022.108105
Abushawish, I. Y., Modak, S., Abdel-Raheem, E., Mahmoud, S. A., and Hussain, A. J. (2024). Deep learning in automatic diabetic retinopathy detection and grading systems: a comprehensive survey and comparison of methods. IEEE Access. 12, 84785–802.
Alyoubi, W. L., Abulkhair, M. F., and Shalash, W. M. (2021). Diabetic retinopathy fundus image classification and lesions localization system using deep learning. Sensors 21:3704. doi: 10.3390/s21113704
APTOS. (2019). APTOS-2019 dataset. Available online at: https://www.kaggle.com/datasets/mariaherrerot/aptos2019 (Accessed February, 2024).
Ashraf, S., Rasheed, Z., and Arbaz, M. (2022). Adopting proactive results by developing the shrewd model of pandemic COVID-19. Arch Commun Med Public Health. 8, 062–067. doi: 10.17352/2455-5479.000175
Ayala, A., Ortiz Figueroa, T., Fernandes, B., and Cruz, F. (2021). Diabetic retinopathy improved detection using deep learning. Appl. Sci. 11:11970. doi: 10.3390/app112411970
Bird, A., Bressler, N., Bressler, S., Chisholm, I., Coscas, G., Davis, M., et al. (1995). An international classification and grading system for age-related maculopathy and age-related macular degeneration. Surv. Ophthalmol. 39, 367–374. doi: 10.1016/S0039-6257(05)80092-X
Bressler, N. (2004). Age-related macular degeneration is the leading cause of blindness. JAMA 291, 1900–1901. doi: 10.1001/jama.291.15.1900
Cho, N. H., Shaw, S. E., Karuranga, Y., Huang, J. D., da Rocha Fernandes, J. D., Ohlrogge, A. W., et al. (2018). IDF diabetes atlas: global estimates of diabetes prevalence for 2017 and projections for 2045. Diabetes Res Clin Pract 138, 271–281. doi: 10.1016/j.diabres.2018.02.023
Diaz-Pinto, A., Morales, S., Naranjo, V., Köhler, T., Mossi, J. M., and Navea, A. (2019). CNNs for automatic glaucoma assessment using fundus images: an extensive validation. Biomed. Eng. Online 18, 1–19. doi: 10.1186/s12938-019-0649-y
Ferris, F. L., Wilkinson, C. P., Bird, A., Chakravarthy, U., Chew, E., Csaky, K., et al. (2013). Beckman Initiative for Macular Research classification committee. Clinical classification of age-related macular degeneration. Ophthalmology 120, 844–851. doi: 10.1016/j.ophtha.2012.10.036
Girard, F., Kavalec, C., and Cheriet, F. (2019). Joint segmentation and classification of retinal arteries/veins from fundus images. Artif Intell Med. 94, 96–109.
Govindaiah, A., Hussain, M. A., Smith, R. T., and Bhuiyan, A. (2018). Deep convolutional neural network based screening and assessment of age-related macular degeneration from fundus images. In: 2018 IEEE 15th international symposium on biomedical imaging (ISBI 2018); (pp. 1525–1528). IEEE.
Gulshan, V., Peng, L., Coram, M., Stumpe, M. C., Wu, D., Narayanaswamy, A., et al. (2016). Development and validation of a deep learning algorithm for detection of diabetic retinopathy in retinal fundus photographs. JAMA 316, 2402–2410. doi: 10.1001/jama.2016.17216
He, K., Gkioxari, G., Dollár, P., and Girshick, R. (2017). Mask R-CNN. In: Proceedings of the IEEE International Conference on Computer Vision, 2961–2969.
Huang, Y., Lin, L., Li, M., Wu, J., Cheng, P., Wang, K., et al., (2020) Automated hemorrhage detection from coarsely annotated fundus images in diabetic retinopathy. In: 2020 IEEE 17th international symposium on biomedical imaging (ISBI) (pp. 1369–1372). IEEE.
Kaushik, H, Singh, D, Kaur, M, Alshazly, H, Zaguia, A, and Hamam, H. (2021). Diabetic retinopathy diagnosis from fundus images using stacked generalization of deep models. IEEE Access. 9, 108276–92.
Kaymak, S., and Serener, A., (2018). Automated age-related macular degeneration and diabetic macular edema detection on oct images using deep learning. In: 2018 IEEE 14th international conference on intelligent computer communication and processing (ICCP) (pp. 265–269). IEEE.
Mohanty, C., Mahapatra, S., Acharya, B., Kokkoras, F., Gerogiannis, V. C., Karamitsos, I., et al. (2023). Using deep learning architectures for detection and classification of diabetic retinopathy. Sensors 23:5726. doi: 10.3390/s23125726
Motozawa, N., An, G., Takagi, S., Kitahata, S., Mandai, M., Hirami, Y., et al. (2019). Optical coherence tomography-based deep-learning models for classifying normal and age-related macular degeneration and exudative and non-exudative age-related macular degeneration changes. Ophthalmol Therapy 8, 527–539. doi: 10.1007/s40123-019-00207-y
Nazir, T., Irtaza, A., Javed, A., Malik, H., Hussain, D., and Naqvi, R. A. (2020). Retinal image analysis for diabetes-based eye disease detection using deep learning. Appl. Sci. 10:6185. doi: 10.3390/app10186185
Nazir, T., Nawaz, M., Rashid, J., Mahum, R., Masood, M., Mehmood, A., et al. (2021). Detection of diabetic eye disease from retinal images using a deep learning based CenterNet model. Sensors 21:5283. doi: 10.3390/s21165283
Ning, C., Paul, M., and Tien, Y. W. (2010). Diabetic retinopathy. Lancet 376, 124–136. doi: 10.1016/S0140-6736(09)62124-3
ODIR. (2019). Ocular disease recognition. Available online at: https://www.kaggle.com/datasets/andrewmvd/ocular-disease-recognition-odir5k (Accessed February, 2024).
Pachade, S., Porwal, P., Thulkar, D., Kokare, M., Deshmukh, G., Sahasrabuddhe, V., et al. (2021). Retinal fundus multi-disease image dataset (RFMiD): a dataset for multi-disease detection research. Data. 6:14. doi: 10.3390/data6020014
Peng, Y., Dharssi, S., Chen, Q., Keenan, T. D., Agrón, E., Wong, W. T., et al. (2019). DeepSeeNet: a deep learning model for automated classification of patient-based age-related macular degeneration severity from color fundus photographs. Ophthalmology 126, 565–575. doi: 10.1016/j.ophtha.2018.11.015
Pham, Q. T., Ahn, S., Song, S. J., and Shin, J. (2020). Automatic drusen segmentation for age-related macular degeneration in fundus images using deep learning. Electronics 9:1617. doi: 10.3390/electronics9101617
Porwal, P., Pachade, S., Kamble, R., Kokare, M., Deshmukh, G., Sahasrabuddhe, V., et al. (2018). Indian diabetic retinopathy image dataset (IDRiD): a database for diabetic retinopathy screening research. Data. 3:25. doi: 10.3390/data3030025
Qummar, S., Khan, F. G., Shah, S., Khan, A., Shamshirband, S., Rehman, Z. U., et al. (2019). A deep learning ensemble approach for diabetic retinopathy detection. IEEE Access. 7, 150530–151609.
Redmon, J., Divvala, S., Girshick, R., and Farhadi, A. (2016). You only look once: unified, real-time object detection. In: Proceedings of the IEEE Conference on Computer Vision Pattern Recognition, 779–788.
Ren, S., He, K., Girshick, R., and Sun, J. (2015). Faster R-CNN: towards real-time object detection with region proposal networks. In: Advances in Neural Information Processing Systems, 91–99.
Samek, W., Wiegand, T., and Müller, K. R. (2017). Explainable artificial intelligence: understanding, visualizing and interpreting deep learning models. arXiv [Preprint]. arXiv:1708.08296.
STARE. (2000). STructured Analysis of the Retina. Available online at: https://cecas.clemson.edu/~ahoover/stare/ (Accessed February, 2024).
Tan, J. H., Acharya, U. R., Bhandary, S. V., Chua, K. C., and Sivaprasad, S. (2017). Segmentation of optic disc, fovea and retinal vasculature using a single convolutional neural network. J Comput Sci 20, 70–79. doi: 10.1016/j.jocs.2017.02.006
Zago, G., Andreão, R. V., Dorizzi, B., and Salles, E. O. T. (2020). Diabetic retinopathy detection using red lesion localization and convolutional neural networks. Comput. Biol. Med. 116:103537. doi: 10.1016/j.compbiomed.2019.103537
Keywords: diabetic retinopathy, age-related macular degeneration, lesion localization, Contrast-Limited Adaptive Histogram Equalization, bicubic interpolation, instance segmentation, severity grading
Citation: Rahman Ema R and Chandra Shill P (2025) Multi-model approach for precise lesion localization and severity grading for diabetic retinopathy and age-related macular degeneration. Front. Comput. Sci. 7:1497929. doi: 10.3389/fcomp.2025.1497929
Edited by:
Ismail Ben Ayed, École de technologie supérieure (ÉTS), CanadaReviewed by:
Muhammad Aamir, Huanggang Normal University, ChinaShahzad Ashraf, DHA Suffa University, Pakistan
Copyright © 2025 Rahman Ema and Chandra Shill. This is an open-access article distributed under the terms of the Creative Commons Attribution License (CC BY). The use, distribution or reproduction in other forums is permitted, provided the original author(s) and the copyright owner(s) are credited and that the original publication in this journal is cited, in accordance with accepted academic practice. No use, distribution or reproduction is permitted which does not comply with these terms.
*Correspondence: Romana Rahman Ema, ZW1hMTkwNzc1MkBzdHVkLmt1ZXQuYWMuYmQ=
 Romana Rahman Ema
 Pintu Chandra Shill
