 Nilesh P. Sable
 Vinod Kumar Shukla
 Parikshit N. Mahalle
 Vijayshri Khedkar4
- 1Department of Computer Science and Engineering (Artificial Intelligence), Vishwakarma Institute of Technology, Bansilal Ramnath Agarwal Charitable Trust's, Savitribai Phule Pune University (SPPU), Pune, India
- 2School of Engineering Architecture and Interior Design, Amity University Dubai, Dubai, United Arab Emirates
- 3Department of Artificial Intelligence and Data Science, Vishwakarma Institute of Technology, Bansilal Ramnath Agarwal Charitable Trust's, SPPU, Pune, India
- 4Department of Computer Science and Engineering, Symbiosis Institute of Technology, Symbiosis International (Deemed University), Pune, India
In agriculture, optimizing harvesting schedules is crucial for maximizing profits while minimizing resource waste. This research introduces a novel forecasting model that forecasts the most profitable months to harvest different crops, to optimize agricultural productivity. Using Machine Learning (ML) techniques, our program takes historical price data, seasonal trends, and market dynamics into account to determine the best harvesting dates. To be more specific, we train and evaluate predictive models using 3 years' worth of agricultural data from Krushi Utpanna Bazar Samiti in Haveli Pune using several machine learning techniques, such as Random Forest (RF), Decision Trees (DT), Linear Regression (LR), and others. After a thorough study using the Mean Squared Error (MSE) and R2 score, it was determined that the DT model performed the best, with an outstanding R2 score of 99%. Furthermore, we use Streamlit to create an easy-to-use web application that lets farmers input crop types, years, and desired price estimates to determine the best months to harvest. Our approach gives farmers a data-driven means to make informed decisions that increase revenue and improve the sustainability of agriculture. By developing precision agriculture and decision support systems, we want to enhance agricultural productivity and enable more efficient crop management techniques.
1 Introduction
The foundation of the world's food security is the agriculture sector. More than 70% of rural households are reliant on agriculture. With over 60% of the workforce employed and contributing over 20% of the country's GDP, it is a significant sector of the Indian economy (Ma et al., 2023). Nonetheless, farmers always fight to strike a balance between profitability and output. While meeting rising demand requires increased supply, optimizing earnings in a fluctuating market can be difficult. Conventional techniques frequently miss out on opportunities for larger returns because they rely too heavily on experience and intuition to determine when to harvest. Our suggestion is to employ a machine learning model to solve these issues and lessen this problem, thus increasing farmer profitability. Despite technological advancements in farming methods, farmers continue to struggle to consistently generate a profit. Predictions were produced using supervised learning techniques on data on onion prices due to the study's conclusions that price fluctuations can cause financial troubles and that onion prices are highly unpredictable (Elavarasan and Vincent, 2020). Earnings can be greatly impacted by erratic weather patterns, fluctuating market prices, and a dearth of up-to-date information on market dynamics. Crops may be harvested at less-than-ideal periods as a result of traditional harvesting methods that take these dynamic aspects into account and rely on historical averages or intuition. The prices of agricultural products are infamously unstable and can be affected by a variety of reasons, including weather patterns, seasonality, developments in the world market, and even unforeseen circumstances. If a crop is harvested too soon, it may not reach its peak price; conversely, if it is harvested later, it may spoil or have lower quality and command a lower price. Seasonal factors that greatly affect crop quality and productivity include temperature, sunlight, and rainfall. Determining the ideal harvest window requires an understanding of these variances. Lower yields and decreased market value may arise from harvesting fruits or vegetables prior to their optimal maturity. Real-time market data on regional and local trends is sometimes unavailable to small-scale farmers. As a result, estimating future pricing and selecting the optimal harvesting strategy in light of the current market conditions may prove difficult.
Price changes in agricultural markets frequently do not flow equally between producers and consumers, since research has shown that price increases are usually passed on to consumers more readily than price decreases are returned to farmers (Ali et al., 2018). This disparity may have an effect on market competitiveness as well as the distribution of earnings along the food chain. Price transmission analysis can assist us in comprehending the behavior of various market participants and the effects of changes on them. With this data, policies that improve the overall performance of the market can then be developed.
Sustainability is a key factor in influencing agricultural productivity. The goal of sustainable agriculture development is to achieve a balance between protecting the environment and producing more food. An investigation explores the concept of sustainable agriculture and the challenges related to its application. The research indicates that implementing sustainable agriculture as a one-size-fits-all strategy is not feasible and that context-specific modification is necessary. The implementation of sustainable agriculture has four primary challenges: methodological, theoretical, personal, and practical. The ambiguity surrounding the definition of sustainable agriculture is the source of theoretical challenges. Challenges with methodology have to do with evaluating and quantifying sustainability. The knowledge and attitudes of the individual farmer are the source of personal difficulties. Practical obstacles originate from social and economic divides. It concludes that in order to get past these challenges, farmers must be given access to an open and transparent process.
Machine learning (ML) is a powerful tool that has the potential to change various industries and the agricultural sector is no exception (Ma et al., 2023). With ML techniques, we may gain and extract important insights and patterns from historical data on variables like Minimum price, Maximum price, Quantity, Average Price, and Date. These details can be used to develop prediction models that determine the ideal harvest window to maximize profits. The use of ML for agricultural yield prediction and harvest time optimization has been the subject of numerous studies. Numerous algorithms, each having advantages and disadvantages of its own, have been used in this research. To find the best-performing algorithm with the least amount of error, we have therefore compared a number of techniques, including LR, K-Nearest Neighbors, Neural Network, DT, RF, Support Vector Machine (SVM), Gradient Boosting (GB), etc. (Ma et al., 2023; Elavarasan and Vincent, 2020; Ali et al., 2018; Anjom et al., 2018; Peng et al., 2015; Gómez et al., 2019; Ranaweera et al., 2023; Abewickrama, 2022; Liu et al., 2022; Dharavath and Khosla, 2019; Rathod et al., 2022; Hasan et al., 2020; Gümüşçü et al., 2020; Bali and Singla, 2021; Deepa et al., 2023; Kumari et al., 2023; Kaewchada et al., 2023; Paul and Garai, 2021; Sabu and Kumar, 2020; Meshram et al., 2021; Cheruku and Katekar, 2023; Vibas and Raqueño, 2019; Sarker and Chan, 2021; Zhang et al., 2019; Nassar et al., 2020; Ridzuan and Zainon, 2019; Luo and Liu, 2017; Luo et al., 2021; Sable et al., 2024; Buribayev et al., 2021; Agarwal and Sagar, 2019; Paul et al., 2022; Kumari and Yadav, 2018; Xu et al., 2010; Alida and Mustikasari, 2020; Chicco et al., 2021).
The objective of this research is to develop a reliable, dependable and user-friendly model that can be used to forecast or predict the optimal harvest window for different types of agricultural goods. We'll focus on crops like fruits and vegetables that experience large fluctuations in the market. Supervised machine learning methods will be used to build this model.
A persistent problem is raising agricultural production and profitability, which is essential for both economic stability and global food security. These difficulties are a result of the industry's natural susceptibility to erratic events including shifting weather patterns, shifting market values, and shifting environmental conditions. Traditional agricultural methods, which typically rely on historical averages and intuition, frequently fall short when it comes to handling this complexity. Utilizing the potential of historical and real-time data has never been easier thanks to the development of machine learning (ML). We can develop prediction models that determine and pinpoint the ideal times to harvest using these state-of-the-art analytical techniques, completely changing the way farmers make decisions.
This study's main goal is to create a data-driven, dependable prediction model that can precisely anticipate which harvesting months will result in the maximum crop earnings. This study is noteworthy for a few important reasons. To find the best model for maximizing agricultural output, a thorough comparison of several machine learning techniques, such as Random Forest, Decision Trees, and Linear Regression, must first be conducted. Furthermore, the predictive models in our research have a strong basis because to the extensive dataset we utilized, which includes 3 years' worth of meticulous agricultural data from the Krushi Utpanna Bazar Samiti in Haveli Pune.
We have also created a user-centric online application utilizing Streamlit, which makes it easier for farmers to apply sophisticated machine learning models to actual agricultural situations, in order to make these models useful and approachable for them. The ultimate goal of this project is to transform complex data analysis into practical insights that could completely transform farmers' agricultural planning and decision-making processes.
This work provides a new methodology for agrarian yield optimization using machine learning predictive modeling. This approach is similar to the existing ones that use historical averages and intuitions to select the best harvests, while our study takes a data-driven approach and finds the periods which will maximize the profit. The main contributions of this work include:
Predictive modeling—we test various ML algorithms, such as Decision Trees (DT), Random Forest (RF) and XGBoost to forecast ideal harvesting timings aligned with past theoretical pricing systems (market conditions) and seasonal occurrences.
Streamlit Web application—to enable farmers to utilize our pre-ventive model, we build a user-friendly web application using Streamlit. The user can enter the types of crops, years, and price estimation into the tool to get a data-specific recommendation for the best time to harvest them, allowing them to make more informed decisions and maximize their profits.
Contribution to precision agriculture—by augmenting agricultural decision-making with state of the art machine learning techniques our work also contributes to precision farming and sustainable agricultural practices.
This Paper is organized to give a thorough summary of our methods, findings, and research. In Section 2, we start with a Literature Review that sets the stage for our investigation and identifies knowledge gaps by critically evaluating previous studies on machine learning applications in agriculture and predictive modeling for agricultural production optimization. In Section 3, we describe our methodology, which includes pre-processing methods, the set of machine learning algorithms we used, and data collecting from Krushi Utpanna Bazar Samiti. We report the results of our model comparisons in Section 4, Results and Discussion, emphasizing the Decision Tree model's better performance and going over the implications for agricultural planning and profitability. Section 5 concludes with a summary of the main findings, highlighting the potential of machine learning to transform agricultural decision-making and providing an outline for future research direction.
2 Literature review
In Ma et al. (2023), the authors underscores the importance of practical considerations in implementing RNNs, advocating for hybrid models to provide reliable solutions while promoting market openness and sustainability in the banana supply chain. This study adds significant knowledge on using ML methods to pricing and agricultural economics projections. In Elavarasan and Vincent (2020), the authors propose applying SVM, K-Nearest Neighbor (KNN), and Neural Networks to daily onion prices for financial forecasting, achieving 98.17% accuracy with a Neural Network model on 30% of the data, aiming to stabilize onion market prices by estimating future demand and supply despite challenges in data behavior and size. Ali et al. (2018), expand on previous research in agri-food markets, concentrating in particular on Canada's vertically connected apple and orange markets. Prior studies have emphasized the significance of price transmission dynamics within these marketplaces, with a particular focus on the influence of import costs on retail pricing. The study makes a significant contribution by looking at asymmetric price transmission and identifying variations in the rate and size of price changes in the orange and apple markets. By illuminating the ways in which temporal elements impact price relationships, the incorporation of seasonality effects augments comprehension. These results provide insights into market behavior and economic ramifications, as well as extend our understanding of price dynamics in fresh fruit marketplaces. In Anjom et al. (2018), author enhances manual strawberry harvesting efficiency through conditional linear mixed models, considering picker speed, time of day, plant spacing, and picking cart type. The selected heterogeneous Linear Mixed Model (LLM), incorporating picker speed, time of day, and picking cart, outperforms other models, improving predictive accuracy for harvest-aiding machinery and labor management.
In Peng et al. (2015), the author establishes an open data-driven crop price forecasting service using Artificial neural networks (ANN), partial least squares (PLS), Autoregressive integrated moving average (ARIMA), and RSMPLS techniques on Taipei's market data (Jan 2011–Jul 2015). PLS excels in short-term predictions, while ANN proves superior for long-term forecasts, both exhibiting lower error rates. In Gómez et al. (2019), the authors enhance potato yield prediction by integrating satellite remote sensing with ML, showcasing Regression Quantile Lasso and Leap Backwards for feature selection and RF for accurate forecasting, leveraging Sentinel 2 images and pre-processing techniques. In Ranaweera et al. (2023), the authors employ ML to predict vegetable prices in Sri Lanka, addressing an essential gap in agricultural sustainability. It utilizes 4 years of historical crop data, employing RF and LR algorithms with meticulous data gathering and pre-processing techniques. In Abewickrama (2022), authors aim to investigate the difficulty of employing the Arima model to forecast changing prices for fruits and vegetables. It suggests a forecasting model-equipped e-commerce platform to help small farmers and facilitate educated consumer choices. System testing, Arima model implementation, and analysis of prior predictive systems comprise the methodology.
In Liu et al. (2022), authors research presents long short-term memory with feature selection (LSTMFS), a novel model that integrates long short-term memory and feature selection for precise crop harvest timing prediction. It tries to reduce resource waste for better sustainability and addresses shortcomings in earlier statistical methods. LSTM modeling and hybrid feature selection are used in the methodology to demonstrate the superiority of LSTMFS over Long short-term memory (LSTM) and recurrent neural networks. Incorporating more sensors is part of the future scope to increase forecast accuracy. In order to analyze and forecast fruit and vegetable prices in Bangalore using Seasonal ARIMA, in Dharavath and Khosla (2019) research on tackles inflation worries in India. The goal is to give citizens and governments a tool to foresee and handle inflationary concerns. The approach includes seasonal ARIMA forecasting for specific produce and historical data analysis. The model will be improved in the future for more accuracy and more widespread economic uses. During the COVID-19 lockdown, in Rathod et al. (2022) author research on rice prices surged in India, revealing non-linearity that traditional ARIMA models couldn't capture. ML, particularly ELM intervention, proved more effective, highlighting the necessity of tailored modeling for accurate forecasting in food market crises. Hasan et al. (2020) predict the best dates to plant wheat, this study uses machine learning (ML) methods, such as k Nearest Neighbor, SVM, and DT, using meteorological data. Genetic feature selection is used to increase the accuracy of the forecast. proving the value of machine learning in utilizing climatic data for sensible and sustainable farming methods. Gümüşçü et al. (2020), authors study brings into the scene a way by modeling crop production with a Deep Recurrent Q-Network (DRQN). This approach deals with raw data and takes into consideration the quality of the soil and climate conditions which makes it have an accuracy of 93%. 7%. Eliminating the constraints imposed by some specified features are achieved by using Deep Reinforcement Learning (DRL), a technique that the method incorporates. However, it provides a better and more flexible prediction model that would be helpful in case the results in agriculture are unpredictable. In Bali and Singla (2021), authors depicted better results with a higher level of accuracy and ability to map complex relations between yield data and environmental variables for wheat crop using an RNN-LSTM model than other conventional approaches. Exploring deep learning's ability to accurately forecast sustainable agriculture production in near real-time is the focus of the study. In Deepa et al. (2023), authors study examines volatility of farmers' revenues by moving up and down due to the price volatility in cotton prices. Some DL models like LSTMs as well as Recurrent Neural Networks (RNNs) can help in providing the farmers with a good forecast so that they can adapt they decisions depending on the forecast provided. Besides, the gains derived from accurate pricing forecasting, include food security, eradication of poverty and development of the rural areas. Where sustainability elements are included into models, it means that environmentally friendly tendencies are promoted, and, therefore, stability of the cotton production for generations to come is guaranteed.
Kumari et al. (2023) used RF model to forecast vegetable prices in the province of Nakhon Si Thammarat, the author reviewed the related literature extensively. The data used in the study included climate data on a monthly basis for the year 2011 to 2020 as well as vegetable prices. The accuracy of the model was tested using some crucial measures including, the mean absolute percentage error, the root mean square error and the Mean Absolute Error. The applicability of the RF model in modeling agricultural prices in the desired area was evidenced by the high accuracy of the model in estimating the prices of eggplant, pumpkin and lentils. Kaewchada et al. (2023), authors Integrate market demand, regional trends and forecast of weather for better accuracy and utility. It would help farmers close the gulf between pricing strategies and other analytical engines for proper decisions of plant choices and other systematic support in agricultural operations. If more elements such as regional trends and or rather weather patterns are incorporated into the W-ANN forecast then the accuracy and utility to the farmers when coupled with agricultural platforms will be even higher. It can also be discovered that the improvement of data accessibility and the extension of the dataset associated with the W-ANN approach enhance the general robustness and applicability of the proposed model across different markets and industries (Paul and Garai, 2021). Sabu and Kumar (2020) developed the reliable ML algorithm in agriculture and ensured that different farmer gets the same result and also encouraged to practice sustainable farming, the study focuses on the need for farmer training and interfaces. Finally, one has to mention infrastructures in rural areas and its shortcomings, and general social-economic consequences that need to be taken into account in order for the formula to work. Meshram et al. (2021) advises that lending programs and structure, development of infrastructure and projections should be used by the government to assist the farmers particularly during low prices. Since it makes farmers possess knowledge of potential outcomes, their earnings can be raised by helping them make right decisions on when to plant, what to plant and where to invest. Further enhancement of supply chain and better forecasting enables strong farm environment and smoother interaction with the stakeholders. As a result, the conclusion of the study focuses on the call for further research, cooperation, better data, intuitive interfaces, and openness in the agriculture sector for an equitable outcome.
Cheruku and Katekar (2023) focuses on government's objective of tripling farmer income as they look at how digitization is impacting Indian agriculture in the middle of the COVID-19 outbreak. They refer to a range of scholarly sources, including documents from international organizations and official publications, to promote the integration of digital technologies such as data-driven agriculture, precision farming, and digital financial services. The study emphasizes how digital technology may increase resource efficiency, empower smallholder farmers, and increase the profitability of the agrifood sector. In conclusion, our study highlights how critical it is that decision-makers leverage digitalization to support fair and sustainable growth in Indian agriculture. Vibas and Raqueño (2019) develop statistical models to predict changes in the main agricultural commodities' retail price in the National Capital Region of the Philippines over 2009–2018. Some of these commodities include bananas, mangoes tomatoes, cabbages and peaches, among others. Information from the Department of Agriculture and the Philippine Statistics Authority were collected and detailed time series analysis such as ARIMA, SARIMA, and ARIMAx where implemented. Splitting the data into the training and test sets are necessary for the construction of the model and determination of the model's predictive capabilities; hence, it used the data of 2009–2013 and 2014–2018 for these purposes. Specific examples of statistical tools that were used in creating and testing of the model included R and Python. These include the Jarque Bera normality test, Ljung box residual independence test and the augmented Dickey fuller stationary test. It also shows how much these methods are beneficial to predict future economic trends and provide views on the changes in the prices of commodities. Sarker and Chan (2021) developed a multilayer neural network for predicting annual crop planting of the US Corn Belt with an 88% accuracy with the future CDL, this study adopts historical CDL data. This affords a cost effective decision support tool for anticipatory decisions in agriculture. Zhang et al. (2019) collected data regarding apple prices and arrival at Jammu's Narwal market from the secondary sources in the form of data that has been recorded by the Directorate of Horticulture, Planning and Marketing for the last 10 years. It also applied the seasonal index calculations accompanied with LR to show that there was a positive movement in both price and arrival rates in which predicted an annual growth of 220.06 per quintal and 15,969.42 quintals in arrivals. The Narwal market is in its peak from August to January because it is the season of the central apple supply. In August the prices are at their peak following $100,892. From $10,500 to $8,420 per quintals and is further expected to decrease to ~$6,707.00/qntls in April. Some form of seasonality was evident from the arrival frequency where arrivals were highest in October and the lowest in April which provided a fluctuation of the apple trading frequency of the region and the market.
To assess the general performance of fresh produce market prices using price prediction models, in Nassar et al. (2020) authors make a comparison of DL models to statistical and traditional ML models. Given a priori on strawberry behavior, the study compares and evaluates five categories of fresh produce from Taiwan markets and a Canadian distribution company. The results reveal that even among the best performing statistical methods, such as GB, that seem to surpass standard methods like ARIMA, the DL model under consideration, CNN-LSTM with attention, attains the highest accuracy while forecasting fresh product prices within up to 3 weeks before the date of prediction. This work benefits the field with support from the Loblaws Research Chair in Artificial Intelligence and the NSERC CRD. Ridzuan and Zainon (2019) analyze what makes big data unsuitable for data cleaning while noting that dirty and noisy data are prevalent in large databases. That examines why common approaches of data cleaning are not efficient in dealing with the large amount, heterogeneity, and quality of big data. The study also underlines the importance of adapting data pre-processing methods on problems like data incompleteness, data inconsistency and data redundancy that may drastically affect the results of the analysis. This work also shows that it is imperative to have methods of cleaning data at large and at a scalable level that spans through different devices when the environment is scattered. However, this study highlights the importance of the domain experts in confirming the accuracy and reliability of the cleaned data and stresses the fact that data quality issues remain some of the biggest challenges facing the big data paradigm. In Luo et al. (2021), the research proposed SDTR to be the new solution for tabular data regression use-cases and for those applications which initially do not look possible with DNNs. Like in applying a mixture of constant predictions, SDTR applies a neural network structure with a differentiable topology to binary DT. Our method retains differentiability for easy integration into a range of applications while at the same time enhancing interpretability. As the authors have reported, SDTR has good performance as similar to GBDT and outperforms regular fully connected neural networks (FCNN) on a set of tabular datasets. From these results, it can be seen that how well SDTR performs in regression tasks with less complex model and more accurate predictions for various tabular data works suitable for this model.
Sable et al. (2024) has studied the changing demand for various food categories in India, with special emphasis on the growing preference of people for fruits and vegetables to the conventional food grain varieties. Identifying the difficulties and uncertainties for farmers in manufacturing high demand crops, the author has used Machine Learning (ML) and Deep Learning (DL) methods on historical market price data for fruits and vegetables from 2016 to 2021. This model would help generate accurate and actionable information that farmers can use to understand the expected prices for their crops in the near future. This predictive tool is aimed at helping farmers make informed decisions regarding crop selection and harvest timing to increase their profitability and meet the increasing demand for fruits and vegetables in the country. Buribayev et al. (2021) used the XGBRegressor method to introduce a ML-based system for predicting grain crop yields in the Republic of Kazakhstan. The study makes use of a dataset with 44 parameters, which includes historical meteorological data and grain harvest data gathered over a 10-year period. The study indicates that XGBRegressor performs better in accuracy, as indicated by the RMSE metric, when compared to the LR and DT Regressor algorithms. The suggested approach has the ability to significantly improve agricultural and grain trade decision-making, which will benefit the nation's agro-industry by improving productivity and market forecasting. Agarwal and Sagar (2019) have compared five supervised learning models (SVM, RF, KNN, Naive Bayes, SoftMax) for fruit image classification in a shopping mart scenario. The goal is to reduce checkout time by allowing customers to scan fruits for automatic billing. Existing methods include Convolutional Neural Networks. The authors use a dataset from Kaggle with 95 fruits (reduced to 18 for some experiments). They pre-processed the data by converting to grayscale, resizing, flattening, and applying standard scaling and principal component analysis. The models were trained and evaluated on accuracy using a split of the data into training and testing sets. Paul et al. (2022) have investigated predicting fruit and vegetable prices in Bangalore, India to help reduce poverty and hunger. The authors use seasonal ARIMA, a time series forecasting method, to predict prices. They collected data from 2010 to 2018 on various fruits and vegetables. The model was trained on a portion of the data and used to predict prices for the remaining months. The findings show that seasonal ARIMA can predict prices with some accuracy, especially for fruits like Mosambi and Pineapple where prices have risen over time. Paul et al. (2022) investigated ML methods for predicting vegetable prices. The authors contend that ML can increase accuracy and suggest that traditional statistical models have drawbacks. Four machine learning techniques are compared in terms of performance: GB Machine (GBM), RF (RF), Support Vector Regression (SVR), and Generalized Neural Network (GRNN). The experiment's main goal is to use daily data to estimate brinjal prices in Odisha, India's largest marketplace. Several metrics, including as mean error, mean absolute error, root mean square error, and mean absolute percentage error, are used to compare the models.
In Kumari and Yadav (2018), linear regression (LR) has been applied as a statistical tool to explore the relationship between two or more biological parameters. LR is used to understand how changes in an independent variable influence a dependent variable. For example, it can be utilized to test hypotheses involving weight and age as factors impacting systolic blood pressure (SBP). The method incorporates a formula that defines the relationship between the variables and evaluates the model's goodness of fit using the coefficient of determination (R2). LR serves several purposes, including conducting Chi-square (X2) tests to determine the strength of associations, identifying significant risk variables, predicting changes in the dependent variable, and providing prognoses for future cases. However, the application of LR requires adherence to specific assumptions, such as the normality and independence of errors, to ensure the validity of the analysis. Xu et al. (2010) focus on a robust regression approach that addresses data distress in least-squares regression problems. They demonstrate that this robust method is equivalent to augmenting the least-squares formulation with a penalty term, a strategy commonly associated with Lasso regularization. Lasso, a less explored but effective technique, promotes sparse solutions by encouraging many coefficients to become zero. The authors show that the robust regression approach minimizes the worst-case disruption effects on observed data and under certain conditions, aligns with Lasso regularization. Furthermore, the paper explores how this technique inherently favors sparse solutions, particularly when data disruptions are independent and bounded. By extending the formulation beyond the traditional squared-error norm, the authors provide a broader framework for robust regression. They also establish a connection between kernel density estimation and Lasso regression, offering a novel perspective on demonstrating Lasso's consistency in statistical learning. In the context of SVR, Alida and Mustikasari (2020) discusses predicting exchange rates between the Indonesian Rupiah (IDR) and the US Dollar (USD) using ML. The exchange rate significantly impacts the Indonesian economy. Accurately predicting exchange rates can inform investment decisions and government policies. It explains the importance of exchange rates in international trade and finance. Highlights the challenges of predicting exchange rates due to various influencing factors. It also introduces Artificial Intelligence (AI) and ML (ML) as potential solutions for exchange rate prediction.
Chicco et al. (2021) compares two metrics used to evaluate regression models: R2 and SMAPE. The authors argue that R2 is generally better because it has a well-defined range (0–1) that makes it easier to interpret, regardless of the scale of the data. SMAPE, while ranging from 0 to 200 and easier to understand intuitively, can be misleading in some cases. The paper explores these mathematical properties and gives examples to support the claim. Whereas, Botchkarev (2019) explores performance metrics used in ML regression, forecasting, and prognostics. The authors argue that there is no single “best” metric and propose a new typology to improve understanding and use of various metrics. It introduces a classification system for performance metrics, including primary metrics, extended metrics, composite metrics, and hybrid sets. Eppert et al. (2021) proposes a new approach to improve the efficiency of learned indexes. Learned indexes are used to speed up data lookups by using a fitting function to locate keys. The current approach uses linear models optimized with least squared error, but this is not ideal because it is computationally expensive and not robust to outliers. This paper proposes using logarithmic error instead, which is a better measure of the impact on lookup time. However, minimizing logarithmic error is difficult because it is a non-convex function. The paper proposes two algorithms to address this challenge: a fast discrete logarithmic error regression and a tournament evaluation method. Both achieve good results and are much more efficient than the traditional least-squared error approach. Ocampo et al. (2024) explores the adaptation strategies in African agriculture to the challenges of climate change. The study's examination of efforts to adopt strategies and practices such as drought-resistant varieties, better water management, and the integration of traditional knowledge with advances in modern science provides insight into the changing face of adaptive strategies adopted in all parts of the continent. Using a mix of qualitative and quantitative methods, data from different African countries are examined, illustrating both gains in the spread of new agricultural technologies and challenges including financial barriers, inadequate infrastructure and policy shortcomings. These 'community-driven endeavors' have proved successful, and can ensure agriculture is resilient to climate variability, the paper asserts, however they also call for collective approaches to this problem that involve farmers, government, non-government organizations and the global community if sustainable agricultural practices are to feature in any future ability to fight food security and retain economic stability as Africa grapples with the increasing effects of climate change. In Table 1 gap analysis of a few researchers who have shown greater impact in predicting price at harvest time has been analyzed.
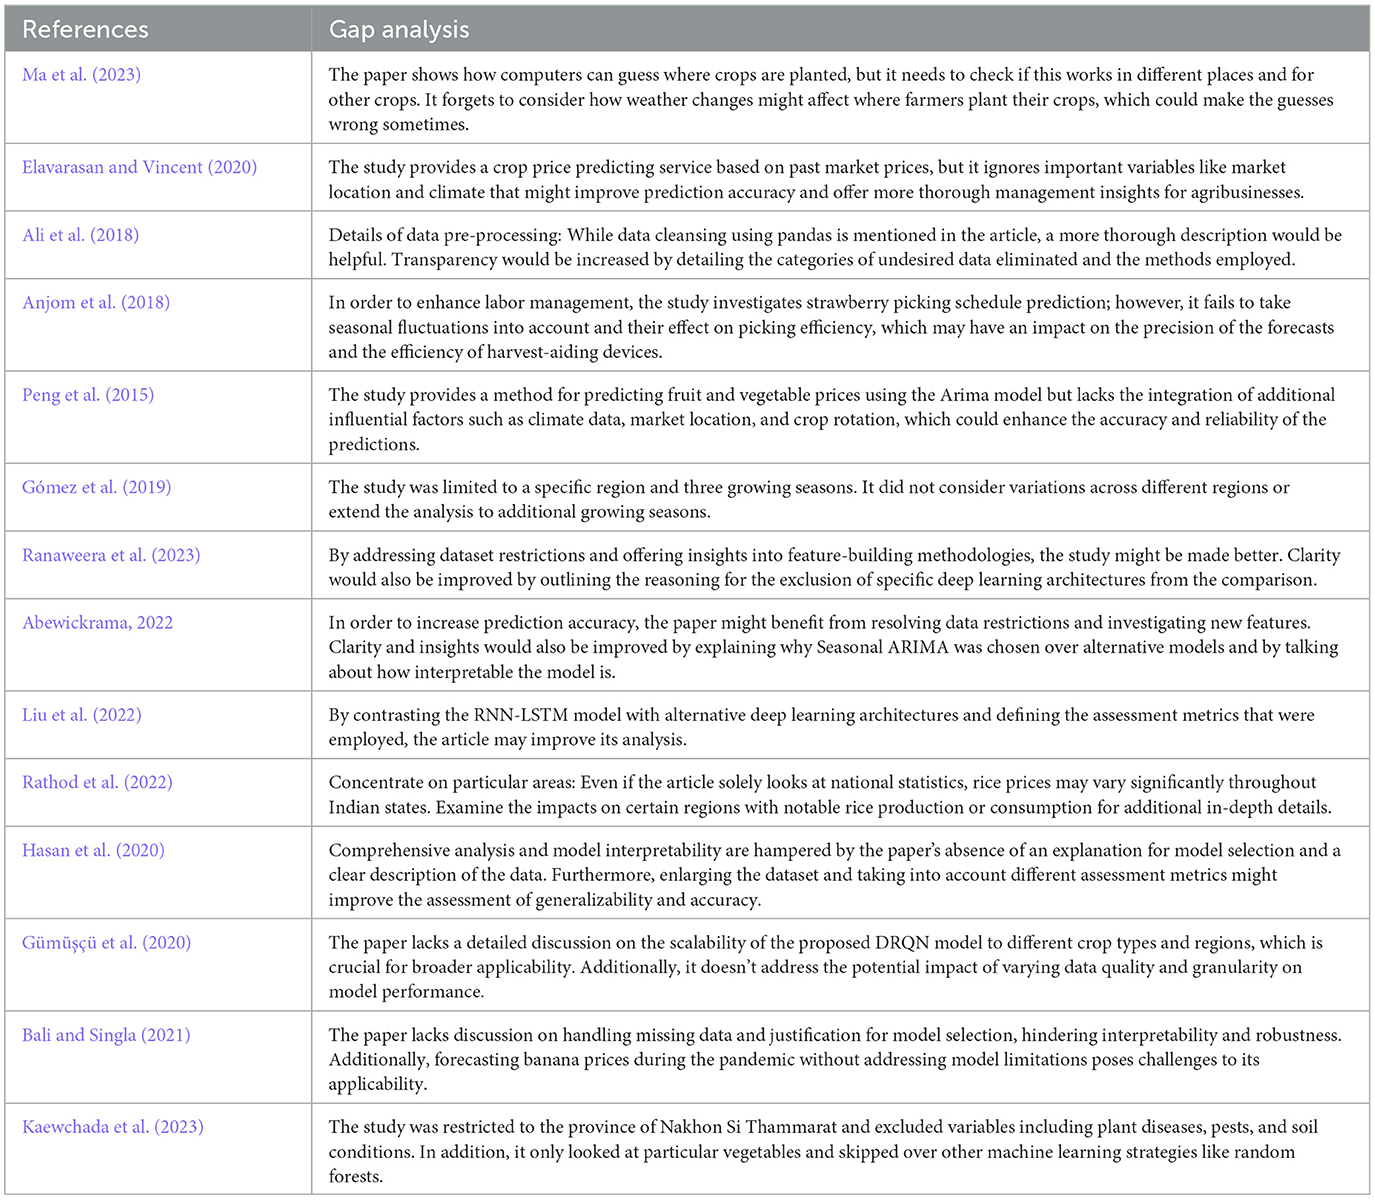
Table 1. Gap analysis.
Table 1 shows research reviewed different studies on using ML to forecast agriculture, especially predicting crop prices and harvest times. However, there are still several crucial areas that require extra attention. Firstly, while many studies predict prices, fewer help farmers decide when to harvest to maximize profits. Secondly, most research focuses on specific crops or regions, and we need more general models that work well in different farming scenarios. Thirdly, there is a need to improve the accuracy and clarity of these ML models, and more studies are needed to make these tools practical and easy for farmers to use in their everyday decision-making. Addressing these gaps could lead to better tools for farmers to boost their productivity and sustainability.
Based on the above gap analysis in existing research on ML for agriculture forecasting, the objective is to develop user-friendly tools that assist farmers in optimizing harvest timing for maximum profitability. This involves creating models that not only predict crop prices but also recommend specific harvest periods. Generalized ML models will be developed to work effectively across various crop and farming contexts while also improving accuracy by incorporating complex factors like market dynamics. The ultimate goal is to provide useful tools that farmers can utilize with ease to increase agricultural output and sustainability.
3 Methodology
In this research, we followed a structured process consisting of the following key steps, which outline the methodology used to achieve the desired outcomes.
1. Data collection
2. Data cleaning
3. Applying regression algorithms
4. Evaluate and select best ML model
5. Model traning
6. Validating predicted results
Figure 1 illustrates a system model at a higher level—Level 0, where the Level 0 diagram outlines the process of executing a model from data collection to validating predicted results. It begins with data collection, followed by data cleaning, applying a regression algorithm, selecting the best model, training the model, and validating the predicted results for accuracy and reliability.
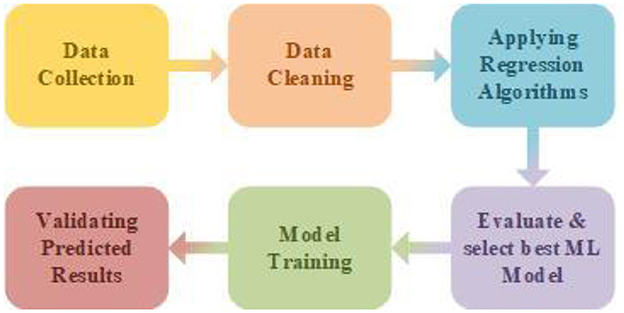
Figure 1. Level 0 system model.
3.1 Data acquisition and pre-processing
We have collected the data from Pune Krushi Utpanna Bazar Samiti Haveli (2021–2023) containing historical prices and seasonal trends of past 3 years of agricultural goods are synthetically for training the ML model. This data will encompass: Name of the agricultural good, Quantity, Minimum price, Maximum price, Average price, and the Date comprising over 160 crops' data with recorded maximum and minimum prices for each month in the specified years, with examples like Cabbage, Garlic, Orange, Coconut, Aboli, Chafa, among others; Table 2 shows a sample of the dataset used, which includes the agricultural good's name, quantity, minimum price, maximum price, average price, and date.
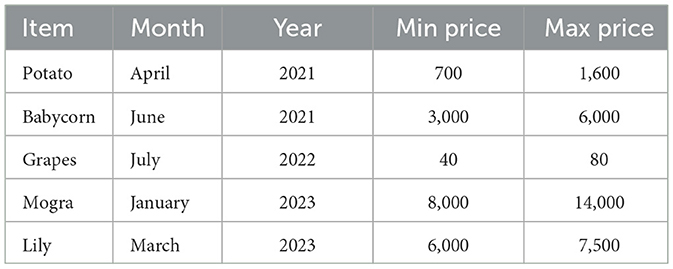
Table 2. Dataset.
Data cleaning and pre-processing: To make sure the gathered data is appropriate for machine learning algorithms, it will go through a thorough cleaning and pre-processing procedure. This could include: Managing absent values: To deal with missing data points, methods like mean/median imputation or deletion may be used. Identifying and handling anomalies: Information that differs noticeably from the mean should be changed or eliminated. Feature scaling: to keep some features from taking center stage in the model, numerical features might be adjusted to a common range. Outliers may also be eleiminated.
3.2 Libraries used
• Pandas: For data manipulation and pre-processing.
• Scikit-learn: For building and training ML models.
• Streamlit: For building the interactive web application.
• Numpy: For numerical computations.
• Matplotlib: For data visualization.
• Seaborn: For statistical data visualization.
• XGBoost, LightGBM, CatBoost: Additional ML libraries for boosting algorithms.
• Warnings: For handling warning messages.
3.3 Feature engineering
a. Feature Selection: We'll use methods like correlation analysis to examine the connections between various features. This eventually helps in identifying the most important characteristics or key traits that have a major impact on market values, influence it, and, in the end, the optimal harvest window.
b. Feature Creation: Additional features or attributes may be extracted from available data, based on subject expertise and preliminary analysis. For example, novel elements that depict seasonal patterns could be developed.
To eliminate redundancy and improve model performance, we completed correlation analysis to determine essential features that influenced crop prices. Two main correlation methods were implemented:
Pearson correlation (Benesty et al., 2009): This is one method to calculate linear relationships between numerical features like minimum price and maximum price. The features with a high correlation with the target variable were kept, while those with a low correlation were removed in order to avoid noise in the model.
Spearman correlation (Ali Abd Al-Hameed, 2022): Since crop prices show seasonality, the Spearman correlation was used to identify monotonic relationships between ranked variables (e.g., month and price variations). This approach enabled us to recognize nonlinear dependencies so that we could appropriately capture seasonal effects.
We also performed feature importance analysis using models such as Random Forest and XGBoost to additionally validate the selected features. The above techniques were employed in order to make the model learn on the factors which have most effect on its price.
3.4 Model development and training
a. Model selection: in order to estimate both the minimum and maximum prices for the selected crops, we will investigate a range of machine learning (ML) algorithms for multi-output regression.
This will consist of:
1. LR models with various regularization techniques (Ridge, Lasso).
2. K-Nearest Neighbors (KNN).
3. Artificial Neural Networks.
4. DT and RF algorithms.
5. SVM with different kernel functions.
6. GB algorithms like XGBoost and LightGBM.
7. CatBoost.
b. Model training and evaluation: a split-sample methodology will be employed for both training and evaluating the selected algorithms. Two sets of data will be created from the data: a training set for model construction and a testing set for evaluating the model's performance on untested data.
c. Model tuning: for each model, hyper parameter adjustment will be done in order to maximize performance for this particular task. This entails modifying different model parameters in order to attain optimal outcomes on the training set.
3.5 Model performance evaluation
a. Performance metrics: we will evaluate each model's performance using a range of metrics, such as: R-squared: This metric shows how effectively the target variables' variance (price minimum and maximum) is explained by the model. Precision is a metric that evaluates how effectively the model predicts specific subsets or categories of the dependent variable. The average squared difference (MSE) between the actual and expected prices is the metrics unit of measurement.
b. Model comparison: the selected evaluation measures will be used to compare the performance of various models. This will facilitate the process of identifying the model that most accurately forecasts market prices and, consequently, the optimal harvest window to optimize profitability.
3.6 Model deployment and explanation
a. Model selection and deployment: the model with the highest performance will be chosen for deployment based on the evaluation results. This model will be used to forecast the best harvest windows based on recently released data on certain crops and geographical areas.
b. Model interpretability: we'll look at methods for deciphering the logic underlying the model's predictions. To determine which characteristics have the biggest impact on the anticipated harvest window, feature importance analysis may be used.
3.7 Model application and prediction
Once the optimal model is selected and trained, we can utilize it to predict optimal harvest windows for new data. Here's an example of how the model can be applied:
a. Data preparation for prediction: new data representing a specific crop (e.g., Aale) will be prepared for prediction. This data will include:
° Agricultural Product: The type of crop being analyzed.
° Month: The month(s) for which predictions are desired (in this case, all 12 months for the year 2025).
° Year: The target year for prediction (2025 in this example).
b. Data encoding: the newly prepared data will undergo the same encoding process applied to the training data (as described in the Feature Engineering section). This ensures compatibility with the trained model.
c. Price prediction: the encoded data for the target year (2025) will be fed into the chosen model. The model will then predict minimum and maximum prices for each month of the year for the specified crop (Aale).
3.8 Example scenario: predicting prices for beetroot in 2024
Here's a demonstration of how the model can be used to predict prices for Aale throughout the year 2024:
• A DataFrame named year_2024 is created, containing information for Aale across all 12 months of 2024.
• This data is then encoded using the same technique employed during model training (refer to Feature Engineering section).
• The encoded data for 2024 is fed into the trained model.
• The model predicts minimum and maximum prices for Aale for each month in 2024.
• The predicted prices are displayed, allowing farmers to identify the month with the highest potential profit margin for harvesting Aale in 2024.
Figure 2 shows an additional representation of System Model at a Low Level—Level 1, where the Level 1 Diagram outlines the process of data collection from Pune Krushi Utpanna Bazar Samiti Haveli (2021–2023) with 160 items undergoes cleaning (removing duplicates, null values, standardization). Various regression algorithms are applied, evaluated using MSE and R2, and validated against market rates to identify the best-performing algorithm for practical use. Following are the detail explanation of algorithm used in the methodology.
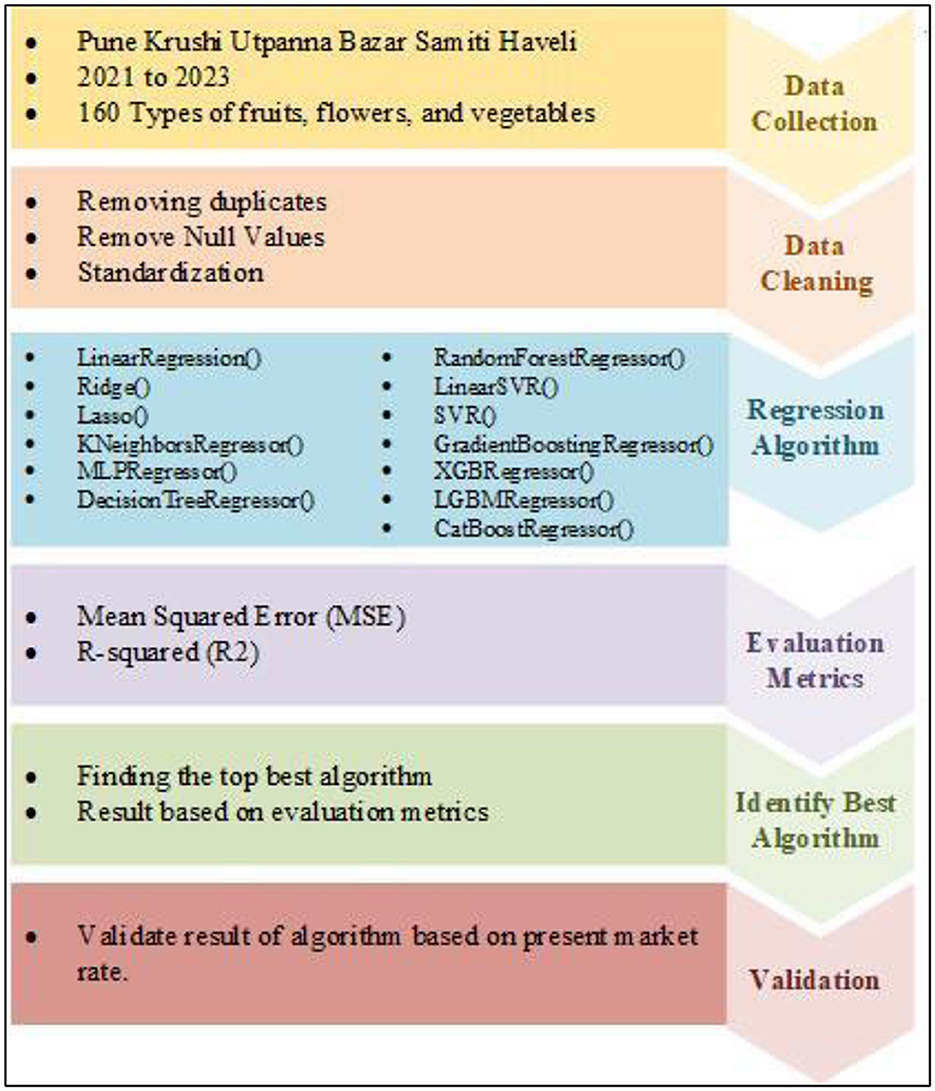
Figure 2. Research methodology.
Linear Regression is a fundamental algorithm for predictive modeling. It establishes a linear relationship between the dependent variable (target) and one or more independent variables (features) (Xu et al., 2010). The general formula for a LR model with multiple predictors is given in Equation 1.
where y is the predicted output, β0 is the intercept, β1,…,βn are the coefficients for each predictor, , x1,…,xnare the predictor variables, and ϵϵ is the error term. The goal is to minimize the MSE between the predicted and actual values to find the optimal coefficients.
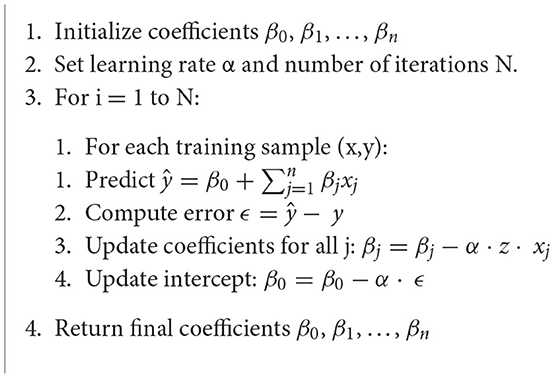
Algorithm 1. Linear Regression.
Ridge Regression extends LR by adding an L2 regularization term to the loss function. This helps prevent overfitting by penalizing large coefficients (Luo and Liu, 2017). The objective function for ridge regression is given by Equation 2:
where λ is the regularization parameter, and the second term represents the L2 regularization.
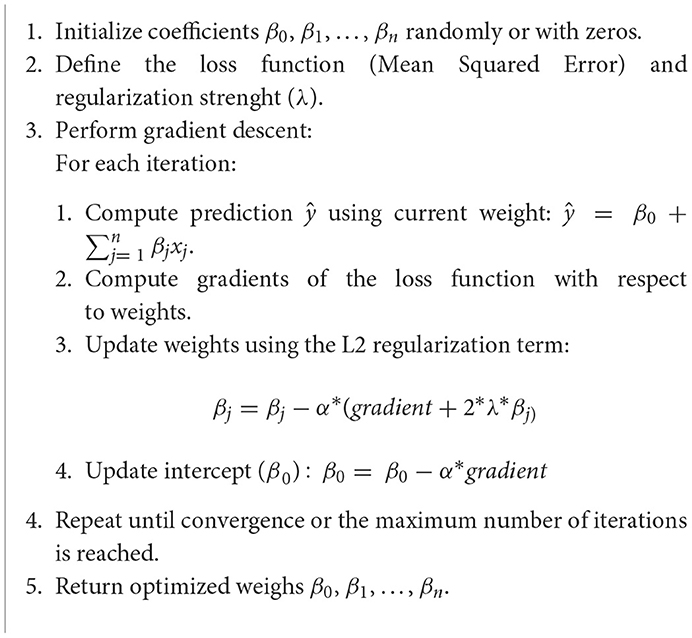
Algorithm 2. Ridge Regression.
Lasso regression is another extension of LR that uses L1 regularization. Unlike ridge regression, it can lead to sparse solutions, causing some coefficients to be zero, effectively performing feature selection (Alida and Mustikasari, 2020). The objective function for lasso regression is given in Equation 3.
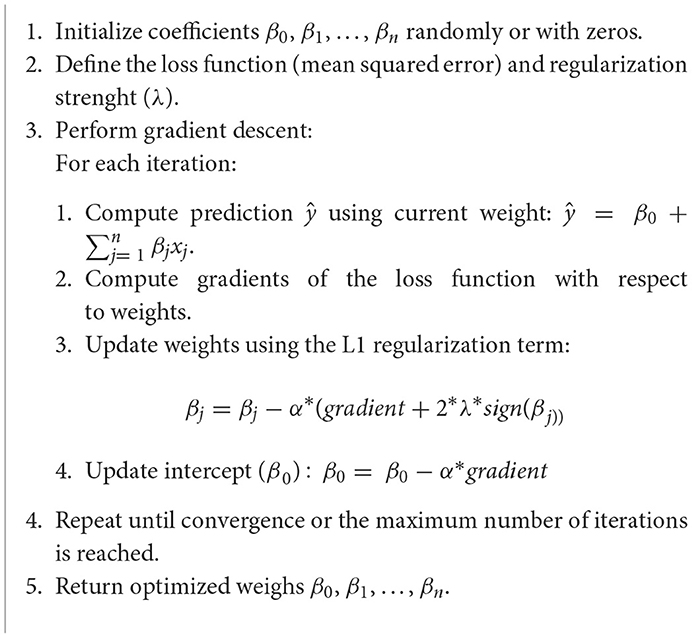
Algorithm 3. Lasso regression (L1 regularization).
K-nearest neighbors (KNN) is a non-parametric algorithm used for classification and regression. For a given data point, it identifies the “k” nearest neighbors and bases the prediction on them. In regression, the prediction is typically the mean of the neighbours' outputs and given by Equation 4.
where yi are the values of the nearest neighbors. In classification, the prediction is the mode (most frequent class) among the neighbors.
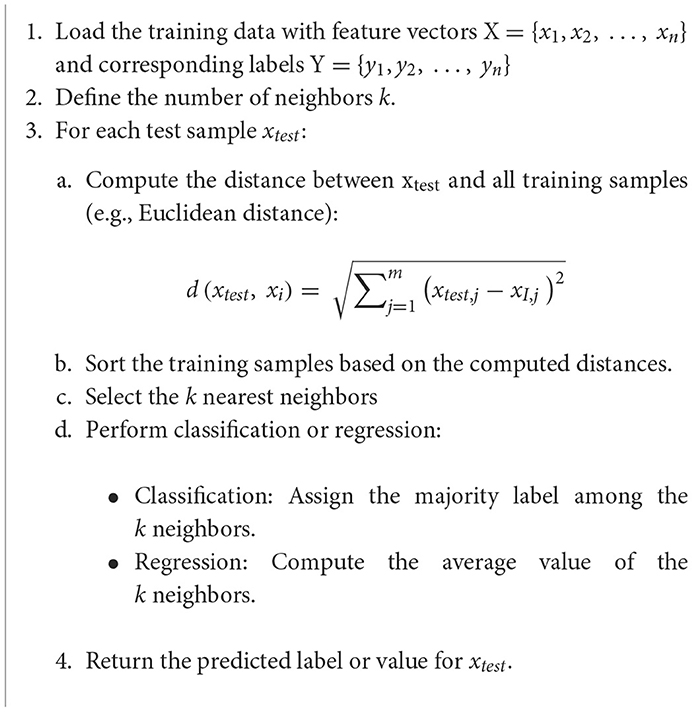
Algorithm 4. K-nearest neighbors (KNN).
Neural networks are a family of models inspired by the human brain. They consist of interconnected nodes (neurons) across multiple layers. Each connection has a weight, and neurons apply activation functions to produce outputs. Common activation functions include Sigmoid, Tanh, and ReLU (Rectified Linear Unit). Neural networks can be represented mathematically as: a(l+1) = g(W(l)a(l)+b(l)).
Where a(l+1) is the activation for the next layer, g is the activation function, W(l) represents the weights, b(l) is the bias, and a(l) is the activation from the current layer (Kumari et al., 2023).
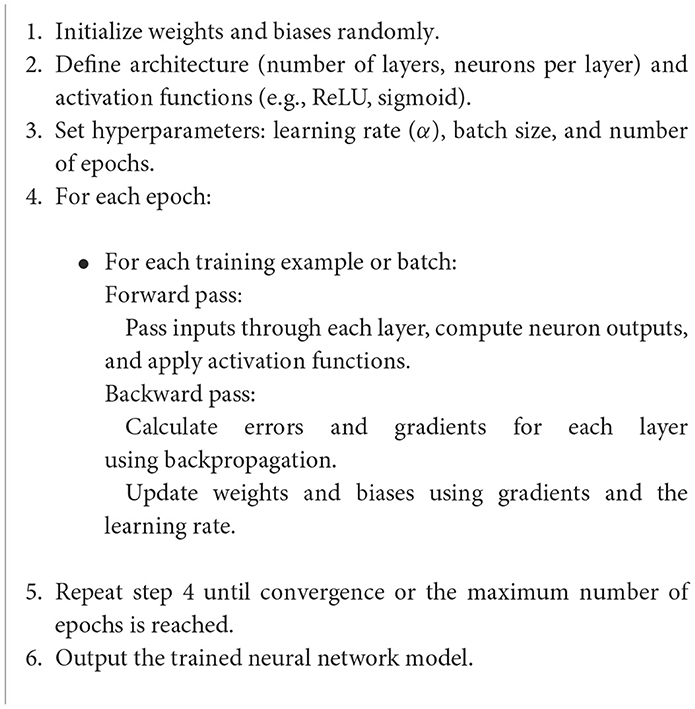
Algorithm 5. Neural networks (NN).
Decision tree are models that recursively split data into subsets based on features to form a tree structure. Each split is based on a metric like Gini impurity, information gain, or variance reduction. For regression, the splits aim to reduce variance, with the decision at each node determined by Equation 5.
where j is the number of branches from the split, yj is the observed value, and is the mean of the subset.
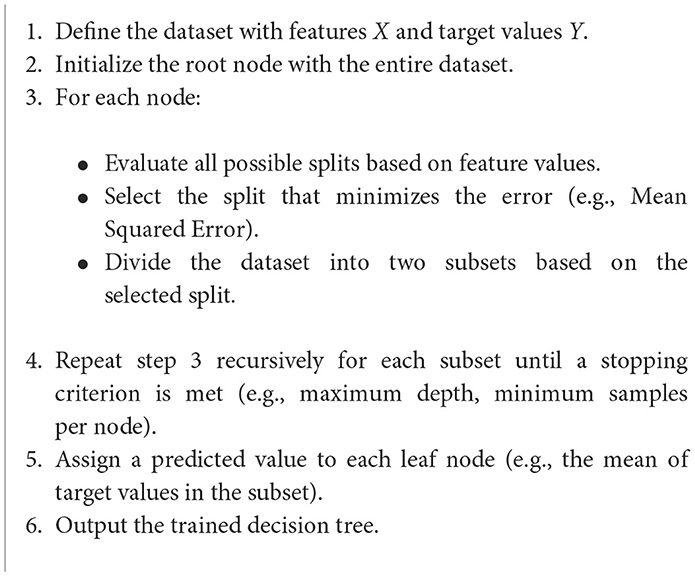
Algorithm 6. Decision tree regression.
Random forest is an ensemble of DT. It combines the predictions from multiple trees to make a final prediction, typically through averaging (regression) or majority voting (classification). The diversity among trees is achieved by randomly sampling data with replacement (bootstrap sampling) and selecting random subsets of features. This approach enhances robustness and generalization (Kaewchada et al., 2023).
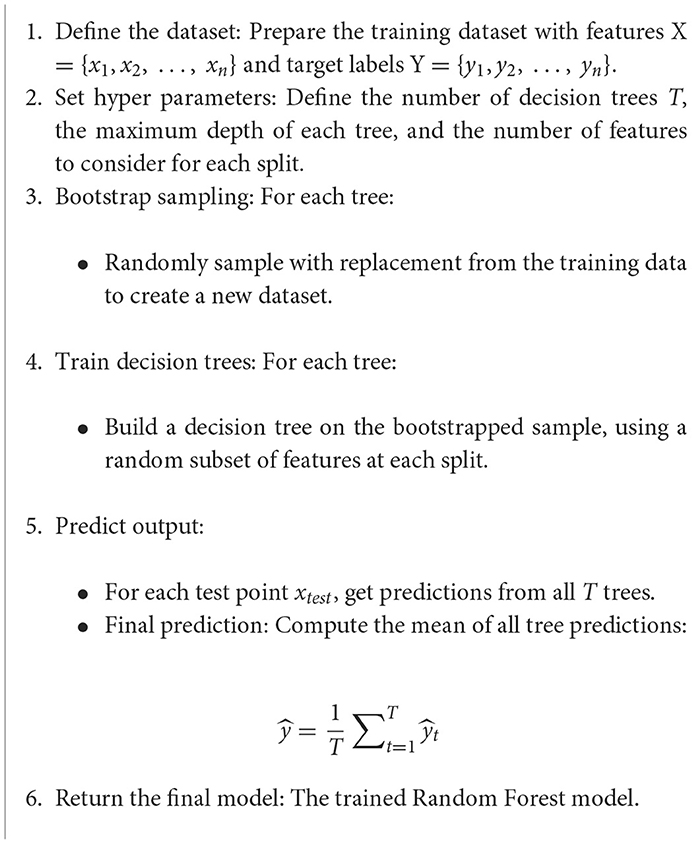
Algorithm 7. Random forest regression.
Support vector machine find the hyperplane that best separates data into classes with the maximum margin. For linear SVMs, the optimal hyperplane is represented by: w · x - b = 0 where w is the weight vector, x is the feature vector, and b is the bias. The RBF (Radial Basis Function) kernel projects data into higher dimensions, allowing for non-linear separations.
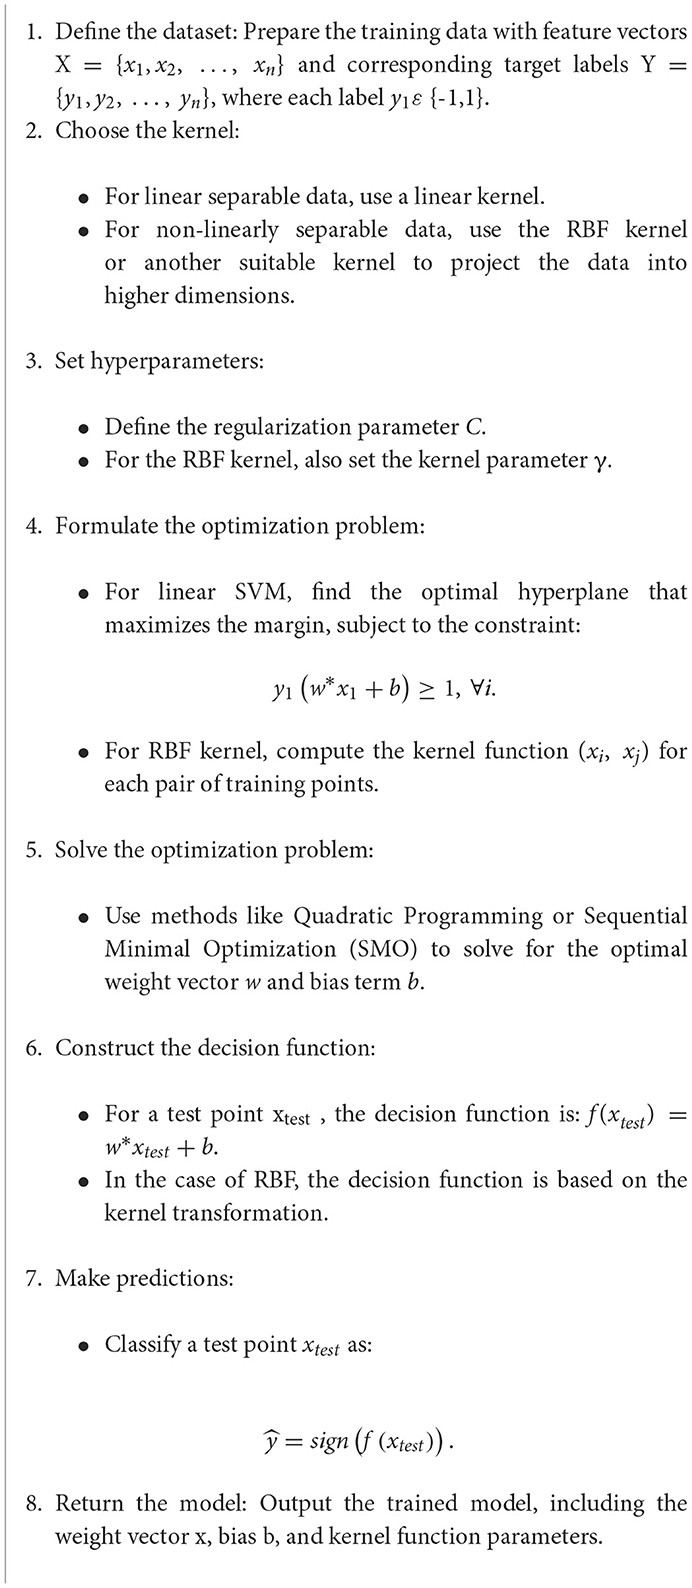
Algorithm 8. Support Vector Machine (SVM).
Gradient boost is an ensemble technique that builds weak learners, typically DT, incrementally. Each new tree aims to correct the errors of the previous ones, with the goal of minimizing a loss function. The typical loss function is the MSE is given by Equation 6.
where yi is the actual value, and is the predicted value. GB adjusts trees to reduce this loss using gradient descent.
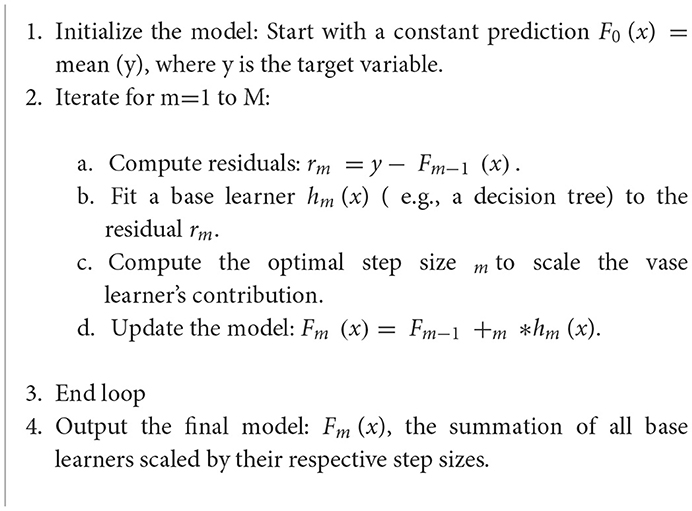
Algorithm 9. Gradient boosting regressor.
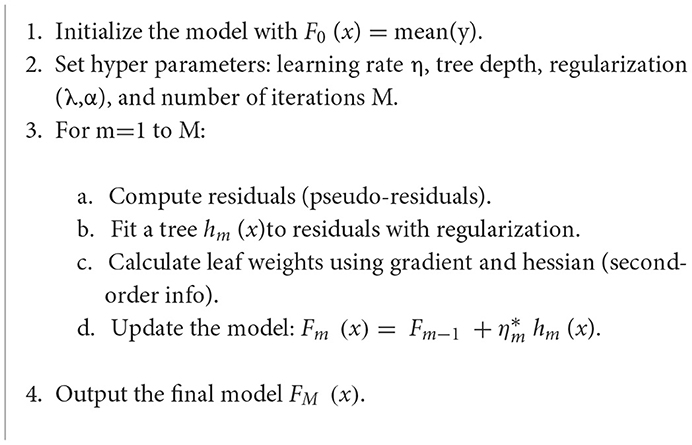
XGBoost enhances GB by optimizing a specific loss function, such as squared error for regression or deviance for classification, using a sequential model-building process where each tree corrects previous errors, represented by Equation 7.
Algorithm 10. XGBoost Regressor.
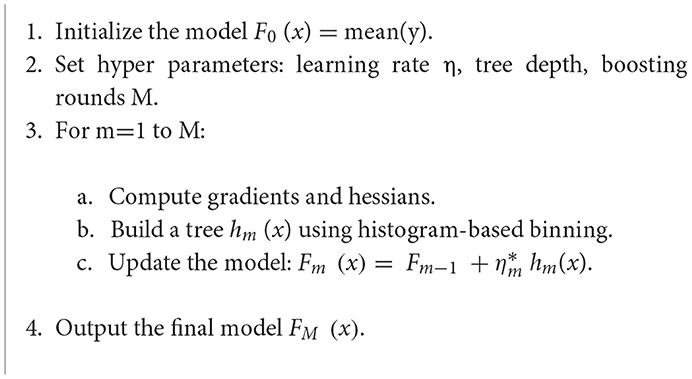
LightGBM accelerates GB by employing Gradient-One Side Sampling (GOSS) and feature parallelism to build trees, focusing on high-error data points, and finding optimal splits with a histogram-based algorithm, reducing computational cost and improving efficiency, with a similar loss function given in Equation 8.
Algorithm 11. LightGBM regressor.
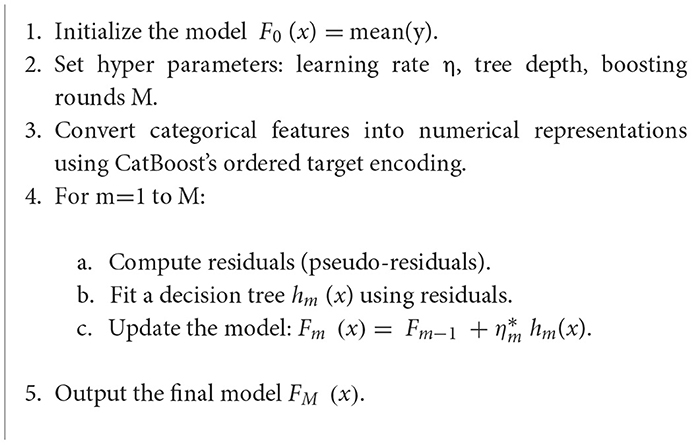
CatBoost specializes in GB with categorical features by using ordered boosting to reduce bias, feature interaction constraints for stability, and effective data encoding methods, while maintaining the standard sequential tree-building process with a similar loss function given in Equation 9.
Algorithm 12. CatBoost regressor.
MSE, or mean squared deviation (MSD), is a metric used to assess the quality of an estimator. It calculates the average squared difference between the estimated and actual values. A lower MSE indicates a better fit for the model, signifying a smaller difference between the estimated and actual values. The formula for MSE is given in Equation 10.
Where:
n = the number of observations.
yi = the ith observed value.
pi = the ith predicted value corresponding to yi.
Σ = summation over all observations (i = 1 – n).
Precision is a measure of how many of the positive predictions made are correct (true positives) given in Equation 11.
R2 is a statistical measure used in regression analysis to evaluate how well a model explains the variance in the data. It represents the proportion of the variance in the dependent variable (what you're trying to predict) that's explained by the independent variables (the factors influencing the prediction). R2 is calculated using the Equation 12.
Where: SSE (Sum of Squared Errors): Represents the variance of the errors between the predicted and actual values. SST (Sum of Squared Total): Represents the total variance in the dependent variable.
Figure 3 shows system flow diagram for propose strategy is an inventive fusion of ML and predictive analytics methods designed to maximize crop productivity. In estimating the best time to harvest different crops, the system employs the most advanced theories of predictive modeling and data driven decision making in agriculture. This approach is based on understanding the standpoint of the usefulness of time in agricultural operations with regards to the utilization of resources, the cost of production and profitability.
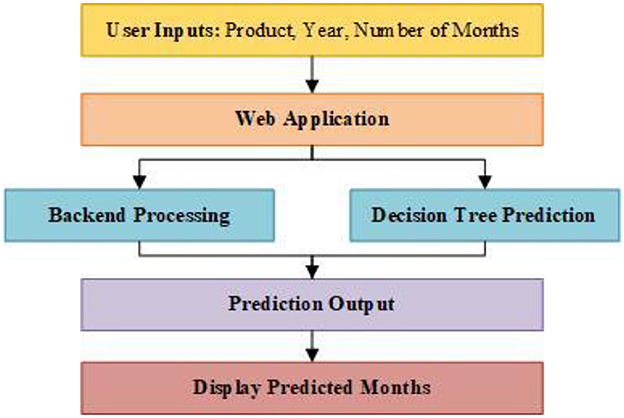
Figure 3. System flow diagram.
Data is entered into the system through a web-based interface by the farmer, and he enters parameters that are important in modeling such as the agricultural crop, year, and number of months to be projected. This triggers a series of operations in the system and the web application proceeds to take action on the data entered by a user. When entered, the data is then processed in the background of the program in which numerous detailed pre-processing are performed to ensure the data's quality. Such procedures may entail work such as; data imputation where missing values are imputed, creation of new variables where categorical data is encoded, standardization of the numerical characteristics where the properties are scaled to enhance the predictive modeling.
The farmers input important data into the system, such as the crop to be grown, the year and number of months required for forecast through a website. Being so, they trigger a sequence of events into the system that wake up the web application to respond to the inputs from the end users. As per input, the data is managed here in the backend area but with great precautions so as to maintain the standards of accuracy and consistency. These procedures include scaling of numeric attributes, conversion of categorical features to numerical values and handling of missing data before they prepare data for predictive modeling.
4 Results and discussion
The data was collected over the last 3 years from Krushi Utpanna Bazar Samiti at Haveli, Pune and it had index number of historical price trend and seasons for agricultural products. Data pre-processing as for handling of missing values and converting categorical variables into numerical forms and after that for dimensionality reduction, some columns like weights and averages were removed. After that, the obtained data was used in the machine learning models, namely 13 models to predict the right months for harvesting agricultural items. In order to analyze the ability of the models in terms of predictive results, we compared their R-squared and MSE.
4.1 Model comparison
4.1.1 R-squared values
The Table 3 presents the R2 and MSE values obtained for each ML model, providing insights into their predictive accuracy and precision.
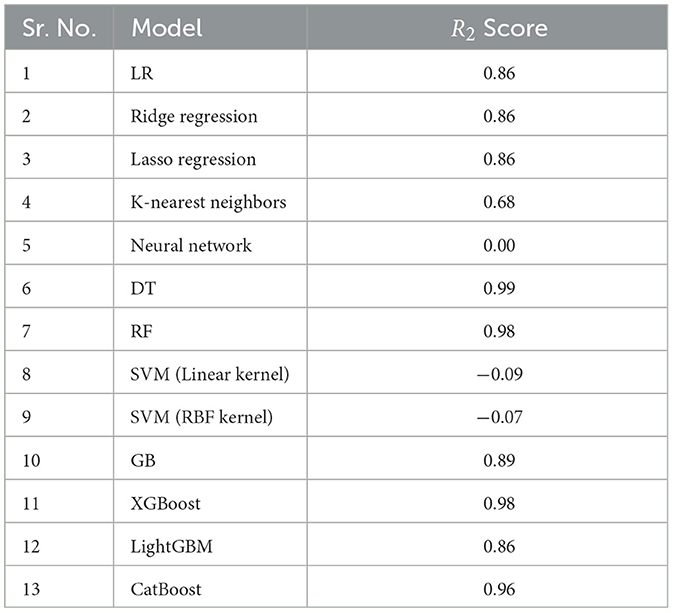
Table 3. Regression algorithm with R2 score.
The table makes it clear that the RF and DT models perform better than the other models, with R2 values of 0.98 and 0.99, respectively, which are significantly greater. When it comes to predicting which months are optimal for harvesting agricultural goods, these models show greater predictive accuracy. Figure 4 shows graphical representation of R2values for all Regression Algorithm.
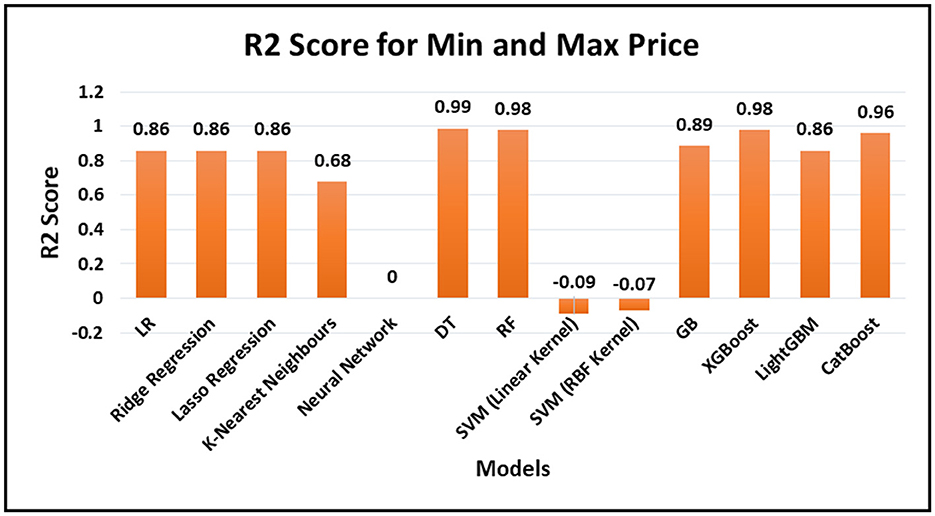
Figure 4. R2values for regression algorithm.
4.1.2 Precision
Precision is a crucial metric in machine learning, especially for classification tasks, measuring the accuracy of positive predictions by calculating the ratio of true positives to the total positive predictions. Table 4 represent precision value for various regression algorithm.
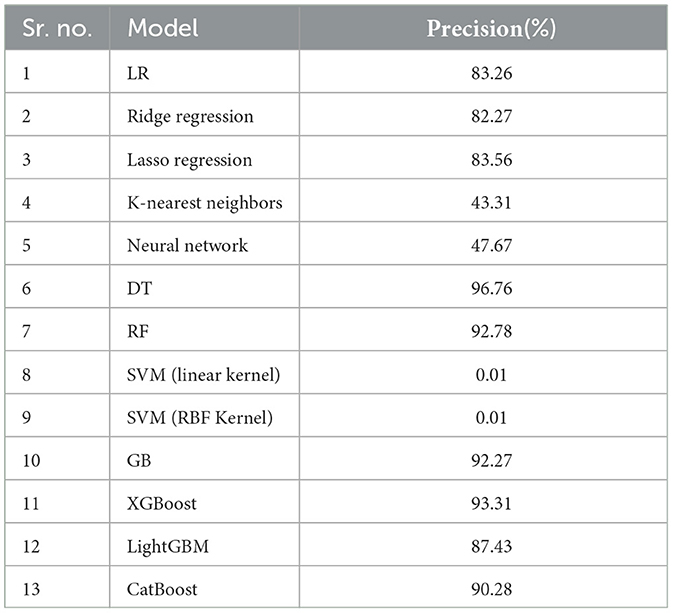
Table 4. Regression algorithm with precision percentage.
4.1.3 Mean squared error
The MSE was another method we used to evaluate each model's performance. An understanding of the prediction accuracy of the models may be gained from the graph below, which shows the MSE values achieved for each model.
Figure 5 illustrates that, when compared to other models, the DT model has the lowest mean square error (MSE). This illustrates how accurately the DT algorithm forecasts the ideal times to harvest various crops.
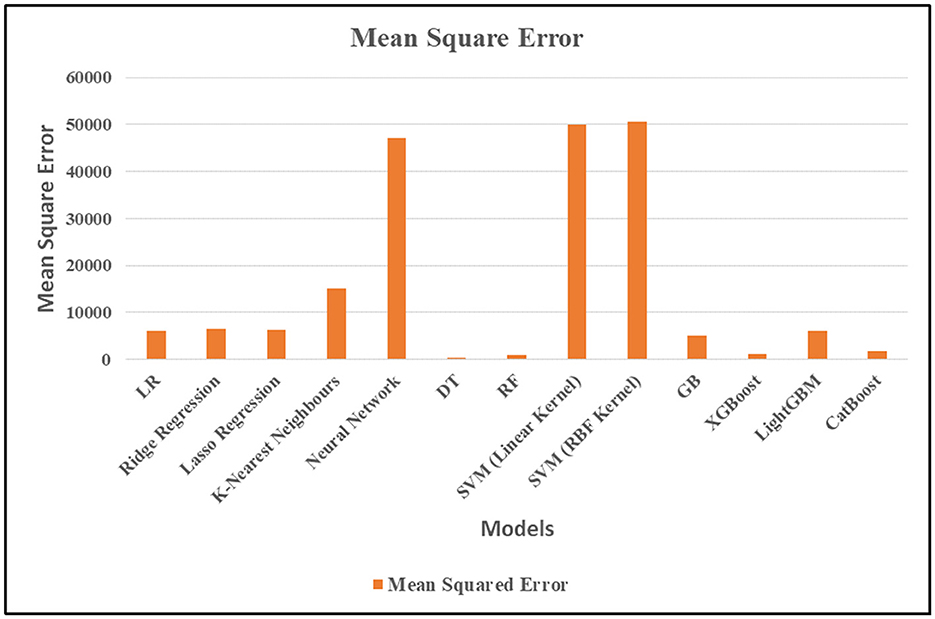
Figure 5. MSE values for all regression algorithm.
LR(): LR can produce findings that are useful because of its rather low MSE and R2 value of 0.86.
Ridge regression() and Lasso regression(): these two regression techniques provide a low mean square error (MSE) and an R2 value of 0.86, indicating their efficacy in producing strong predicted outcomes.
K-nearest neighbors (KNN): From the results we can see that K-Nearest Neighbors is not very suitable for this dataset, as its MSE signifies and its coefficient of determination R2 is equal to 0.68.
Neural network(): The MSE is high and R2 values are low which suggest that the model may not be appropriate for the data.
DT(): DT has the best performance on the model evaluation measurements and has the highest R2 and the lowest MSE of all algorithms.
RF(): By applying features selected by the autocorrelation plot RF exhibits good predictive accuracy for the given dataset and has 0. 98 as well as the fairly good value of the MSE.
SVM (linear kernel) & SVM (RBF kernel): These two SVM models are unsuitable for such kind of accurate prediction because they have high Mean Squared Error and negative coefficient of determination of the R2.
GB(): All things considered, the box was observed to have a reasonably low MSE and an R2 of 0. 89, Overall, it is quite good for a decent amount of forecast and can even be useful at times.
XGBoost(): XGBoost is quite an accurate model that supports highly accurate predictions based on the low MSE of the model and the R2 score that is 0. 98.
LightGBM(): Specifically, the result from LightGBM for this problem has the R2 value of 0. 86 and a comparatively low MSE, it therefore may be a good choice for some of the prediction workloads.
CatBoost(): CatBoost seems to be a decent contender when it comes to making rather accurate predictions, given from the low MSE and with R2 of 0. 96. Table 5 shows the Key insight of performance of the algorithm.
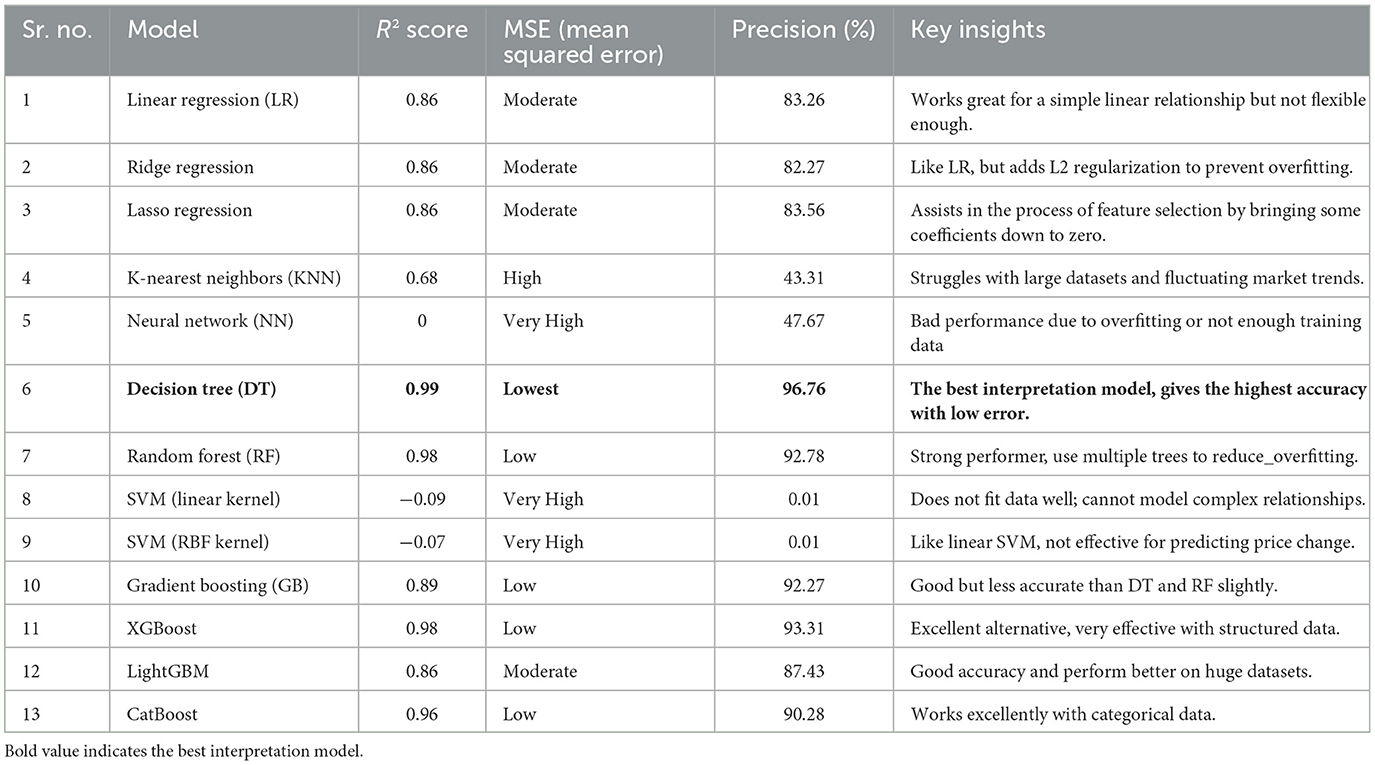
Table 5. Regression algorithm performance comparison.
Pricing predictions of the Aale crop using the three individual models include DT, RF, and XGBoost are presented in the Table 6 below. These were selected due to accuracy and reliability as compared to other models; the high R2 values and low MSE suggest this. What this table shows is how some models make similar prediction while others can make forecasts that are vastly different from one another which brings sense to the consistency of anticipated prices across models. The following table presents data regarding of the Aale crop and the estimated pricing, with regards to 2025. From our study, we find that the DT model yields the highest prediction accuracy of market price changes and helps farmers to make the right decisions about their activities with a view of earning the highest returns and minimizing the risks that are likely to be occasioned by fluctuations in prices of their produce. Because of these benefits, the DT technique is undoubtedly the superior method of determining which months are ideal for reaping agricultural produce. Future decisions in the field of agriculture can also draw substantial advantage from the, on the one hand, simple and on the other hand, clearly comprehensible of DT. Based on the DT algorithm that has captured the relations between the agricultural items, the months and the price, farmers will be in a position to increase their revenues.
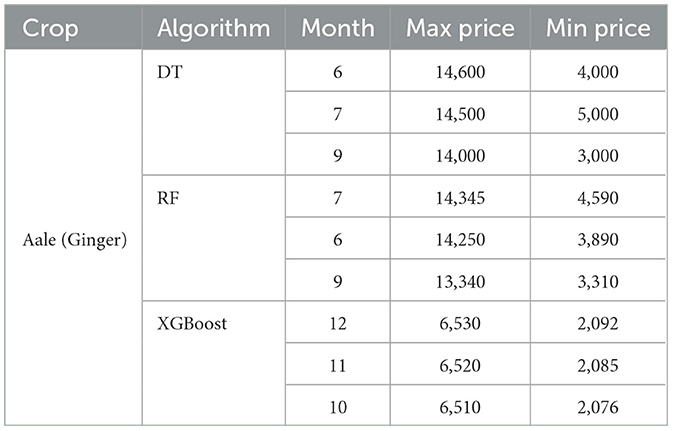
Table 6. Price predictions for Aale using three models.
Three parameters of DT model were obtained from the history data of the banking system, in particular, from the realistic values of the main factors of the system. To make the model understand characteristics of the input, we applied one-hot encoding for categorical variables. Incorporating months, years and agricultural goods among other attributes in our DT model, we are able to consider them in a meaningful way. Through these factors, one can determine times of the day or year that is appropriate for harvesting crops since these are clear indicators. After engaging the DT regressor training with encoded data phenomenon, the identified machine gave the lowest and maximum prices in elements of agriculture for distinct months. Furthermore, instead of training solely the DT regressor to predict the prices, an easy-to-use interface has been developed for better adoption by farmers.When farmers use this interface, they have to provide three parameters: the type of agricultural commodity, the year they want predictions for, and the number of months they would like to see projections for. Based on the trained machine learning model and backend processing, the interface easily delivers forecasts for the top months with the highest projected pricing for the selected agricultural product and year. The interface also provides farmers with a wealth of information, such as projected maximum and minimum prices for each month. The interface's user-friendly features and layout are depicted in Figure 6.
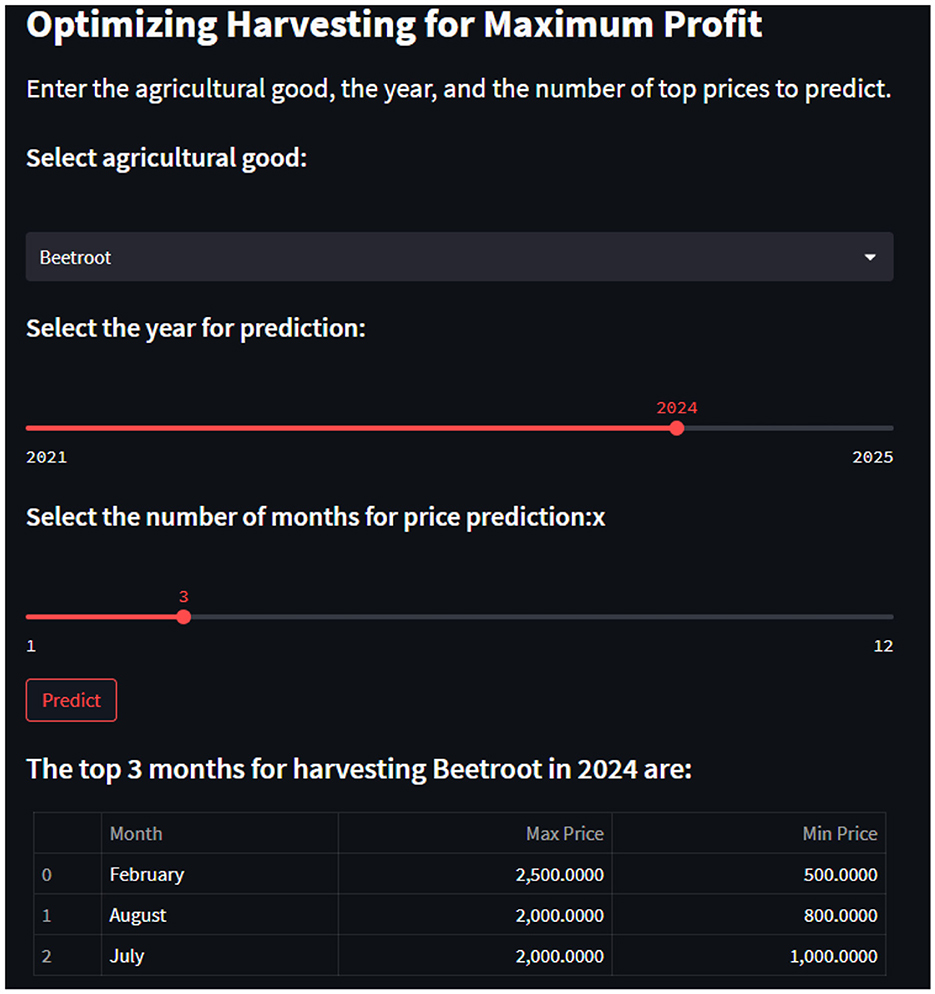
Figure 6. User-friendly interface for agricultural yield prediction.
We created a web application to make this research easily accessible to users. Figure 6 illustrates the user-friendly interface for Agricultural Yield Prediction, where the user can select the crop name, the desired year for prediction, and the number of top months to determine the maximum price. Once the user has entered all required details and clicks the “Predict” button, as shown in the Figure 6, our model processes the input and provides the results on the screen. The output includes a title that indicates the top months for the selected crop and the specified year for which the prices are being predicted. Also we have added “Trend” button which will show trending of item for the selected Year as shown Figure 7. This web application facilitates the use of the prediction model, offering real-time results to help maximize profit.
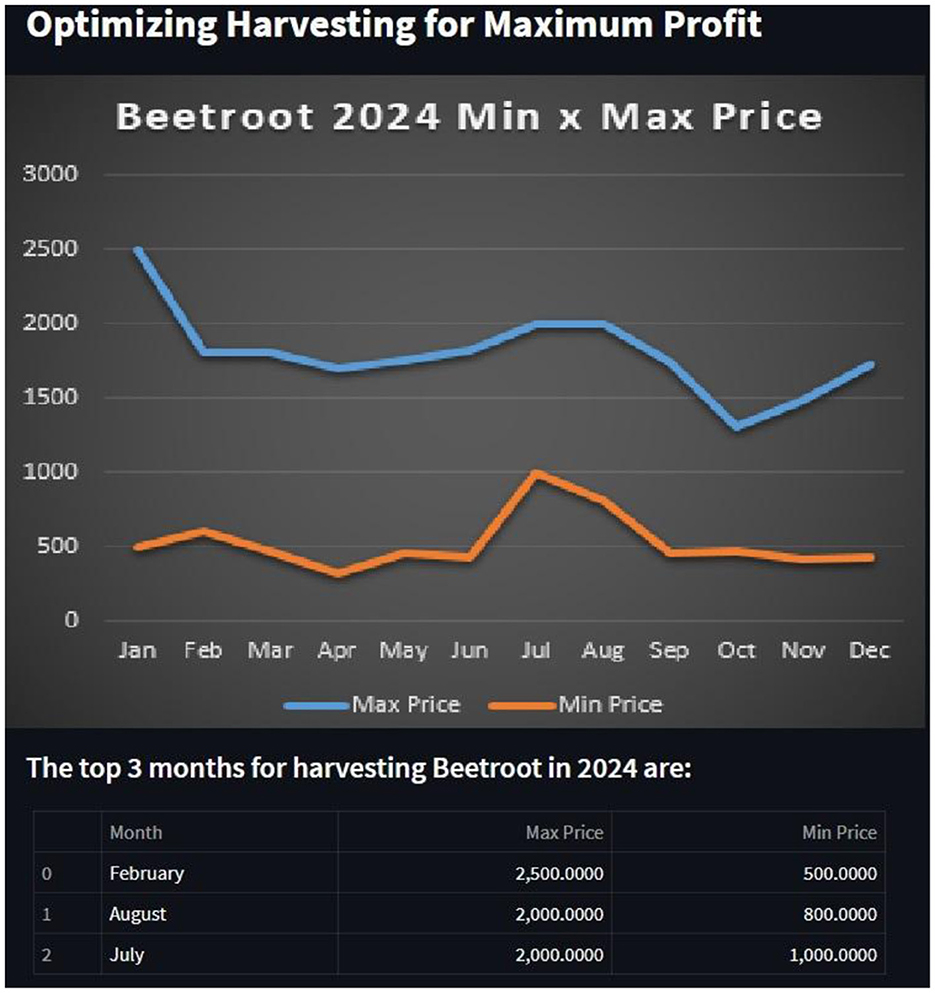
Figure 7. Trends of beetroot for year 2024.
The actual and projected costs for beetroot in February 2024 are contrasted in Table 7. The actual prices were  2,600 for the maximum and 1,000 for the minimum,1 although the model had predicted a maximum price of 2,500 and a minimum price of 500. The difference between expected and actual pricing shows the performance and validation of Model.
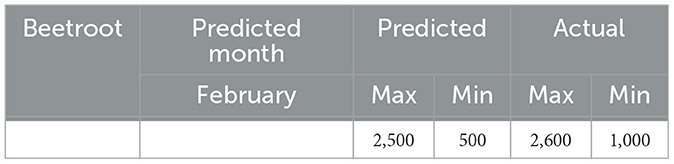
Table 7. Comparison of actual price and predicted price for beetroot.
4.2 Limitation
In spite of the promising results and potential use of our predictive model, several limitations need to be recognized:
• Data Quality and Availability: The accuracy of the model depends heavily on the availability and reliability of agricultural and market data. In most parts of the world, and especially in developing countries, reliable and granular datasets on crop yields, climate, soil health, and real-time market prices are sparse or missing directly.
• Strong Volatility: All agricultural markets are susceptible to sudden changes because of a lot of external factors including but not limited to policy change, foreign trade movement, or an unanticipated climate change event. These sudden changes in the market are difficult to predict and can lead to the model's predictions losing their potency.
• Location Dependency: The model has been trained on location-specific data, thus may not generalize to other locations unless re-trained and customized.
• Idealized Assumptions: There were a series of simplistically idealized assumptions made such as constant pest control, constant irrigation availability and constant labor costs along with many others to improve the interpretability of the model and the computational efficiency.
• Temporal Scope: The model is designed for short- to medium-term predictions. The current version of the model does not fully integrate long-term climate change trends and cumulative effects on agriculture.
5 Future scope
In future project aims to implement a hybrid ML model which incorporates benefits of various ML algorithms to improve accuracy and reliability in terms of predicting price of different crops. Although this work was centered on assessing existing models, future work will look to use staked and blended models to capitalize on Decision Trees (DT) which is interpretable, with XGBoost which has better accuracy, or use other ensemble methods for improved prediction accuracy. However, this improvement could potentially render the prediction system more resilient and widely applicable, thereby minimizing errors and expanding its usability for various crops and market conditions. Moreover, the integration of real-time market data, weather conditions, and soil quality parameters into the system will contribute to enhancing price predication and harvesting prescriptions. The predictive analytics platform will also upgrade to a wider decision-support system, driving insights for farmers about which crops they should choose and when and how to apply fertilizers and water to create the highest productivity with the best sustainability for the water system.
Making the system accessible to as many users as possible will be accomplished by allowing for multiple languages to be used and by supporting offline use of the system (many farmers will not have access to the internet in remote parts of the country). More features will be added to the software that enable climate-resilient agriculture and precision farming techniques while prioritizing environmental sustainability. This growth can lead to the development of a larger platform that can support supply chain transparency using blockchain technology, providing farmers with a better market price and access to the markets. The system will be encouraged to be aligned with national and global agricultural sustainability goals in collaboration with agricultural policymakers, industry experts, and research institutions.
This research aims to overcome the limitations of pattern-based machine learning models and proposes a scalable, intelligent, and farmer-centric solution that improves agricultural profitability and sustainability by incorporating these recent advancements.
6 Conclusion
By fusing state-of-the-art machine learning and predictive analytics tools, this study seeks to revolutionize farming practices. We have developed a novel approach to agricultural output optimization by utilizing recognized theories of data-driven decision-making and predictive modeling. We have meticulously created and executed intricate algorithms, including DT, LR, and RF, among others. With an amazing R2 value of 99% and a precision of 96%, the DT model was determined to be the most accurate, proving its reliability in predicting the ideal times to harvest various crops. The capacity of DT and RF to handle non-linear connections, efficiently identify important features, use ensemble approaches (for RF), and handle missing data is responsible for their high R2 ratings. Furthermore, a major factor in the models' effectiveness was the excellent dataset from the Krushi Utpanna Bazar Samiti in Haveli Pune, which included seasonal trends and comprehensive historical price data. Additionally, creating an interface for online applications that is easy to use. This web tool offers farmers a smooth way to enter important information for forecasting. Farmers are able to make well-informed decisions that optimize profitability while avoiding resource waste by using this interface to quickly obtain and analyze the predictions produced by the DT model. Our research findings are made more accessible and guaranteed to have real-world agricultural applications thanks to the combination of modern analytics and user-centric design. In the future, studies might concentrate on broadening the predictive model's application to include other variables including market movements, soil types, and weather patterns. This would improve the model's predicted accuracy and resilience.
Data availability statement
The raw data supporting the conclusions of this article will be made available by the authors, without undue reservation.
Author contributions
NS: Writing – original draft, Writing – review & editing. VS: Writing – original draft, Writing – review & editing. PM: Writing – original draft, Writing – review & editing. VK: Writing – review & editing.
Funding
The author(s) declare that no financial support was received for the research and/or publication of this article.
Conflict of interest
The authors declare that the research was conducted in the absence of any commercial or financial relationships that could be construed as a potential conflict of interest.
Generative AI statement
The author(s) declare that Gen AI was used in the creation of this manuscript. We declare that the following Artificial Intelligence (AI) technologies and AI-assisted tools were employed in the preparation of this article: ChatGPT: Assisted in grammar checking, some content generation, and summarization.
Publisher's note
All claims expressed in this article are solely those of the authors and do not necessarily represent those of their affiliated organizations, or those of the publisher, the editors and the reviewers. Any product that may be evaluated in this article, or claim that may be made by its manufacturer, is not guaranteed or endorsed by the publisher.
Footnotes
References
Abewickrama, G. (2022). Analyzing and Predicting the Market Price of Fruits and Vegetables (Doctoral dissertation). University of Westminster.
Agarwal, R., and Sagar, P. (2019). A comparative study of supervised machine learning algorithms for fruit prediction. J. Web Dev. Web Desig. 4, 14–18. doi: 10.5281/zenodo.2621205
Ali Abd Al-Hameed, K. (2022). Spearman's correlation coefficient in statistical analysis. Int. J. Nonlin. Analy. Appl. 13, 3249–3255. doi: 10.22075/ijnaa.2022.6079
Ali, J., Kachroo, J., Bhat, D. J., and Bhat, A. (2018). Analysis of prices and arrivals of apple fruit in Narwal market of Jammu. Econ. Affairs 63, 107–111. doi: 10.30954/0424-2513.2018.00150.13
Alida, M., and Mustikasari, M. (2020). Rupiah exchange prediction of US dollar using linear, polynomial, and radial basis function kernel in support vector regression. Jurnal Online Informatika 5, 53–60. doi: 10.15575/join.v5i1.537
Anjom, F. K., Vougioukas, S. G., and Slaughter, D. C. (2018). Development of a linear mixed model to predict the picking time in strawberry harvesting processes. Biosyst. Eng. 166, 76–89. doi: 10.1016/j.biosystemseng.2017.10.006
Bali, N., and Singla, A. (2021). Deep learning based wheat crop yield prediction model in Punjab region of North India. Appl. Artif. Intellig. 35, 1304–1328. doi: 10.1080/08839514.2021.1976091
Benesty, J., Chen, J., Huang, Y., and Cohen, I. (2009). “Pearson correlation coefficient,” in Noise Reduction in Speech Processing. Springer Topics in Signal Processing (Berlin: Springer).
Botchkarev, A. (2019). A new typology design of performance metrics to measure errors in machine learning regression algorithms. Interdiscipl. J. Inform. Knowl. Manage. 14, 045–076. doi: 10.28945/4184
Buribayev, Z., Joldasbayev, S., Yerkosova, A., and Zhassuzak, M. (2021). “Building a system for predicting the yield of grain crops based on machine learning using the XGBRegressor algorithm,” in 2021 IEEE International Conference on Smart Information Systems and Technologies (SIST) (Nur-Sultan: IEEE), 1–5.
Cheruku, J. K., and Katekar, V. (2023). Digitalisation of Agriculture in India: The Case for Doubling Farmers' Income.
Chicco, D., Warrens, M. J., and Jurman, G. (2021). (2021). The coefficient of determination R-squared is more informative than SMAPE, MAE, MAPE, MSE and RMSE in regression analysis evaluation. PeerJ. Comp. Sci. 7:e623. doi: 10.7717/peerj-cs.623
Deepa, S., Alli, A., and Gokila, S. (2023). Machine learning regression model for material synthesis prices prediction in agriculture. Mater. Today: Proc. 81, 989–993. doi: 10.1016/j.matpr.2021.04.327
Dharavath, R., and Khosla, E. (2019). “Seasonal ARIMA to forecast fruits and vegetable agricultural prices,” in 2019 IEEE International Symposium on Smart Electronic Systems (iSES) (Formerly iNiS) (Rourkela: IEEE), 47–52.
Elavarasan, D., and Vincent, P. D. (2020). Crop yield prediction using deep reinforcement learning model for sustainable agrarian applications. IEEE Access 8, 86886–86901. doi: 10.1109/ACCESS.2020.2992480
Eppert, M., Fent, P., and Neumann, T. (2021). “A tailored regression for learned indexes: logarithmic error regression,” in Fourth Workshop in Exploiting AI Techniques for Data Management (aiDM '21), Virtual Event. China 2021, 9–15.
Gómez, D., Salvador, P., Sanz, J., and Casanova, J. L. (2019). Potato yield prediction using machine learning techniques and sentinel 2 data. Remote Sens. 11:1745. doi: 10.3390/rs11151745
Gümüşçü, A., Tenekeci, M. E., and Bilgili, A. V. (2020). Estimation of wheat planting date using machine learning algorithms based on available climate data. Sustain. Comp.: Inform. Syst. 28:100308. doi: 10.1016/j.suscom.2019.01.010
Hasan, M. M., Zahara, M. T., Sykot, M. M., Hafiz, R., and Saifuzzaman, M. (2020). “Solving onion market instability by forecasting onion price using machine learning approach,” in 2020 International Conference on Computational Performance Evaluation (ComPE) (Shillong: IEEE), 777–780.
Kaewchada, S., Ruang-On, S., Kuhapong, U., and Songsri-in, K. (2023). Random forest model for forecasting vegetable prices: a case study in Nakhon Si Thammarat Province, Thailand. Int. J. Elect. Comp. Eng. (IJECE) 13, 5265–5272. doi: 10.11591/ijece.v13i5.pp5265-5272
Kumari, K., and Yadav, S. (2018). Linear regression analysis study. J. Pract. Cardiovasc. Sci. 4, 33–6. doi: 10.4103/jpcs.jpcs_8_18
Kumari, P., Goswami, V. N., Harshith, N., and Pundir, R. S. (2023). Recurrent neural network architecture for forecasting banana prices in Gujarat, India. PLoS One 18:e0275702. doi: 10.1371/journal.pone.0275702
Liu, S. C., Jian, Q. Y., Wen, H. Y., and Chung, C. H. (2022). A crop harvest time prediction model for better sustainability, integrating feature selection and artificial intelligence methods. Sustainability 14:14101. doi: 10.3390/su142114101
Luo, H., Cheng, F., Yu, H., and Yi, Y. (2021). SDTR: Soft decision tree regressor for tabular data. IEEE Access 9, 55999–56011. doi: 10.1109/ACCESS.2021.3070575
Luo, H., and Liu, Y. (2017). “A prediction method based on improved ridge regression,” in 2017 8th IEEE International Conference on Software Engineering and Service Science (ICSESS) (Beijing: IEEE), 596–599.
Ma, X., Tong, J., Huang, W., and Lin, H. (2023). Characteristic mango price forecasting using combined deep-learning optimization model. PLoS ONE 18:e0283584. doi: 10.1371/journal.pone.0283584
Meshram, V., Patil, K., Meshram, V., Hanchate, D., and Ramkteke, S. D. (2021). Machine learning in agriculture domain: A state-of-art survey. Artif. Intellig. Life Sci. 1:100010. doi: 10.1016/j.ailsci.2021.100010
Nassar, L., Okwuchi, I. E., Saad, M., Karray, F., and Ponnambalam, K. (2020). “Deep learning based approach for fresh produce market price prediction,” in 2020 International Joint Conference on Neural Networks (IJCNN) (Glasgow: IEEE), 1–7.
Ocampo, T., Gonzales, H., and Reyes, L. (2024). Examining the Adaptation of Agriculture to Climate Change in Africa, 639–653. Available online at: https://fusionproceedings.com/fmr/1/article/view/73 (accessed April 21, 2025).
Paul, R. K., and Garai, S. (2021). Performance comparison of wavelets-based machine learning technique for forecasting agricultural commodity prices. Soft Comp. 25, 12857–12873. doi: 10.1007/s00500-021-06087-4
Paul, R. K., Yeasin, M., Kumar, P., Kumar, P., Balasubramanian, M., et al. (2022). Machine learning techniques for forecasting agricultural prices: A case of brinjal in Odisha, India. PLoS ONE 17:e0270553. doi: 10.1371/journal.pone.0270553
Peng, Y. H., Hsu, C. S., and Huang, P. C. (2015). “Developing crop price forecasting service using open data from Taiwan markets,” in 2015 Conference on Technologies and Applications of Artificial Intelligence (TAAI) (Tainan: IEEE), 172–175.
Ranaweera, H. M. B. P., Rathnayake, R. M. G. H. N., and Ananda, A. S. G. J. K. (2023). Crop price prediction using machine learning approaches: reference to the Sri Lankan vegetable market. J. Manage. Matters 10, 19–34. doi: 10.4038/jmm.v10i1.45
Rathod, S., Chitikela, G., Bandumula, N., Ondrasek, G., Ravichandran, S., Sundaram, R. M., et al. (2022). Modeling and forecasting of rice prices in India during the COVID-19 lockdown using machine learning approaches. Agronomy 12:2133. doi: 10.3390/agronomy12092133
Ridzuan, F., and Zainon, W. M. N. W. (2019). A review on data cleansing methods for big data. Procedia Comp. Sci. 161, 731–738. doi: 10.1016/j.procs.2019.11.177
Sable, N. P., Patil, R. V., Deore, M., Bhimanpallewar, R., and Mahalle, P. N. (2024). (2024). Machine learning based agricultural profitability recommendation systems: a paradigm shift in crop cultivation. Int. J. Interact. Multimed. Artif. Intellig. 9, 39–54. doi: 10.9781/ijimai.2024.10.005
Sabu, K. M., and Kumar, T. M. (2020). Predictive analytics in Agriculture: Forecasting prices of Arecanuts in Kerala. Procedia Comp. Sci. 171, 699–708. doi: 10.1016/j.procs.2020.04.076
Sarker, R., and Chan, B. (2021). Price transmission in canadian fresh fruit market: a time series analysis. Int. J. Food Agricult. Econ. (IJFAEC) 9, 175–189. doi: 10.22004/ag.econ.313363
Vibas, V. M., and Raqueño, A. R. (2019). A mathematical model for estimating retail price movements of basic fruit and vegetable commodities using time series analysis. Int. J. Adv. Study Res. Work 2, 2581–5997. doi: 10.5281/zenodo.3333529
Xu, H., Caramanis, C., and Mannor, S. (2010). Robust regression and lasso. IEEE Trans. Inform. Theory 56, 3561–3574. doi: 10.1109/TIT.2010.2048503
Keywords: predictive analytics, machine learning, agricultural yield optimization, market dynamics, profitability analysis
Citation: Sable NP, Shukla VK, Mahalle PN and Khedkar V (2025) Optimizing agricultural yield: a predictive model for profitable crop harvesting based on market dynamics. Front. Comput. Sci. 7:1567333. doi: 10.3389/fcomp.2025.1567333
Received: 27 January 2025; Accepted: 20 May 2025;
Published: 19 June 2025.
Edited by:
Maheswar Rajagopal, KPR Institute of Engineering and Technology, Coimbatore, IndiaReviewed by:
Rajeev Ratna Vallabhuni, Bayview Asset Management, LLC, United StatesMohamed Omar Abdullahi, SIMAD University, Somalia
Copyright © 2025 Sable, Shukla, Mahalle and Khedkar. This is an open-access article distributed under the terms of the Creative Commons Attribution License (CC BY). The use, distribution or reproduction in other forums is permitted, provided the original author(s) and the copyright owner(s) are credited and that the original publication in this journal is cited, in accordance with accepted academic practice. No use, distribution or reproduction is permitted which does not comply with these terms.
*Correspondence: Nilesh P. Sable, ZHJzYWJsZW5pbGVzaEBnbWFpbC5jb20=