 Hugo Vega-Huerta1
 Javier Vilca Velasquez1Nicolas Anicama Espinoza1
 Gisella Luisa Elena Maquen-Niño2*Luis Guerra-Grados1Jorge Pantoja-Collantes1Oscar Benito-Pacheco1
 Juan Carlos Lázaro-Guillermo3Adegundo Camara-Figueroa1Javier Cabrera-Díaz1Rubén Gil-Calvo1Frida López-Córdova1
- 1Universidad Nacional Mayor de San Marcos (UNMSM), Lima, Peru
- 2Universidad Nacional Pedro Ruiz Gallo, Lambayeque, Peru
- 3Universidad Nacional Intercultural de la Amazonia (UNIA), Ucayali, Peru
Metropolitan Lima faces a serious citizen security situation, reflected in high rates of crime and violence in several districts. The development of a mobile application to identify and predict areas of high crime incidence is proposed. Using historical data of criminal incidents and reports registered by users in the application, models capable of predicting the occurrence of crimes in real time are trained. The data mining process follows the KDD methodology, which includes the stages of selection, preprocessing, transformation, data mining, evaluation and knowledge consolidation. Machine learning algorithms, such as Random Forest and Gradient Boosting, were used to make these predictions. Visualization techniques, such as heat maps, were also used to represent crime events and facilitate their understanding by users. The results show an accuracy of 88% for the Random Forest algorithm and 91% for Gradient Boosting in predicting the occurrence of crimes, which demonstrates the effectiveness of machine learning models to improve citizen security in Metropolitan Lima, therefore these findings have significant implications for crime prevention and suggest that the application of these technologies can be fundamental to address security challenges in the city.
1 Introduction
Artificial intelligence (AI) has significantly transformed the development of computer systems by enabling them to perform tasks that traditionally required human intelligence. Through machine learning algorithms, natural language processing, and predictive analytics (Moquillaza-Henríquez et al., 2025; Vega-Huerta et al., 2025a). AI enhances system capabilities in areas such as automation, decision-making, and data analysis (López-Córdova et al., 2025; Vega-Huerta et al., 2025b,c,d). This integration allows computer systems to learn from data, adapt to new inputs, and operate more efficiently and autonomously.
Urban crime is one of the major concerns in modern cities. Metropolitan Lima constantly faces this challenge. Crimes, especially robberies and thefts, affect not only citizen safety but also the quality of life in various districts. In response to this problem, we propose developing a mobile application that uses the process of Knowledge Discovery in Databases (KDD) to identify and predict the areas with the highest incidence of crime within the aforementioned city. One of the focus areas in this study is the district of Jesús María, located in central Lima, Peru, known for its high population density and diverse urban infrastructure, making it a representative case for crime pattern analysis. According to Fayyad et al. (1996), KDD is an effective process for extracting useful knowledge from large volumes of data, which allows identifying patterns and generating accurate predictions.
The KDD process is composed of several stages, ranging from data collection to pattern extraction. This process allows researchers not only to understand current crime trends but also to predict future risk areas, in this context, large volumes of historical and real-time data will be analyzed, integrating variables such as crime frequency, geographic location and type of incident. Predictive analytics using data mining algorithms can identify complex relationships between data that help to anticipate crime incidents (Li et al., 2023). This tool will provide a clearer view of vulnerable areas, allowing authorities and citizens to anticipate the times and places of greatest danger. KDD process includes selection, preprocessing, transformation, data mining and evaluation of the results to generate knowledge.
In addition to its predictive capabilities, this application encourages the active participation of citizens, who will be able to report incidents and share relevant information in real time. This component of citizen participation is essential in the framework of smart cities, where technology is integrated with the collaboration of inhabitants to create safer and more efficient environments (Hollands, 2008).
The operation of a predictive system for data management and resource allocation (Tsushi and Ishihara, 2005), in which large volumes of information are centralized and processed through a server, enabling more informed and effective decision-making for public safety.
The KDD-based approach will not only be limited to prediction, but will also facilitate informed decision making, optimizing the allocation of resources to improve public safety. In addition, this system could be complemented with preventive measures, such as improving urban infrastructure and reinforcing police surveillance, creating a safer and more proactive environment for the inhabitants of Metropolitan Lima.
2 Background
Machine learning and deep learning models have been widely adopted for crime prediction due to their ability to identify complex patterns and correlations in large datasets. Several recent studies have confirmed the effectiveness of these models in both classification and forecasting tasks (Maquen-Niño et al., 2024; Vega-Huerta et al., 2024; Yauri et al., 2023). Cesar et al. highlight the importance of technology acceptance in the success of predictive and analytics systems (Cesar et al., 2023).
Zhang et al. used the XGBoost algorithm to forecast crime occurrence using historical and environmental data, incorporating SHAP (Shapley Additive Explanations) to interpret model decisions (Zhang et al., 2022). Yan et al. showed that XGBoost outperformed both AdaBoost and Random Forest in the classification of burglary data after multiple iterations. In our study, although we used Gradient Boosting instead of XGBoost, our results are consistent with theirs, demonstrating the reliability of boosting-based models in crime prediction (Yan et al., 2022).
Moreover, Pérez-Siguas et al. developed a Big Data-based application to predict criminal activity in Lima, integrating predictive models into a mobile interface to assist public safety authorities. Their work serves as a direct precedent to ours, but our proposal goes further by involving citizen interaction and real-time alerting functionalities (Perez-Siguas et al., 2022).
In terms of real-world deployment, Citizen is an example of a commercial application that alerts users of nearby crimes using 911 calls and user reports. Although our system does not rely on emergency service data, it uniquely integrates predictive mapping based on supervised machine learning and historical data to issue proactive alerts (Citizen, 2025).
Also noteworthy is the project Fogo Cruzado in Brazil, which uses citizen-reported data to map shootings and violent incidents in real time (Wired, 2017). While Fogo Cruzado focuses on real-time data collection and community-based alerts, our approach integrates supervised learning models trained on historical crime datasets to forecast high-risk zones in advance.
Using the PS-CS approach together with models such as Convolutional Neural Networks (CNNs), demonstrate that the accuracy in predicting crime rates is exceptionally high (99.87%) (Aziz et al., 2024). Similarly, other researches implemented machine learning algorithms such as Lasso regression, Random Forest, and Decision Trees to predict crime occurrence, and Random’s showed high performance with 83% accuracy (Saraiva et al., 2022). While these works emphasize model performance, they do not explore user interaction via mobile platforms as our system does.
AIST is an interpretable deep learning model that uses dynamic spatiotemporal features and attention mechanisms to predict crimes (Rayhan and Hashem, 2020). Their approach underscores the importance of spatial–temporal dynamics, which our system also considers by integrating geographic data (latitude/longitude) as key input variables, with our model achieving 89.5% spatial prediction accuracy.
A deep convolutional residual network was used to forecast real-time crime distributions in Los Angeles. Unlike our approach, which is focused on supervised learning with Gradient Boosting, their work emphasizes the use of deep neural networks and requires more complex computational infrastructure (Wang et al., 2017).
Spatiotemporal delay variables enhance prediction accuracy (Deng et al., 2023). Our findings align with this, as the spatial variable (latitude) was identified as the most relevant feature in our model. Moreover, while Deng et al. experimented with multiple algorithms, we found that Gradient Boosting provided optimal performance with an accuracy of 91% and an AUC of 0.96.
An unsupervised domain adaptation model (UDAC) was used to predict crime risk in cities without labeled data, using the knowledge of cities with abundant data, the results show that UDAC outperforms other methods in accuracy, managing to transfer knowledge effectively between cities (Zhou et al., 2023).
Finally, a research developed a citizen participation platform aimed at real-time public safety data collection (Guzman et al., 2021). Our mobile application shares this philosophy by allowing users to report incidents, validate reports, and receive alerts, reinforcing the idea that civic engagement and machine learning can be synergistically integrated to improve urban safety. The high satisfaction rate (4.8/5) and predictive accuracy (89.5%) observed in our pilot deployment in Lima highlight the practical relevance and user-centered design of our approach.
3 Materials and methods
This study employs the KDD approach to analyze and predict crime in Metropolitan Lima, following a well-defined process that includes data selection, preprocessing, transformation, data mining, evaluation, and knowledge presentation. The choice of the KDD method is due to its recognized effectiveness in extracting useful patterns and meaningful knowledge from large data sets (De-La-Cruz-Vdv et al., 2023; Fayyad et al., 1996). KDD is a comprehensive, multidisciplinary framework that integrates domain understanding, feature engineering, algorithmic selection, and visualization to systematically convert raw urban crime data into actionable intelligence (Saltos and Cocea, 2017).
The application of this approach starts with the careful selection of historical data and incident reports, followed by a structured and rigorous cleaning and preprocessing stage to remove noise, handle missing values, and normalize spatial–temporal variables. In the transformation stage, feature extraction and projection techniques are applied to construct informative variables—such as spatial clustering of incidents and temporal aggregation—that enhance model interpretability and predictive power. Subsequently, machine learning algorithms such as Random Forest and Gradient Boosting are applied to model and predict crime patterns, highlighting their ability to handle the complexity and heterogeneity of urban data (Breiman, 2001; Friedman, 2001). The iterative and evaluative nature of KDD ensures continuous refinement of models through feedback loops, enabling adaptation to evolving crime dynamics (Plotnikova et al., 2020).
3.1 Data selection
The dataset used in this study was obtained from the Instituto Nacional de Estadística e Informática (INEI) and includes detailed records of criminal incidents reported in Metropolitan Lima. The database spans a temporal range from January 2019 to December 2023, allowing the analysis of crime patterns over multiple years and seasonal variations. In total, 47,835 criminal events were recorded and analyzed (INEI, 2017).
Table 1 shows variables from the data set such as: X (Latitude), Y (Longitude), GENERICO (Type of crime), NAMEDP, NAMEPROV, NAMEDIST, and FECHA.
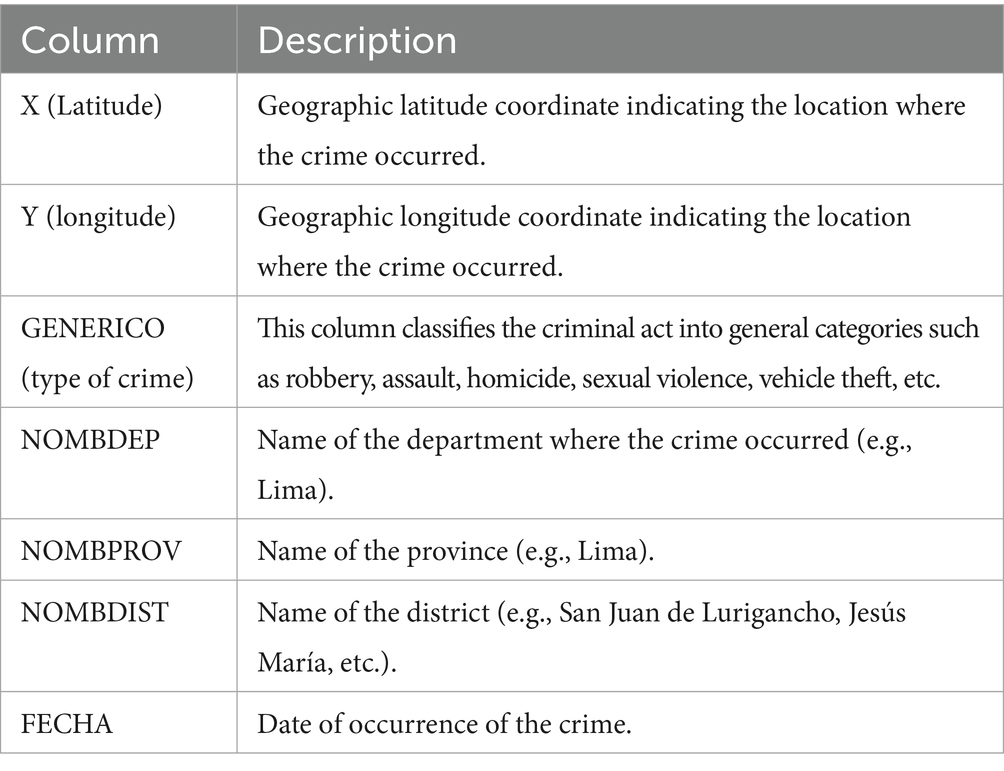
Table 1. List of columns of the data collected.
An example of a record would be:
• X: -12.0675
• Y: -77.0337
• GENERICO: Robbery
• NOMBDEP: Lima
• NOMBPROV: Lima
• NOMBDIST: Jesús María
• FECHA: 2022-07-15
This temporal and geospatial information was essential for generating realistic predictive models and for creating heatmaps that reflect the intensity of crime in specific locations and timeframes.
3.2 Preprocessing
At this stage we initially saw outliers in the latitude and longitude columns, which are of interest to us, this is represented on a map for the district of Jesus Maria and as shown in Figure 1, there are too many outliers, so we will use data about the coordinates of the polygon that forms this district and the same will be replicated for all districts.
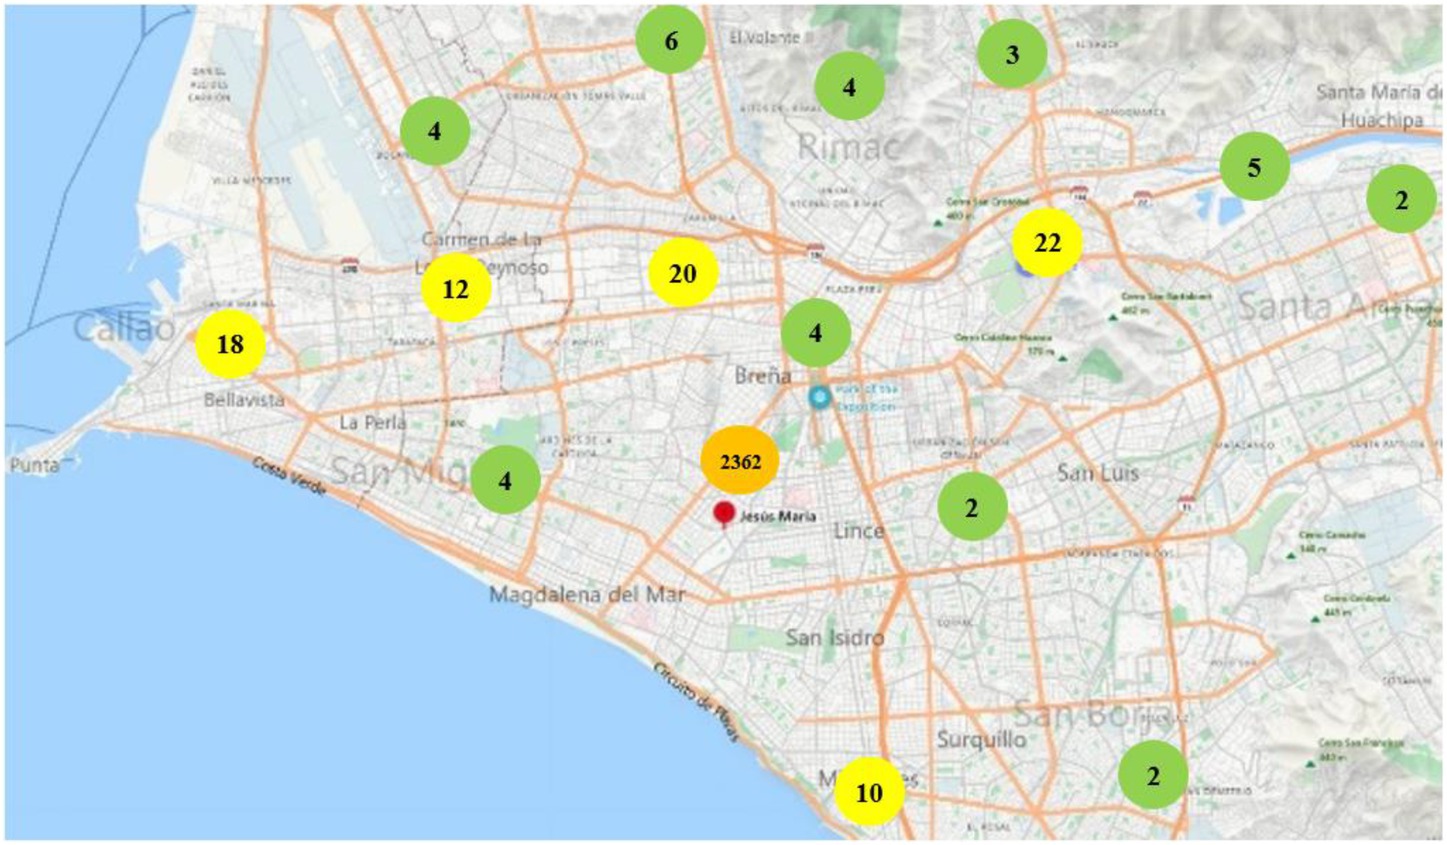
Figure 1. Map of crime hot spots. Map data ©2025 Google.
The cleaning of this column is done with the within geopand method, which verifies if each point in a list is within a specific area, as shown in Figure 2. Figure 3 is visualized in the map after going through this process.
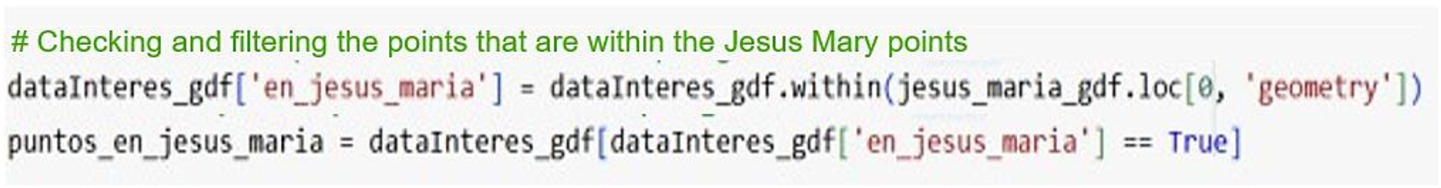
Figure 2. Map without outliers. Map data ©2025 Google.
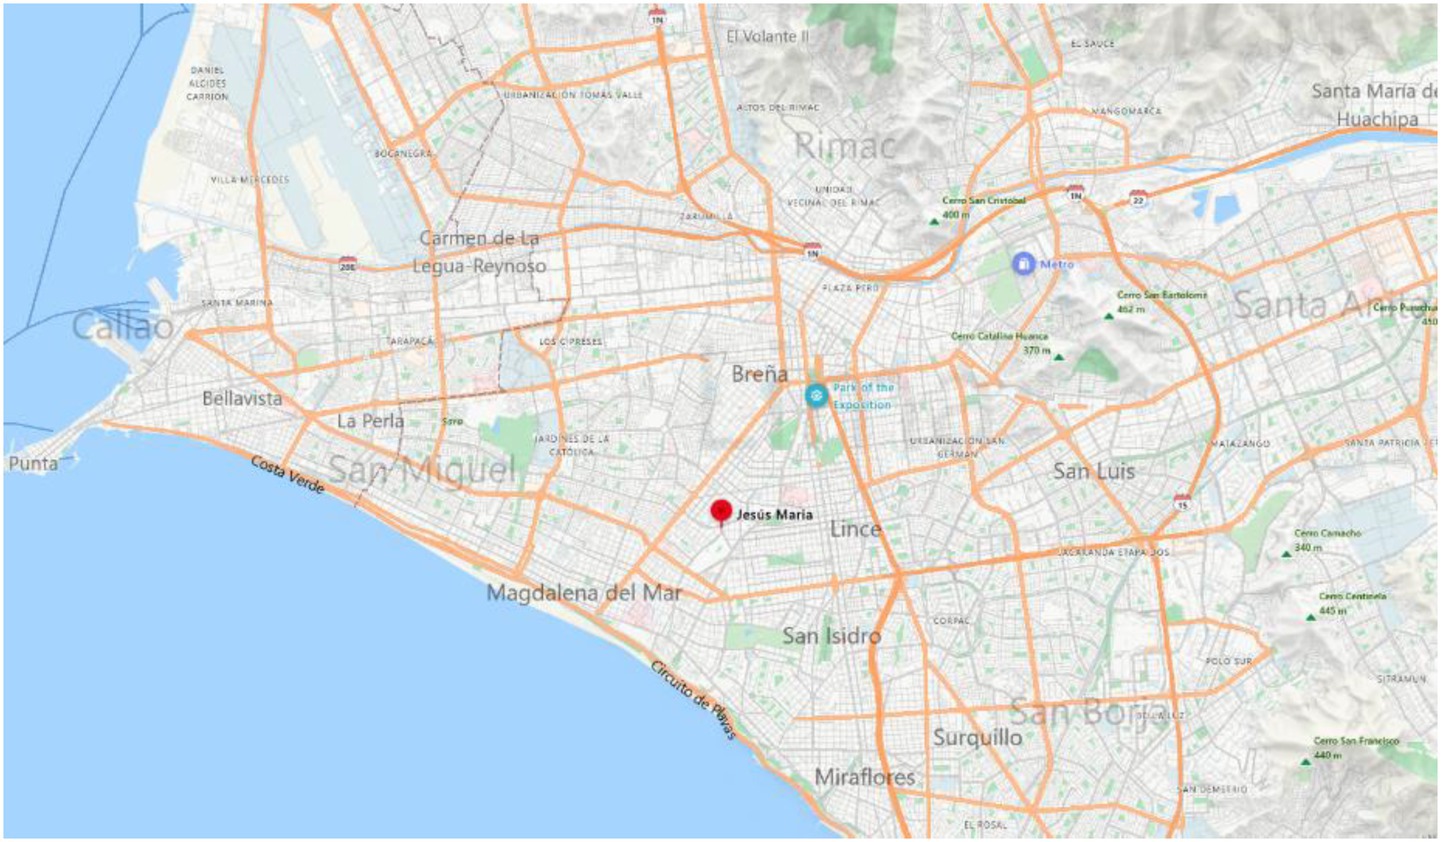
Figure 3. Map without outliers. Obtained of Google Map.
3.3 Transformation
In this phase, a new binary column was added to serve as the output variable for the classification models: “crime_occurred,” where a value of 1 indicates the presence of a reported crime, and 0 represents the absence of a crime.
Since the original dataset only contains positive instances (i.e., locations where crimes were reported), it was necessary to generate synthetic negative instances to allow supervised learning. For this purpose, a set of random geographic coordinates was generated within the boundaries of the studied districts. Each generated point was validated to ensure it did not overlap with any location already identified as a crime scene, thus avoiding duplication or label conflict. These randomly generated points were labeled as non-crime areas (crime_occurred = 0).
This method allows the creation of a balanced dataset suitable for training classification models that distinguish between areas with and without reported crimes.
3.4 Data mining
Machine learning algorithms, such as Random Forest and Gradient Boosting, are used to identify patterns in the historical data and make predictions about possible future crime hotspots.
Both Random Forest and Gradient Boosting algorithms were selected due to their proven effectiveness in classification tasks involving structured data with non-linear relationships. Random Forest is known for its robustness and resistance to overfitting by aggregating the predictions of multiple decision trees, while Gradient Boosting offers enhanced performance by sequentially correcting errors of prior models and optimizing prediction accuracy.
The hyperparameters used were chosen based on prior literature and initial experimentation, as shown in Table 2. A relatively small max_depth (3) was selected to avoid overfitting and to ensure generalization. The number of estimators (n_estimators = 200) provides a good trade-off between model stability and computational efficiency. The random_state = 42 ensures reproducibility of results. These settings were validated during cross-validation to confirm that they offered consistent performance across different data subsets.
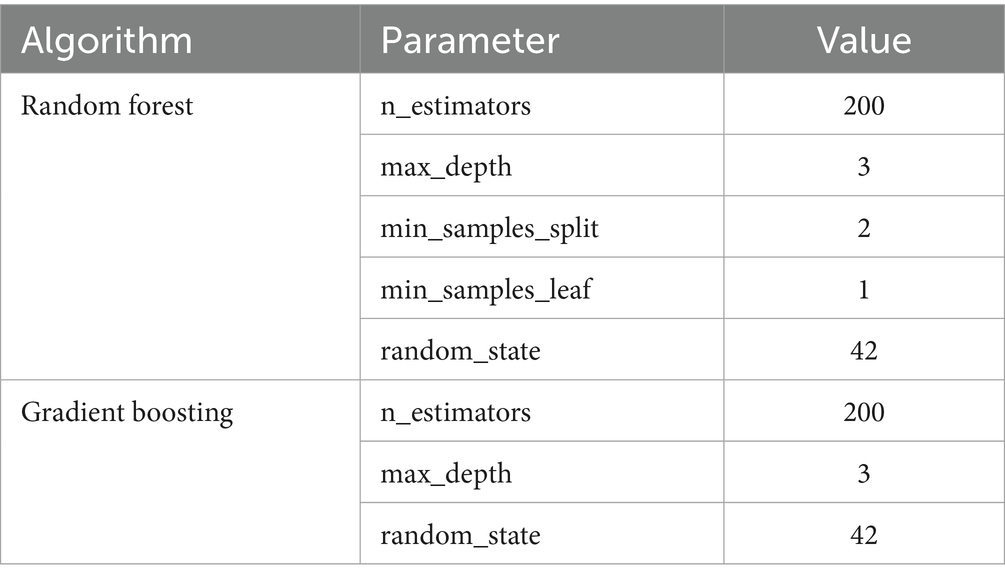
Table 2. Parameters configured for each machine learning model.
4 Results
In the results section, two processes will be described: first, the results obtained from the data mining process using the Gradient Boosting and Random Forest models; and second, the development of the mobile application that integrates the best-performing model to display results to end users.
It is important to clarify that the predictive modeling carried out in this study focuses on spatial prediction, identifying geographic areas with a higher probability of crime occurrence. The model outputs a classification based on spatial coordinates (latitude and longitude), without incorporating temporal features such as time of day or specific dates. Therefore, the system predicts where crimes are more likely to occur, but not when they will happen.
4.1 Data mining results
Figure 4 shows that the Gradient Boosting model outperformed Random Forest in all key metrics: Accuracy (0.91), AUC (0.96), F1 Score (0.89), and Recall (0.82), showing better overall performance and greater ability to detect crime cases. Although both models are adequate, Gradient Boosting is more reliable for predicting high crime areas.
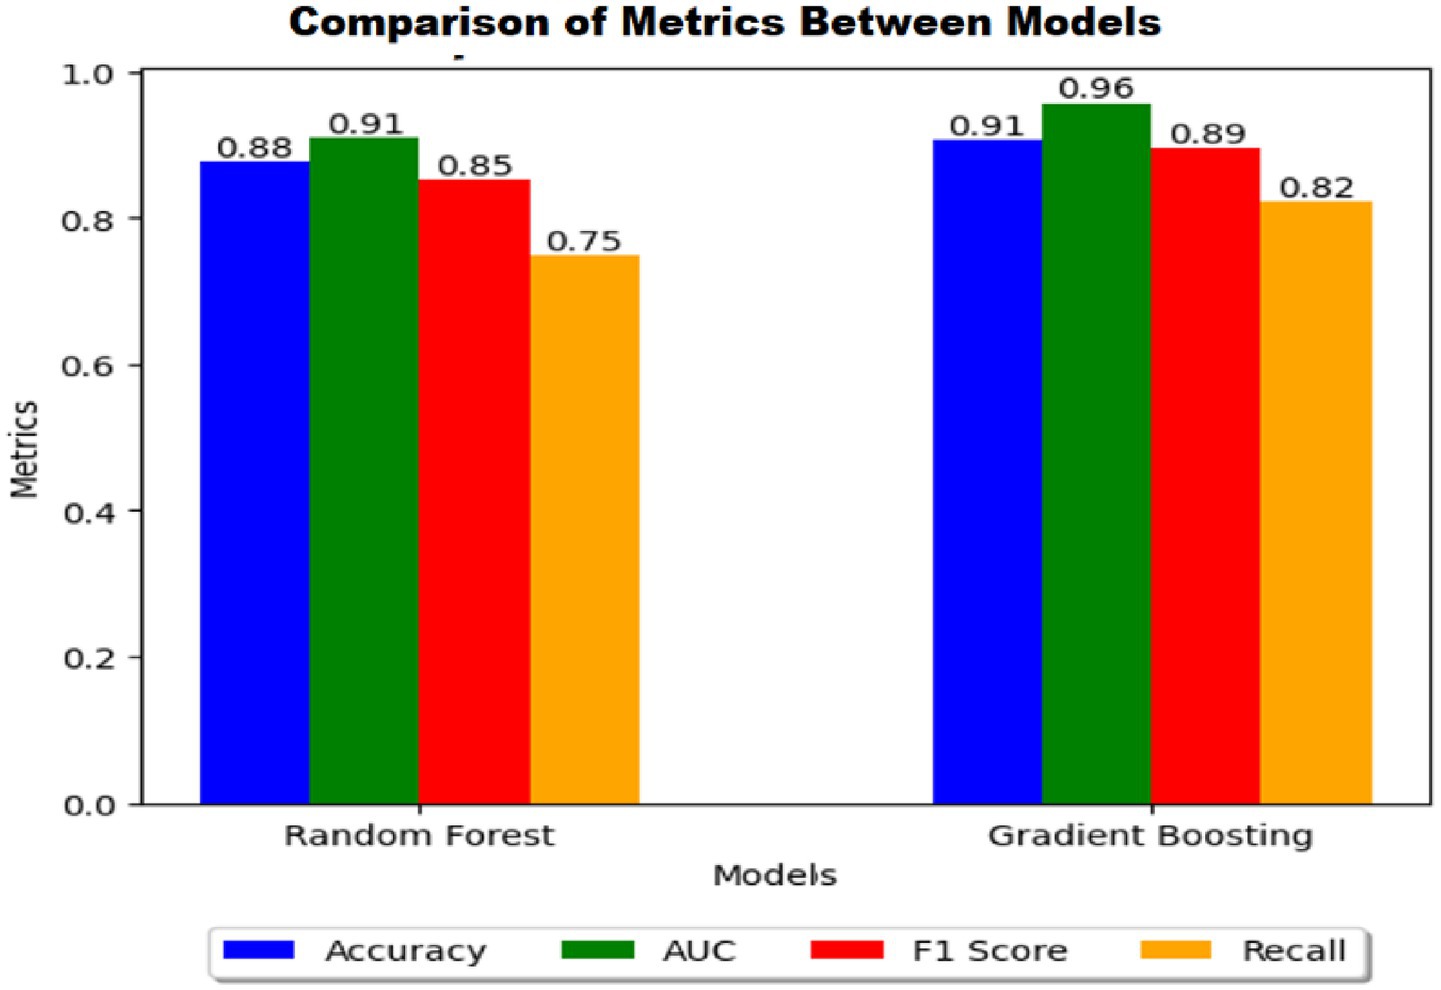
Figure 4. Model performance metrics.
The bar chart compares the performance metrics of two machine learning models: Random Forest and Gradient Boosting. Gradient Boosting outperforms Random Forest in all metrics. It achieves the highest values in AUC (0.96), Accuracy (0.91), and F1 Score (0.89), indicating a superior ability to distinguish between classes and maintain overall performance. Random Forest shows slightly lower performance, with AUC (0.91), Accuracy (0.88), and F1 Score (0.85). This suggests that while it is a strong model, it does not generalize as well as Gradient Boosting in this case. The most significant difference is observed in the Recall metric, Gradient Boosting achieves 0.82, whereas Random Forest scores 0.75, indicating that Gradient Boosting is better at identifying positive instances. Overall, Gradient Boosting appears to be the superior model in this comparison, providing better classification performance across all evaluated metrics.
4.2 Software development
In this section, we will see all the stages for the development of the software that will be developed for the mobile application.
4.2.1 Predictive model architecture
The identified risk patterns are integrated into the mobile app to provide alerts and predictive visualizations that contribute to citizen safety in Metropolitan Lima. This is shown in Figure 5 where the consolidation of knowledge is done by integrating the predictive model developed in the project with a Python Flask API (Application Programming Interface), allowing an efficient interaction between users and the predictive system, since this approach ensures that the model is accessible to external applications and encourages its practical use in real time.
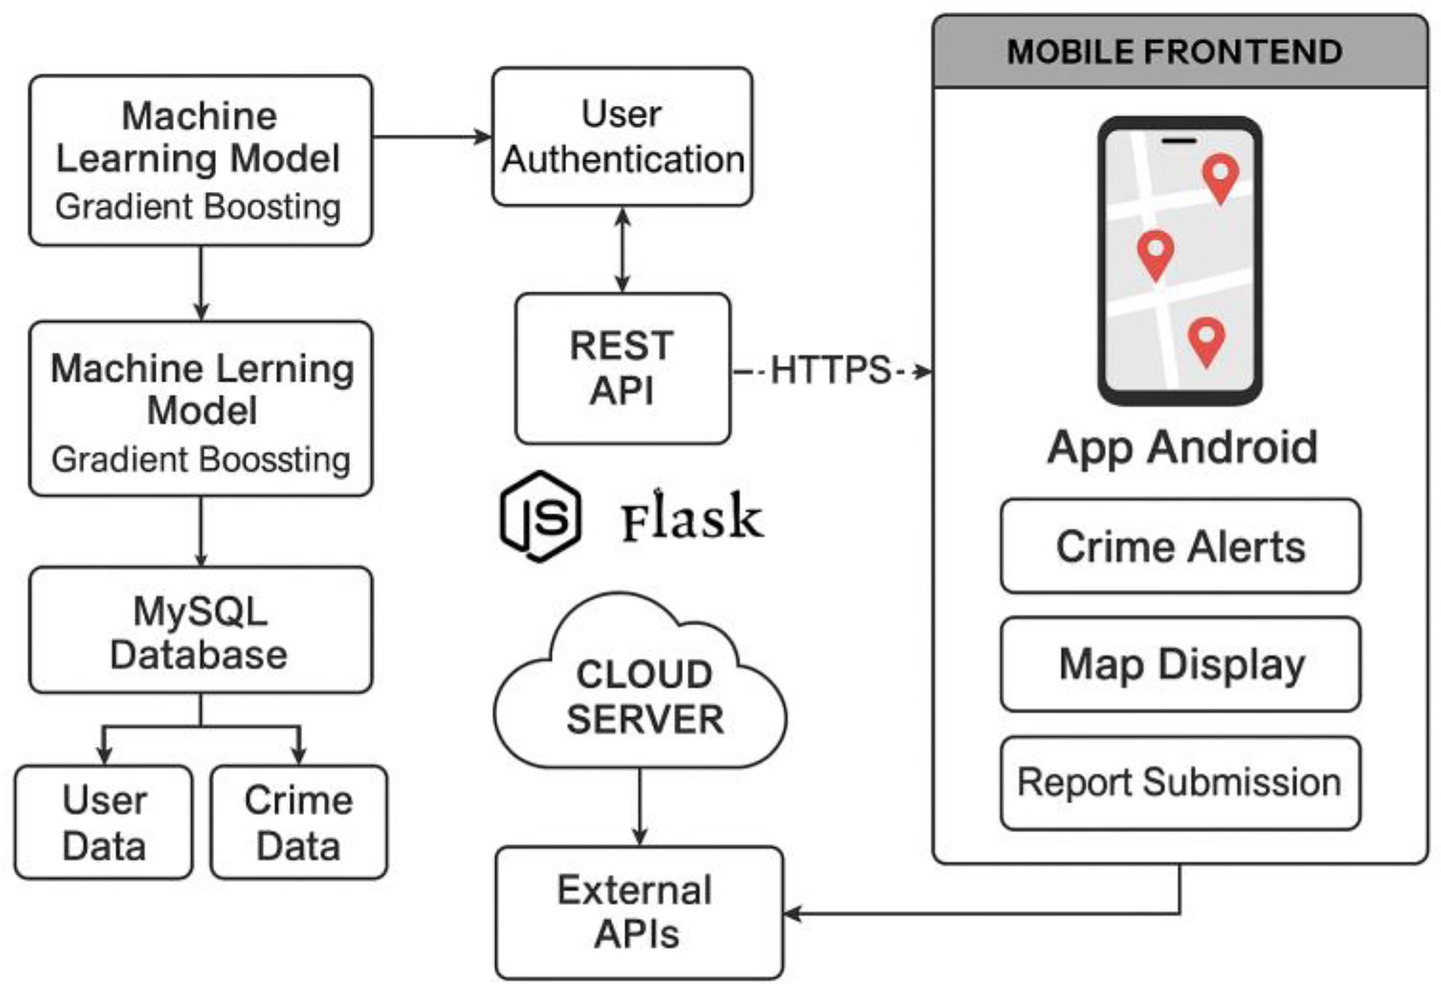
Figure 5. Architecture of the predictive model.
4.2.2 System use case diagrams
The project proposes a solution with multiple functionalities and two types of permissions. Figure 6 shows the use cases of the implemented system where it is possible to highlight the flows of login, register report, validate report, view statistics, generate alerts and visualize map.
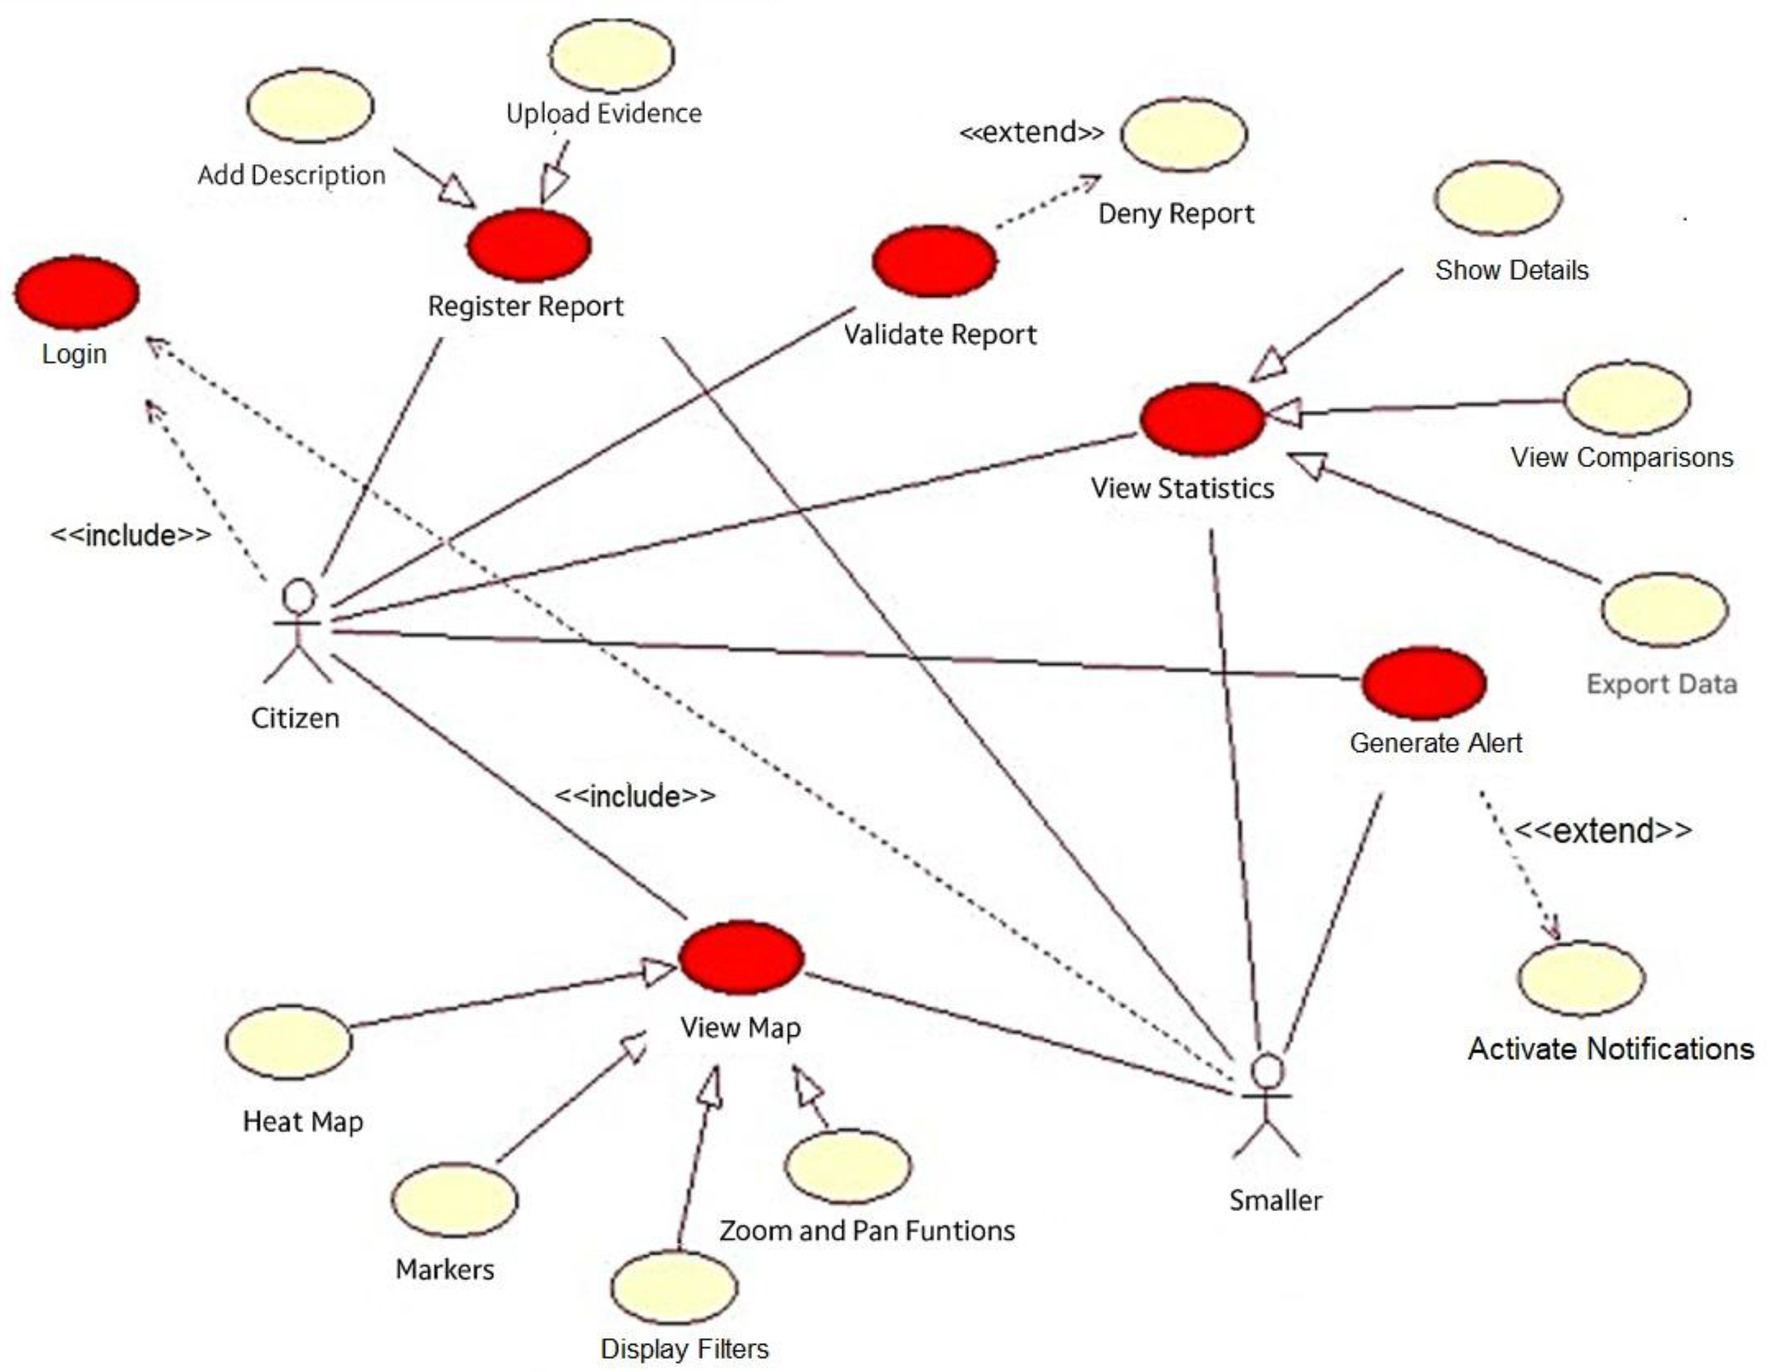
Figure 6. Prioritized CUS diagram.
4.2.3 System architecture
The technological architecture consists of four stages: (1) User Interface development using Kotlin; (2) Communication handled by Node.js, Postman, and Python; (3) Development environment based on Android Studio and Visual Studio Code; and (4) Data storage and management using MySQL Workbench.
The architecture uses Node.js, a JavaScript runtime environment, for communication with servers, Python for artificial intelligence algorithms and Postman for API development and testing.
Figure 7 shows the implementation model. In this architecture, the Android device acts as a client that interacts with a remote server. The system is divided into two main components: the mobile application and the backend server, which includes the database and the predictive model. Additionally, the mobile application integrates with external APIs to enable additional functionalities and remote data access.
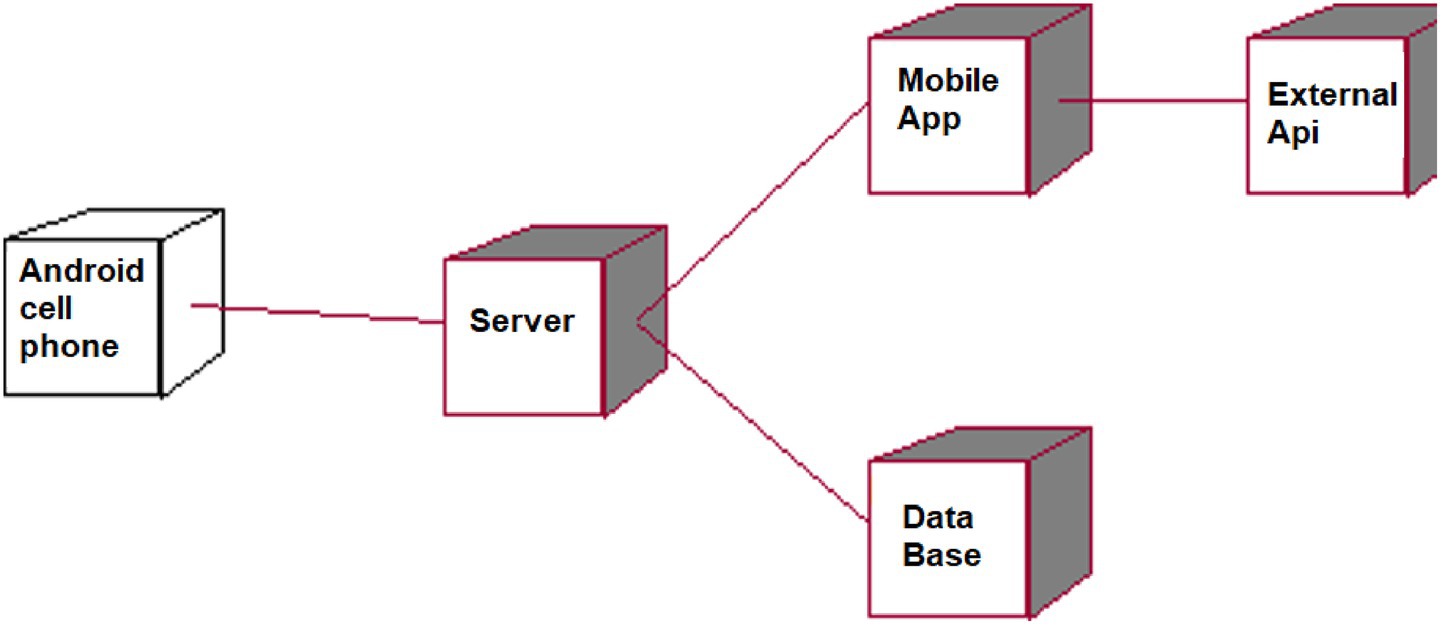
Figure 7. Deployment model.
4.2.4 User interfaces
Figure 8 presents the design of the start menu and the main screen of the mobile application, characterized by an intuitive and user-friendly interface. Its clear structure and simplified navigation elements optimize the user experience, facilitating the use of the different functionalities of the application.
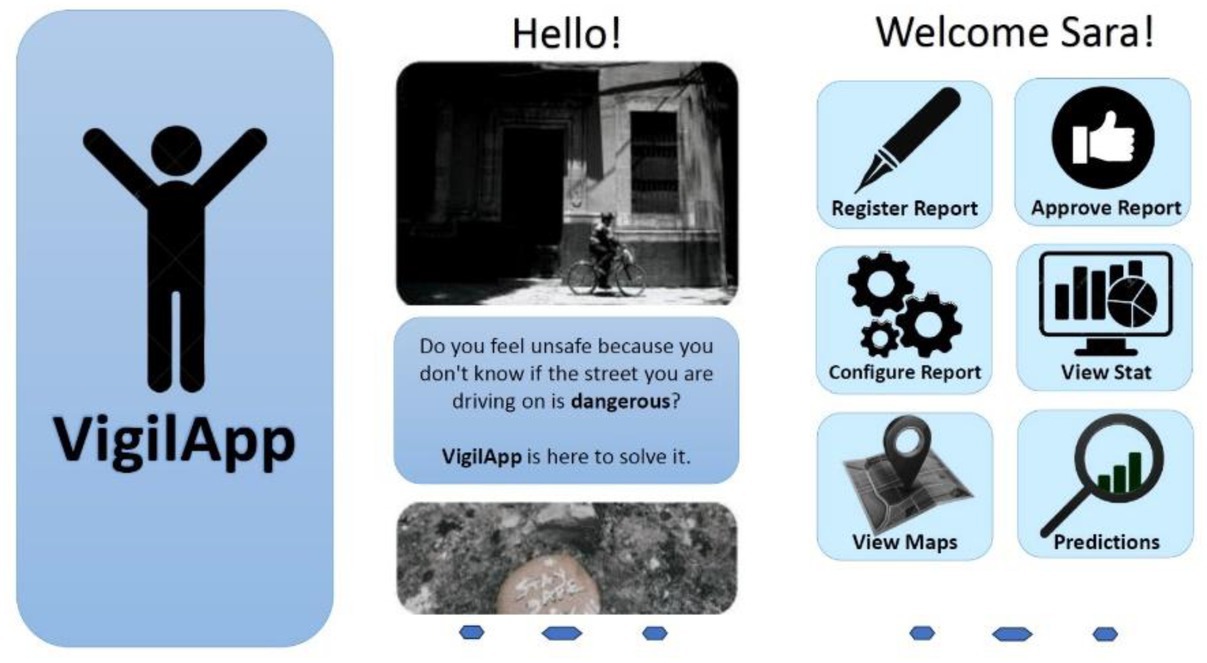
Figure 8. Main menu layout and startup.
On the other hand, Figure 9 highlights the “View Map” function, which has been strategically organized to allow users to visualize and analyze the geographic distribution of criminal incidents. The integration of tools such as zoom and interactive markers enhances the exploration of the map, providing specific details about each recorded location.
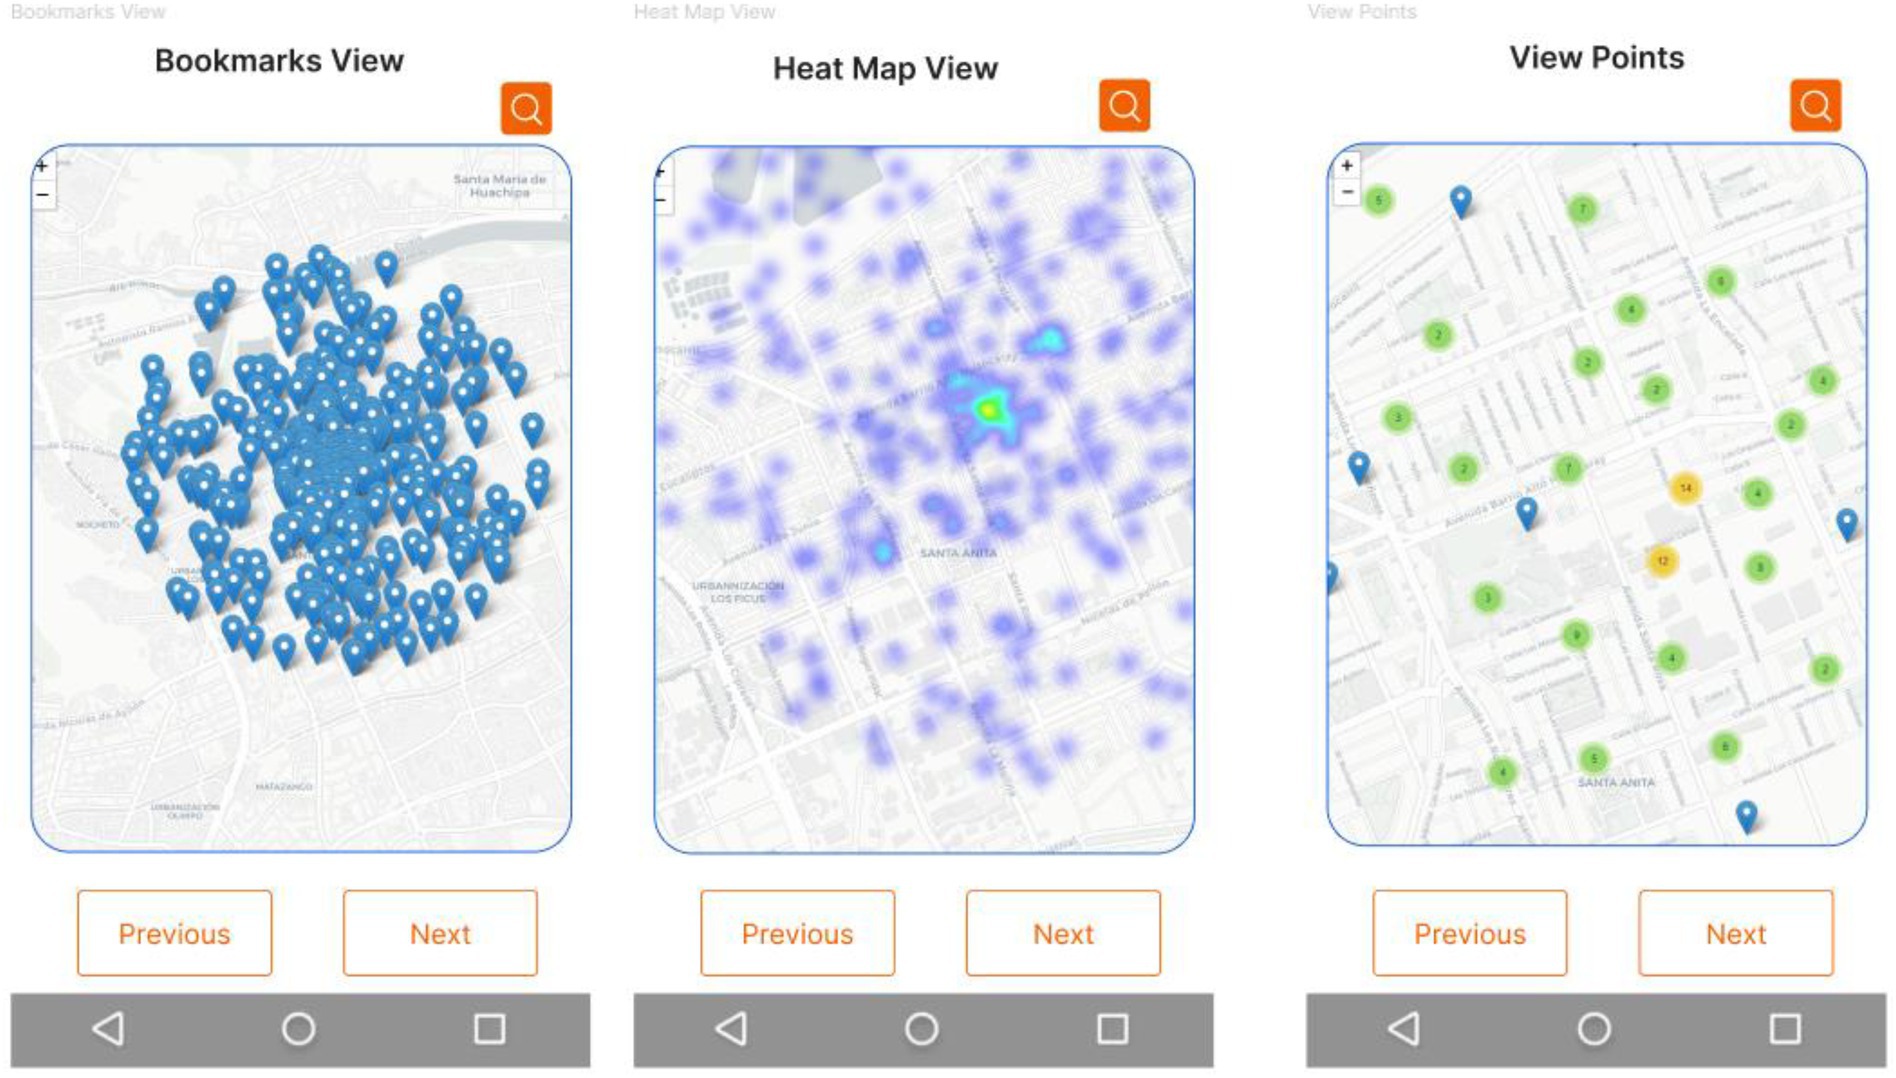
Figure 9. Map view layout.
Figure 10 shows an interface focused on crime report validation and statistical analysis. Its minimalist and orderly design allows a smooth and simple navigation, highlighting the main functions of the system and ensuring an efficient interaction with the user.
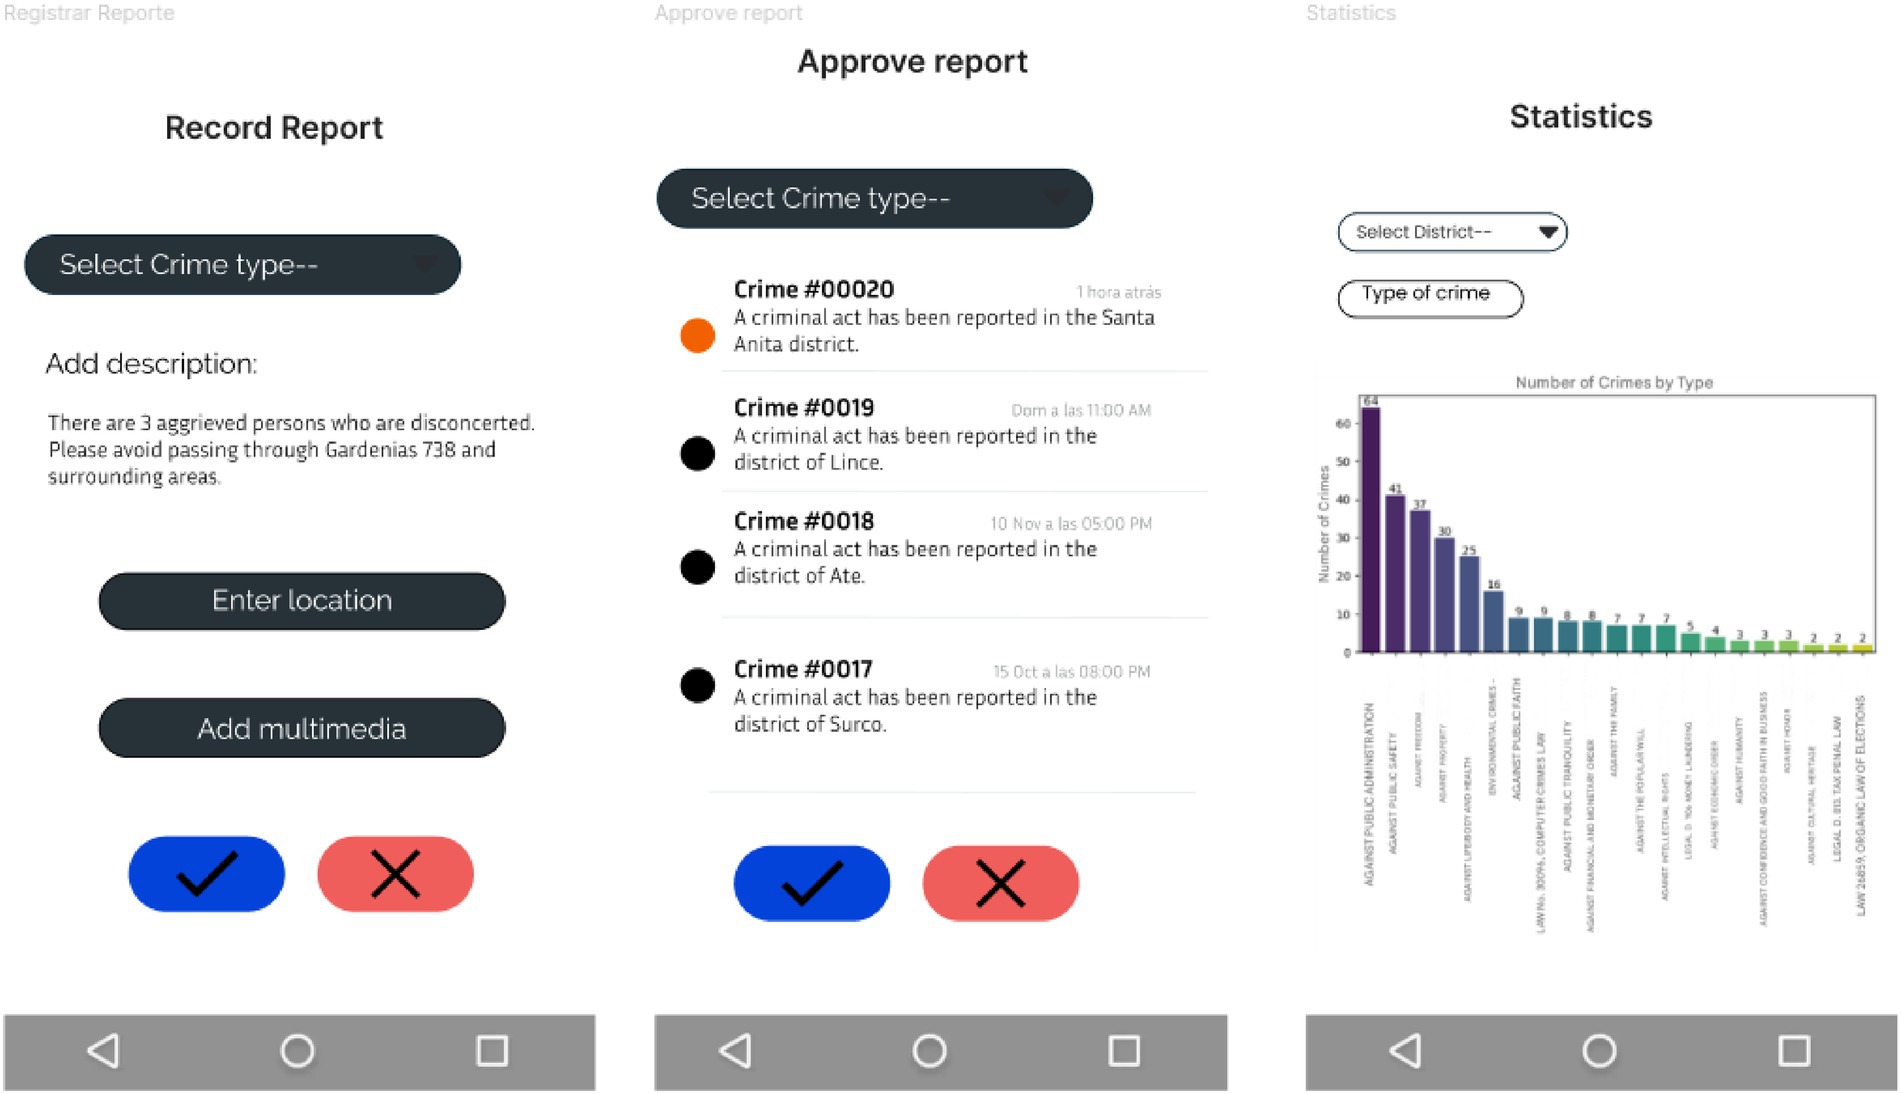
Figure 10. Crime validation design and statistics.
Figure 11 shows a simplified prototype, focusing on the essential functions for logging reports and setting up alerts. The interface focuses on simplicity and practicality, providing a seamless and uncomplicated experience for users.
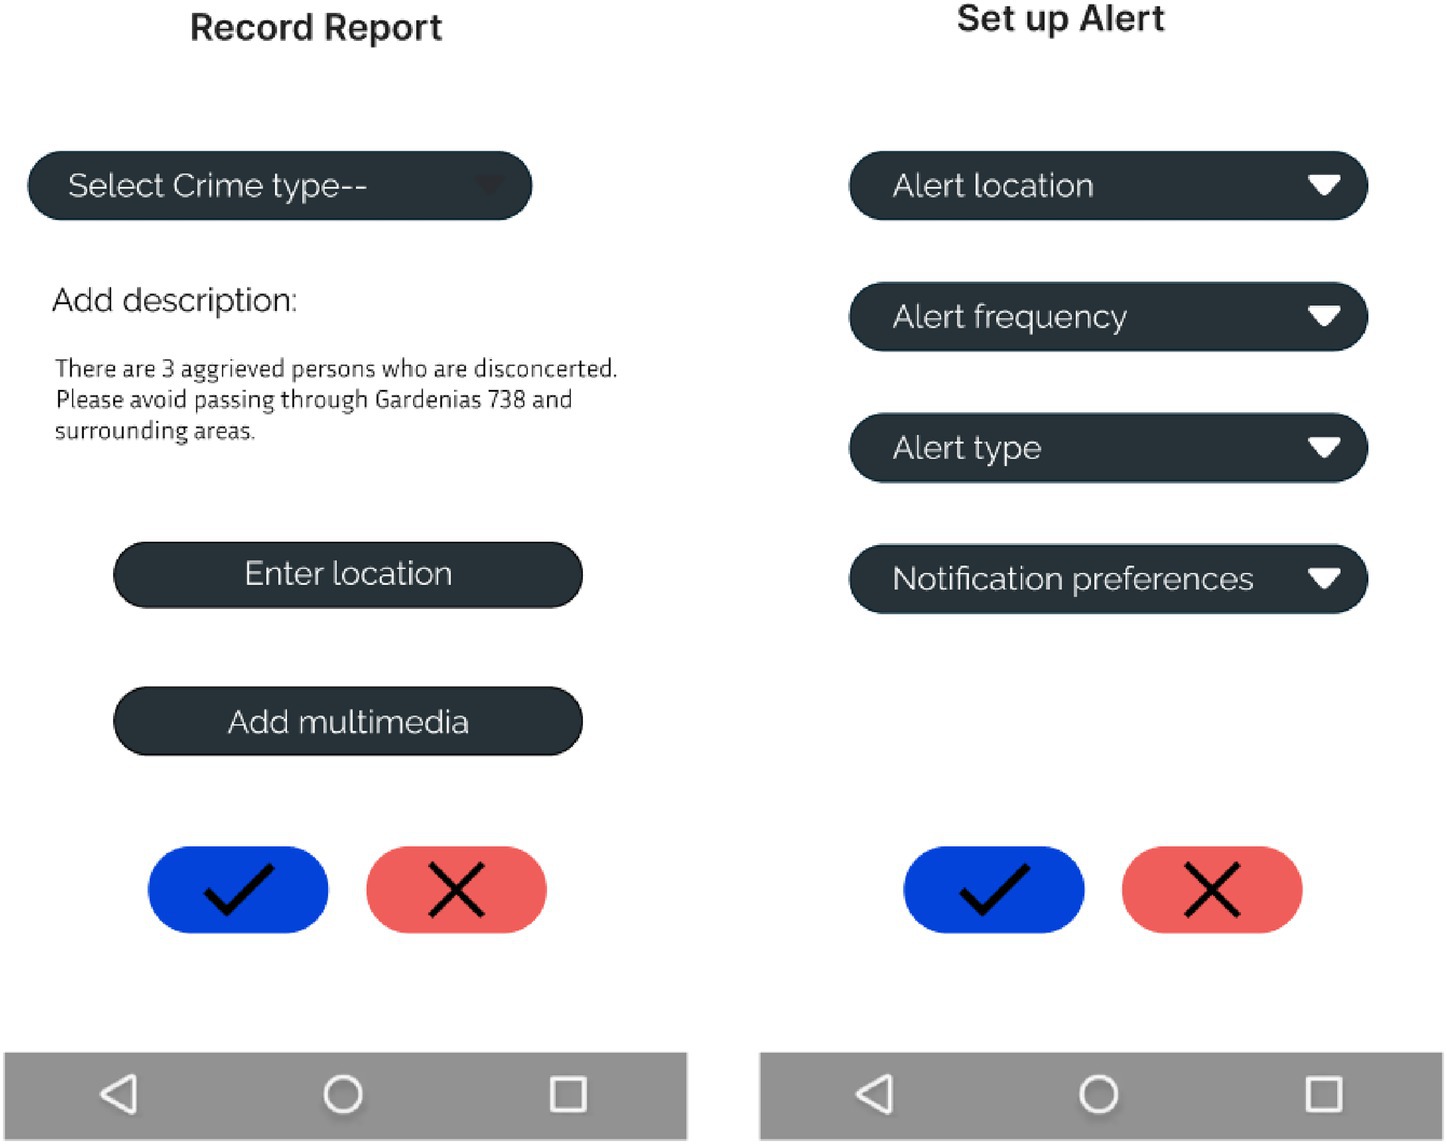
Figure 11. Prototype of configuration log and alert report.
Figure 12 shows a prototype that presents key visualizations, including scatter plots, histograms and pie charts, illustrating patterns identified by the predictive model. In addition, future crime maps are shown with 90% accuracy, providing an accurate visual representation of the areas with the highest probability of crime incidence in Metropolitan Lima.
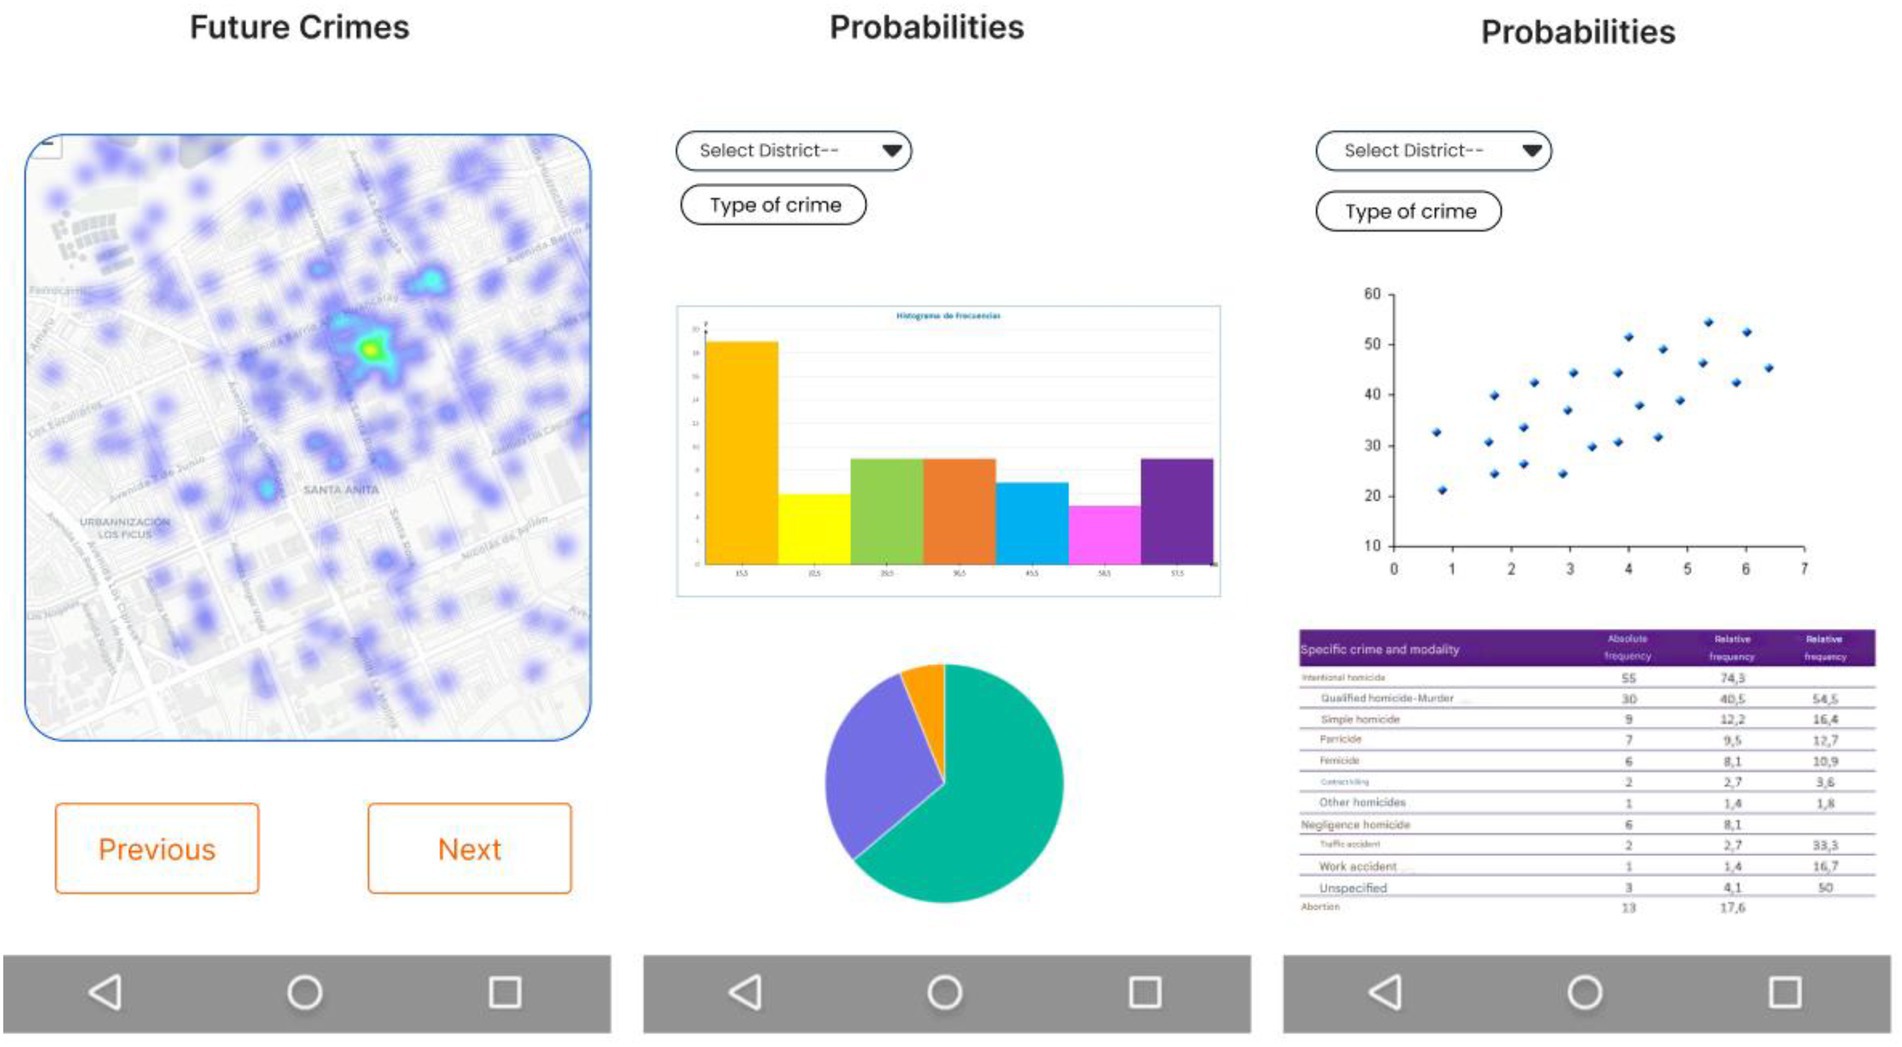
Figure 12. Prototype predictions.
Likewise, Figure 13 shows a summary of the mobile app screenshots, in which it can be seen that there will be three types of maps to visualize the crimes, as well as important modules such as the one to register new crimes, which will be approved by other users, on other hand, there are the alerts when being near a dangerous place according to the probability determined by the trained model.
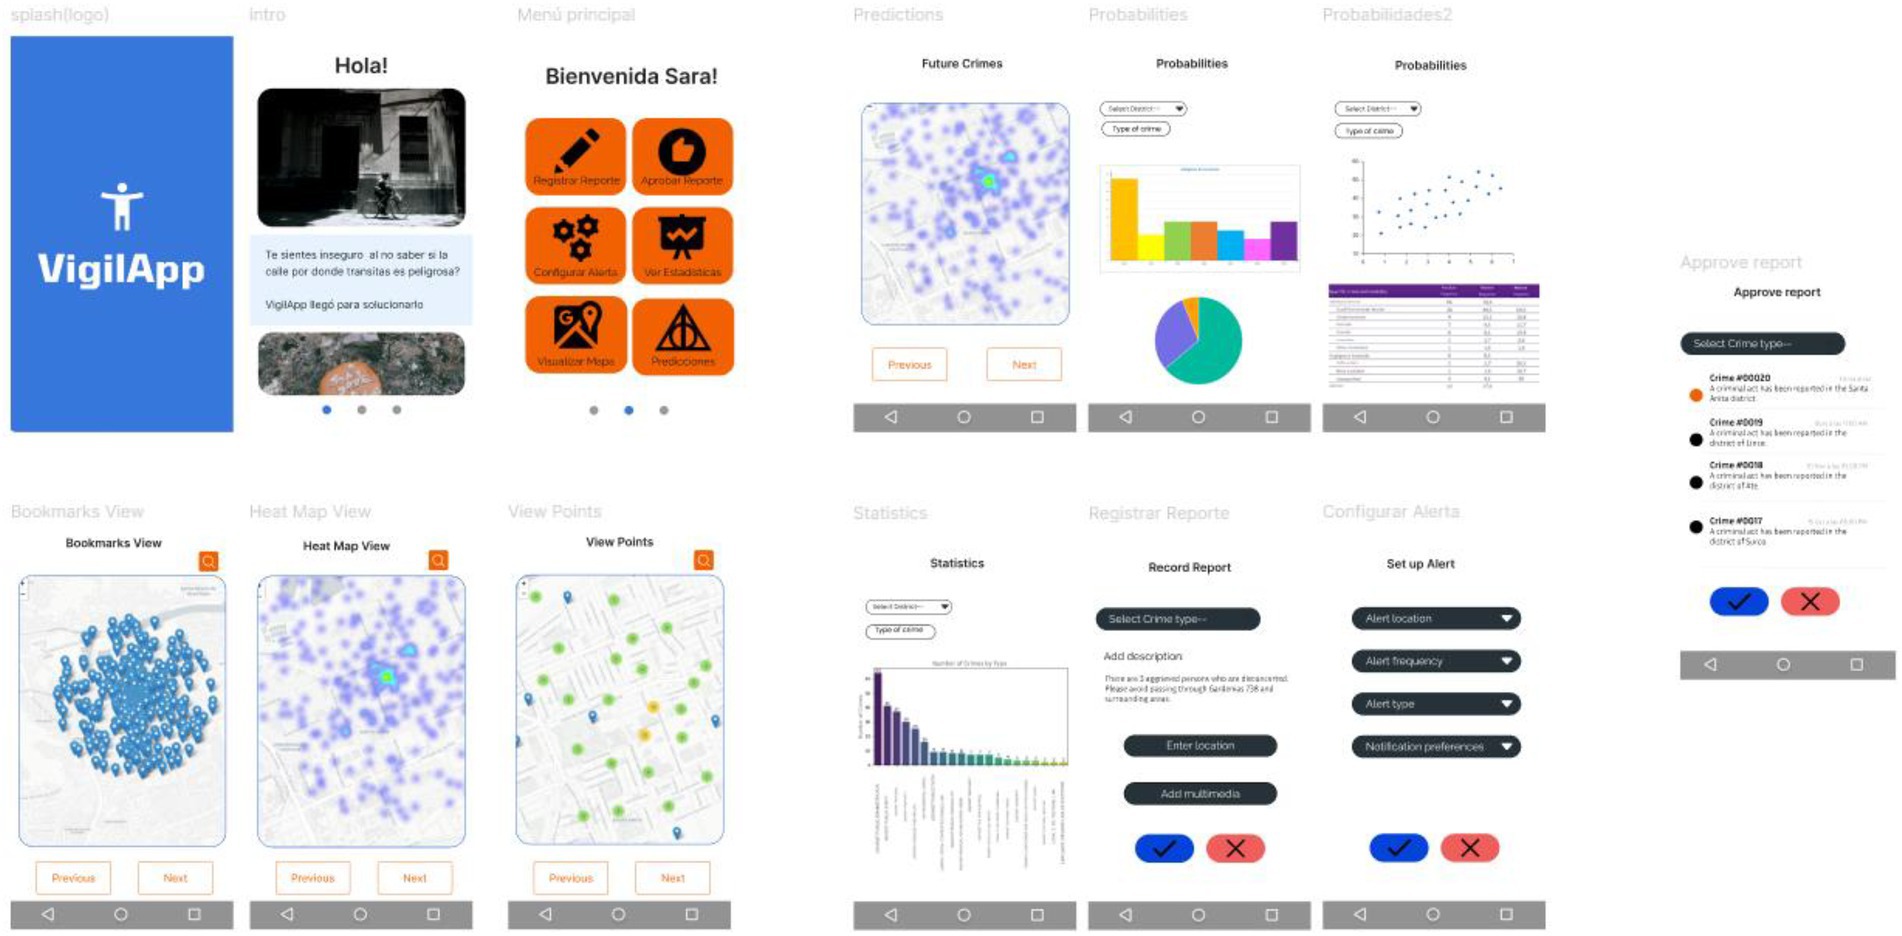
Figure 13. Mobile app screenshots.
4.2.5 Software analysis
For the system’s preliminary validation, a pilot simulation was conducted assuming the participation of 50 test users, based on a hypothetical yet realistic convenience sample representative of potential end users. These assumed users were residents of Metropolitan Lima—particularly from urban districts such as Jesús María—with access to Android smartphones and basic digital literacy.
Although the system has not yet been deployed in a live environment, this controlled pilot scenario was developed using functional prototypes, model predictions, and simulated user interactions to approximate real-world usage conditions. This approach allowed the team to evaluate the predictive performance and usability of the application in a structured and measurable way. The insights gained from this simulation provide a solid foundation for future empirical testing and large-scale implementation.
To evaluate the pilot implementation with 50 test users, we defined two key indicators:
- Accuracy: Agreement percentage between predicted and official crime areas.
- User Satisfaction: Average satisfaction score (scale: 1–5).
The analysis of the application’s performance showed positive results in terms of accuracy and user acceptance. Regarding the first metric, an accuracy of 89.5% was achieved, indicating a high level of agreement between the predicted crime hotspots and the official reports. The second metric, related to user satisfaction, reached a score of 4.8 out of 5, reflecting strong user approval of the app’s design, functionality, and perceived usefulness. These results are summarized in Table 3.
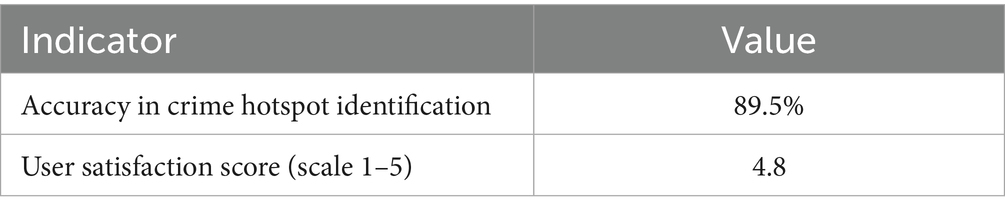
Table 3. Software evaluation indicators.
A study was also conducted on the relevance of different variables in crime prediction. The findings indicate that the latitude coordinate (“X” variable) stands out as the most influential factor in the detection of crime patterns. This suggests that certain geographic areas have a higher incidence of crime, possibly due to factors such as population density, the concentration of businesses and the availability of urban infrastructure.
5 Discussion of results
The results of this research show that the Gradient Boosting model obtained a superior performance compared to Random Forest in the prediction of high crime areas, reaching an accuracy of 91%, an AUC of 0.96, an F1 Score of 0.89 and a Recall of 0.82, compared to the values obtained by Random Forest, with an accuracy of 88%, an AUC of 0.91, an F1 Score of 0.85 and a Recall of 0.75.
Our findings partially agree with the studies of Deng et al., who found that the inclusion of spatiotemporal variables improves accuracy in machine learning models for crime prediction (Deng et al., 2023). Zhang et al. also used XGBoost in a similar approach and succeeded in interpreting predictions with SHAP (Zhang et al., 2022). Although our study did not employ XGBoost, the results suggest that boosting models, such as Gradient Boosting, offer robust performance in this type of applications.
In terms of technological integration, our mobile application aligns with the proposal of Guzman et al., who developed a citizen participation platform for real-time data collection with the goal of improving public safety (Guzman et al., 2021). In our case, the application allows visualizing predictive maps with 89.5% accuracy in identifying high-crime areas in Metropolitan Lima, which demonstrating the practical utility of predictive technology in civic contexts.
Likewise, the high level of user satisfaction (4.8 out of 5) validates both the usability and perceived effectiveness of the mobile application. This is in line with the findings of Cesar et al., who emphasize the importance of technological acceptance in the success of predictive and analytical systems (Cesar et al., 2023).
However, it is essential to recognize that predictive crime models—despite their technical advantages—can introduce ethical and social challenges that must be addressed rigorously. One major concern is the potential reinforcement of historical biases present in the training data. If past crime data reflects unequal policing practices or socioeconomic disparities, the model could unintentionally perpetuate discrimination against certain geographic areas or demographic groups.
For example, over-policing in marginalized neighborhoods may lead to more recorded incidents, which then feeds into the system as evidence of “high-risk” status, creating a feedback loop that disproportionately affects vulnerable populations. Although our model relies primarily on spatiotemporal variables rather than personal or demographic data, the ethical risk of stigmatization still exists when assigning risk levels to specific locations.
In addition, the visualization of high-crime areas, even if accurate, could influence public perception and real estate dynamics, potentially exacerbating social segregation. Therefore, it is crucial that the outputs of the system are used as decision-support tools rather than definitive indicators of criminality.
To mitigate these risks, we advocate for the adoption of transparent model design, regular bias audits, and stakeholder consultation, particularly involving local communities and public institutions. Limiting access to sensitive predictions can also reduce the likelihood of misuse or discriminatory outcomes.
The results of this study confirm and extend previous research, demonstrating that the use of data mining in mobile applications based on KDD methodology can promote sustainability in public safety when responsibly implemented. Nonetheless, we underscore the importance of embedding ethical safeguards and accountability frameworks to ensure that technological solutions contribute positively and equitably to urban security.
6 Conclusion
This study has highlighted the relevance of applying the KDD methodology in the development of a mobile application designed to identify areas with high crime incidence in Metropolitan Lima. The use of machine learning algorithms, such as Random Forest and Gradient Boosting, has shown a favorable performance in the detection of risk areas. In addition, collaboration with security and technology specialists was key to ensure the accuracy and relevance of the system.
On the other hand, the incorporation of emerging technologies, such as image recognition through Deep Learning models, is presented as a valuable opportunity to improve the predictive capacity of the application. This type of integration would allow a more detailed detection of criminal patterns, increasing the effectiveness of crime prevention.
Despite the progress achieved, it is important to emphasize that enforcement should not be seen as an isolated solution to address citizen security problems. Its impact would be enhanced by complementary strategies, such as reinforced police presence, improvements in urban infrastructure and security awareness campaigns. The combination of these actions would contribute to a safer environment and the well- being of citizens.
6.1 Limitations
Ongoing cooperation with security and technology specialists is recommended to ensure that the application maintains high levels of accuracy and efficiency. It is also ad-visable to analyze the possibility of incorporating innovative technologies and expanding the database used in order to improve its predictive capacity.
6.2 Future work
As for future work, it is recommended that the implementation of emerging technologies be explored in greater depth and that the databases used be expanded to optimize the ac-curacy of the predictions. It is also essential to carry out constant evaluations and updates to ensure its long- term effectiveness. Working together with security and technology experts will be crucial to further refine the application and its impact on urban safety. Finally, it is essential to carry out periodic reviews and updates of the system to guarantee its validity and optimal performance over time.
Data availability statement
The data analyzed in this study is subject to the following licenses/restrictions: The dataset may not be published in whole or in part on the Internet, and its use is for academic purposes and must cite this article. Requests to access these datasets should be directed to Jorge Pantoja, e-mail: anBhbnRvamFjQHVubXNtLmVkdS5wZQ==.
Author contributions
HV-H: Conceptualization, Formal analysis, Writing – original draft. JV: Conceptualization, Software, Writing – original draft. NA: Conceptualization, Software, Writing – original draft. GM-N: Data curation, Validation, Writing – review & editing. LG-G: Conceptualization, Data curation, Writing – review & editing. JP-C: Methodology, Visualization, Writing – review & editing. OB-P: Methodology, Visualization, Writing – review & editing. JL-G: Supervision, Visualization, Writing – review & editing. AC-F: Conceptualization, Methodology, Writing – review & editing. JC-D: Conceptualization, Visualization, Writing – review & editing. RG-C: Conceptualization, Supervision, Writing – review & editing. FL-C: Data curation, Validation, Writing – review & editing.
Funding
The author(s) declare that no financial support was received for the research and/or publication of this article.
Conflict of interest
The authors declare that the research was conducted in the absence of any commercial or financial relationships that could be construed as a potential conflict of interest.
Correction note
This article has been corrected with minor changes. These changes do not impact the scientific content of the article.
Generative AI statement
The authors declare that no Gen AI was used in the creation of this manuscript.
Publisher’s note
All claims expressed in this article are solely those of the authors and do not necessarily represent those of their affiliated organizations, or those of the publisher, the editors and the reviewers. Any product that may be evaluated in this article, or claim that may be made by its manufacturer, is not guaranteed or endorsed by the publisher.
References
Aziz, R. M., Hussain, A., and Sharma, P. (2024). Cognizable crime rate prediction and analysis under Indian penal code using deep learning with novel optimization approach. Multimed. Tools Appl. 83, 22663–22700. doi: 10.1007/s11042-023-16371-0
Cesar, S., Hugo, V., and Ciro, R. (2023). Literature review of TAM model applicable to e-government in Peru’s agricultural export sector. Lecture Notes in Networks and Systems, 464, 207–216. doi: 10.1007/978-981-19-2394-4_19
Citizen. (2025). Citizen: protect the world on the App store. Available online at: https://apps.apple.com/us/app/citizen-protect-the-world/id1039889567
De-La-Cruz-Vdv, P., Moquillaza-Henriquez, S., Valeriano-Pena, M., Maquen-Nino, G. L. E., Vega-Huerta, H., and Adrianzen-Olano, I. (2023). Data Mart and key performance indicators to optimize decisions in a medical service clinic. Iberian Conference on Information Systems and Technologies. doi: 10.23919/CISTI58278.2023.10211492
Deng, Y., He, R., and Liu, Y. (2023). Crime risk prediction incorporating geographical spatiotemporal dependency into machine learning models. Inf. Sci. 646:119414. doi: 10.1016/j.ins.2023.119414
Fayyad, U., Piatetsky-Shapiro, G., and Smyth, P. (1996). From data mining to knowledge discovery in databases. AI Mag. 17, 37–54. doi: 10.1609/aimag.v17i3.1230
Friedman, J. H. (2001). Greedy function approximation: a gradient boosting machine. Ann. Stat. 29, 1189–1232. doi: 10.1214/aos/1013203451
Guzman, Y., Tavara, A., Zevallos, R., and Vega, H. (2021). “Implementation of a bilingual participative argumentation web platform for collection of Spanish text and Quechua speech*” in 3rd International Conference on Electrical, Communication and Computer Engineering, ICECCE 2021. 12–13. doi: 10.1109/ICECCE52056.2021.9514251
Hollands, R. G. (2008). Will the real smart city please stand up? City 12, 303–320. doi: 10.1080/13604810802479126
INEI. (2017). Sistema Integrado de estadísticas de la criminalidad y Seguridad Ciudadana. Available at: https://datacrim.inei.gob.pe/#
Li, Y., Tang, X. F., and Cheng, H. (2023). Application of a flipped classroom teaching model based on micro-videos in the standardized training of dermatological residents in China. Front. Med. 10, 1–6. doi: 10.3389/fmed.2023.1250168
López-Córdova, F., Vega-Huerta, H., Maquen-Niño, G. L. E., Cáceres-Pizarro, J., Adrianzén-Olano, I., and Benito-Pacheco, O. (2025). Construction of a new data set of pleural fluid cytological images for research. Int. J. Online Biomed. Eng. 21, 138–151. doi: 10.3991/IJOE.V21I07.54323
Maquen-Niño, G. L. E., Nuñez-Fernandez, J. G., Taquila-Calderon, F. Y., Adrianzén-Olano, I., De-La-Cruz-VdV, P., and Carrión-Barco, G. (2024). Classification model using transfer learning for the detection of pneumonia in chest X-ray images. Int. J. Online Biomed. Eng. 20, 150–161. doi: 10.3991/IJOE.V20I05.45277
Moquillaza-Henríquez, S., Vega-Huerta, H., De-La-Cruz-Vdv, P., Cabrera-Díaz, J., Solis, R. M., Maquen-Niño, G. L. E., et al. (2025). Model to improve the quality of services and the skills of young university students. J. Inform. Syst. Eng. Manag. 10, 777–796. doi: 10.52783/jisem.v10i12s.1949
Perez-Siguas, R., Matta-Solis, H., Matta-Solis, E., Artezano, A. R., Matta-Solis, D., Millones-Gomez, S., et al. (2022). Crime prediction and citizen security plans using big data in metropolitan Lima. Int. J. Eng. Trends Technol. 70, 144–154. doi: 10.14445/22315381/IJETT-V70I10P215
Plotnikova, V., Dumas, M., and Milani, F. (2020). Adaptations of data mining methodologies: a systematic literature review. PeerJ Comput. Sci. 6, e267–e243. doi: 10.7717/PEERJ-CS.267
Rayhan, Y., and Hashem, T. (2020). AIST: an interpretable attention-based deep learning model for crime prediction. ACM Trans. Spat. Algorith. Syst. 9, 1–31. doi: 10.1145/3582274
Saltos, G., and Cocea, M. (2017). An exploration of crime prediction using data mining on open data. Int. J. Inf. Technol. Decis. Mak. 16, 1155–1181. doi: 10.1142/S0219622017500250
Saraiva, M., Matijošaitienė, I., Mishra, S., and Amante, A. (2022). Crime prediction and monitoring in Porto, Portugal, using machine learning, spatial and text analytics. ISPRS Int. J. Geo Inf. 11, 1–18. doi: 10.3390/ijgi11070400
Tsushi, Y., and Ishihara, A. (2005). Supply and examination system for contact lenses - Google patents (patent no. US20050060196A1). Available online at: https://patents.google.com/patent/US20050060196A1/en?oq=US20050060196A1
Vega-Huerta, H., Chunga-Vargas, M., Guerra-Grados, L., Lázaro-Guillermo, J., Benito-Pacheco, O., Pantoja-Collantes, J., et al. (2025a). Web system with gamification to enhance reading comprehension in a secondary-level educational institution. Ingen. Syst. Inform. 30, 61–70. doi: 10.18280/isi.300106
Vega-Huerta, H., Gutierrez-Mejía, F., Calcina-Aguilar, B., Benito-Pacheco, O., De-La-Cruz-Vdv, P., Maquen-Niño, G. L. E., et al. (2025b). ChatGPT-based conversational artificial intelligence system for virtual university admissions office client attention. Ingen. Syst. Inform. 30, 945–952. doi: 10.18280/ISI.300411
Vega-Huerta, H., Marcos, J. M., Acosta, M. C., Monrroy, X. V., Maquen-Niño, G. L. E., Puelles-Bulnes, M., et al. (2025c). Generation of routes using genetic algorithms to optimize the domestic solid waste collection. Lecture Notes Netw. Syst. 1031, 389–400. doi: 10.1007/978-981-97-3859-5_31
Vega-Huerta, H., Pantoja-Pimentel, K. R., Quintanilla Jaimes, S. Y., Maquen-Niño, G. L. E., De-La-Cruz-VdV, P., and Guerra-Grados, L. (2024). Classification of Alzheimer’s disease based on deep learning using medical images 20, 101–114. doi: 10.3991/ijoe.v20i10.49089
Vega-Huerta, H., Rivera-Obregón, M., Maquen-Niño, G. L. E., De-La-Cruz-VdV, P., Lázaro-Guillermo, J. C., Pantoja-Collantes, J., et al. (2025d). Classification model of skin Cancer using convolutional neural network. Ingen. Syst. Inform. 30, 387–394. doi: 10.18280/isi.300210
Wang, B., Zhang, D., Zhang, D., Brantingham, P. J., and Bertozzi, A. L. (2017). Deep learning for real time crime forecasting. Available online at: https://arxiv.org/pdf/1707.03340
Wired. (2017). Rio’s favelas are crowdsourcing crime data to keep people safe. Available online at: https://www.wired.com/story/favela-crime-brazil-rocinha-fogo-cruzado/
Yan, Z., Chen, H., Dong, X., Zhou, K., and Xu, Z. (2022). Research on prediction of multi-class theft crimes by an optimized decomposition and fusion method based on XGBoost. Expert Syst. Appl. 207:117943. doi: 10.1016/j.eswa.2022.117943
Yauri, J., Lagos, M., Vega-Huerta, H., De-La-Cruz-VdV, P., Maquen-Niño, G. L. E., and Condor-Tinoco, E. (2023). Detection of epileptic seizures Based-On Channel fusion and transformer network in EEG recordings. Int. J. Adv. Comput. Sci. Appl. 14, 1067–1074. doi: 10.14569/IJACSA.2023.01405110
Zhang, X., Liu, L., Lan, M., Song, G., Xiao, L., and Chen, J. (2022). Interpretable machine learning models for crime prediction. Comput. Environ. Urban. Syst. 94:101789. doi: 10.1016/j.compenvurbsys.2022.101789
Keywords: heat maps, machine learning algorithms, criminal acts, citizen security, CRISP-DM
Citation: Vega-Huerta H, Vilca Velasquez J, Anicama Espinoza N, Maquen-Niño GLE, Guerra-Grados L, Pantoja-Collantes J, Benito-Pacheco O, Lázaro-Guillermo JC, Camara-Figueroa A, Cabrera-Díaz J, Gil-Calvo R and López-Córdova F (2025) Mobile application based on KDD to predict high-crime areas and promote sustainability in citizen security in a district of Lima-Perú. Front. Comput. Sci. 7:1585632. doi: 10.3389/fcomp.2025.1585632
Edited by:
Haroldo V. Ribeiro, State University of Maringá, BrazilReviewed by:
Laura Belli, University of Parma, ItalyMaelyson R. F. Santos, Federal Institute of Pernambuco, Brazil
Copyright © 2025 Vega-Huerta, Vilca Velasquez, Anicama Espinoza, Maquen-Niño, Guerra-Grados, Pantoja-Collantes, Benito-Pacheco, Lázaro-Guillermo, Camara-Figueroa, Cabrera-Díaz, Gil-Calvo and López-Córdova. This is an open-access article distributed under the terms of the Creative Commons Attribution License (CC BY). The use, distribution or reproduction in other forums is permitted, provided the original author(s) and the copyright owner(s) are credited and that the original publication in this journal is cited, in accordance with accepted academic practice. No use, distribution or reproduction is permitted which does not comply with these terms.
*Correspondence: Gisella Luisa Elena Maquen-Niño, Z21hcXVlbm5AdW5wcmcuZWR1LnBl