 Ping Wang1†
 Xin Zhao
- 1Qingdao Huanghai University, Qingdao, China
- 2College of Geodesy and Geomatics, Shandong University of Science and Technology, Qingdao, China
High-resolution remote sensing imagery is a powerful tool that provides massive information about ground objects. However, conventional methods often fail to achieve satisfactory results for complex urban scene classification. This is attributed to the fact that conventional methods are unable to meet the requirements of high-accuracy remote sensing image scene classification (RSSC) and are hindered by challenges such as limited labeled samples and class imbalance, which may lead to classification bias in classifiers. On the contrary, deep learning-based RSSC represents an important approach for understanding semantic information. This paper explores the feasibility of mitigating classification bias by reducing the imbalance ratio (IR) of the dataset. First, a class-imbalanced dataset was constructed using very high-resolution (VHR) images, labeled into nine land use/land cover (LULC) categories. Second, comprehensive data augmentation techniques (mirroring, rotation, cropping, Hue, Saturation, Value (HSV) perturbation, and gamma transformation) were applied, successfully reducing the dataset's IR from 9.38 to 1.28. Subsequently, four architectures, MobileNet-v2, ResNet101, ResNeXt101_32×32d, and Transformer, were trained and evaluated on both class-balanced and class-imbalanced datasets. The results indicate that the classification bias caused by class imbalance was alleviated, significantly improving the classifier's performance. Specifically for the most severely underrepresented category (intersections), precision and recall improvements reached up to 128% and 102%, respectively, narrowing the gap with other categories and reducing classification bias. Furthermore, the average Kappa and overall accuracy (OA) increased by 11.84% and 12.97%, respectively, with reduced standard deviations in recall and precision, demonstrating enhanced model stability.
1 Introduction
High spatial resolution remote sensing imagery encompasses multiple low-level features (e.g., spectral characteristics, patterns, shadows, and textures) and explicit high-level semantic features. High-resolution remote sensing scene classification (RSSC) is essential for environmental understanding and has gained significant attention in remote sensing image interpretation (Gu et al., 2019; Cheng et al., 2017, 2020). Scene classification involves categorizing images into predefined semantic classes based on scene-specific information, representing high-level abstractions of scene content. However, traditional classification methods are limited by their reliance on low-level feature analysis, which restricts their capacity to extract high-level semantic information, thereby often failing to meet the accuracy demands of RSSC. Currently, the proliferation of deep learning has spurred numerous methodologies for remote sensing scene image classification, which can be broadly categorized into three types: autoencoder-based, convolutional neural network (CNN)-based, and generative adversarial network (GAN)-based approaches (Cheng et al., 2017; Ma et al., 2019; Yu et al., 2020; Cheng et al., 2022). For instance, Du et al. (2017) proposed stacked convolutional denoising auto-encoders, which demonstrated superior classification performance compared to state-of-the-art unsupervised networks. Tang et al. (2021) proposed the attention consistent network (ACNet) based on Siamese networks and validated the method using three remote sensing scene datasets, demonstrating that the proposed method achieves good performance. Cheng et al. (2022) proposed perturbation-seeking generative adversarial networks (PSGANs) to improve the stability of sample generation. Recent advances have also incorporated attention mechanisms and multiscale feature fusion, with notable contributions including co-enhanced global-part integration approaches (Zhao et al., 2024a), gradient-guided multiscale focal attention networks (Zhao et al., 2024b), and multibranch fusion-based feature enhancement methods (Liu et al., 2019), which have demonstrated remarkable performance improvements.
Despite these extensive advances in RSSC, the challenges posed by limited labeled samples and class imbalance remain insufficiently addressed. Deep learning, as a data-driven paradigm, relies heavily on data availability and quality, computational resources, architectural innovations, and optimization techniques. Among these factors, dataset quality is a critical determinant of model performance, with class balance being a key quality indicator. When training datasets are imbalanced, classifiers tend to favor majority classes and often fail to correctly identify minority classes (Buda et al., 2018; Johnson and Khoshgoftaar, 2019; Leevy et al., 2018; Luque et al., 2019; Yessou et al., 2020; Thabtah et al., 2020). In extreme cases, particularly with noise-robust models, minority classes may even be completely ignored, leading to severe classification bias.
Approaches to addressing class imbalance in machine learning are typically divided into two categories: data-level methods and algorithm-level methods. Data-level methods aim to modify the distribution of training samples to improve the effectiveness of standard algorithms (Fernández et al., 2018). For instance, Liu and Tsoumakas (2020) used random under-sampling to rebalance class distribution. Among over-sampling techniques, the synthetic minority oversampling technique (SMOTE) has been recognized as one of the most influential data-level strategies (Douzas et al., 2018). SMOTE is fundamentally a clustering-based method designed to oversample one-dimensional vector data—such as spectral vectors in multispectral or hyperspectral images (Feng et al., 2019)—to alleviate overfitting. However, its effectiveness is limited when applied to two-dimensional or three-dimensional image data due to its tendency to introduce noise. In contrast, algorithm-level methods maintain the original data distribution and instead focus on adjusting training strategies or inference mechanisms. For example, Bria et al. (2020) proposed a two-stage deep learning framework to address severe class imbalance in small lesion detection. Ren et al. (2020) introduced an improved DeepLab V3+ for remote sensing image segmentation, incorporating a loss function tailored to sample distribution. In addition, few-shot learning approaches offer alternative perspectives on handling limited minority class samples. Recent studies by Deng et al. (2024) on masked second-order pooling for few-shot RSSC demonstrates the potential of meta-learning approaches. Fine-tuning strategies have also been shown to enhance performance under imbalanced conditions, with Guan et al. (2020) developing a random fine-tuning meta metric learning (RF-MML) model for aerial image classification, which demonstrated effectiveness in handling imbalanced data. Despite these advancements, the effectiveness of class imbalance mitigation strategies, particularly data augmentation approaches, in deep learning-based RSSC tasks remains systematically underexplored.
While high-resolution remote sensing images contain rich semantic information, their scene classification faces significant challenges from limited labeled samples and class imbalance. Although some studies have investigated class imbalance in remote sensing contexts (Guan et al., 2020), comprehensive research in this area remains limited. This study aims to address these gaps through a systematic investigation of class-imbalanced RSSC. The specific objectives of this study are:
• Evaluating the sensitivity of overall accuracy metrics in RSSC to class imbalance
• Investigating the integration of data augmentation methods with datasets and examining the feasibility of alleviating classification bias through data augmentation methods
• Analyzing the sensitivity of individual categories in RSSC to class imbalance
• Assessing the sensitivity of RSSC to different classification algorithms
Figure 1 illustrates the experimental workflow. First, a class-imbalanced high-resolution remote sensing scene image dataset is constructed. Second, comprehensive data augmentation methods are applied according to dataset characteristics, reducing the dataset's imbalance ratio (IR) by approximately one-seventh. Subsequently, the classifiers are trained and fine-tuned on both augmented and original datasets. Finally, model performance on overall and individual categories is evaluated, with visualization of results from selected study areas.
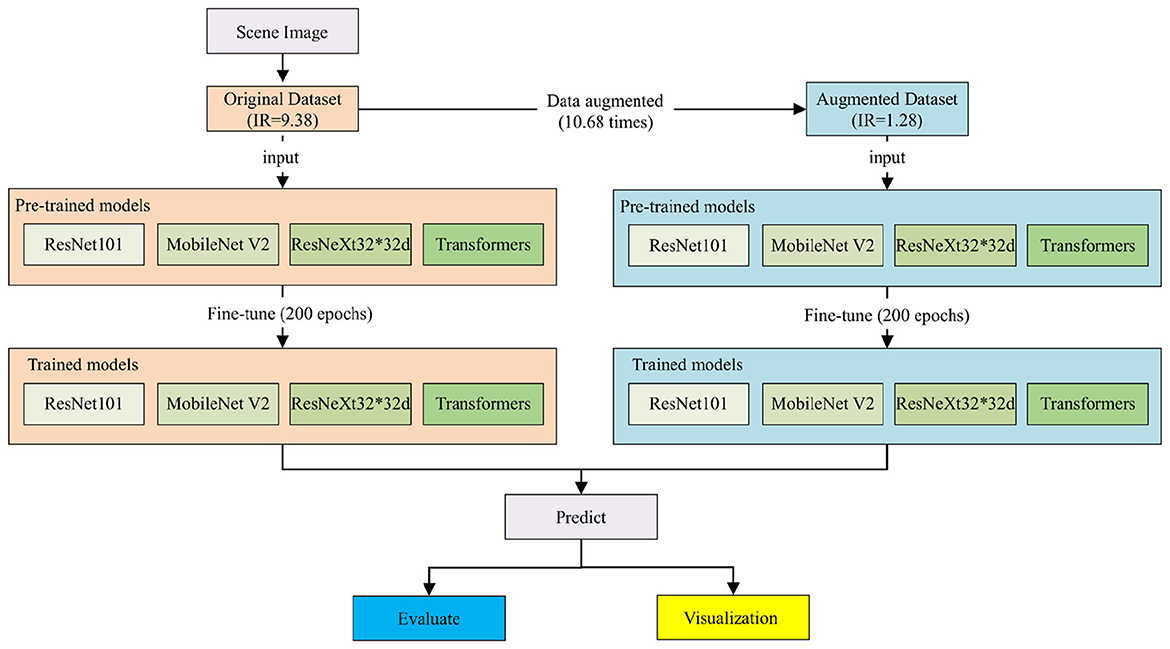
Figure 1. Workflow of this study.
The main contributions of this paper include investigating the feasibility of alleviating the class-imbalance problems using data augmentation methods in RSSC and advancing research in this field. In addition, a class-imbalanced RSSC benchmark dataset is constructed, and deep learning methods with different parameters and structures are evaluated.
As for the organization of this article, Section 2 introduces the methodology and experimental design in detail. Sections 3 and 4 present and discuss the experimental results comprehensively. Finally, Section 5 summarizes the conclusions and outlines future research directions.
2 Materials and methods
2.1 Study region
Shinan district is located in the southern area of Qingdao, Shandong province, characterized by a compact north–south extent of 4.5 km and an elongated east-west span of 12.7 km, with a total area of 30.01 km2 and approximately 15 km of coastline. The study region encompasses Shinan district and its surrounding areas (including marine regions), ranging from 120.2793229°E to 120.4292515°E and from 36.0376721°N to 36.0973352°N (Figure 2). Based on the data from the National Geomatics Center of China, the 30-m LULC of Shinan District and its surrounding areas is presented as shown in Figure 3. Combining Figures 2, 3, the main LULC of the study region includes water bodies (not including the ocean), artificial surfaces, shrubland, cultivated land, grassland, and bare land. The artificial surface category exhibits complex sub-classifications, encompassing buildings of different heights, roads, and open-air venues. This diversity makes the region particularly suitable for RSSC research. Furthermore, as the study region represents a typical urban built-up area, accurate scene classification is essential for understanding urban spatial distribution patterns through semantic analysis of scene images.
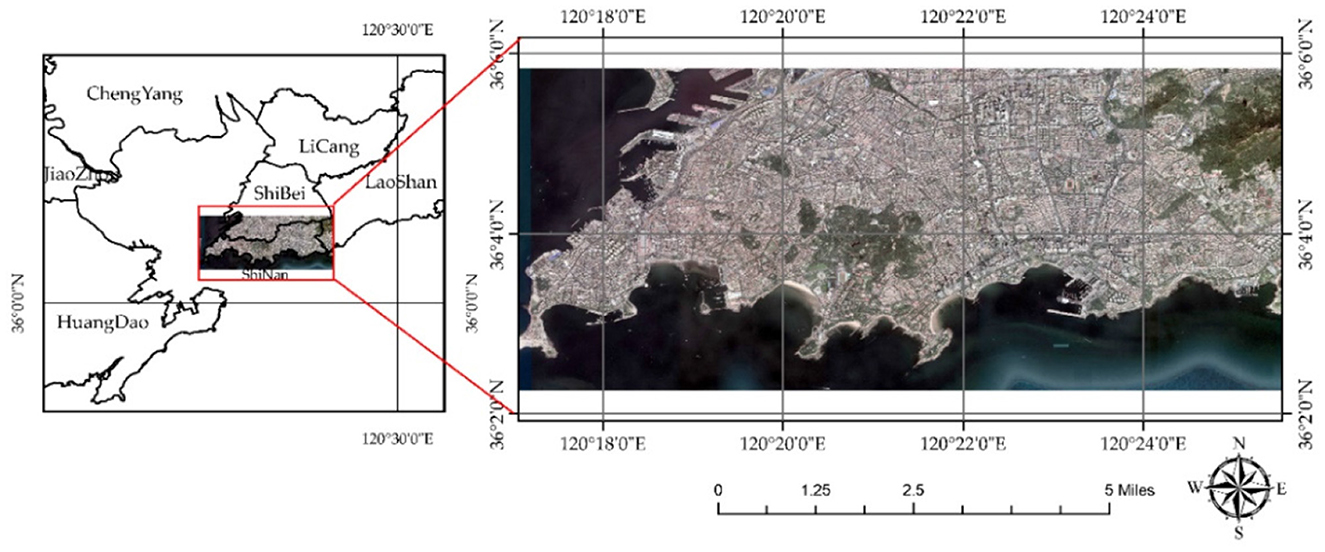
Figure 2. VHR and the location of the region of interest.
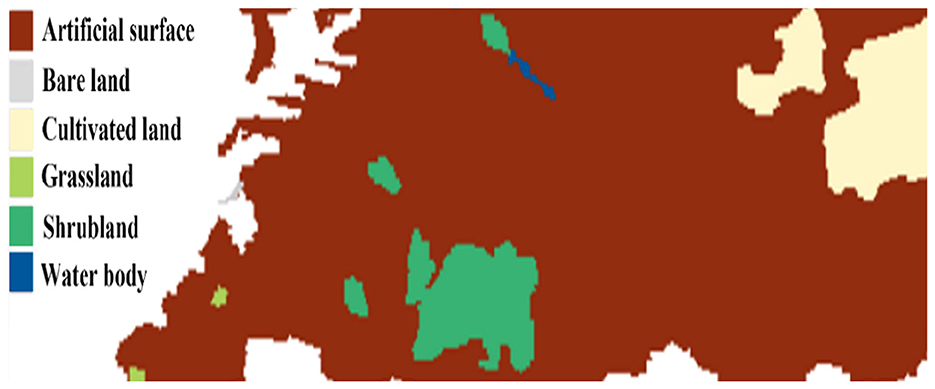
Figure 3. Thirty-m LULC map of Shinan District and its surrounding areas (including the marine region).
2.2 Dataset
The very high-resolution (VHR) image used in this study was downloaded from data processed by LocaSpace Viewer (http://www.tuxingis.com/locaspace.html), with a size of 56,064*27,648 pixels and a spatial resolution of 0.2985 m. According to information obtained from the https://resources.maxar.com, the original source consists of WorldView-3 data (Table 1), acquired on 16 March 2019, with a maximum ground sample distance of 0.36 m, a sun elevation of 49.9°, an image off-nadir angle of 23.3°, and a maximum target azimuth of 5.1°. The full archive of this data is available through ESA (https://earth.esa.int/eogateway/~catalog/worldview-3-full-archive-and-tasking).
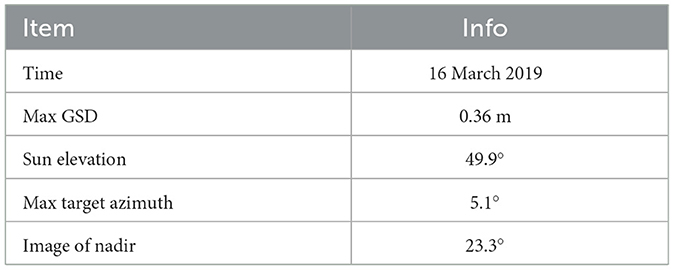
Table 1. Introduction to the original data source.
The VHR image was segmented into 256*256 pixel scene images, with each scene image covering a ground area of 76.416 × 76.416 m2. A total of 23,652 (108 × 219) scene images were generated. Based on visual interpretation and the spatial characteristics of the study area (Figures 2, 3), the images were divided into nine predefined semantic classes: chaparral, dense buildings, high-rise sparse buildings, low-rise sparse buildings, intersections, open-air venues, roads, water (including the ocean), and water–land junctions. Subsequently, 8% of the scene images were selected and manually labeled as training and validation samples to initialize the dataset (Figure 4).
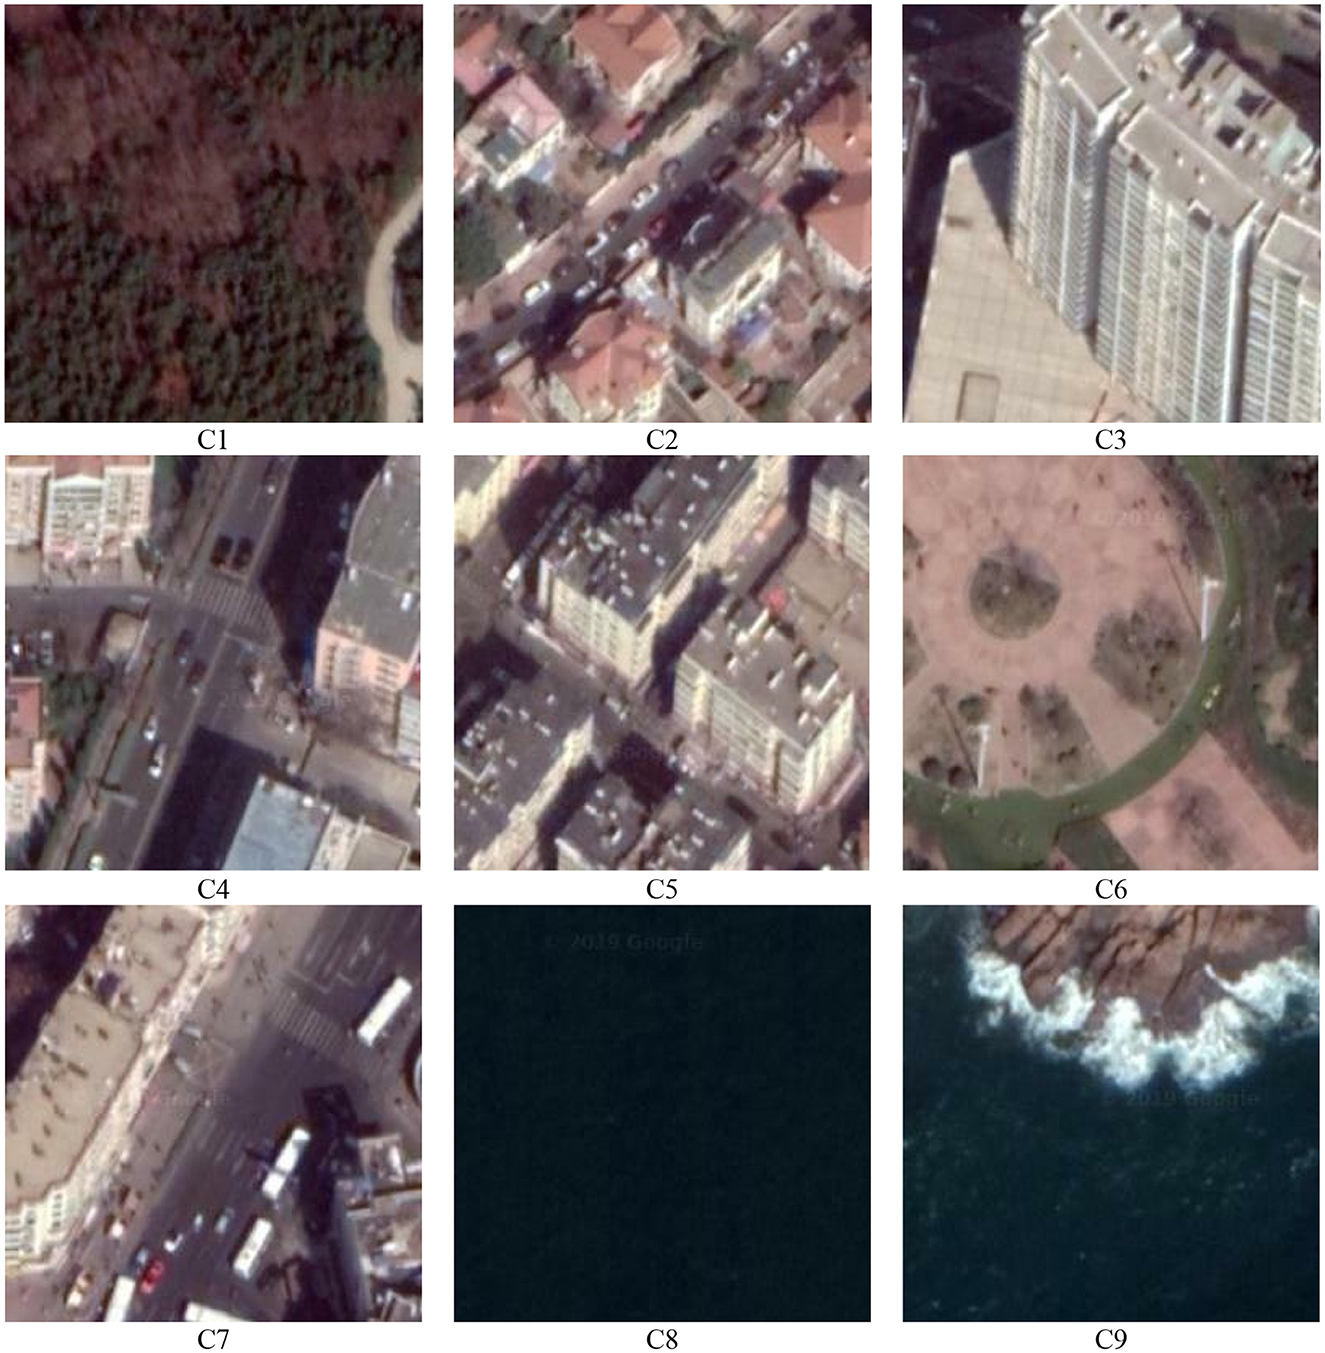
Figure 4. Examples of each class are shown, where C1–C9 represent chaparral, dense buildings, high-rise sparse buildings, low-rise sparse buildings, intersections, open-air venues, roads, water, and coastline, respectively.
As detailed in Table 2, the number of samples in the C4 (intersections) category is the smallest (68 samples), while the number of samples in the C8 (water) category is the largest (638 samples). The remaining categories contain samples ranging from approximately 100–250 samples each.
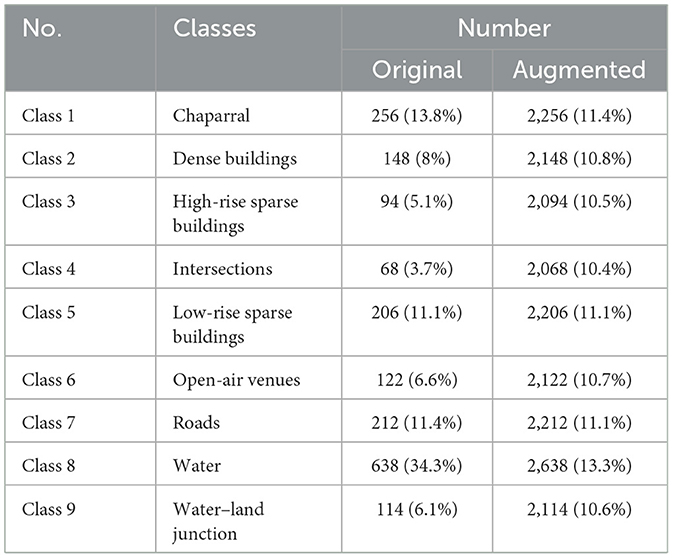
Table 2. Sample number of each class in the original dataset.
2.3 Data augmentation
To address class imbalance issues, data augmentation techniques were implemented (Table 3). The objective was to generate 2,000 augmented samples per category. The quotient derived from dividing the target number by the sample count of a given category determined the base multiple for sample expansion, while samples corresponding to the remainder received an incremented multiple. This process facilitated the calculation of each sample's expansion factor. For instance, the water category, with 638 samples, yielded a quotient of 3 and a remainder of 86 when 2,000 was divided by 638. Consequently, the base multiple for the water category was set to 3, with the 86 randomly selected samples assigned a multiple of 4.
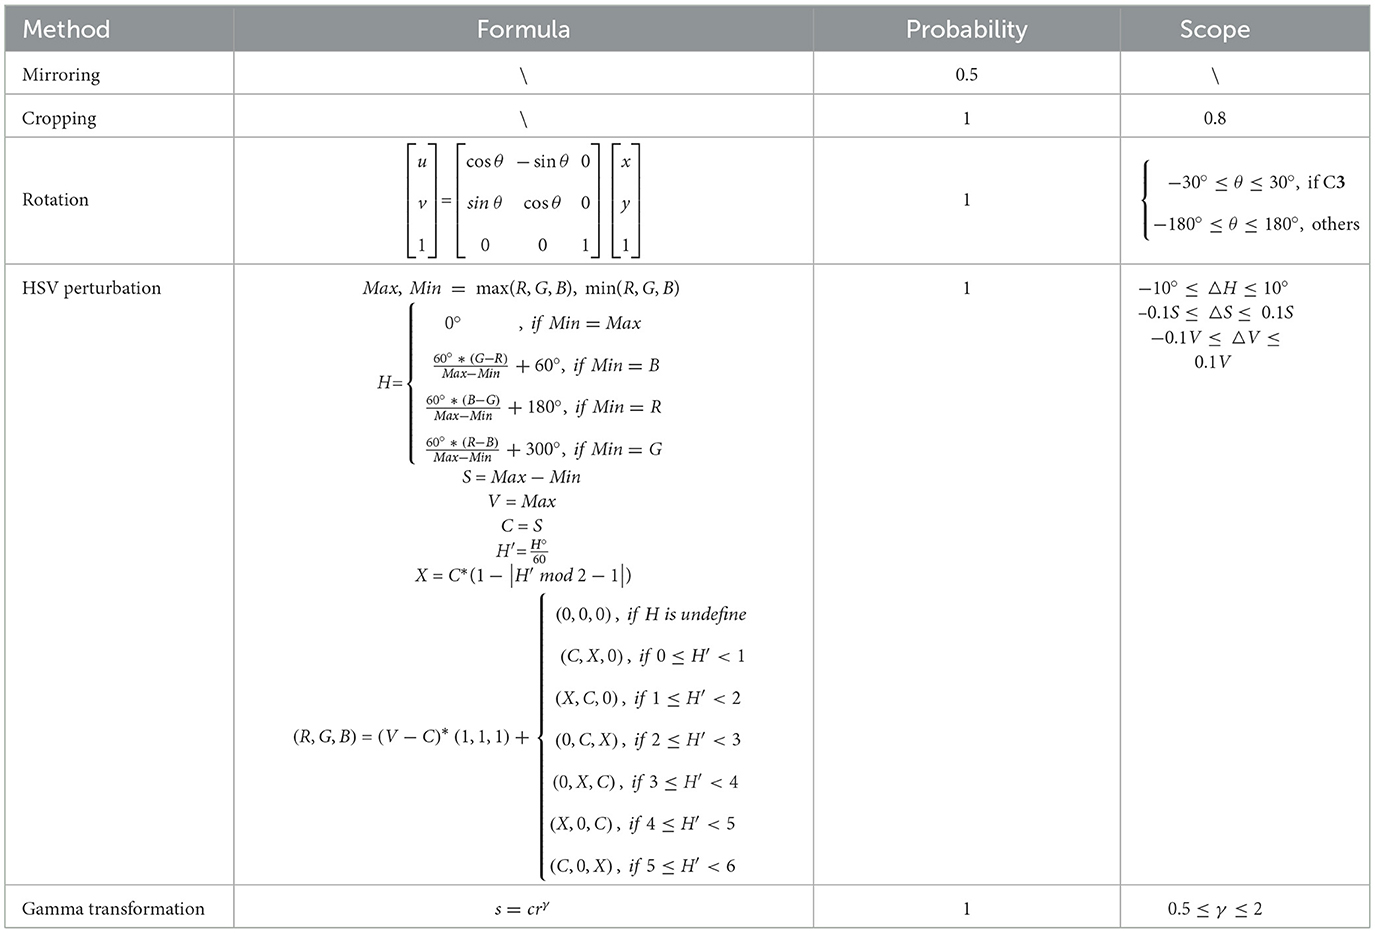
Table 3. Data augmentation method.
Subsequently, augmentation methods were applied to each sample based on its calculated multiple (Figure 5), encompassing mirroring, rotation, cropping, hue, saturation, and value (HSV) perturbation, and gamma transformation (Shi et al., 2020; Lewis et al., 1989). Augmentation parameters were determined through empirical validation on subsets of each class to ensure semantic consistency and optimal performance. Specifically, the mirroring probability was set to 0.5, while all other techniques were applied with a probability of 1.0. For rotation operations, class-specific parameter ranges were implemented: C3 (high-rise sparse buildings) was limited to ±30° to preserve architectural orientation and geometric relationships, while other classes utilized the full ±180° range. During rotation, additional cropping was used to eliminate edge artifacts. Given the slight deviation of the central axis from the vertical in bird's-eye view imagery, the perturbation ranges for HSV components were adjusted according to class characteristics: C8 (water) received reduced perturbation ranges (±5°, ±5%, ±5%) to maintain its distinctive spectral signature, while other classes used standard ranges of ±10°, ±10%, and ±10% for H, S, and V components, respectively. For structured categories such as C4 (intersections) and C7 (roads), stricter cropping boundaries were enforced to prevent semantic category shifts during spatial augmentation. The γ value for the gamma transformation was set in the range 0.5–2. Due to the size alterations induced by augmentation operations, a resizing step was incorporated to ensure compatibility with the classifier's input requirements. Finally, the augmented dataset was constructed by merging the augmented samples of each category with the original dataset (Table 3).
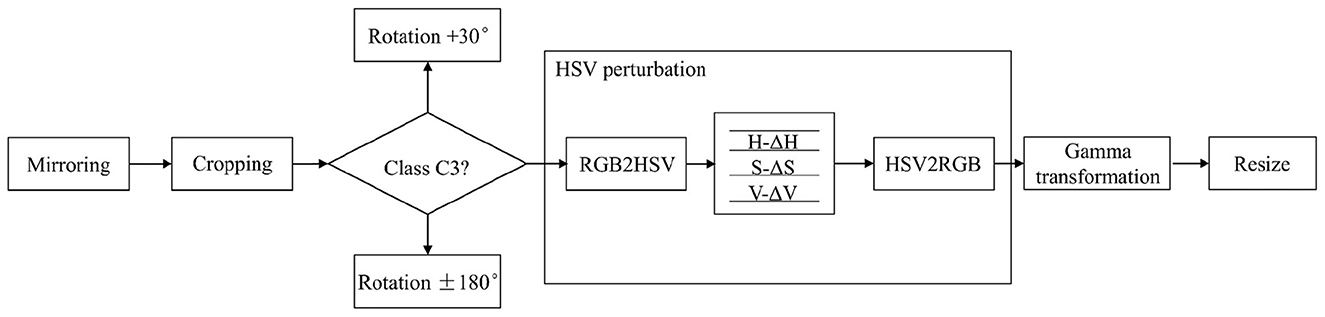
Figure 5. Workflow of data augmentation.
Figure 6 presents examples of augmented samples, where (a) represents the original image, while (b), (c), and (d) show augmented samples exhibiting richer color, contrast, and spatial features. The augmentation results appear realistic and consistent with satellite imagery characteristics.
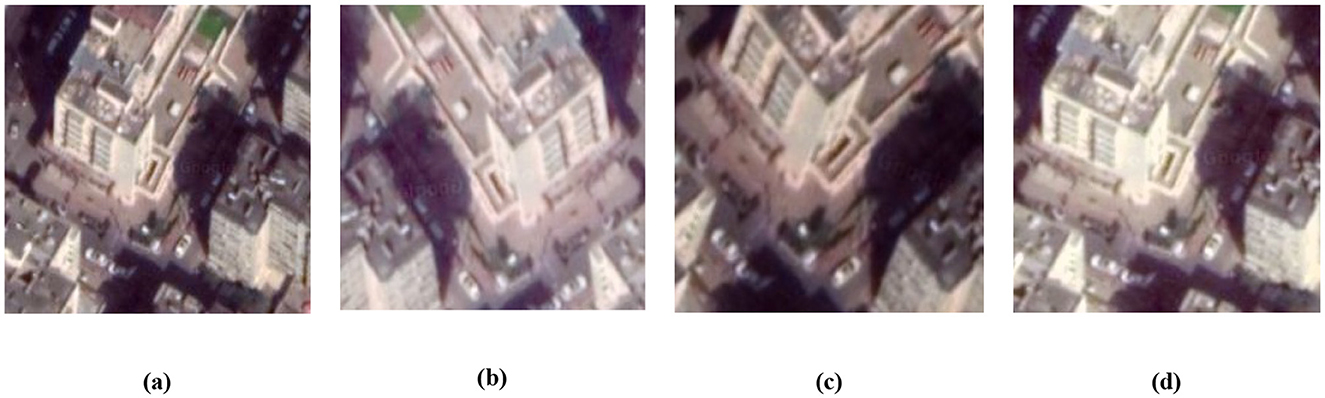
Figure 6. Examples of augmentation effects. (a) represents the original image, while (b–d) show augmented samples.
2.4 Imbalance ratio
The imbalance ratio (IR) is defined as the ratio of the number of samples in the majority class to that in the minority class, as expressed in Equation 1.
where Cmajority is the number of samples in the majority class and Cminority is the number of samples in the minority class.
The IR of the original dataset was 9.38 (628/68), indicating significant class imbalance. This imbalance issue was substantially alleviated in the augmented dataset, achieving an IR of 1.28 (2,638/2,068) (Table 3).
2.5 Methods
Four models were used for scene classification in this study and compared, including Mobilenet-v2, ResNet101, resnextt101_32x32d, and Transformer (Table 4). A brief introduction to each model architecture is provided below.
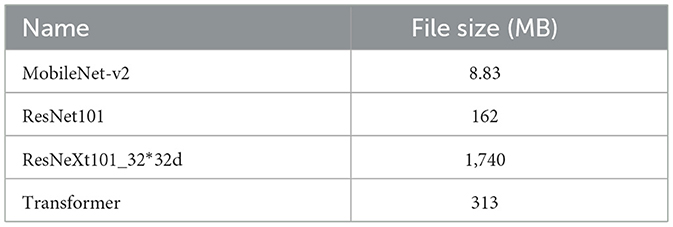
Table 4. File size of used models.
2.5.1 MobileNet
Fundamentally, MobileNet-v1 (Harjoseputro et al., 2020) was developed by replacing the standard convolutional layers in Visual Geometry Group (VGG) with the depth-wise separable convolution layers. Specifically, ordinary convolutions are decomposed into a depth-wise convolution and a point-wise convolution, enabling similar performance with reduced computational cost. In addition, Rectified Linear Unit 6 (ReLU6) replaces Rectified Linear Unit (ReLU), thereby limiting the activation function values to a specified boundary. Furthermore, the residual structures and the squeeze and excitation (SE) modules (Hu et al., 2018) were introduced into MobileNet-v2 (Sandler et al., 2018) and MobileNet-v3 (Howard et al., 2019), respectively.
2.5.2 ResNet
The development of ResNet (He et al., 2016) challenged the conventional belief that “the deeper the network, the higher the accuracy rate.” Experimental evidence demonstrated that network accuracy initially improves with increasing depth, but after reaching a saturation point, performance drops sharply. This phenomenon is attributed to the inability of very deep networks to perform “identity transformations (y = x)” due to overly strong non-linear transformation capabilities. To address this issue, shortcut connections were added to the ResNet block (Figure 7a), with 1*1 convolutions integrated into the main branches of the down-sampling block to achieve a balance between linear and non-linear conversion.
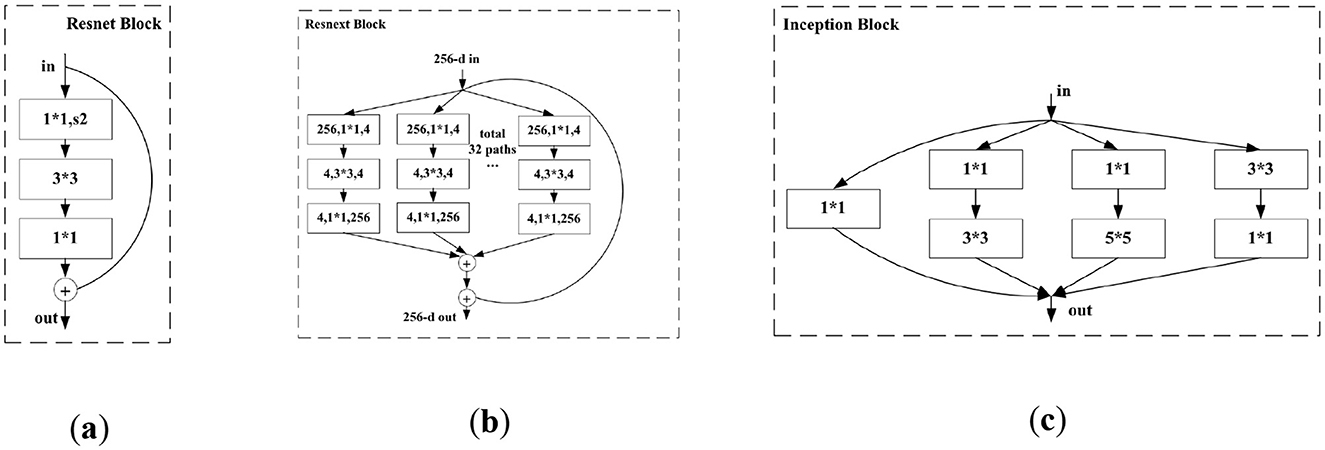
Figure 7. Structure of (a) ResNet block, (b) ResNeXt block, and (c) Inception block.
2.5.3 ResNeXt
ResNeXt (Xie et al., 2017) simplifies the “split–transform–merge” structure of the Inception block (Szegedy et al., 2015) (Figure 7c) into a uniform topological structure. By combining this approach with Resnet's shortcut connections (He et al., 2016), ResNeXt introduces grouped convolution, which represents an intermediate architecture between ordinary convolution and depth-wise separable convolution, achieving improved computational efficiency. When the dimension of the input feature map is 256, the ResNeXt block uses 32 groups of independent convolutions with identical topology (Figure 7b).
2.5.4 Transformer
Vision transformer (ViT-B/16) represents a paradigm shift from convolutional architectures to transformer-based approaches for image classification. Unlike CNNs that process images through hierarchical feature extraction, ViT divides input images into fixed-size patches (16 × 16 pixels), treats them as sequences, and applies standard transformer architectures originally designed for natural language processing. The ViT-B/16 model consists of 12 transformer layers with 12 attention heads and a hidden dimension of 768. Each image patch is linearly embedded and combined with positional encodings before being fed into the transformer encoder. This architecture enables the model to capture long-range dependencies and global context through self-attention mechanisms, which can be particularly beneficial for RSSC, where spatial relationships across the entire scene are crucial for accurate classification.
2.6 Fine-tuning
In numerous computer vision applications, the performance of deep learning models diminishes considerably when confronted with a scarcity of labeled data. Fine-tuning pre-trained models offers a straightforward and efficient transfer learning approach, enabling generalization to novel tasks with limited training samples, accelerating model convergence, and mitigating overfitting (Yosinski et al., 2014; Zhao et al., 2025).
Specifically, feature extractors trained on the source domain can be effectively transferred to the target domain through fine-tuning. By utilizing an extractor pre-trained on a large dataset (the source domain), the parameters of the trained feature extractor can be repurposed to initialize the classifier for training on a new dataset (the target domain). In this study, pre-trained models were used to initialize the model parameters, and the output layer (the number of categories) was modified to align with the specific requirements of the dataset.
3 Results
3.1 Experiment
The experiments were performed on a server configured with Ubuntu 16.04, a GPU (RTX2080Ti), and the Cuda10.2 + Python3.7 + Pytorch1.7 framework, as detailed in Table 5.
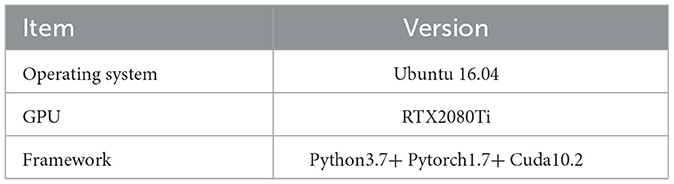
Table 5. Experiment environment.
Prior to training, the pre-trained models from ImageNet were used to initialize the model parameters, while the number of output classes was adjusted to 9 to accommodate the fine-tuning process. The optimizer was set to Adaptive Moment Estimation (Adam). A combination of gradual warm-up and MultiStepLR strategies was used for learning rate scheduling. Specifically, during the first four epochs, the learning rate ε (10−6) linearly increased from this small initial value to the baseline learning rate of 0.001. This approach enabled the classifiers to effectively incorporate prior knowledge while ensuring faster and more stable training. The MultiStepLR milestones were set as 70% and 90% of maximum iterations (20 epochs). Upon reaching each milestone, the learning rate was reduced by a factor of gamma (0.1) relative to the previous value.
To assess the efficacy of data augmentation, experiments were performed on the original imbalanced datasets. The dataset was split into training (72%), validation (8%), and testing (20%) sets. Validation results were averaged over several experimental runs to ensure statistical robustness. Given that the sample count in the class-balanced dataset had increased by a factor of 10.688, the training epochs for the comparative experiments were extended to 200 epochs to ensure fair comparison and balance the impact of different dataset sizes. This adjustment was equivalent to training the model for 10 times longer on the original class-imbalanced dataset.
3.2 Evaluation metrics
In this study, Kappa, recall, precision, and OA were used as the evaluation metrics, with the means of recall and precision values calculated for each category. Recall represents the probability that positive samples from a specific category are correctly classified, while precision represents the probability that samples predicted as belonging to a particular category are actually correctly classified. OA represents the proportion of correctly classified samples relative to the total sample count, and the Kappa measures the agreement between predicted and true labels, accounting for chance agreement. Table 6 presents a typical confusion matrix, with Kappa, precision, recall, and OA computed according to Equations 2–5.
where Pij is the number of samples whose true label is Ci and whose predicted label is Cj, and N is the total number of samples. In addition, the overall performance of results from multiple models can be characterized by mean (Equation 6).
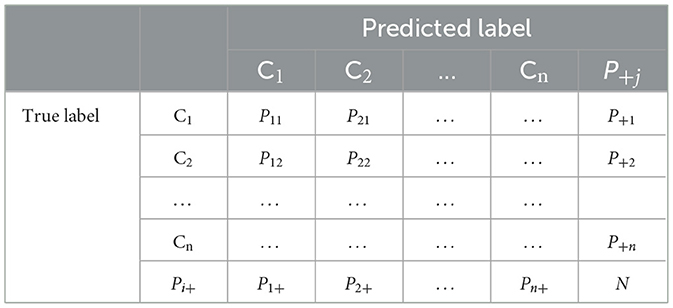
Table 6. Typical confusion matrix.
3.3 Experiment results and analysis
3.3.1 Quantitative analysis
In this study, four models trained on class-imbalanced and class-balanced datasets were compared, i.e., mobilenet-v2, ResNet101, ResNeXt101_32*32d, and Transformer. Tables 7, 8 present the experimental results on the VHR images. The following conclusions can be drawn:
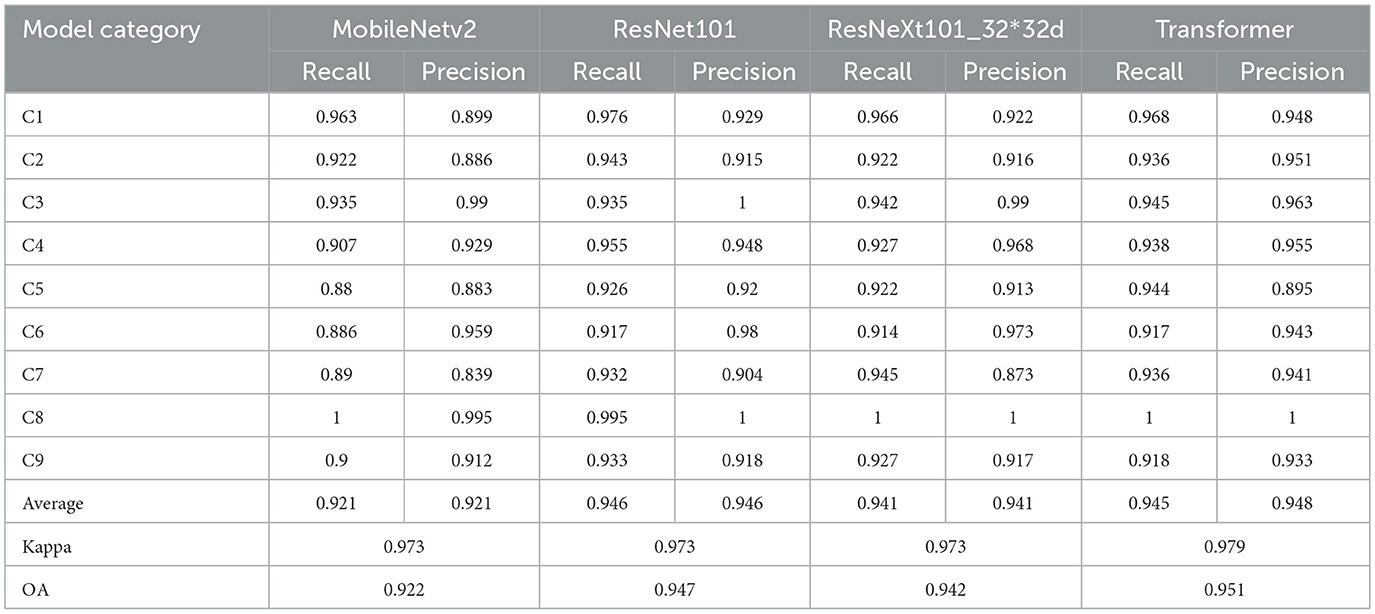
Table 7. Experiment indicators of models on a class-balanced dataset.
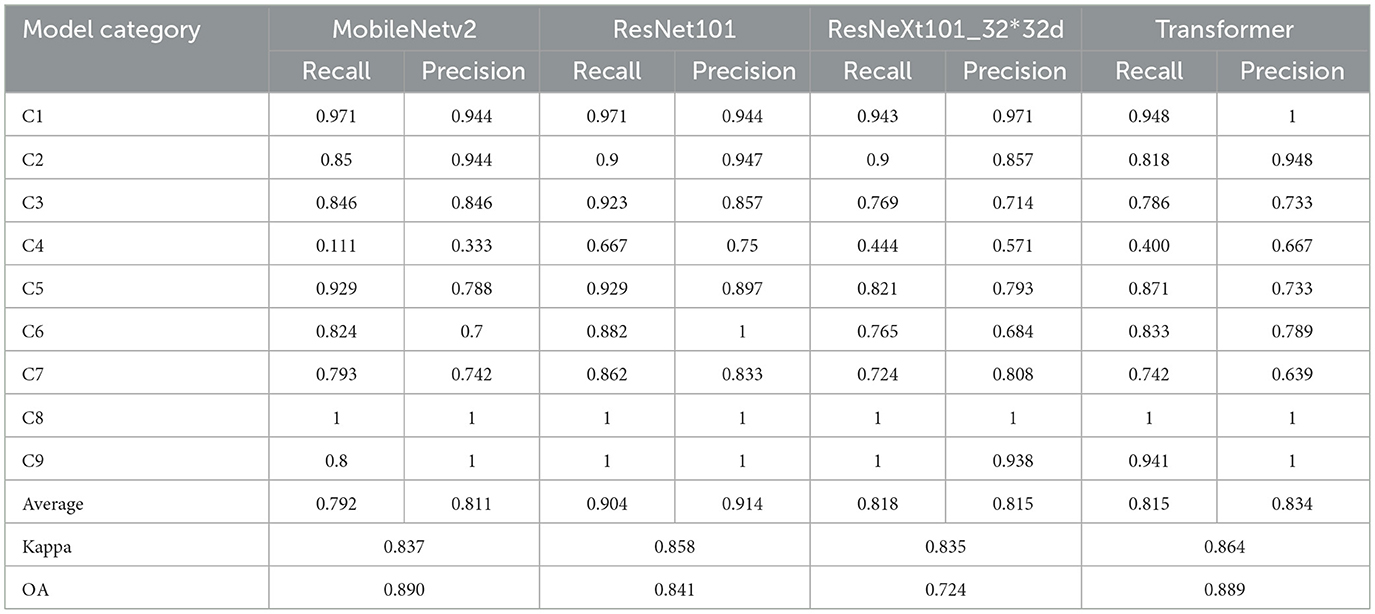
Table 8. Experiment indicators of models on the class-imbalanced dataset.
When evaluated on the class-balanced dataset (Table 7), ResNet101 demonstrated the most consistent performance with the highest minimum values for both recall and precision. Specifically, the lowest recall values were 0.917 for ResNet101 (C6, open-air venues), 0.88 for MobileNet-v2 (C5, low-rise sparse buildings), 0.914 for ResNeXt101_32 × 32d (C6), and 0.917 for Transformer (C6). Similarly, the lowest precision values were 0.904 for ResNet101 (C7, roads), 0.839 for MobileNet-v2 (C7), 0.873 for ResNeXt101_32 × 32d (C7), and 0.941 for Transformer (C7).
Under class-imbalanced conditions (Table 8), the Transformer model exhibited superior overall performance, achieving the highest average recall (0.815) and precision (0.834), followed by ResNet101. However, all models struggled significantly with C4 (intersections), which represents the smallest class proportion (0.037, 68/1,858) in the dataset. The C4 recalls were 0.111 (MobileNet-v2), 0.667 (ResNet101), 0.444 (ResNeXt101_32 × 32d), and 0.400 (Transformer). The corresponding precisions were 0.333, 0.75, 0.571, and 0.667, respectively. Notably, the Transformer model demonstrated more balanced performance across categories, with C4's recall-to-average ratio of 0.490 compared to ResNet101's 0.738.
The C4 category exhibited obvious classification bias (Figure 8) due to its severely limited representation. Among conventional CNN architectures, ResNet101 showed the smallest performance gap for C4 relative to other categories. However, the Transformer architecture demonstrated superior robustness to class imbalance, maintaining more consistent performance across all categories. Conversely, C8 (water), with the highest proportion (0.343, 638/1,858) in the class-imbalanced dataset, achieved near-perfect performance (approaching or reaching 100% recall and precision) across all models. The overall accuracy indicators OA and kappa do not adequately represent individual class performance, particularly for minority classes. The performance ranking based on average recall and precision across categories follows: Transformer > ResNet101 > ResNeXt101_32 × 32d > MobileNet-v2, though this hierarchy is not reflected in the overall OA and Kappa metrics.
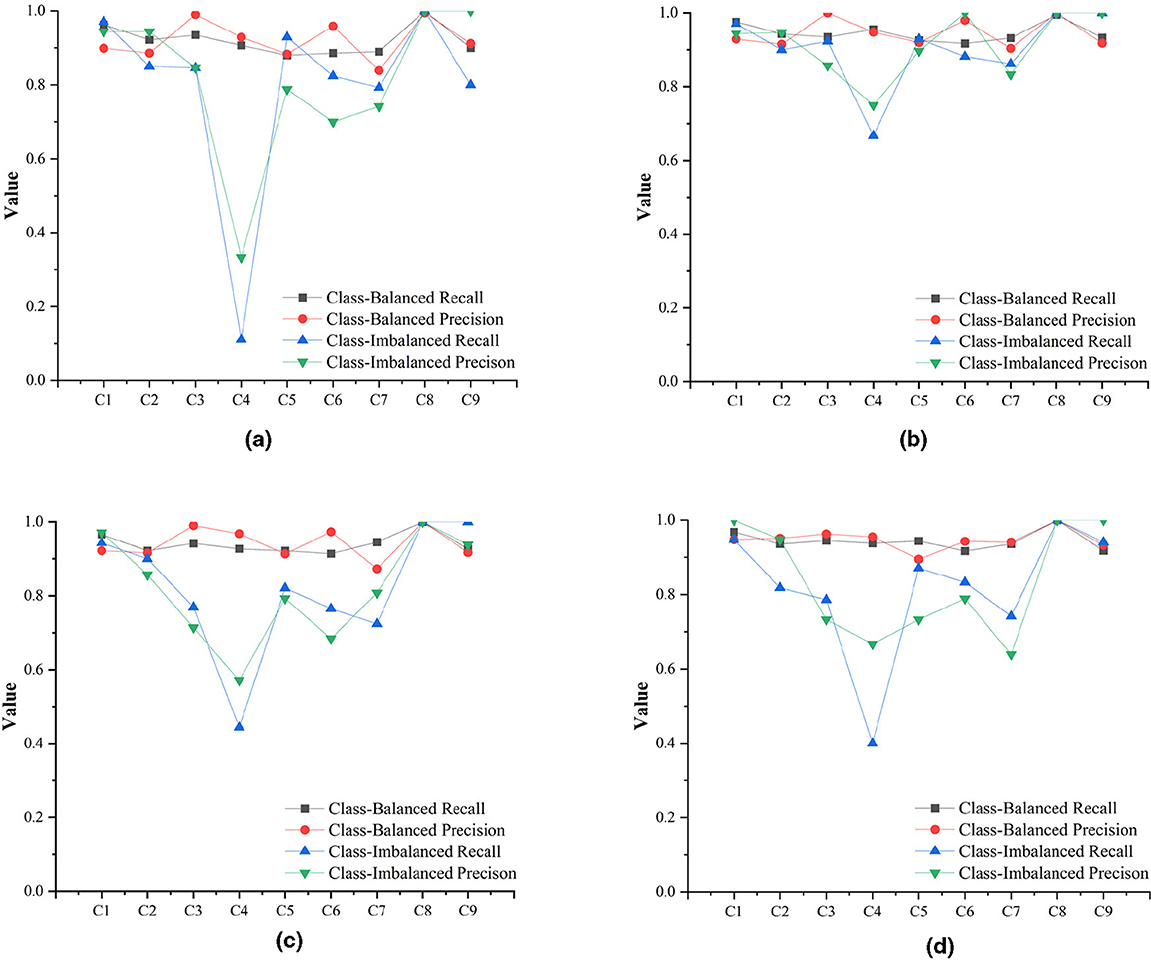
Figure 8. Precision and recall of each category in the three models. (a) MobileNetv2. (b) ResNet101. (c) ResNeXt32*32d. (d) Transformer.
C8, with highest proportion in the class-imbalanced dataset (0.343, 638/1,858), has the highest recall and precision in both class-imbalanced and class-balanced results, approaching or reaching 100%.
Data augmentation led to substantial improvements across all architectures. The average OA increased from 0.815 to 0.939, and the average Kappa increased from 0.840 to 0.975. The Transformer model achieved the highest improvements, with OA increasing from 0.889 to 0.951 and kappa from 0.864 to 0.979. Among CNN architectures, ResNeXt101_32 × 32d showed the largest improvement in OA (0.218), while the Transformer model demonstrated the most significant Kappa improvement (0.115). The results reveal distinct architectural characteristics in handling class imbalance. The Transformer model demonstrated superior overall performance and better stability across imbalanced classes, while ResNet101 showed the most consistent performance among CNN architectures. MobileNet-v2, despite being the most lightweight model, exhibited the greatest sensitivity to class imbalance, particularly for minority classes.
3.3.2 Visualization analysis
Visualization analysis was conducted based on predicted labels and spatial locations for partial areas (120.3499194°E to 120.3778193°E and 36.0440751°N to 36.0613944°N) as shown in Figures 9, 10. Comprehensive comparison demonstrates that models trained on the class-balanced dataset produce results more consistent with satellite imagery, particularly for categories C1 (chaparral), C3 (high-rise sparse buildings), C6 (open-air venues), and C9 (water–land junction). Among class-balanced results, ResNet101 achieved optimal classification for C9 and C4, ResNeXt101_32 × 32d excelled in C5 classification, the Transformer model showed superior performance for C2 and C3, while MobileNet-v2 performed best for C2 in specific regions.
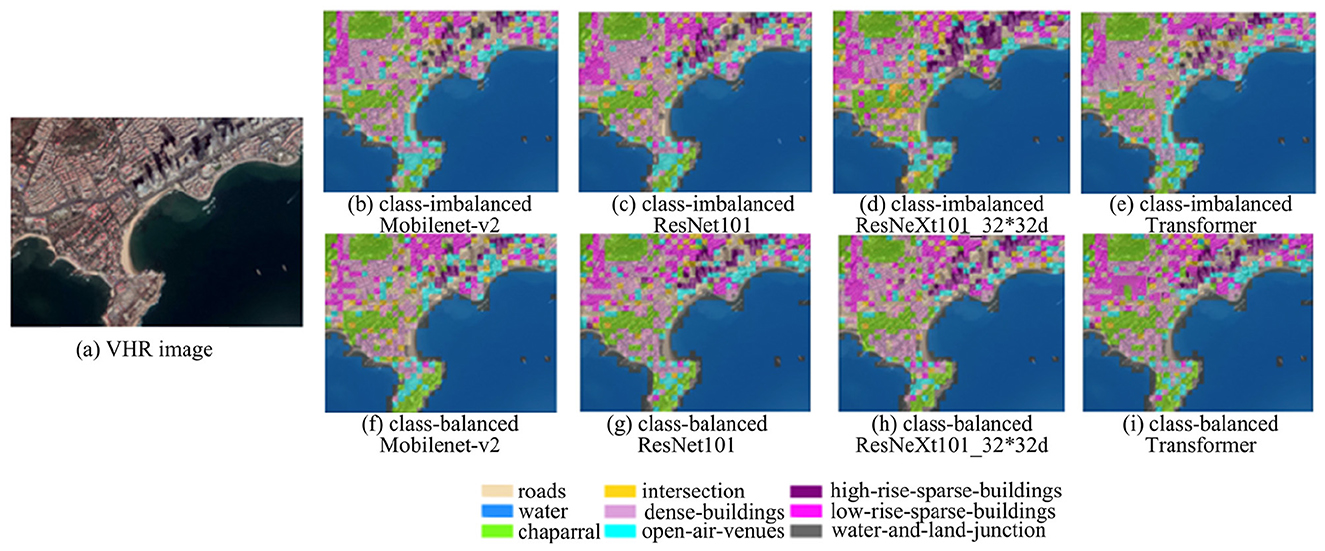
Figure 9. Partial visualization results of the models with the classification legend. (a) is VHR image, (b–e) are Mobilenet-v2, ResNet 101, ResNeXt101_32*32d, Transformer results under class-imbalanced respectively, (f–i) are Mobilenet-v2, ResNet 101, ResNeXt101_32*32d, Transformer results under class-balanced respectively.
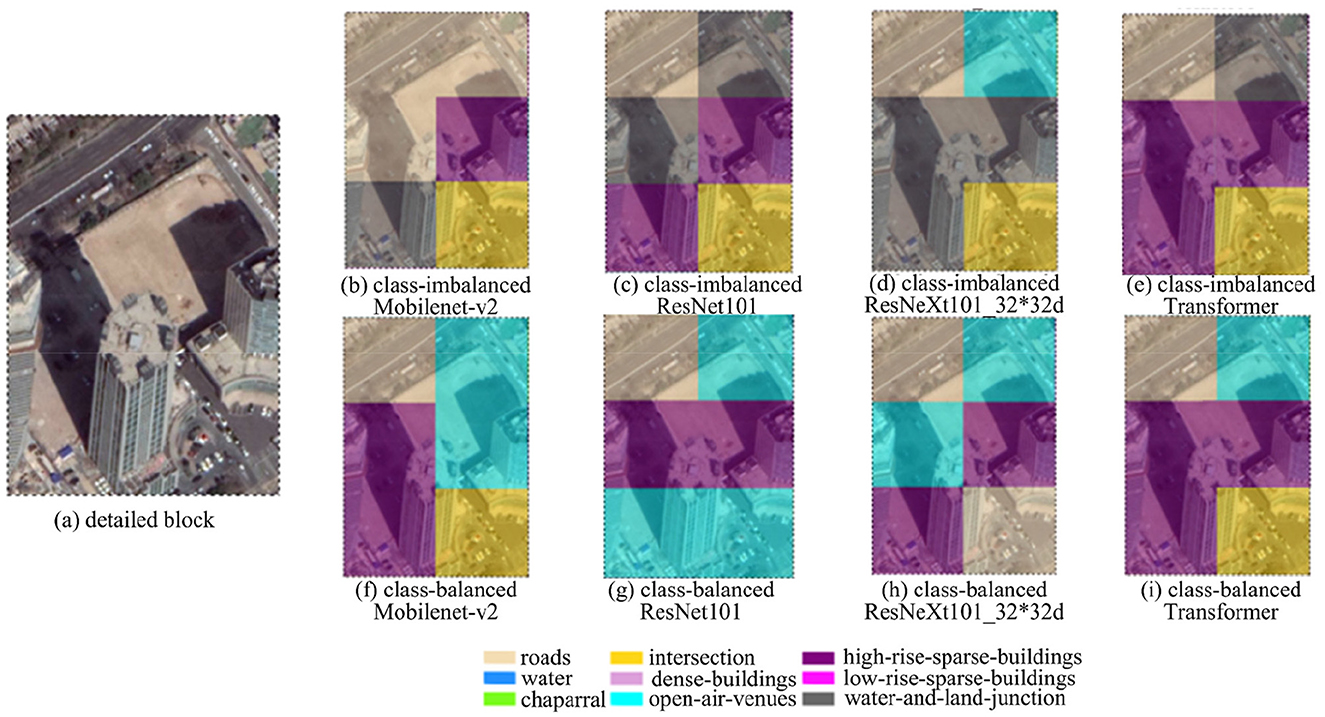
Figure 10. Partial visualization results of the models for the detailed block with a classification legend. (a) is detailed block image, (b–e) are Mobilenet-v2, ResNet 101, ResNeXt101_32*32d, Transformer results under class-imbalanced respectively, (f–i) are Mobilenet-v2, ResNet 101, ResNeXt101_32*32d, Transformer results under class-balanced respectively.
Detailed examination reveals reduced misclassification of C3 building shadows as C9. In addition, the results suggest that RSSC should be considered a multilabel rather than single-label classification task, as individual scene patches typically contain multiple semantic categories, making multicategory representation more appropriate than single-category assignment.
4 Discussion
The relationship between training sample size and class imbalance sensitivity is fundamental to understanding classifier performance in remote sensing applications. The experimental results demonstrate that categories with fewer training samples experience disproportionately greater impact from class imbalance. Specifically, C4 (intersections), representing the minority class with the lowest proportion (0.037, 68/1,858) in the class-imbalanced dataset, exhibited significant classification deviation across all tested architectures. This phenomenon led to poor convergence during training and notable performance degradation for this category. In contrast, C8 (water), the majority class with the highest proportion (0.343, 638/1,858), achieved near-optimal performance due to its abundant training samples and relatively uniform spectral characteristics. Consequently, all models attained recall and precision values approaching 100% for this category.
Comparative analysis between models trained on class-imbalanced and class-balanced datasets reveals substantial improvements across all evaluation metrics, including overall accuracy, Kappa coefficient, recall, and precision. While the water body (C8) showed minimal performance changes due to its already optimal baseline, the intersections (C4) demonstrated remarkable improvements of 72% and 128% in precision and recall, respectively. This pattern confirms that data augmentation provides the greatest benefits for categories with the most limited training samples, effectively addressing the core challenge of class imbalance.
The relationship between architectural complexity and class imbalance robustness reveals counterintuitive patterns that challenge conventional assumptions. MobileNet-v2, despite its lightweight design with a model size approximately 1/18th that of ResNet101 (8.83 MB vs. 162 MB), achieved competitive performance on balanced datasets with only a 2.6% accuracy gap. However, under class-imbalanced conditions, MobileNet-v2 exhibited significant vulnerability, particularly in minority classes, due to its limited model capacity (Kamilaris and Prenafeta-Boldú, 2018). More surprisingly, ResNeXt101_32 × 32d, with model complexity approximately 11 times greater than ResNet101 (1,740 MB vs. 162 MB), demonstrated inferior performance on imbalanced datasets despite incorporating advanced architectural features such as grouped convolutions and residual connections. This counterintuitive result suggests that excessive model complexity may lead to overfitting on majority classes while failing to adequately capture minority class representations. The introduction of Transformer (ViT-B/16) provides additional insights, as it achieved superior overall performance and enhanced stability across imbalanced classes, demonstrating that attention-based mechanisms offer inherent advantages for handling class distribution skew.
RSSC inherently involves semantic complexity that extends beyond traditional class imbalance challenges. Individual scene images frequently encompass multiple ground objects with diverse semantic categories, with semantic classification typically determined by the category with the greatest likelihood (Dunne and Campbell, 1997; Liang et al., 2017). However, results analysis combined with existing literature reveals that semantic categorization becomes fundamentally ambiguous for many scene images due to the inherent complexity and overlap of ground objects. This observation suggests that multilabel classification frameworks may be more appropriate for remote sensing applications, particularly in heterogeneous urban environments.
Furthermore, data augmentation necessitates category-specific adjustments to mitigate the adverse effects of noisy data (Kim et al., 2003; Qi et al., 2018). For example, the cropping scale and position of scene images can influence their semantic category, potentially introducing noisy data through the application of cropping methods. The red-framed region (512*512) in Figure 10, classified as an intersection, is segmented into four distinct scene areas (a, b, c, and d) at a 256*256 scale. Areas a, b, and c can be categorized as road, while area d represents open-air venues, demonstrating a clear divergence in semantic categories across the two cropping scales. Moreover, a horizontal shift of approximately 128 pixels to the right for area “a” reclassifies it as open-air venues, further illustrating the impact of positional variance on semantic categorization. Additional data augmentation techniques, such as inappropriate rotation angles and excessive HSV disturbance amplitudes, may also contribute to the introduction of noisy data within the dataset.
While conventional augmentation methods prove effective, there remains significant potential for developing specialized techniques that better exploit the unique characteristics of remote sensing data. Future research should explore domain-specific augmentation strategies, including atmospheric variation simulation, multispectral band manipulation, and temporal augmentation that incorporates seasonal and diurnal variations. Such approaches could further enhance performance while maintaining semantic consistency specific to remote sensing imagery characteristics.
5 Conclusion
Addressing the classification bias caused by class imbalance in RSSC tasks, this study investigated the feasibility of using data augmentation to mitigate class imbalance issues. Four architectures, MobileNet-v2, ResNet101, ResNeXt101_32 × 32d, and Transformer, were selected and fine-tuned using VHR imagery from Shinan district and its surrounding areas. A class-imbalanced high-resolution remote sensing image dataset was constructed, and comprehensive data augmentation methods (mirroring, rotation, cropping, HSV perturbation, and gamma transformation) were used to alleviate the class imbalance problem. The impact of class imbalance on classifier performance was systematically analyzed across all architectures. The results demonstrate that data augmentation represents a realistic and effective approach to mitigating class imbalance problems. Classification bias for minority classes was significantly reduced, with overall performance improvements observed across all classifiers. Among the evaluated models, the Vision Transformer exhibited superior robustness to class imbalance, while ResNet101 demonstrated the most consistent performance among CNN architectures.
Future studies should address several identified limitations. First, inter-class similarity between defined semantic categories artificially increases classification difficulty. Subsequent research should optimize category definitions and sample selection criteria to minimize inter-class confusion while maintaining operational relevance. Second, this study primarily compared performance between severely imbalanced and artificially balanced datasets without exploring intermediate imbalance scenarios. Future investigations should systematically examine varying imbalance ratios, including extreme cases with IR exceeding 100 and long-tailed distributions commonly encountered in large-scale remote sensing applications. In addition, the integration of domain-specific augmentation techniques and multilabel classification frameworks represents promising directions for enhancing model robustness while accommodating the inherent semantic complexity of remote sensing scenes.
Data availability statement
The raw data supporting the conclusions of this article will be made available by the authors, without undue reservation.
Author contributions
PW: Writing – original draft, Writing – review & editing. XZ: Writing – original draft, Writing – review & editing. YC: Writing – original draft, Writing – review & editing. LZ: Writing – review & editing.
Funding
The author(s) declare that financial support was received for the research and/or publication of this article. This article has been supported by the funds of the National Natural Science Foundation of China (41971339) and the State Key Laboratory of Synthetical Automation for Process Industries (Northeastern University) [SAPI-2024-KFKT-08].
Conflict of interest
The authors declare that the research was conducted in the absence of any commercial or financial relationships that could be construed as a potential conflict of interest.
Generative AI statement
The author(s) declare that no Gen AI was used in the creation of this manuscript.
Any alternative text (alt text) provided alongside figures in this article has been generated by Frontiers with the support of artificial intelligence and reasonable efforts have been made to ensure accuracy, including review by the authors wherever possible. If you identify any issues, please contact us.
Publisher's note
All claims expressed in this article are solely those of the authors and do not necessarily represent those of their affiliated organizations, or those of the publisher, the editors and the reviewers. Any product that may be evaluated in this article, or claim that may be made by its manufacturer, is not guaranteed or endorsed by the publisher.
References
Bria, A., Marrocco, C., and Tortorella, F. (2020). Addressing class imbalance in deep learning for small lesion detection on medical images. Comput. Biol. Med. 120:103735. doi: 10.1016/j.compbiomed.2020.103735
Buda, M., Maki, A., and Mazurowski, M. A. (2018). A systematic study of the class imbalance problem in convolutional neural networks. Neural Netw. 106, 249–259. doi: 10.1016/j.neunet.2018.07.011
Cheng, G., Han, J., and Lu, X. (2017). Remote sensing image scene classification: benchmark and state of the art. Proc. IEEE 105, 1865–1883. doi: 10.1109/JPROC.2017.2675998
Cheng, G., Sun, X., Li, K., Guo, L., and Han, J. (2022). Perturbation-seeking generative adversarial networks: a defense framework for remote sensing image scene classification. IEEE Trans. Geosci. Remote Sens. 60:5605111. doi: 10.1109/TGRS.2021.3081421
Cheng, G., Xie, X., Han, J., Guo, L., and Xia, G. S. (2020). Remote sensing image scene classification meets deep learning: challenges, methods, benchmarks, and opportunities. IEEE J. Sel. Top. Appl. Earth Obs. Remote Sens. 13, 3735–3756. doi: 10.1109/JSTARS.2020.3005403
Deng, J., Wang, Q., and Liu, N. (2024). Masked second-order pooling for few-shot remote-sensing scene classification. IEEE Geosci. Remote Sens. Lett. 21, 1–5. doi: 10.1109/LGRS.2023.3344840
Douzas, G., Bacao, F., and Last, F. (2018). Improving imbalanced learning through a heuristic oversampling method based on k-means and SMOTE. Inf. Sci. 465, 1–20. doi: 10.1016/j.ins.2018.06.056
Du, B., Xiong, W., Wu, J., Zhang, L., Zhang, L., and Tao, D. (2017). Stacked convolutional denoising auto-encoders for feature representation. IEEE Trans. Cybern. 47, 1017–1027. doi: 10.1109/TCYB.2016.2536638
Dunne, R., and Campbell, N. (1997). “On the pairing of the softmax activation and cross-entropy penalty functions and the derivation of the softmax activation function,” in Proceedings of the 8th Australasian Conference on Neural Networks, Vol. 181 (Melbourne, VIC: Citeseer), 185.
Feng, W., Huang, W., and Bao, W. (2019). Imbalanced hyperspectral image classification with an adaptive ensemble method based on SMOTE and rotation forest with differentiated sampling rates. IEEE Geosci. Remote Sens. Lett. 16, 1879–1883. doi: 10.1109/LGRS.2019.2913387
Fernández, A., García, S., Herrera, F., and Chawla, N. V. (2018). SMOTE for learning from imbalanced data: progress and challenges, marking the 15-year anniversary. J. Artif. Intell. Res. 61, 863–905. doi: 10.1613/jair.1.11192
Gu, Y., Wang, Y., and Li, Y. (2019). A survey on deep learning-driven remote sensing image scene understanding: scene classification, scene retrieval and scene-guided object detection. Appl. Sci. 9:2110. doi: 10.3390/app9102110
Guan, J., Liu, J., Sun, J., Feng, P., Shuai, T., and Wang, W. (2020). “Meta metric learning for highly imbalanced aerial scene classification,” in ICASSP 2020 - 2020 IEEE Int. Conf. Acoust. Speech Signal Process (Harbin: College of Computer Science and Technology, Harbin Engineering University; Beijing: China State Key Laboratory of Space-Ground Integrated Information Technology), 4042–4046. doi: 10.1109/ICASSP40776.2020.9052900
Harjoseputro, Y., Yuda, I. P., and Danukusumo, K. P. (2020). MobileNets: efficient convolutional neural network for identification of protected birds. Int. J. Adv. Sci. Eng. Inf. Technol. 10, 2290–2296. doi: 10.18517/ijaseit.10.6.10948
He, K., Zhang, X., Ren, S., and Sun, J. (2016). “Deep residual learning for image recognition kaiming,” in Proceedings of the Proceedings of the IEEE Conference on Computer Vision and Pattern Recognition (Las Vegas, NV: IEEE), 770–778. doi: 10.1109/CVPR.2016.90
Howard, A., Wang, W., Chu, G., Chen, L., Chen, B., and Tan, M. (2019). “Searching for MobileNetV3 accuracy vs MADDs vs model size,” in 2019 IEEE/CVF International Conference on Computer Vision (ICCV) (Seoul: IEEE), 1314–1324. doi: 10.1109/ICCV.2019.00140
Hu, J., Shen, L., and Sun, G. (2018). “Squeeze-and-excitation networks,” in Proceedings of the IEEE Conference on Computer Vision and Pattern Recognition, 7132–7141.
Johnson, J. M., and Khoshgoftaar, T. M. (2019). Survey on deep learning with class imbalance. J. Big Data 6:27. doi: 10.1186/s40537-019-0192-5
Kamilaris, A., and Prenafeta-Boldú, F. X. (2018). Deep learning in agriculture: a survey. Comput. Electron. Agric. 147, 70–90. doi: 10.1016/j.compag.2018.02.016
Kim, W., Choi, B. J., Hong, E. K., Kim, S. K., and Lee, D. (2003). A taxonomy of dirty data. Data Min. Knowl. Discov. 7, 81–99. doi: 10.1023/A:1021564703268
Leevy, J. L., Khoshgoftaar, T. M., Bauder, R. A., and Seliya, N. (2018). A survey on addressing high-class imbalance in big data. J. Big Data 5:42. doi: 10.1186/s40537-018-0151-6
Lewis, P. A. W., McKenzie, E., and Hugus, D. K. (1989). Gamma processes. Commun. Stat. Stoch. Model. 5, 1–30. doi: 10.1080/15326348908807096
Liang, X., Wang, X., Lei, Z., Liao, S., and Li, S. Z. (2017). “Soft-margin softmax for deep classification,” in Lect. Notes Comput. Sci. (Including Subser. Lect. Notes Artif. Intell. Lect. Notes Bioinformatics), vol. 10635 (Cham: Springer), 413–421. doi: 10.1007/978-3-319-70096-0_43
Liu, B., and Tsoumakas, G. (2020). Dealing with class imbalance in classifier chains via random undersampling. Knowl. -Based Syst. 192:105292. doi: 10.1016/j.knosys.2019.105292
Liu, X., Zhou, Y., Zhao, J., Yao, R., Liu, B., and Zheng, Y. (2019). Siamese convolutional neural networks for remote sensing scene classification. IEEE Geosci. Remote Sens. Lett. 16, 1200–1204. doi: 10.1109/LGRS.2019.2894399
Luque, A., Carrasco, A., Martín, A., and de las Heras, A. (2019). The impact of class imbalance in classification performance metrics based on the binary confusion matrix. Pattern Recognit. 91, 216–231. doi: 10.1016/j.patcog.2019.02.023
Ma, D., Tang, P., and Zhao, L. (2019). SiftingGAN: generating and sifting labeled samples to improve the remote sensing image scene classification baseline in vitro. IEEE Geosci. Remote Sens. Lett. 16, 1046–1050. doi: 10.1109/LGRS.2018.2890413
Qi, Z., Wang, H., Li, J., and Gao, H. (2018). Impacts of dirty data: and experimental evaluation. arXiv preprint arXiv:1803.06071.
Ren, Y., Zhang, X., Ma, Y., Yang, Q., Wang, C., Liu, H., et al. (2020). Full convolutional neural network based on multi-scale feature fusion for the class imbalance remote sensing image classification. Remote Sens. 12, 1–21. doi: 10.3390/rs12213547
Sandler, M., Howard, A., Zhu, M., and Zhmoginov, A. (2018). “MobileNetV2: inverted residuals and linear bottlenecks,” in 018 IEEE/CVF Conference on Computer Vision and Pattern Recognition (Salt Lake City, UT: IEEE), 4510–4520. doi: 10.1109/CVPR.2018.00474
Shi, Z., Feng, Y., Zhao, M., Zhang, E., and He, L. (2020). Normalised gamma transformation-based contrast-limited adaptive histogram equalisation with colour correction for sand-dust image enhancement. IET Image Process. 14, 747–756. doi: 10.1049/iet-ipr.2019.0992
Szegedy, C., Liu, W., Jia, Y., Sermanet, P., Reed, S., Anguelov, R., et al. (2015). “Going deeper with convolutions”, in In Proceedings of the Proceedings of the IEEE Conference on Computer Vision and Pattern Recognition (Boston, MA: IEEE), 1–9. doi: 10.1109/CVPR.2015.7298594
Tang, X., Ma, Q., Zhang, X., Liu, F., Ma, J., and Jiao, L. (2021). Attention consistent network for remote sensing scene classification. IEEE J. Sel. Top. Appl. Earth Obs. Remote Sens. 14, 2030–2045. doi: 10.1109/JSTARS.2021.3051569
Thabtah, F., Hammoud, S., Kamalov, F., and Gonsalves, A. (2020). Data imbalance in classification: experimental evaluation. Inf. Sci. 513, 429–441. doi: 10.1016/j.ins.2019.11.004
Xie, S., Girshick, R., and Doll, P. (2017). “Aggregated residual transformations for deep,” in 2017 IEEE Conference on Computer Vision and Pattern Recognition (CVPR) (Honolulu, HI: IEEE), 1492–1500. doi: 10.1109/CVPR.2017.634
Yessou, H., Sumbul, G., and Demir, B. (2020). “A comparative study of deep learning loss functions for multi-label remote sensing image classification,” in IGARSS 2020 - 2020 IEEE International Geoscience and Remote Sensing Symposium (Waikoloa, HI: IEEE), 1349–1352. doi: 10.1109/IGARSS39084.2020.9323583
Yosinski, J., Clune, J., Bengio, Y., and Lipson, H. (2014). How transferable are features in deep neural networks? Adv. Neural Inf. Process. Syst. 4, 3320–3328. doi: 10.48550/arXiv.1411.1792
Yu, Y., Li, X., and Liu, F. (2020). Attention GANs: unsupervised deep feature learning for aerial scene classification. IEEE Trans. Geosci. Remote Sens. 58, 519–531. doi: 10.1109/TGRS.2019.2937830
Zhao, J., Kong, L., and Lv, J. (2025). An overview of deep neural networks for few-shot learning. Big Data Min. Anal. 8, 145–188. doi: 10.26599/BDMA.2024.9020049
Zhao, Y., Chen, Y., Xiong, S., Lu, X., Zhu, X. X., and Mou, L. (2024a). Co-enhanced global-part integration for remote-sensing scene classification. IEEE Trans. Geosci. Remote Sens. 62, 1–14. doi: 10.1109/TGRS.2024.3367877
Keywords: remote sensing image scene classification, class-imbalance, deep learning, fine-tune, data augment
Citation: Wang P, Zhao X, Chen Y and Zhan L (2025) Improving remote sensing scene classification with data augmentation techniques to mitigate class imbalance. Front. Comput. Sci. 7:1613648. doi: 10.3389/fcomp.2025.1613648
Received: 18 April 2025; Accepted: 18 September 2025;
Published: 08 October 2025.
Edited by:
Marcello Pelillo, Ca' Foscari University of Venice, ItalyReviewed by:
Zhen Shen, Nanyang Institute of Technology, ChinaNanqing Liu, Southwest Jiaotong University, China
Yue Zhao, Xidian University, China
Copyright © 2025 Wang, Zhao, Chen and Zhan. This is an open-access article distributed under the terms of the Creative Commons Attribution License (CC BY). The use, distribution or reproduction in other forums is permitted, provided the original author(s) and the copyright owner(s) are credited and that the original publication in this journal is cited, in accordance with accepted academic practice. No use, distribution or reproduction is permitted which does not comply with these terms.
*Correspondence: Lili Zhan, c2tkOTkyMDE2QHNkdXN0LmVkdS5jbg==
†These authors have contributed equally to this work and share first authorship