 Xia Ou
 Hongbing Cheng*
- College of Computer Science and Technology, Zhejiang University of Technology, Hangzhou, China
Introduction: With the rapid development of 5G technology, Mobile Edge Computing (MEC) has become a critical component of next-generation network infrastructures. The efficient deployment of edge servers (ESs) is essential for enhancing service quality (QoS). However, existing deployment methods often fail in large-scale, high-density scenarios due to heterogeneous user distributions and highly variable task loads.
Methods: To address these challenges, we propose a Spectral Clustering and Double Deep Q-Network-based edge server deployment method (SDD). First, spectral clustering is applied to extract spatial features such as base station locations, dividing them into clusters and identifying candidate deployment centers. A reinforcement learning environment guided by the clustering structure is then constructed. A Double Deep Q-Network (DDQN) framework is introduced to jointly optimize server deployment and task load distribution.
Results: The proposed approach improves deployment efficiency and service quality by balancing system load and reducing service delay. We conduct large-scale experiments using a real base station dataset from the Shanghai Telecom Bureau. Our method is compared with multiple baselines, including Random, Improved Top-K, K-means, and ESL.
Discussion: The experimental results demonstrate that our method outperforms existing approaches in both delay reduction and load balancing. These findings validate the effectiveness and practicality of the proposed SDD framework in large-scale MEC environments.
1 Introduction
With the continuous advancement of 5G technology, modern communication systems face increasingly stringent requirements for low latency, high bandwidth, and high reliability (Zhou et al., 2021a). To address these challenges, mobile or multi-access edge computing (MEC) has emerged as a promising computing paradigm. MEC shifts computing and storage resources from centralized cloud infrastructures to distributed nodes located at the edge of the network (Zhang J. et al., 2023; Pang et al., 2023). This architecture enables end users to access computational services in closer proximity, thereby alleviating the burden on the core network and significantly reducing the service response time (Yi et al., 2023). The distributed and low-latency nature of MEC makes it particularly well suited for time-sensitive applications such as intelligent transportation systems, the industrial Internet of Things (IIoT), and augmented reality (AR) (Ning et al., 2023; Zhou H. et al., 2023).
Edge server deployment plays a crucial role in the edge computing architecture (Vali et al., 2024). It involves the strategic positioning of multiple edge servers within a designated area, such as a smart city, to deliver computing services to a wide array of Internet of Things (IoT) devices (Zhou et al., 2021b; Lovén et al., 2020). More specifically, the deployment process entails determining both the number and optimal locations of edge servers, taking into account factors such as the geographic distribution of users or devices, service demand, and network connectivity (Cong et al., 2024). The primary objectives are to ensure the efficient allocation of computing resources and to maximize the coverage and quality of edge services.
Many studies have attempted to deploy edge servers closer to end users to reduce transmission latency and improve service responsiveness (Vali et al., 2024; Qin et al., 2021). However, these methods often ignore key factors such as the dynamic nature of task workloads, which makes maintaining good adaptability in complex and changing edge computing environments difficult. Several studies have considered the time-varying characteristics of workloads and proposed deployment strategies based on machine learning or other data-driven approaches to improve adaptability and enable more intelligent resource allocation (Chen et al., 2023; Zhang H. et al., 2023). However, in practical scenarios, the number of base stations is already large and continues to grow. For example, it is estimated that more than 50 5G base stations will be deployed per square kilometer in Shanghai in the near future (Zhang et al., 2024). This dense infrastructure scale poses significant challenges to the computational efficiency and scalability of existing methods. Therefore, the design of a deployment solution that ensures service quality (QoS) while achieving high scalability and efficiency has become a critical issue that must be addressed.
To address the above challenges, we propose an efficient edge server deployment strategy. Specifically, considering the uneven user distribution and significant variation in task loads in edge computing environments, our design strategy is to adopt reinforcement learning. Reinforcement learning possesses strong adaptability to dynamic environments and can adjust deployment strategies based on real-time state observations (Tang et al., 2024), thus showing great potential in edge server placement problems. However, traditional reinforcement learning methods typically rely on end-to-end modeling and training. In large-scale base station scenarios, such approaches often lead to an excessively large action space, which significantly reduces training efficiency and limits scalability. To overcome these limitations, we propose two key improvements. First, we employ spectral clustering to model spatial similarity among base stations, identify potential service regions, and determine initial candidate deployment locations. This step effectively reduces the action space size and improves the deployment decisions' structure and efficiency. Second, we survey various deep reinforcement learning algorithms and find that double deep Q-networks (DDQN) are effective in mitigating Q-value overestimation, thereby enhancing the convergence and stability of the learning process. Based on the clustering results, we further apply a DDQN to jointly optimize the deployment of edge servers and the allocation of task loads, with the aim of improving both service quality and system deployment efficiency. The main contributions of this study are summarized as follows:
• We construct an edge server deployment optimization model that comprehensively considers two key performance metrics: access latency and load balance.
• To achieve the optimization goal, we propose an edge server deployment strategy named spectral clustering and double deep Q-network-based deployment (SDD). First, spectral clustering is used to divide base stations into spatial clusters and identify candidate deployment regions. Then, a DDQN framework is applied to jointly optimize the server placement and workload allocation. This method improves both service quality and system efficiency while ensuring load balance.
• To evaluate the effectiveness of the proposed method, we conduct extensive experiments on a real base station dataset provided by the Shanghai Telecom Bureau. The results show that SDD outperforms several baseline algorithms in terms of access latency reduction and load balancing.
The remainder of the paper is organized as follows. Section 2 describes related works. Section 3 introduces our edge computing physical model and its formal definitions. Section 4 introduces the edge server deployment strategy SDD. Section 5 presents our experimental results and analysis. Finally, Section 6 concludes the paper and discusses directions for future work.
2 Related work
In this section, we review recent research on edge server deployment and analyze the key differences between existing methods and our approach. The specific differences are summarized in Table 1.
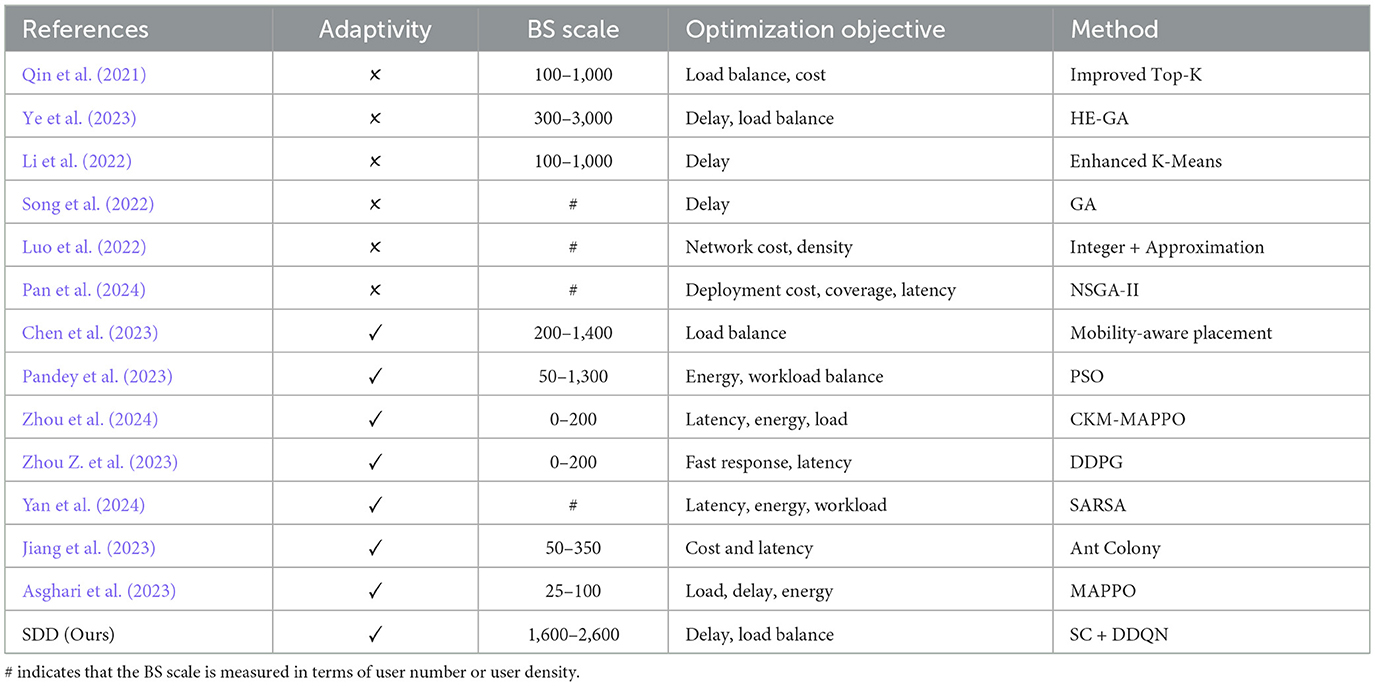
Table 1. The differences between our work and existing studies.
2.1 Static edge server deployment
Many exciting researchers have proposed edge server deployment strategies to improve service performance in various application scenarios. For example, (Qin et al. 2021) proposed an improved Top-K algorithm for edge server deployment in smart city IoT applications, with the aim of optimizing server load balancing and reducing deployment costs. By considering factors such as the distance between base stations and edge servers, the weight ratio of base station workloads, and server coverage, their method enhances both quality of experience (QoE) and the quality of service (QoS). (Ye et al. 2023) proposed a deployment method based on the optimal benefit quantity and a genetic algorithm to determine the number and placement of edge servers. (Li et al. 2022) presented an improved K-means clustering-based approach for optimizing the number and locations of edge servers in multi-base station scenarios. (Song et al. 2022) introduced a joint optimization strategy for edge server placement and user task offloading in wireless edge networks based on a genetic algorithm, with the aim of minimizing average service delay via efficient deployment under low-latency constraints. (Luo et al. 2022) proposed a cost-effective edge server network design (ESND) method to balance network density and construction costs, thereby enhancing resource sharing and service performance among edge servers in MEC environments. The literature (Pan et al., 2024; Pandey et al., 2023) used multi-objective non-linear optimization and genetic algorithms to address deployment challenges in various scenarios, such as smart manufacturing and smart cities, with a focus on deployment costs, load balancing, and energy optimization. Although existing methods have made progress in edge server deployment, most of them lack in-depth modeling and responsive mechanisms for varying environmental characteristics, task requirements, and system states, thus resulting in limited adaptability under different scenarios and workload conditions.
2.2 Dynamic edge server deployment
In recent years, various adaptive edge server deployment strategies have been proposed to improve the responsiveness and robustness of deployment decisions in dynamic and complex environments. (Chen et al. 2023) designed a mobility-aware placement method to address the load imbalance caused by users' changing points of interest. Zhang H. et al. (2023) developed a two-tier digital twin model and a multistage adaptive deployment optimization algorithm (Multi-AJDO) to capture the dynamics of MEC networks and efficiently deploy digital twin servers. (Zhou et al. 2024) proposed CKM-MAPPO, which is a multi-agent reinforcement learning-based strategy for multiobjective optimization in vehicular networks that focuses on improving load balance while reducing latency and energy consumption. In another study, Zhou Z. et al. (2023) introduced CFD, which is a deployment algorithm based on the deep deterministic policy gradient (DDPG) for achieving fast response in vehicular scenarios. (Yan et al. 2024) presented ESL, which is a SARSA-based deployment strategy, to address workload imbalance, latency, and energy efficiency in IoMT environments. Although these approaches differ in their algorithmic implementation, which range from reinforcement learning to digital twin modeling and heuristic adjustment, they share a common goal: to increase the adaptability of edge server deployment under time-varying workloads, user mobility, and system dynamics. (Jiang et al. 2023) addressed the issue of dynamic environments in mobile edge computing and proposed a deep reinforcement learning-based server placement strategy. They employed D3QN and PPO algorithms to optimize different deployment objectives and utilized image-based state encoding to improve decision-making efficiency. (Asghari et al. 2023) focused on problems such as regional load imbalance and server migration cost. They proposed a hybrid edge server deployment mechanism that combines a modified Red Deer Optimization algorithm with Markov game theory. Their method integrates both static initial placement and dynamic migration strategies to enhance overall resource utilization. (Bahrami et al. 2023) tackled the challenges of high energy consumption and delayed deployment decisions. They introduced an energy-aware edge server placement strategy based on Deep Q-Learning. By dynamically adjusting the server positions, their approach aims to reduce energy usage and service latency while maintaining quality of service. Although the above methods demonstrate a certain level of adaptability, their scalability remains limited in large-scale edge computing scenarios, which makes balancing deployment efficiency and overall system performance difficult.
Overall, the proposed method differs from existing approaches in that it places greater emphasis on adaptability to environmental variations, flexibility in strategy design, and scalability in large-scale deployment scenarios.
3 Research scenario and model establishment
In this part, we define the system model for edge computing along with several formal definitions, as detailed below. The main notations and their meanings are listed in Table 2.
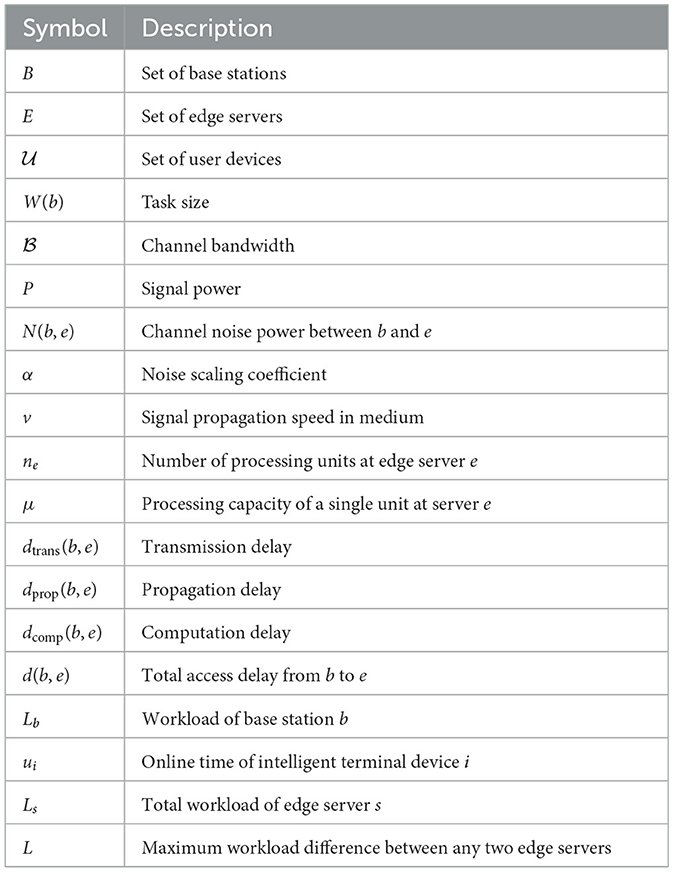
Table 2. Notations and descriptions.
3.1 System model
As illustrated in Figure 1, the edge computing system considered in this study adopts a three-tier architecture that consists of a device layer, an edge layer, and a cloud layer. We let B = {b1, b2, ⋯ , bN} denote the set of N base stations (BSs) and let represent the set of mobile user devices. Each base station bi ∈ B serves nearby user terminals and offloads their computational tasks to an associated edge server. We assume that K base stations are selected to deploy edge servers (ESs), which form the edge server set E = {e1, e2, ⋯ , eK}, where each ek ∈ E is colocated with a bi ∈ B. We let ϕ:B→E denote the association mapping from base stations to edge servers such that each bi is connected to exactly one edge server. Accordingly, the base stations are partitioned into K disjoint subsets Bk⊆B such that We denote the coordinates of base station bi and edge server ek as (xi, yi) and (xk, yk), respectively. The Euclidean distance between them is as follows:
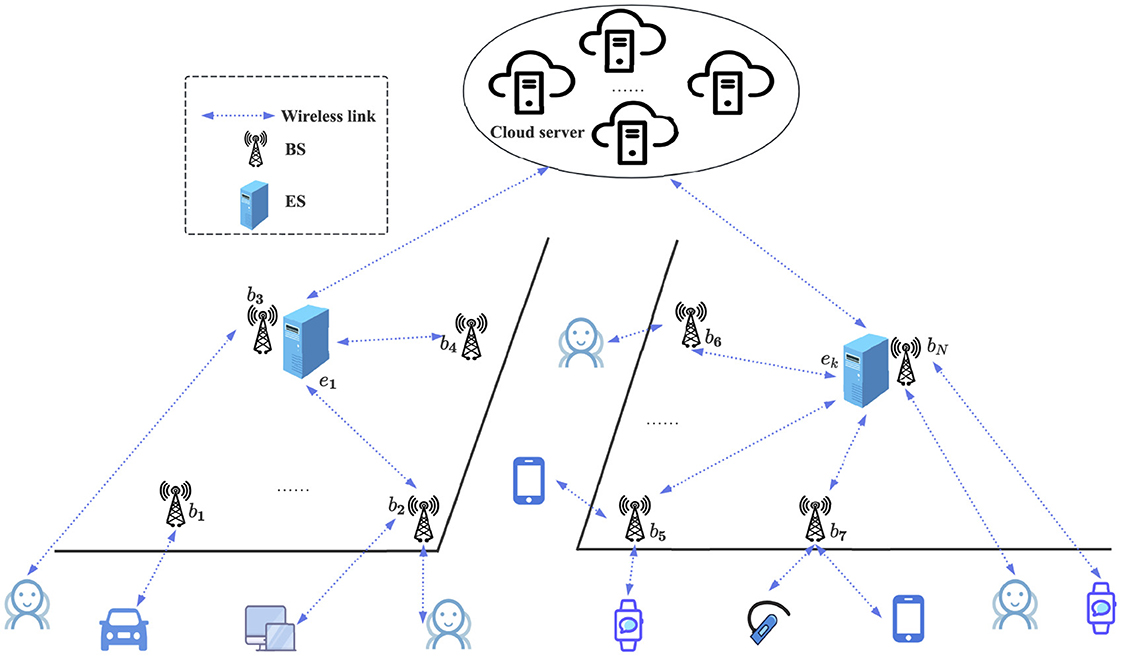
Figure 1. Diagram of Mobile edge computing architecture.
If an edge server becomes overloaded, part of its workload is offloaded to a remote cloud server to ensure service continuity and maintain overall system performance.
3.2 Access delay model
In edge computing systems, the total delay experienced by a user request typically comprises three main components: transmission delay, propagation delay, and computation delay. The backhaul delay is not considered in this study because we assume high-speed wired connections between edge servers and base stations, making it negligible compared to the other delay components. Specifically, transmission delay refers to the time required to send task data from a base station to an edge server; propagation delay represents the time taken for the signal to physically traverse the transmission medium; and computation delay denotes the time needed for the edge server to process the task. These three types of delay jointly determine the overall system performance and are therefore considered in the system design.
Transmission delay: The transmission delay from base station b to edge server e is computed based on Shannon's channel capacity formula (Taub and Schilling, 1991). Given a task of size W(b) (in bits), the delay is defined as:
where denotes the channel bandwidth, P is the received signal power, and N(b, e) = α·dis(b, e) represents the noise power, which is assumed to increase linearly with the distance dis(b, e) between b and e. The parameter α is a noise scaling coefficient.
Propagation delay: The propagation delay captures the physical time required for signal transmission between the base station and the edge server, and is calculated by:
where dis(b, s) is the physical distance between b and e, and v is the signal propagation speed in the medium.
Computation delay: The computation delay depends on the task size and the processing capacity of the edge server. Assuming that edge server e has ne processing units, each with a computation rate μ (in bit/s), the delay is computed as:
Total delay: Combining the above components, the total delay for task processing from base station b to edge server s is given by:
3.3 Workload model
Workload Evaluation Metrics are used to quantify the load situation and performance of edge servers. They represent the total amount of resources and time required to complete tasks or provide services. Any computational task or application running on a computing device can be regarded as workload. In this study, the workload of an edge server s is defined as the total workload of all base stations served by this edge server, denoted by Ls:
where Bs⊆B represents the set of base stations served by edge server s, and Lb is the workload of base station b. It can be formulated as follows:
where denotes the set of terminal devices associated with base station b, and ui represents the online time of terminal device i.
Under this deployment scheme, the workload difference between any two edge servers can be expressed as L.
In this equation, Li and Lj represent the workloads of edge server i and edge server j, respectively. The formula expresses the workload difference between two edge servers. The smaller the value of L, the more balanced the workloads between the two edge servers.
3.4 Problem definition
The core issue of this study is how to select and deploy edge servers to appropriate locations in order to achieve low latency and balanced workloads. This problem is a multi-objective optimization problem that requires a trade-off between the following two objectives: (1) Minimizing user access latency to improve user experience. (2) Achieving load balancing of edge servers to optimize system performance. Therefore, the optimization objectives of this problem can be formally defined as follows:
Subject to
Equations 9, 10 define the two optimization objectives: minimizing average latency and balancing workload, and Equations 11–14 are the constraints of the objective function. Equation 11 ensures that each base station is assigned to exactly one edge server. Equation 12 specifies the binary nature of the assignment variable χbe. Equation 13 guarantees that a base station can only connect to edge servers within a predefined maximum service range dmax. Equation 14 ensures that the workload of each edge server does not exceed its maximum processing capacity Lmax.
4 Edge server placement strategy based on SDD
4.1 Overview of the SDD strategy
This paper proposes a two-phase edge server deployment strategy based on spectral clustering and DDQN, referred to as Spectral-DDQN Deployment (SDD). The strategy aims to improve load balance, reduce delay, and enhance deployment efficiency in mobile edge computing environments. The process is illustrated in Figure 2.
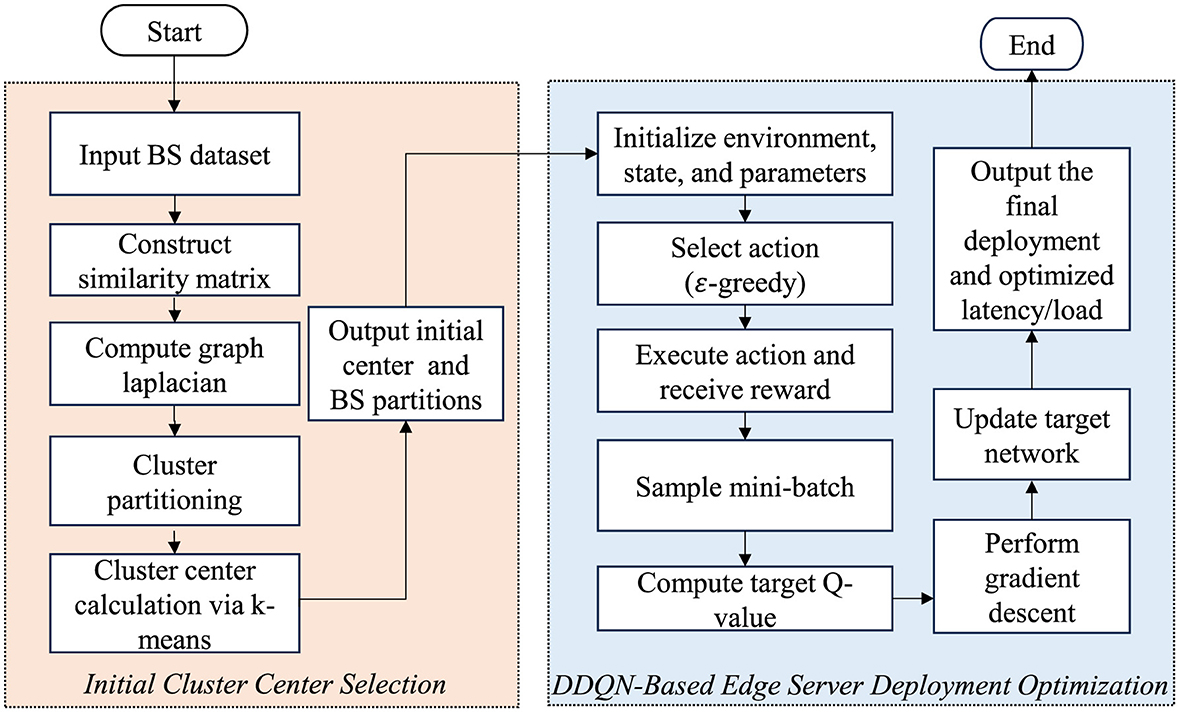
Figure 2. The overall flowchart of SDD.
In the first phase, spectral clustering is used to partition the set of base stations into compact subregions. A similarity matrix based on pairwise distances between base stations is constructed, and the Laplacian matrix is applied to capture the network's topological structure. The centroid of each cluster is selected as the initial candidate location for edge server deployment. This phase effectively reduces the dimensionality of the decision space, which helps reduce the computational complexity and provides a solid foundation for efficient deployment.
In the second phase, a DDQN is used to optimize the deployment strategy. Each edge server is treated as an independent agent that operates in a partially observable environment. Agents interact with the environment, with the aim of maximizing their cumulative rewards while adjusting their positions and service scopes. The DDQN framework mitigates Q-value overestimation and improves stability via its double-network structure. This phase optimizes load balance, minimizes delay, and ensures a coordinated deployment strategy that enhances overall efficiency.
4.2 Base station partitioning and initial cluster center selection
In large-scale base station networks, nodes often exhibit complex spatial topologies and nonlinear similarity relationships, which traditional Euclidean distance-based clustering methods fail to capture effectively. To better extract the underlying connectivity among base stations and reduce the complexity of deployment modeling, this study employs spectral clustering (Tang et al., 2023; Berahmand et al., 2022) for structure-aware partitioning of the base station set. The process is illustrated in Figure 3. By constructing a similarity graph and extracting the eigenvectors of the graph Laplacian, spectral clustering preserves topological information while dividing the network into several compact and densely connected subregions. This process helps alleviate the curse of dimensionality and improves the convergence efficiency of subsequent training. After partitioning, the geometric center of each subregion is calculated based on the coordinates of all base stations within it and is used as the initial deployment location for the edge server. These centers serve as reasonable initial values for the following DDQN-based optimization phase, thus enhancing the efficiency and stability of strategy learning. The specific steps are described as follows:
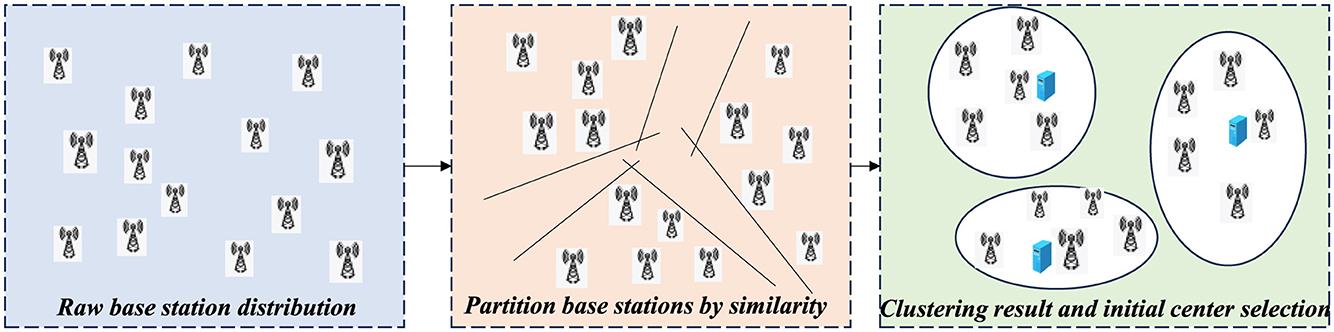
Figure 3. Initial deployment center extraction based on spectral clustering.
1) Similarity matrix construction: Given a set of base stations B = {b1, b2, …, bn}, where each base station bi is located at coordinates , a similarity matrix is constructed to quantify the spatial closeness between base stations. The similarity between any two base stations bi and bj is computed via a Gaussian kernel:
where σ is a bandwidth parameter that controls the decay of similarity with distance, and where is set manually to eliminate self-loops in the similarity graph, as we are interested only in the relationships between different base stations.
2) Laplacian matrix computation: The degree matrix D ∈ ℝn × n is a diagonal matrix with the following entries:
The normalized Laplacian matrix Lsym is computed as follows:
This matrix captures the global topological structure of the base station network.
3) Spectral embedding: The K smallest eigenvalues of Lsym and their corresponding eigenvectors {h1, h2, …, hK} are extracted. These are stacked columnwise to form the embedding matrix:
Each row hi serves as a low-dimensional structural representation of base station bi and captures its connectivity features within the network.
4) K-means clustering: The embedding vectors Ui are used as inputs to the K-means algorithm, which clusters them into K disjoint subregions:
Each ℂk represents a structurally cohesive region of base stations. These regions form the basic units for downstream edge server deployment and resource optimization.
5) Initial center estimation: For each subregion ℂk, the initial deployment location of the edge server is determined by computing the geometric center of all base stations within the region. Specifically, the center ck is defined as the coordinatewise average of all base station positions in ℂk, which is expressed as follows:
where ck denotes the geometric center of subregion ℂk, lb represents the coordinates of the b-th base station in the region, and |ℂk| is the number of base stations in ℂk. This initialization provides a spatially representative and computationally efficient starting point for the subsequent reinforcement learning process, thus facilitating faster convergence and improved solution quality.
6) Pseudocode: Algorithm 1 performs structure-aware partitioning of the base station set and generates initial deployment centers, with the aims of reducing the modeling complexity of the deployment strategy and improving the efficiency of the reinforcement learning phase. Lines 1–5 construct a similarity matrix via a Gaussian kernel to capture the latent connectivity among base stations. Lines 6–8 compute the graph Laplacian to extract global topological information. Lines 9–10 apply spectral embedding and K-means clustering to divide the base stations into multiple topologically compact subregions. Finally, lines 11–12 calculate the geometric center of each subregion as the initial deployment location of the corresponding edge server, which provides a reasonable initialization for subsequent policy optimization.

Algorithm 1. Base station partitioning and initial center estimation.
4.3 Determining the optimal deployment location of edge servers
After completing the initial regional partitioning through spectral clustering, the double deep Q-network (DDQN) method (Lu et al., 2025; Zhang et al., 2022) is used to further optimize the location selection and load allocation strategies for the edge servers. In this framework, each edge server is modeled as an agent that selects actions based on its own observed state and interacts with the environment to receive corresponding reward signals. Compared with traditional Q-learning and standard DQN methods, the DDQN adopts a dual-network architecture that consists of an evaluation network and a target network, which effectively mitigates the overestimation of Q-values and improves the stability and accuracy of policy convergence. This method achieves a good balance between computational complexity and policy performance, which makes it well suited for edge computing environments with many nodes and complex state spaces.
4.3.1 MDP definition
To formulate the edge server deployment problem as a reinforcement learning task, we model the environment as a Markov decision process (MDP) (Lauri et al., 2023; Zhou and Abawajy, 2025). This formulation enables the agent to learn deployment and allocation strategies through sequential decision-making, where each action affects not only the immediate reward but also the future system state. The MDP is defined formally by the following key components:
1) State space: To comprehensively represent the system environment at each decision step, the state s is defined as a composite vector that consists of three key components: the current deployment locations of edge servers, the average access delay experienced by users, and the degree of load balance across the system. The formal definition is as follows:
where χ ∈ {0, 1}k × m denotes the deployment matrix. Each row corresponds to an edge server, and each column corresponds to a base station. The element χi, j = 1 if edge server i is deployed at base station j and χi, j = 0 otherwise. d represents the current average access delay, and L is the standard deviation of edge server workloads, which quantifies the degree of load imbalance in the system.
2) Action space: The action space describes the deployment location decisions of edge servers and their associated base station assignment strategies at each decision step. Specifically, in this research, the action of each edge server i (i ∈ {1, 2, …, k}) at any decision step is represented by a tuple:
where bi ∈ B denotes the selected deployment location (base station) for edge server i and where Gi⊆B denotes the set of base stations assigned to and served by edge server i at the current decision step. Consequently, the complete action space is defined as the set of actions of all edge servers:
3) Reward function: At each time step t, the edge server agents make their action decisions at according to the current system state st and subsequently receive an immediate reward rt. This reward function comprehensively evaluates the performance of the chosen actions in terms of task processing delay and load balance while simultaneously imposing penalties for any edge server overload occurrence. The reward function is defined as:
where α, β, and λ are weighting coefficients that control the relative importance of delay, load balance, and server overload penalties, respectively. The term d(b, e) represents the latency between base station b and edge server e, and L denotes the workload imbalance metric,
To penalize edge servers for overload conditions, we define Lover as the cumulative overload across all edge servers:
Here, Ls is the current workload of edge server s, and Cs is its maximum capacity. This term ensures that any excess beyond capacity contributes to the penalty, thereby guiding the agent to avoid overload situations.
4.3.2 DDQN-based multi-agent optimization framework
As illustrated in Figure 4, this study establishes a reinforcement learning framework based on a Double Deep Q-Network (DDQN), designed to optimize the deployment of edge servers and their corresponding base station allocation strategies. The framework consists of two neural networks with identical structures but independent parameters: the current Q-network Q(s, a; θ) and the target Q-network Q(s, a; θ′). The current network is responsible for estimating the Q-values of state-action pairs and guiding the decision-making process, whereas the target network provides a stable reference for training updates. This dual-network design helps alleviate the overestimation problem commonly found in traditional DQN models.
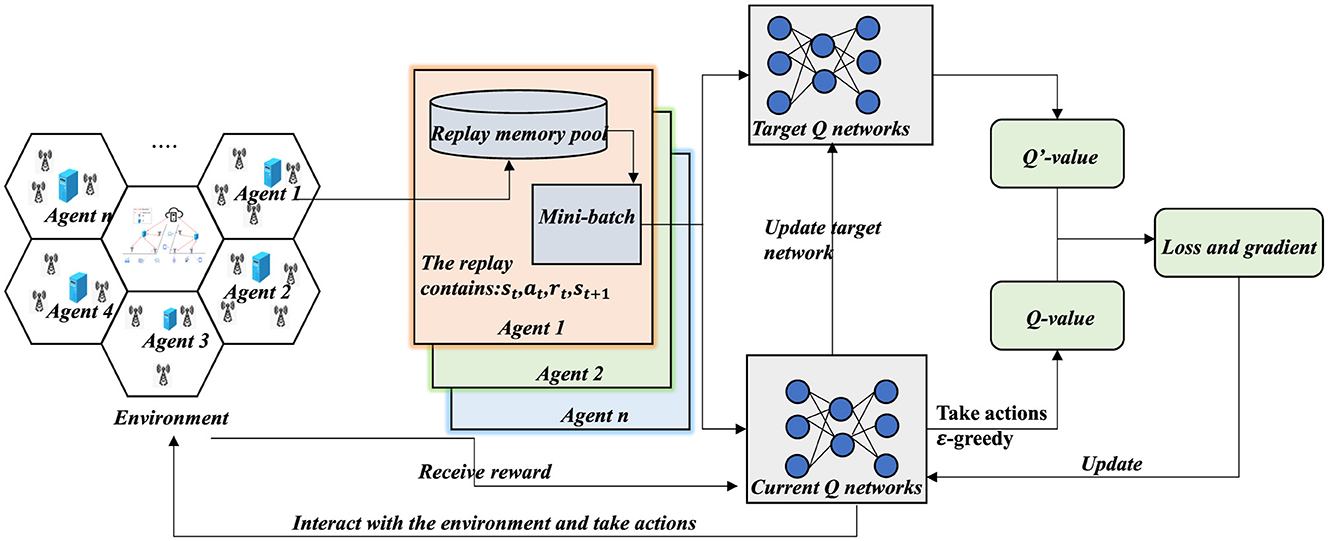
Figure 4. DDQN-based optimization framework.
Moreover, this framework adopts a multi-agent reinforcement learning (MARL) architecture. Each edge server is modeled as an independent agent that observes its local environment and selects actions accordingly. During the training process, agents share a common Q-network architecture under a centralized training paradigm, but execution remains decentralized. This design follows the cooperative MARL setting under the Centralized Training and Decentralized Execution (CTDE) framework. The agents collectively work toward the global objective of optimizing server deployment and load distribution across base stations.
At each time step t, each edge server agent interacts with the environment as a reinforcement learning agent; it selects an action at based on the current state st, receives an immediate reward rt, and transitions to the next state st+1. In constructing the Q target value, the DDQN introduces a decoupled action selection strategy, where the current network selects the action and the target network evaluates it. The corresponding target Q value is computed as follows:
where yt is the target Q value at time step t, rt is the immediate reward received from the environment, γ ∈ (0, 1) is a discount factor that balances the importance of future rewards, is the predicted Q value of the next state–action pair from the current Q-network, and is the optimal action selected by the current network. This decoupled calculation method mitigates the overestimation bias introduced by the max operator, thereby improving the stability and generalizability of the learned deployment policy.
To increase the estimation accuracy of the deployment strategy, the current Q-network constructs a loss function based on the target Q-value and optimizes the parameters by minimizing the prediction error. Specifically, the mean squared error (MSE) is adopted as the loss function, which is defined as follows:
To optimize the parameters of the current Q-network, this work adopts the adaptive optimization algorithm Adam to minimize the loss function during each training iteration. The parameter update is performed as follows:
To reduce the fluctuation in value estimation, the parameters of the target Q-network θ′ are not updated during training but are synchronized periodically with the current network every C iterations, as defined below:
During the action selection process, the agent adopts an ε-greedy policy to balance exploration and exploitation. Specifically, with a probability of ε, the agent selects a random exploratory action; with a probability of 1−ε, it selects the action with the highest estimated Q value, as defined by
In the early stage of training, a relatively large ε is typically used to encourage diverse exploration. As the training progresses, ε is gradually reduced to promote convergence to near-optimal policies.
In addition, to increase training efficiency and improve sample diversity, the DDQN framework incorporates an experience replay mechanism. In each interaction step, an experience tuple (st, at, rt, st+1) is stored in the replay buffer . During training, mini-batches of experience data are sampled randomly from to update the Q-network. This mechanism helps eliminate the temporal correlation between consecutive samples and improves the sampling efficiency and generalization ability of the learned policy.
4.3.3 Optimal-edge server deployment algorithm based on a DDQN
Algorithm 2 illustrates the DDQN-based optimization framework for edge server deployment. Based on the subregion partitions and initial deployment centers obtained in Stage 1, this algorithm further refines both physical server placements and base station assignments via a deep reinforcement learning framework, with the aim of jointly optimizing the system-wide average latency and load balance. Lines 1–2 initialize the current Q-network and the target Q-network and establish the experience replay buffer to store state transition samples generated via server-environment interactions. Lines 3–4 initialize the environmental state, which includes the server locations, base station assignments, and system load status, at the beginning of each training episode to serve as the basis for subsequent policy learning. Lines 5–9 describe the interaction process between each edge server agent and the environment: each agent selects an action based on its current observation via an ϵ-greedy strategy, performs either deployment adjustment or base station reassignment, and then receives an immediate reward and the next state from the environment. The resulting transition tuple is stored in the replay buffer . Lines 10–14 constitute the core of the policy training phase. A mini-batch of transitions is sampled from the replay buffer to compute target Q-values. A loss function based on the mean squared error (MSE) is then constructed, and the Q-network is updated via gradient descent to iteratively improve the deployment strategy. Lines 15–16 implement parameter synchronization for the target network: every G training steps, the target network parameters are updated by copying those of the current network to mitigate instability in Q value estimation. After multiple episodes of interaction and policy updates, the algorithm outputs the optimized server deployment scheme and base station assignments, thereby effectively reducing the average system latency while improving the overall load balance.
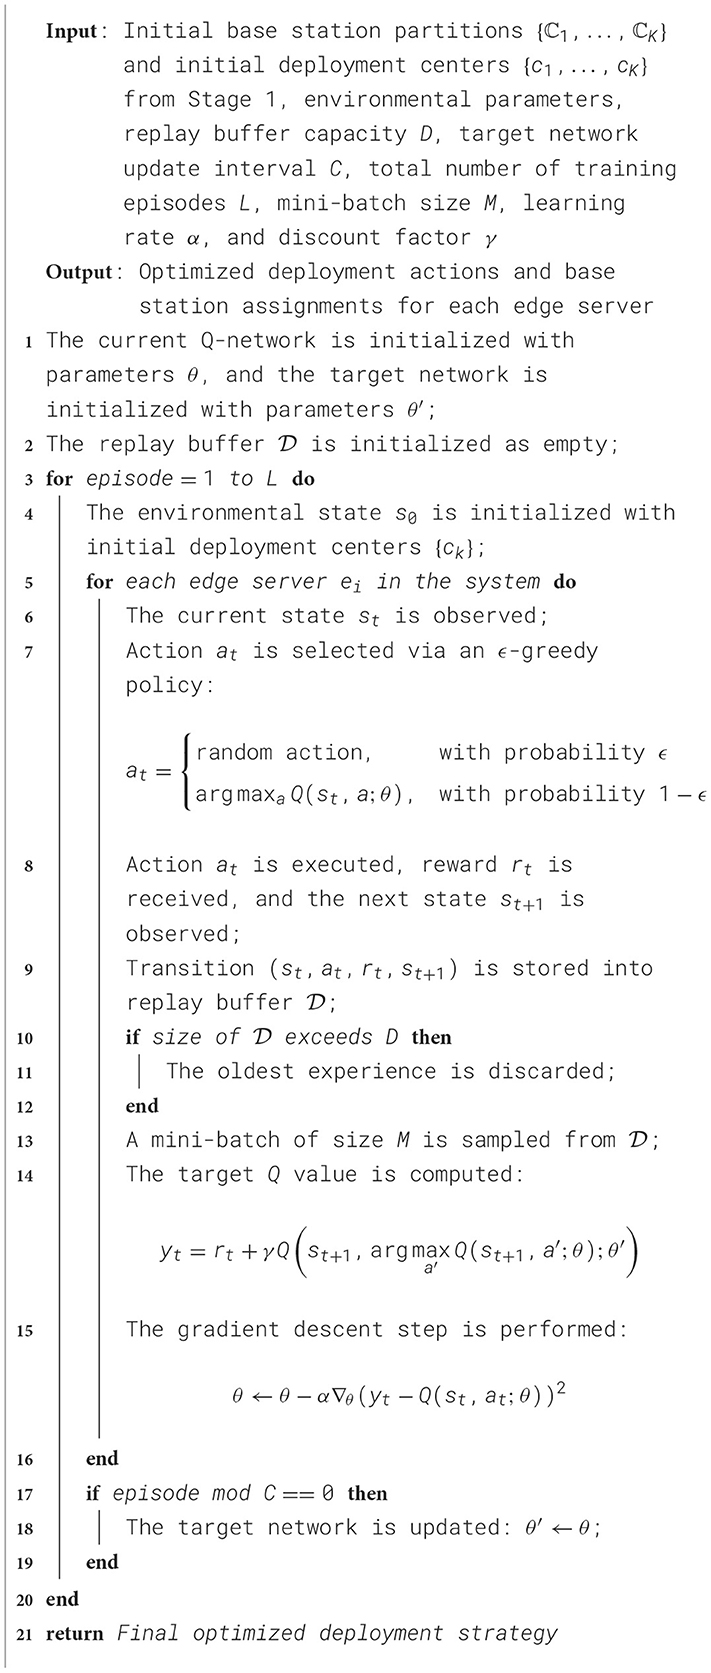
Algorithm 2. SDD: DDQN-based edge server deployment optimization.
5 Experiments
To evaluate the effectiveness of the proposed solution, we conducted extensive experiments and compared it with several algorithms, as detailed below.
5.1 Experimental settings
In this subsection, we present a series of experimental settings.
1) Experimental setup: the experiment was conducted in a Windows 10 operating system environment with a hardware configuration of an Intel(R) Core(TM) i7-11800H @2.30 GHz processing unit (with 16 processor cores), a clock speed of approximately 2.3 GHz, and a memory capacity of 16,384 MB. All the experimental procedures were implemented via the Python 3.7 programming language. Table 3 shows the core parameter settings.
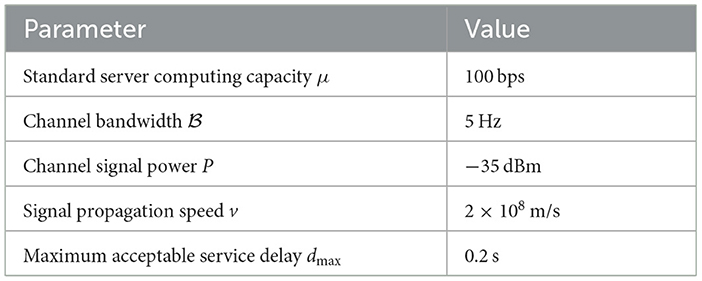
Table 3. Core parameters.
2) Dataset: for the experimental evaluation, we utilized a real-world base station dataset provided by the Shanghai Telecommunications Bureau (He et al., 2022). During the data filtering stage, invalid or incomplete entries were removed, which resulted in a refined dataset that contains information from 2,800 base stations. The dataset includes key details such as base station IDs, user access records, geographic coordinates (latitude and longitude), and continuous 30-day access durations (loads).
3) Methods for comparison.
• Improved Top-K (Qin et al., 2021): the improved Top-K algorithm optimizes edge server placement by comprehensively considering base station task weights, distances, server coverage, and computational capacity limits, aiming to enhance load balancing and overall deployment efficiency.
• Random: to address the instability of K-means, the Random algorithm randomly selects initial cluster centers and reduces the impact of this selection via multiple initializations, which results in more stable clustering. It is particularly robust when handling large-scale data.
• K-means (Li et al., 2022): K-means is a clustering method that divides the dataset into k clusters by minimizing the distances between data points and the cluster centers. It iteratively adjusts the cluster centers, but its performance can be unstable due to the initial center point selection.
• ESL (Yan et al., 2024): ESL is an advanced algorithm for ESD. It utilizes FCM clustering to group base stations for initializing deployment and applies SARSA reinforcement learning to optimize server placement to achieve multiobjective optimization for load balance, latency, and energy consumption.
4) Evaluation metrics.
• Access delay: access delay measures the average communication latency experienced by users when connecting to edge servers. It reflects the system's responsiveness. A lower access delay indicates that the deployment strategy effectively reduces the latency between users and servers, thereby improving service quality.
• Load standard deviation: the load standard deviation reflects the balance of the task distribution across edge servers. A smaller standard deviation implies a more uniform workload distribution, which helps prevent server overload or underutilization, thus improving resource efficiency and system stability.
• Reward convergence curve: to assess the learning process and policy stability of the proposed method, the reward convergence curve during training is examined. The reward function jointly considers both access delays and load balance. The convergence trend of this curve indicates whether the algorithm can efficiently and stably find an optimal deployment strategy over time.
5.2 Experimental comparison and analysis
To comprehensively evaluate the effectiveness of the proposed scheme, we utilized two real-world datasets that correspond to different time periods and designed two groups of comparative experiments:
• Experiment 1: in this experiment, the number of deployed edge servers was varied to compare the performance of different deployment strategies in terms of access latency and load standard deviation. It aimed to analyze the effect of deployment scale on system performance.
• Experiment 2: in this experiment, the number of base stations was varied while keeping the number of edge servers fixed. The goal was to evaluate the robustness of each strategy under changing network sizes, again with a focus on access latency and load balance.
5.2.1 Performance comparison of different numbers of edge servers
(1) Access delay analysis : Figures 5, 6 illustrate the access latency performance of different deployment strategies under varying numbers of edge servers, which are based on two datasets from different time periods. The proposed SDD algorithm consistently achieved the lowest average access latency across all deployment scales and time intervals, thus demonstrating its superior capability in optimizing service placement for latency reduction. In contrast, ESL yielded slightly greater latency than SDD did. This was due to its adoption of a single-agent reinforcement learning framework, which lacks global state coordination and joint optimization capabilities. As a result, it may produce suboptimal placement decisions in multipoint deployment scenarios, thereby leading to nonideal server distributions and elongated access paths. The Random method, which relies solely on stochastic deployment, failed to model the spatial distribution of base stations and user demand. This often results in edge servers being located far from high-demand regions, thereby significantly increasing the average communication latency. Although K-means, which is a traditional unsupervised clustering algorithm, provided some degree of spatial aggregation, it clusters nodes solely based on Euclidean distance. This approach overlooks critical factors such as the user request density, task volume, and network topology. Consequently, the resulting cluster centers tended to deviate from the optimal deployment positions, which led to subpar latency performance. The Improved Top-K method partially shortens access paths through candidate node ranking and greedy selection. However, it lacks global load awareness and overall optimization capability, leading to suboptimal placement decisions. As it focuses only on local optimization without considering dynamic multi-task environments, it is prone to local optima and fails to achieve globally optimal deployment. Consequently, its overall performance remains inferior to SDD.
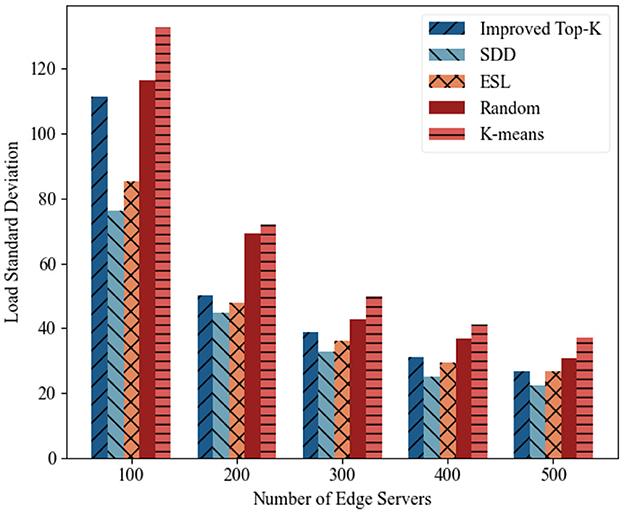
Figure 5. Access latency of edge servers (2014-08-01–2014-08-15).
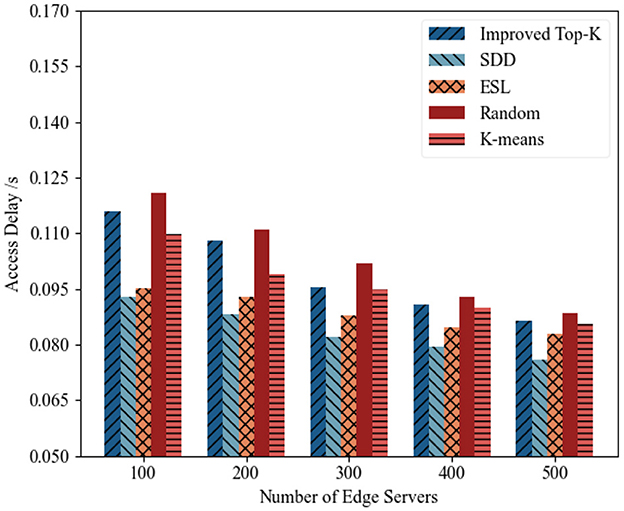
Figure 6. Access latency of edge servers (2014-08-16–2014-08-30).
(2) Load standard deviation analysis: Figures 7, 8 illustrate the variation in the load standard deviation as the number of edge servers increased from 100 to 500 across two time periods. Overall, all methods showed a decreasing trend, which indicates that the use of more servers improves load balance. Among all the schemes, SDD consistently achieved the lowest deviation. For example, during the period 2014-08-01–2014-08-15, with 500 servers deployed, the deviation of SDD reached 26.32, representing a reduction of 16.1% compared with ESL (31.4), and a reduction of 19.76% compared with Improved Top-K (32.8). This highlights its robust balancing capability under various densities. ESL ranked second due to its reinforcement learning mechanism, although it is limited by its single-agent structure. Random and K-means performed the worst, especially under low server counts, as they lack workload awareness. Improved Top-K performed moderately well and narrowed the gap in some cases, but lacks adaptive load sensing, which makes it less effective than SDD.
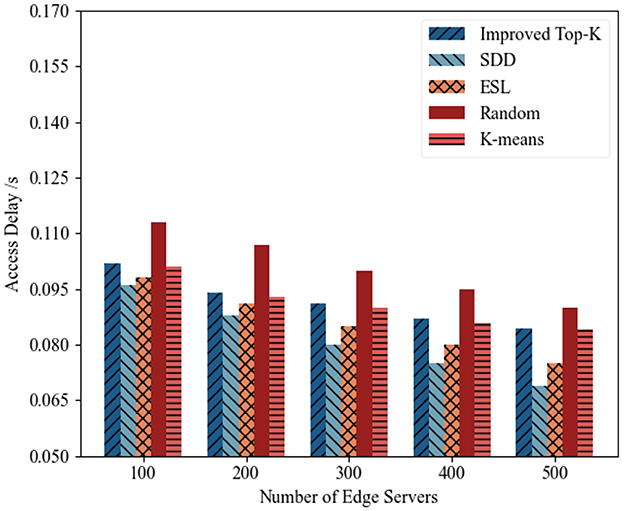
Figure 7. Load standard deviation (2014-08-01–2014-08-15).
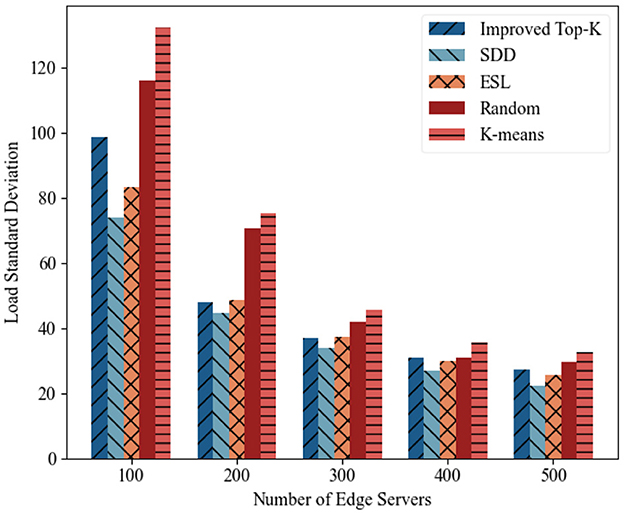
Figure 8. Load standard deviation (2014-08-16–2014-08-30).
5.2.2 Performance comparison of different numbers of base stations
1) Access delay analysis: Figures 9, 10 illustrate the trends in average access delay across different deployment schemes as the number of base stations increased from 1,600 to 2,600 over two distinct time periods. Overall, the access delays of all methods gradually increased with the increasing number of base stations, which was primarily because of the increased system workload caused by denser deployments. As shown in Figure 9, the proposed SDD algorithm consistently achieved the lowest access delay under all deployment scales. For example, when the number of base stations reached 2,600, the access delay of SDD was 0.109 s, which is significantly lower than those of ESL (0.115 s), Improved Top-K (0.124 s), Random (0.131 s), and K-means (0.120 s). Even in smaller-scale deployments (e.g., with 1,600 base stations), SDD consistently maintained stable low-latency performance, achieving a delay of 0.085 s, compared to an access delay of 0.089 s for ESL. As shown in Figure 10, SDD again outperformed all the baseline methods. When the number of base stations reached 2600, SDD achieved a delay of 0.103 s, whereas those of both K-means and Random exceeded 0.12 s, which resulted in relative differences of nearly 14.12%. At all other deployment scales, SDD also consistently maintained the lowest access delay, thereby demonstrating its superior optimization effectiveness.
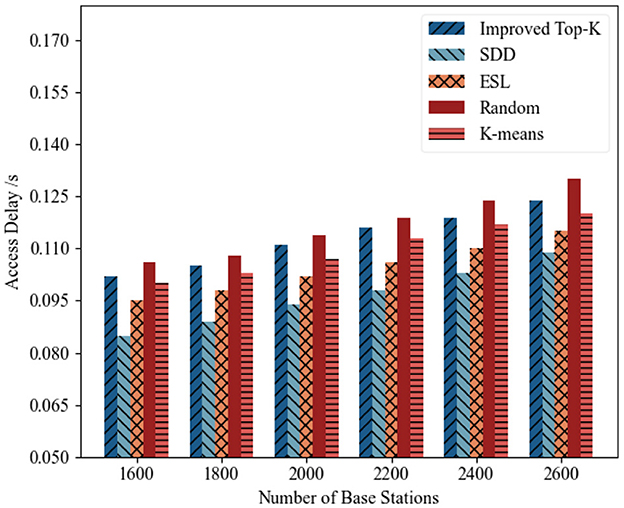
Figure 9. Access latency of edge servers under different numbers of base stations (2014-08-01–2014-08-15).
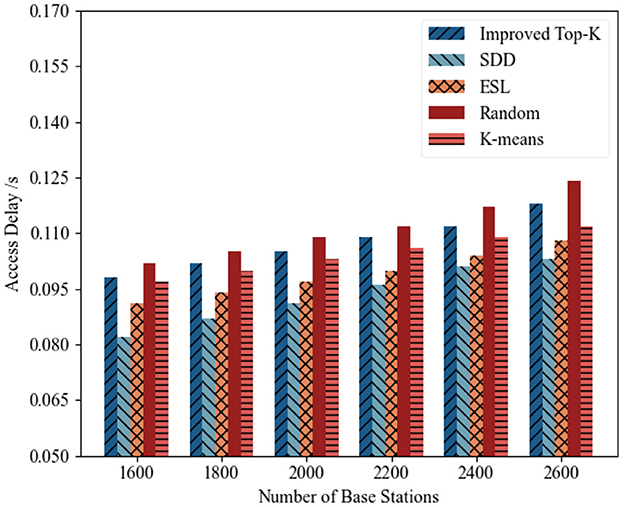
Figure 10. Access latency of edge servers under different numbers of base stations (2014-08-16–2014-08-30).
(2) Load standard deviation analysis: Figures 11, 12 illustrate the variations in the load standard deviation for different deployment strategies as the number of base stations increased from 1,600 to 2,600 across two distinct time periods. Overall, the load standard deviation for all algorithms tended to increase with increasing base station count. A comparison of the overall performance of each method clearly reveals that the proposed SDD method consistently achieved the lowest load standard deviation and demonstrated the most stable performance. ESL closely followed, with good balancing capability. Improved Top-K ranked in the middle range, whereas both Random and K-means showed significant fluctuations, especially under large-scale deployments, thus indicating poor stability. The performance ranking can be summarized as SDD > ESL > Improved Top-K > Random > K-means.
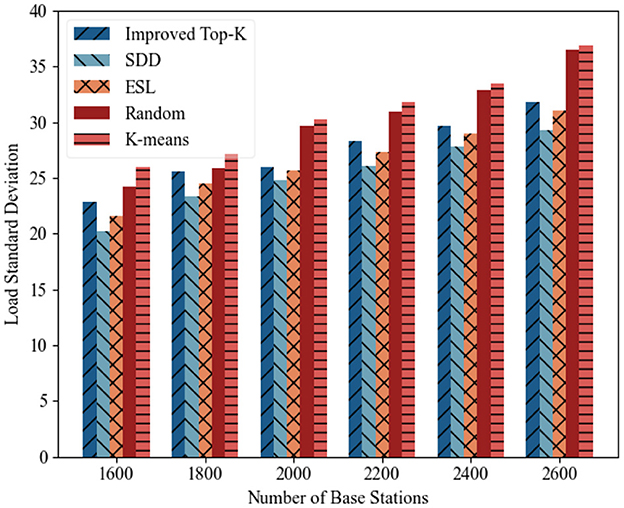
Figure 11. Load standard deviation under different numbers of base stations (2014-08-01–2014-08-15).
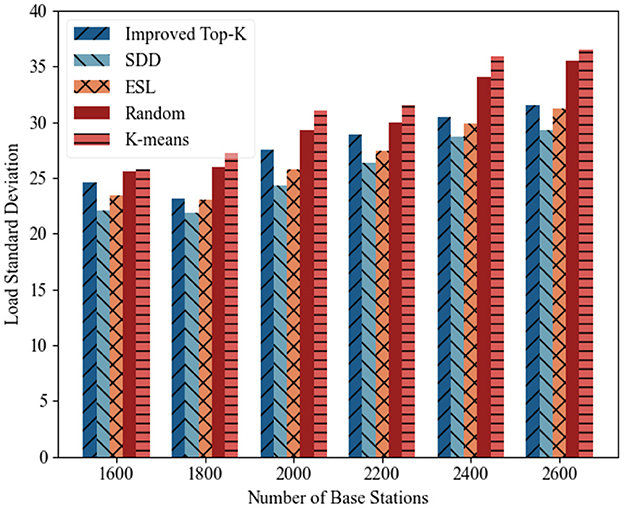
Figure 12. Load standard deviation under different numbers of base stations (2014-08-16–2014-08-30).
The experimental results show that the proposed SDD algorithm outperformed existing baseline methods in reducing access delay and improving load balancing among edge servers. By incorporating spectral clustering for initial deployment and leveraging DDQN-based reinforcement learning for policy optimization, SDD consistently achieved superior performance across various base station and server scales as well as time periods, thus demonstrating its robustness and effectiveness in complex deployment environments.
5.2.3 Convergence analysis
Figure 13 compares the reward convergence process between the proposed spectral clustering + DDQN approach and the DDQN during training. In terms of the initial reward, spectral clustering + DDQN started with a significantly higher reward than DDQN did. This finding indicates that the incorporation of spectral clustering for initial server grouping provides a more reasonable deployment prior, thereby effectively reducing the decision space and alleviating the learning burden. In terms of convergence speed, spectral clustering + DDQN achieved stable convergence within approximately 100 episodes, whereas DDQN began to converge after approximately 200 episodes. This finding demonstrates that the spectral clustering process can significantly increase training efficiency and accelerate policy optimization. In terms of final performance, spectral clustering + DDQN converged to a higher average reward of approximately −445, whereas DDQN stabilized near −470. This gap implies that clustering-guided deployment leads to both faster convergence and better decision quality, thereby resulting in lower latency and improved load balance in edge server deployments.
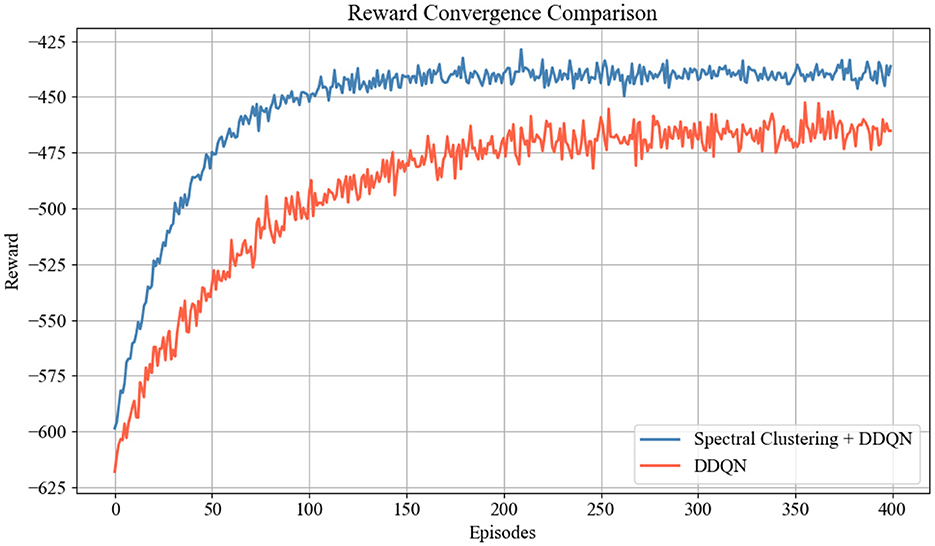
Figure 13. Reward convergence comparison between spectral clustering + DDQN and DDQN.
6 Conclusion
In this paper, we propose an edge server deployment strategy based on the SDD algorithm, which aims to optimize both server placement and workload balance. By jointly considering the locations of base stations, the user distribution, and the geographic orientation of the network, the SDD algorithm effectively reduces the average user access latency while achieving balanced task allocation among edge servers. The algorithm first employs spectral clustering to identify the initial cluster centers and subsequently applies the DDQN algorithm to further refine these centers, which results in more accurate server deployment and an enhanced user experience.
Although the proposed method performed favorably in experimental evaluations, there is still room for further improvement. Future research could explore the integration of this approach with generative artificial intelligence (GAI) technologies. Leveraging the powerful capabilities of the GAI in knowledge modeling and policy generation may enable higher-level adaptation and generalization of deployment strategies, thereby enhancing the applicability and intelligence of the algorithm in complex network environments.
Data availability statement
The original contributions presented in the study are included in the article/supplementary material, further inquiries can be directed to the corresponding author.
Author contributions
XO: Writing – original draft, Writing – review & editing, Validation. HC: Writing – review & editing.
Funding
The author(s) declare that financial support was received for the research and/or publication of this article. This work was supported in part by the Key Program of Natural Science Foundation of Zhejiang Province under Grant LZ24F020007, in part by the National Natural Science Foundation of China under Grant 62072407, in part by the “Leading Goose Project Plan” of Zhejiang Province under Grants 2022C01086 and 2022C03139, in part by the National Key R&D Program of China under Grant 2022YFB2701400, in part by the Natural Science Foundation of Hunan Province under Grant 2025JJ50344, and in part by the Natural Science Foundation of Changsha City under Grant kq2502340.
Conflict of interest
The authors declare that the research was conducted in the absence of any commercial or financial relationships that could be construed as a potential conflict of interest.
Generative AI statement
The author(s) declare that no Gen AI was used in the creation of this manuscript.
Any alternative text (alt text) provided alongside figures in this article has been generated by Frontiers with the support of artificial intelligence and reasonable efforts have been made to ensure accuracy, including review by the authors wherever possible. If you identify any issues, please contact us.
Publisher's note
All claims expressed in this article are solely those of the authors and do not necessarily represent those of their affiliated organizations, or those of the publisher, the editors and the reviewers. Any product that may be evaluated in this article, or claim that may be made by its manufacturer, is not guaranteed or endorsed by the publisher.
References
Asghari, A., Vahdani, A., Azgomi, H., and Forestiero, A. (2023). Dynamic edge server placement in mobile edge computing using modified red deer optimization algorithm and Markov game theory. J. Ambient Intell. Humaniz. Comput. 14, 12297–12315. doi: 10.1007/s12652-023-04656-z
Bahrami, B., Khayyambashi, M. R., and Mirjalili, S. (2023). Edge server placement problem in multi-access edge computing environment: models, techniques, and applications. Cluster Comput. 26, 3237–3262. doi: 10.1007/s10586-023-04025-7
Berahmand, K., Mohammadi, M., Faroughi, A., and Mohammadiani, R. P. (2022). A novel method of spectral clustering in attributed networks by constructing parameter-free affinity matrix. Cluster Comput. 25, 869–888. doi: 10.1007/s10586-021-03430-0
Chen, Y., Wang, D., Wu, N., and Xiang, Z. (2023). Mobility-aware edge server placement for mobile edge computing. Comput. Commun. 208, 136–146. doi: 10.1016/j.comcom.2023.06.001
Cong, R., Zhao, Z., Zhang, L., and Min, G. (2024). Cost-effective server deployment for multi-access edge networks: a cooperative scheme. IEEE Trans. Parallel Distrib. Syst. 35, 1583–1597. doi: 10.1109/TPDS.2024.3426523
He, Z., Li, K., and Li, K. (2022). Cost-efficient server configuration and placement for mobile edge computing. IEEE Trans. Parallel Distrib. Syst. 33, 2198–2212. doi: 10.1109/TPDS.2021.3135955
Jiang, X., Hou, P., Zhu, H., Li, B., Wang, Z., Ding, H., et al. (2023). Dynamic and intelligent edge server placement based on deep reinforcement learning in mobile edge computing. Ad Hoc Netw. 145:103172. doi: 10.1016/j.adhoc.2023.103172
Lauri, M., Hsu, D., and Pajarinen, J. (2023). Partially observable Markov decision processes in robotics: a survey. IEEE Trans. Robot. 39, 21–40. doi: 10.1109/TRO.2022.3200138
Li, W., Chen, J., Li, Y., Wen, Z., Peng, J., Wu, X., et al. (2022). Mobile edge server deployment towards task offloading in mobile edge computing: a clustering approach. Mobile Netw. Appl. 27, 1476–1489. doi: 10.1007/s11036-022-01975-x
Lovén, L., Lähderanta, T., Ruha, L., Leppänen, T., Peltonen, E., Riekki, J., and Sillanpää, M. J. (2020). “Scaling up an edge server deployment,” in 2020 IEEE International Conference on Pervasive Computing and Communications Workshops (PerCom Workshops) (Austin, TX: IEEE), 1–7. doi: 10.1109/PerComWorkshops48775.2020.9156204
Lu, S., Tao, Y., Zeng, J., and Zuo, Q. (2025). A study on the impact of obstacle size on training models based on DQN and DDQN. ITM Web Conf. 73:01004. doi: 10.1051/itmconf/20257301004
Luo, R., Jin, H., He, Q., Wu, S., and Xia, X. (2022). Cost-effective edge server network design in mobile edge computing environment. IEEE Trans. Sustain. Comput. 7, 839–850. doi: 10.1109/TSUSC.2022.3178661
Ning, Z., Hu, H., Wang, X., Guo, L., Guo, S., Wang, G., et al. (2023). Mobile edge computing and machine learning in the internet of unmanned aerial vehicles: a survey. ACM Comput. Surv. 56, 1–31. doi: 10.1145/3604933
Pan, J.-S., Yang, Q., Chu, S.-C., and Chao, H.-C. (2024). A joint edge server and service deployment method in c-ran with multi-layer MEC for multi-communities. IEEE Internet Things J. 12, 904–918. doi: 10.1109/JIOT.2024.3471817
Pandey, C., Tiwari, V., Pattanaik, S., and Roy, D. S. (2023). “A strategic metaheuristic edge server placement scheme for energy saving in smart city,” in 2023 International Conference on Artificial Intelligence and Smart Communication (AISC) (Greater Noida: IEEE), 288–292. doi: 10.1109/AISC56616.2023.10084941
Pang, S., He, X., Hsu, C.-H., Rong, C., Zhu, H., Zhang, P., et al. (2023). Joint trajectory and energy consumption optimization based on UAV wireless charging in cloud computing system. IEEE Trans. Cloud Comput. 11, 3426–3438. doi: 10.1109/TCC.2023.3288527
Qin, Z., Xu, F., Xie, Y., Zhang, Z., and Li, G. (2021). An improved top-k algorithm for edge servers deployment in smart city. Trans. Emerg. Telecommun. Technol. 32:e4249. doi: 10.1002/ett.4249
Song, H., Gu, B., Son, K., and Choi, W. (2022). Joint optimization of edge computing server deployment and user offloading associations in wireless edge network via a genetic algorithm. IEEE Trans. Netw. Sci. Eng. 9, 2535–2548. doi: 10.1109/TNSE.2022.3165372
Tang, C., Abbatematteo, B., Hu, J., Chandra, R. Martín-Martín, R., and Stone, P. (2024). Deep reinforcement learning for robotics: a survey of real-world successes. Ann. Rev. Control Rob. Auton. Syst. 8, 28694–28698. doi: 10.1146/annurev-control-030323-022510
Tang, C., Li, Z., Wang, J., Liu, X., Zhang, W., Zhu, E., et al. (2023). Unified one-step multi-view spectral clustering. IEEE Trans. Knowl. Data Eng. 35, 6449–6460. doi: 10.1109/TKDE.2022.3172687
Taub, H., and Schilling, D. L. (1991). Principles of Communication Systems. New Delhi: Tata McGraw-Hill.
Vali, A. A., Azizi, S., and Shojafar, M. (2024). RESP: a recursive clustering approach for edge server placement in mobile edge computing. ACM Trans. Internet Technol. 24, 1–25. doi: 10.1145/3666091
Yan, H., Bilal, M., Xu, X., and Vimal, S. (2024). Edge server deployment for health monitoring with reinforcement learning in internet of medical things. IEEE Trans. Comput. Soc. Syst. 11, 3079–3089. doi: 10.1109/TCSS.2022.3161996
Ye, H., Cao, B., Liu, J., Li, P., Tang, B., Peng, Z., et al. (2023). An edge server deployment method based on optimal benefit and genetic algorithm. J. Cloud Comput. 12:148. doi: 10.1186/s13677-023-00524-5
Yi, C., Cai, J., Zhang, T., Zhu, K., Chen, B., Wu, Q., et al. (2023). Workload re-allocation for edge computing with server collaboration: a cooperative queueing game approach. IEEE Trans. Mob. Comput. 22, 3095–3111. doi: 10.1109/TMC.2021.3128887
Zhang, H., Huang, M., Zhou, H., Wang, X., Wang, N., Long, K., et al. (2022). Capacity maximization in ris-UAV networks: a DDQN-based trajectory and phase shift optimization approach. IEEE Trans. Wirel. Commun. 22, 2583–2591. doi: 10.1109/TWC.2022.3212830
Zhang, H., Luo, T., and Wang, Q. (2023). “Adaptive digital twin server deployment for dynamic edge networks in IOT system,” in 2023 IEEE/CIC International Conference on Communications in China (ICCC) (Dalian: IEEE), 1–6. doi: 10.1109/ICCC57788.2023.10233465
Zhang, J., Ning, Z., Waqas, M., Alasmary, H., Tu, S., Chen, S., et al. (2023). Hybrid edge-cloud collaborator resource scheduling approach based on deep reinforcement learning and multi-objective optimization. IEEE Trans. Comput. 73, 192–205. doi: 10.1109/TC.2023.3326977
Zhang, X., Huang, S., Dong, H., Bao, Z., Liu, J., Yi, X., et al. (2024). Optimized edge node allocation considering user delay tolerance for cost reduction. IEEE Trans. Serv. Comput. 17, 4055–4068. doi: 10.1109/TSC.2024.3486174
Zhou, H., Zhang, Z., Li, D., and Su, Z. (2023). Joint optimization of computing offloading and service caching in edge computing-based smart grid. IEEE Trans. Cloud Comput. 11, 1122–1132. doi: 10.1109/TCC.2022.3163750
Zhou, Z., and Abawajy, J. (2025). Reinforcement learning-based edge server placement in the intelligent internet of vehicles environment. IEEE Trans. Intell. Transp. Syst. 1–11. doi: 10.1109/TITS.2025.3557259
Zhou, Z., Han, Y., Shojafar, M., Wang, Z., and Abawajy, J. (2023). “A reliable edge server placement strategy based on ddpg in the internet of vehicles,” in 2023 IEEE 22nd International Conference on Trust, Security and Privacy in Computing and Communications (TrustCom) (Exeter: IEEE), 2587–2594. doi: 10.1109/TrustCom60117.2023.00361
Zhou, Z., Pooranian, Z., Shojafar, M., and Martinelli, F. (2024). “An edge server deployment strategy for multi-objective optimization in the internet of vehicles,” in 2024 IEEE Symposium on Computers and Communications (ISCC) (Paris: IEEE), 1–6. doi: 10.1109/ISCC61673.2024.10733676
Zhou, Z., Shojafar, M., Abawajy, J., and Bashir, A. K. (2021a). IADE: an improved differential evolution algorithm to preserve sustainability in a 6g network. IEEE Trans. Green Commun. Netw. 5, 1747–1760. doi: 10.1109/TGCN.2021.3111909
Keywords: edge server deployment, workload, access latency, spectral clustering, double deep Q-network
Citation: Ou X and Cheng H (2025) SDD: spectral clustering and double deep Q-network based edge server deployment strategy. Front. Comput. Sci. 7:1668495. doi: 10.3389/fcomp.2025.1668495
Received: 18 July 2025; Accepted: 17 August 2025;
Published: 29 September 2025.
Edited by:
Zhou Zhou, Changsha University, ChinaCopyright © 2025 Ou and Cheng. This is an open-access article distributed under the terms of the Creative Commons Attribution License (CC BY). The use, distribution or reproduction in other forums is permitted, provided the original author(s) and the copyright owner(s) are credited and that the original publication in this journal is cited, in accordance with accepted academic practice. No use, distribution or reproduction is permitted which does not comply with these terms.
*Correspondence: Hongbing Cheng, Y2hlbmdoYkB6anV0LmVkdS5jbg==