 Peng Wang
 Yanxiu Fu
 Huiping Yuan
 Zhongyang Xiao1
- 1School of Electronic Information, Hunan First Normal University, Changsha, China
- 2Institute of Science and Education Integration, Hunan Automotive Engineering Vocational University, Zhuzhou, China
- 3School of Intelligent Manufacturing, Hunan First Normal University, Changsha, China
In the field of multi-objective evolutionary optimization, prior studies have largely concentrated on the scalability of objective functions, with relatively less emphasis on the scalability of decision variables. However, in practical applications, complex optimization problems often involve multiple objectives and large-scale decision variables. To address these challenges, this paper proposes an innovative large-scale multi-objective evolutionary optimization algorithm. The algorithm utilizes clustering techniques to categorize decision variables and introduces a novel dominance relation to enhance optimization efficiency and performance. By dividing decision variables into convergence-related and diversity-related groups and applying distinct optimization strategies to each, the algorithm achieves a better balance between convergence and diversity. Additionally, the algorithm incorporates a new angle-based dominance relationship to reduce dominance resistance during the optimization process. Experimental results on multiple mainstream multi-objective optimization test sets, such as standard DTLZ and UF problem sets, indicate that CLMOAS achieves smaller IGD values relative to mainstream algorithms such as MOEA/D and LMEA, thereby demonstrating that the proposed algorithm outperforms several existing multi-objective evolutionary algorithms and showcases its effectiveness in solving complex optimization problems with multiple objectives and large-scale decision variables.
1 Introduction
Optimization problems are prevalent in everyday life and industry. For example, in logistics management, optimization can minimize transportation costs through the planned routes; in power systems, it can optimize energy use by adjusting parameters between the nodes; and in manufacturing, it can reduce production costs through process control and inventory management. Initially, these problems were often solved by transforming them into multiple single-objective problems, which are relatively straightforward to address as they have only one goal. However, as the number of objectives and the scale of problems increased, single-objective optimization algorithms became inadequate for quickly and accurately solving these complex issues. This motivated researchers to aim for the development of multi-objective optimization algorithms (Wang et al., 2022; Liu Z.-Z. et al., 2023).
The multi-objective optimization problems (MOPs) have been the focus of academic and engineering fields (Zhang et al., 2023; Tian et al., 2021). Many real-world problems are MOPs, such as big data analysis (Krishna et al., 2022; Cheng et al., 2021), image processing (Guo et al., 2023; Sreedhara et al., 2023), feature selection (Hu et al., 2021; Song et al., 2022), community detection (Tahmasebi et al., 2019), engineering design (Sreedhara et al., 2023; El-Shorbagy and El-Refaey, 2022), shop floor scheduling (Xi and Lei, 2022; Fu et al., 2021), and medical services (Zheng et al., 2022). The concept first emerged in the field of economics. In 1881, F.Y. Edgeworth defined multiconditional economic decision optimization. In 1906, Vilfredo Pareto proposed the Pareto Optimum theory: optimal resource allocation occurs only when optimizing one objective sacrifices others (Liu et al., 2020b; Zhou et al., 2022b). Multi-objective optimization seeks compromises among conflicting goals, producing the Pareto Optimal Set (Shang et al., 2022; Zou et al., 2024).
In 1985, the Vector Evaluated Genetic Algorithm (VEGA) was first used by Schaffer in the field of artificial intelligence. A few years later, in 1989, Goldberg proposed using Evolutionary Algorithms (EAs) (Liu et al., 2024a,c) to solve multi-objective problems in daily life, guiding the research direction of Multi-Objective Evolutionary Algorithms (MOEA) (Yuan et al., 2016; Zhang et al., 2015). Early MOEA were relatively simple, with algorithms like NSGA (Srinivas and Deb, 1994), MOGA, and NPGA representing this era. Since 1993, algorithms like NSGA, MOGA, and NPGA have been proposed, classified as the first generation of MOEAs (Zhao et al., 2022; Zheng et al., 2023). These algorithms are characterized by the use of Pareto dominance relationships to select solutions and maintain diversity through adaptive value comparison strategies. These algorithms often use non-dominated sorting, leading to high computational costs and inefficient selection. From 1999 to 2002, the second generation of MOEAs was published, featuring elite preservation mechanisms to improve selection efficiency. Algorithms like SPEA, PAES, PESA, PESA-II, NPGA2, and NSGA-II (Ben Said et al., 2010) were developed, addressing the limitations of the first generation. However, these algorithms still face severe diversity loss when dealing with high-dimensional problems.
From 2003 to the present, the third generation of MOEAs has been proposed, using new mechanisms or frameworks. In 2004, Zitzler et al. proposed the Indicator-Based EA (IBEA) (Zitzler and Künzli, 2004; Liu et al., 2024b), which uses indicators to evaluate solutions without the need for methods such as fitness sharing to maintain diversity. In 2007, Zhang et al. proposed the Decomposition-Based MOEA (MOEA/D) (Zhang and Li, 2007; Liu Z.-Z. et al., 2025), which decomposes multiobjective optimization problems into single-objective problems related to weights and mutually influencing each other. The recent direction of MOEAs has been expanding toward higher-dimensional multi-objective problems (MaOPs) (Ishibuchi et al., 2008; Wang B.-C. et al., 2024) and large-scale multi-objective problems (LSMOP) (Cheng et al., 2017; Liu Y. et al., 2023).
Despite these advancements, existing large-scale multi-objective evolutionary algorithms still face several persistent challenges when dealing with problems involving a large number of decision variables. First, they often struggle to effectively balance convergence and diversity throughout the optimization process, particularly as the variable dimensionality increases. Second, most algorithms lack adaptive mechanisms to dynamically adjust their search strategies based on variable characteristics and evolutionary states. Third, traditional dominance relationships frequently encounter resistance in high-dimensional spaces, resulting in insufficient selection pressure.
To address the challenges, this paper proposes an enhanced collaborative large-scale multi-objective optimization algorithm (CLMOAS). The algorithm uses k-means clustering to divide decision variables into convergence-related and diversity-related groups, applying specific optimization strategies to each group, which effectively improves its ability to handle large-scale decision variables (Sridevi et al., 2024; Liu and Ruochen, 2024). In addition, CLMOAS introduces Enhanced Dominance Relations (EDR) and a dynamic niche radius adjustment mechanism based on population diversity (Liu Y. et al., 2025), achieving a more precise balance between convergence and diversity in dynamic optimization settings (Pons et al., 2023; Zhong et al., 2024). Experiments on the PlatEMO platform show that CLMOAS performs excellently in solving large-scale multi-objective optimization problems, especially in maintaining a balance between convergence and diversity. With its scalability and versatility, CLMOAS shows great potential in solving complex optimization problems in 5G networks (Su and Xu, 2015; Guo et al., 2024). For example, it can enhance the efficiency of network resource management for micro-CDNs at the edge of 5G base stations (Zhou and Abawajy, 2025), thereby improving key metrics such as cache hit rate, response time, backhaul traffic, energy consumption, and cost. Moreover, CLMOAS also demonstrates good adaptability in other optimization scenarios like smart grids and autonomous driving. Overall, with its unique clustering strategy and dynamic adjustment mechanisms, CLMOAS shows good performance in handling large-scale complex optimization problems and provides an effective solution for the multi-objective optimization field.
2 Methods
Algorithm 1 outlines the core structure of CLMOAS, which incorporates the following elements. The first part is as follows: similar to other MOEA (Wang et al., 2023; Liu Z.-Z. et al., 2023), the first step of the algorithm is initialization. Next, using k-means classification based on angular clustering, the decision variables are categorized into two different outcomes according to the size of the angle. Then the operation is to further divide the classification results into several smaller outcomes, where the variables will interact with each other within one sub-outcome and not with all the variables within the other sub-clusters. The variables within each subgroup are also called interacting variables because they interact with each other and therefore are not optimized independently. The last two components are the convergence and diversity optimization strategies, once the interaction analysis is completed, CLMOAS starts to optimize the set sum of variables for each segmented sub-outcome using the optimization strategy for convergence, while the diversity method is applied for optimizing another variable. In the optimization strategy we include the used reinforced dominance relations, replacing the traditional dominance relations, as a way to reduce the algorithmic dominance pressure. Figure 1 shows the overall framework of CLMOAS.
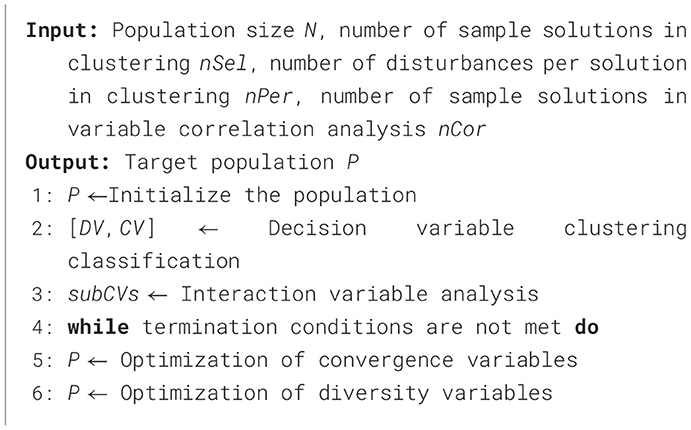
Algorithm 1. CLMOAS algorithm framework.
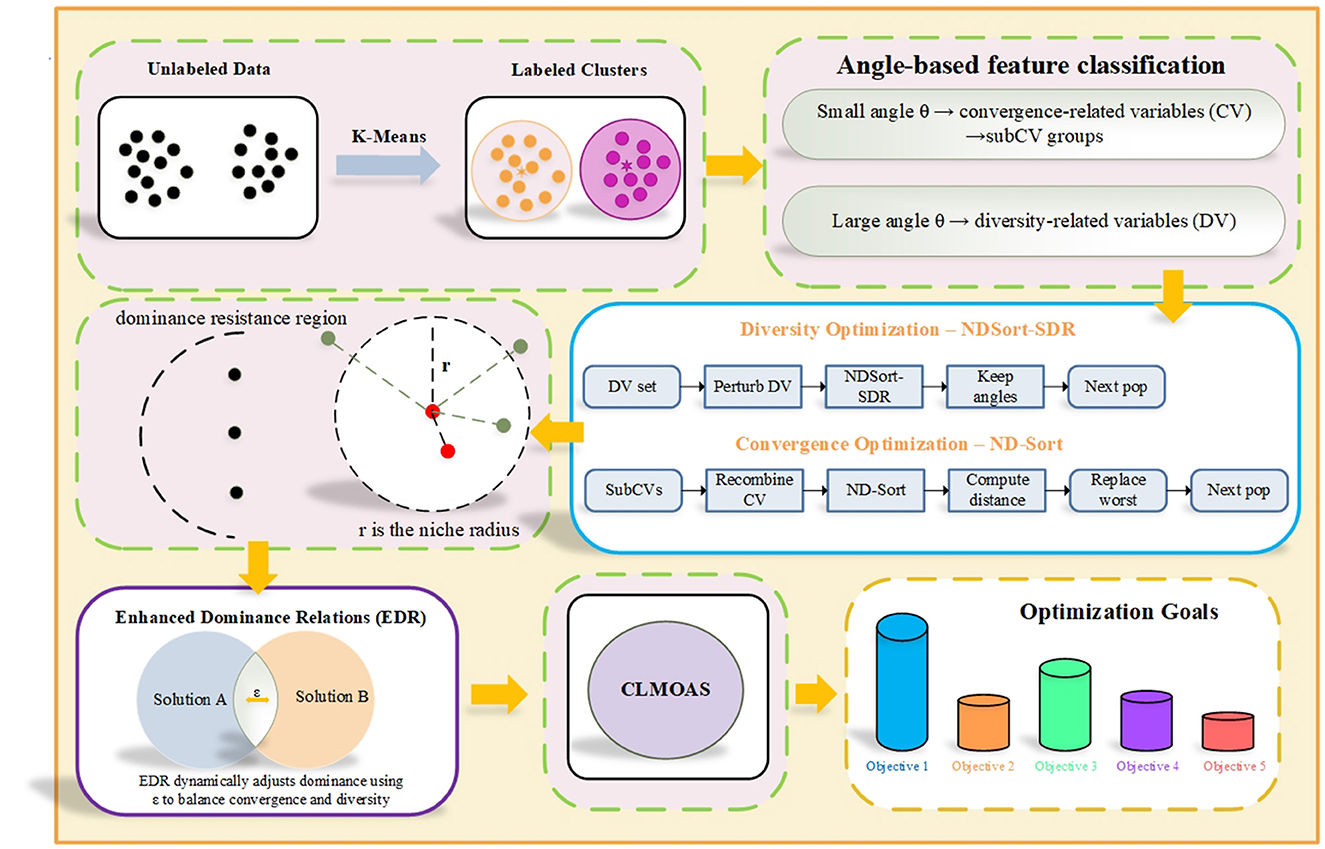
Figure 1. The overall framework of CLMOAS.
2.1 Decision variable clustering classification
The selection of an appropriate clustering algorithm is crucial for effectively categorizing decision variables in large-scale optimization. After evaluating various clustering approaches, we employed k-means due to its specific advantages for our problem context. The algorithm's computational efficiency is particularly valuable given that variable clustering needs to be performed repeatedly during the evolutionary process. Moreover, k-means produces well-separated spherical clusters that directly correspond to our angular-based characterization of convergence-related and diversity-related variables. This alignment ensures that the clustering results are not only computationally efficient but also semantically meaningful within our optimization framework.
In the k-means clustering method for variable classification, determining the number of clusters and initializing the cluster centers are crucial steps that ensure the reproducibility and reliability of the method. To determine the number of clusters, we employ the elbow method, which involves calculating the within-cluster sum of squares (WCSS) for different numbers of clusters. The optimal number of clusters is identified at the point where the WCSS starts to decrease more slowly, forming an “elbow” shape in the plot. For initializing the cluster centers, we adopt the k-means algorithm. This algorithm selects the initial cluster centers in a way that reduces the likelihood of converging to suboptimal solutions (Zhou et al., 2018). It starts by randomly selecting one data point as the first cluster center. Then, for each subsequent cluster center, the probability of selecting a data point is proportional to its squared distance from the nearest existing cluster center. This process ensures that the initial cluster centers are spread out across the data space, leading to more stable and reliable clustering results.
Prior to angle computation, all decision variables are normalized to zero mean and unit variance to eliminate scaling biases. This preprocessing ensures that variables with different magnitudes contribute equally to the clustering process.
Figure 2 shows an example of categorizing four decision variables through clustering. First, two sample solutions are generated for an individual in the population using random order numbers. Then, these solutions undergo perturbation with minor modifications to simulate the impact of disturbances. The resultant solutions' objective values are shown in Figure 2a. After normalization, a demarcation line L is constructed to split the sample solutions into two equal subsets. As illustrated in Figure 2b, this line is crucial for clustering as it helps categorize decision variables based on their position relative to L. The angle between line L and the target space line f1 + … + fM = 1 is calculated, associating each clustering variable with several angles. Figure 2c illustrates these angles, with variable xi linked to angles θi1 and θi2.
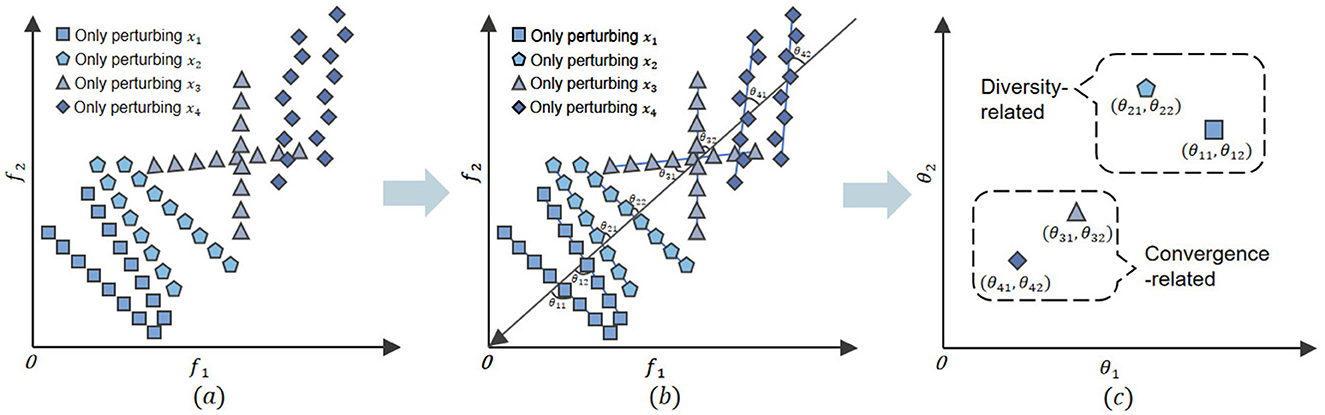
Figure 2. (a–c) Convergence-related variables and diversity-related variables clustering classification process.
In the decision variable clustering method, the calculated angle measures a variable's contribution to convergence and diversity (Liu et al., 2020a). In the objective space, the angle between a variable's perturbation vector and the hyperplane f1 + … + fM = 1 reflects the direction of change induced by the variable. A smaller angle indicates that the variable's perturbations align closely with the direction of overall objective improvement, which corresponds to movement toward the Pareto front–thus emphasizing convergence. Conversely, a larger angle signifies that the variable's perturbations cause solutions to spread more broadly across the objective space, enhancing diversity by covering a wider range of trade-offs. This geometric insight is consistent with Pareto-based principles: variables that minimally alter the relative objective values (small angles) tend to fine-tune convergence, while those that induce significant relative shifts (large angles) promote diversity. Using more candidate solutions (nSel) enhances measure accuracy and ensures two distinct variable classes for optimization.
The k-means algorithm initiates with random cluster centers and iteratively assigns each variable to the nearest cluster based on its angle relative to the demarcation line L. This process repeats until the cluster assignments stabilize, resulting in two distinct clusters: convergence variables (CV) and diversity variables (DV). The final cluster assignments are determined by minimizing the within-cluster sum of squares, ensuring that variables within the same cluster exhibit similar characteristics. Specifically, the algorithm calculates the distance from each variable to the cluster centers and reassigns variables to the nearest cluster in each iteration. This iterative procedure continues until the cluster memberships no longer change significantly, indicating that the algorithm has converged to a stable solution. The use of the demarcation line L provides a consistent criterion for cluster assignment throughout the iterations. Figure 2c shows the clustering results for x1, x2, x3, and x4, where x1 and x2 are DVs. In CLMOAS, variable categorization depends on disturbing nSel solutions. Different runs may lead to different classifications due to random sampling. The pseudocode for the algorithm is shown in Algorithm 2.
Algorithm 2. Decision variable clustering algorithm.
This clustering outcome carries profound geometric significance that directly informs our optimization strategy. Variables grouped as Convergence Variables (CV) exhibit perturbation directions that align closely with the normal direction to the Pareto front, meaning they primarily drive solutions toward optimality in the objective space. In contrast, Diversity Variables (DV) demonstrate perturbation directions that are nearly orthogonal to the front normal, enabling them to spread solutions broadly along the Pareto front and thus enhance population diversity. This geometric interpretation, rooted in the fundamental trade-off between convergence and diversity in multi-objective optimization, validates the meaningfulness of our variable categorization and provides a principled basis for applying distinct optimization strategies to each variable group.
In our future work, we plan to explore the application of CLMOAS's k-means clustering module in enhancing cache efficiency. We aim to investigate how categorizing decision variables based on their impact on cache hit rates can help prioritize variables that significantly improve cache performance. This could potentially allow for more effective resource allocation, reducing the reliance on backhaul traffic and lowering latency in various optimization scenarios (Zhou et al., 2022a).
2.2 Interaction variable analysis
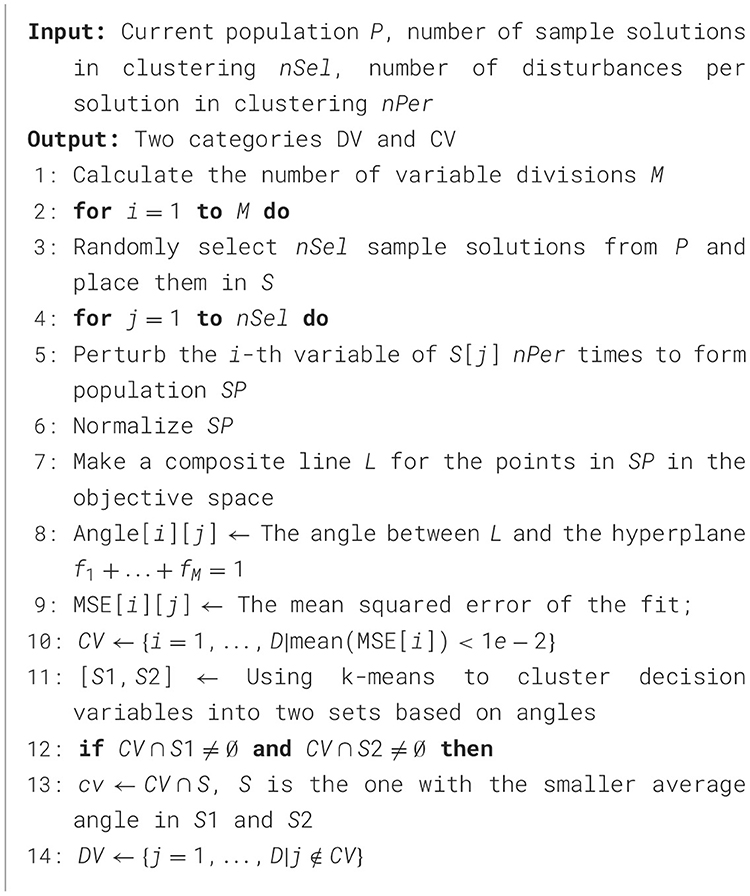
To optimize convergence-related variables, we first lower their dimension. We split them into subgroups based on variable interactions. Those that interact form one group, while non-interacting ones form another, with no interaction between groups. For variable interaction judgment, we perform nCor trials to satisfy Equation 5, preventing excessive computational costs due to the complexity of the mapping function from decision to target space. We select multiple x, a1, a2, b1, and b2 sets to judge and early-stop variable rings. Interaction variables form a connected graph, with maximal connected subgraphs as convergent variable subgroups. After interaction analysis, formal optimization of convergent variables begins. In Algorithm 3, lines 5–14 compare CV solutions with existing interaction variable subgroups to determine relevance via Equation 5, omitting function-calling details. Lines 15–16 identify independent variables and merge them into subCV. Lines 17–20 handle variables interacting with a subgroup by removing and re-adding variables.
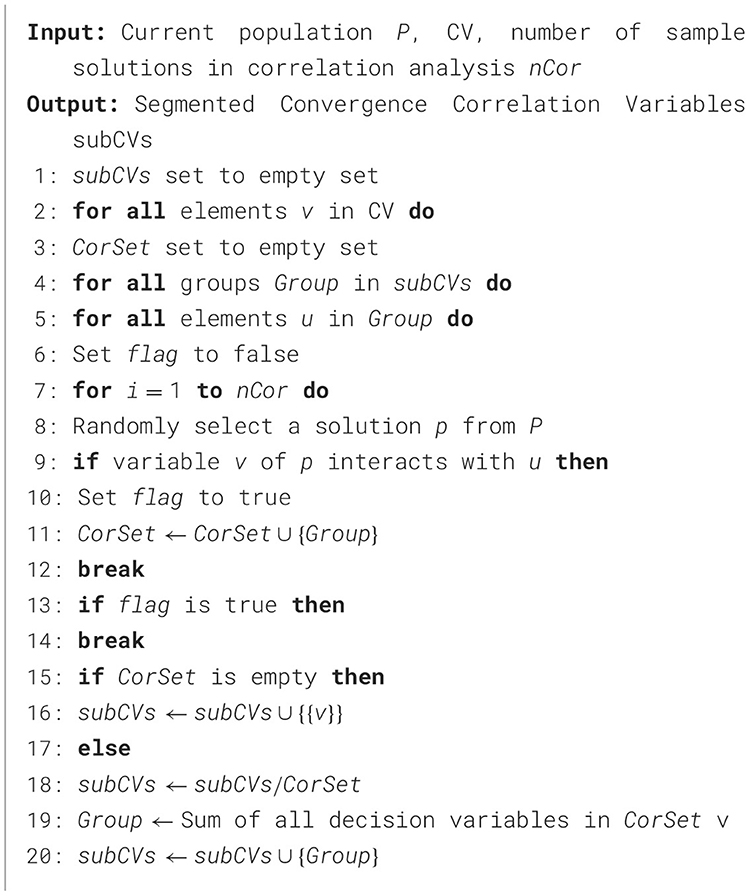
Algorithm 3. Interaction variable analysis.
Note that interaction determination conditions are necessary but not sufficient. Variables meeting the equation are regarded as interacting, yet not all interacting variables may satisfy it. Thus, we restrict judgments to nCor trials to find a satisfying equation. To further clarify the interaction variable analysis, we have refined the criteria for deeming variables as interacting. Specifically, variables are considered interacting if their correlation coefficient exceeds a predefined threshold. This threshold is determined based on the problem's characteristics and the desired level of interaction strength (Zhou et al., 2021). By applying this correlation-based approach, we can more accurately identify interacting variables and form connected subgraphs in a logical manner. The correlation coefficient is calculated using the formula:
where xi and yi are the values of variables x and y in the i-th sample, and ,ȳ are the mean values of x and y, respectively. This systematic approach ensures that variable interactions are clearly defined, providing a solid foundation for the subsequent optimization process.
2.3 Convergence and diversity optimization strategies
This section explains how the algorithm handles categorized clustered variables. As shown in Algorithm 4, pre-processing is needed before optimization. CLMOAS first uses ND_Sort to get segmented fronts and compute Euclidean distance. For CV optimization, CLMOAS selects parent solutions S and produces offspring solutions. Only classified CV variables are different. Replacement is based on metrics. Lines 7–9 of Algorithm 4 randomly select individuals into offspring set using random numbers and frontal numbers. Lines 11–17 generate new solution by reorganizing specified variables. Lines 18–21 perform nondominated sorting of generated solution and original population. In diversity variables optimization, angles between solutions are compared. Two parents are selected to generate offspring by manipulating diversity-related variables.
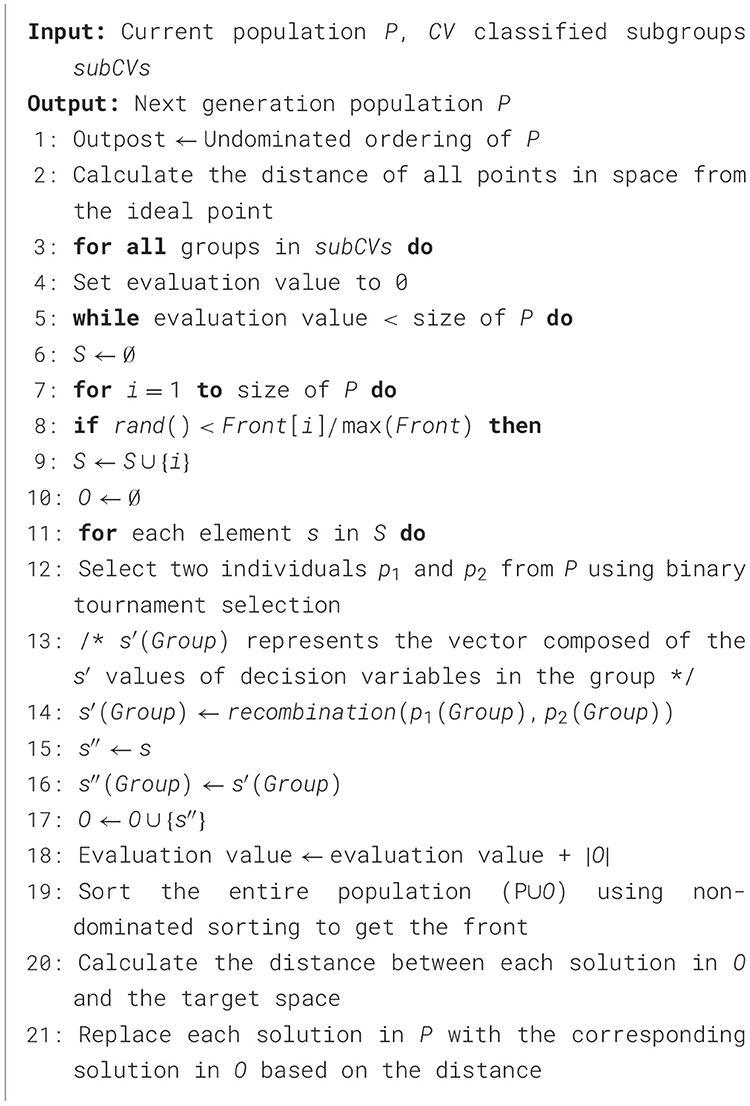
Algorithm 4. Convergence optimization strategy.
As in traditional non-dominated sorting methods, we select 1 to k-1 frontiers into the next generation in order, with k satisfying the minimum value of |F1 ∪ F2 ∪ … ∪ Fk| > |P|. If there exists an extreme case k = 1, then we want to select the more extreme extreme point in the frontier surface into the next generation. If there exists a last selected set of partial orders that is in the middle of the partition line, only some of its individuals can be selected into the next generation, for which a descending ordering based on the angle between every two solutions is used, and they are selected sequentially until the number reaches N. In Algorithm 5, lines 2–7 produce an equal number of offspring using a reorganization approach of selected partial variables from the parent generation, after which line 8 performs a reinforced nondominated ordering to obtain the front faces of each layer. lines 9-16 first select the first k faces to enter the next generation, and one of the subsequent faces selects the partial individuals to proceed to the next generation based on the computation of the value of the smallest angle between the two solutions.
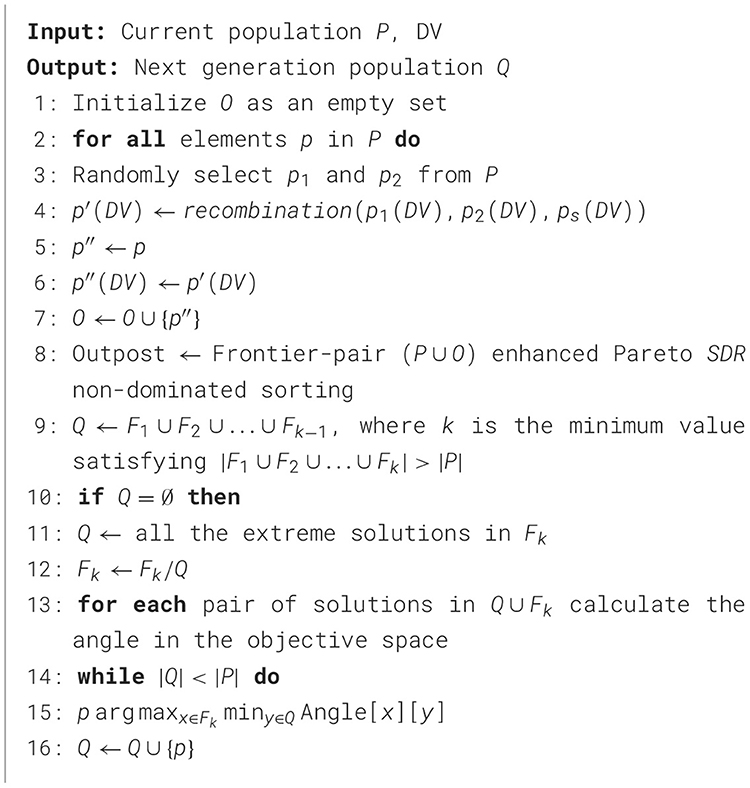
Algorithm 5. Diversity optimization strategy.
Algorithms 4, 5 are repeated until a set number of stopping conditions are met. It should be noted that during the execution of the above algorithms, the evolutionary algorithm used to generate offspring from the parent generation can be any of the current mainstream operators, such as Simulated Binary Crossover (SBC) (Pan et al., 2021), Polynomial Mutation (PM) and Differential Evolution (Carles-Bou and Galan, 2023; Sharma and Kumar, 2022; Hua et al., 2021).
2.4 Enhanced dominance relationships EDR
Despite the advantages of the Strengthening Dominance Relationships (SDR) in multi-objective optimization, it has certain limitations. The SDR may cause solutions to concentrate in a specific area due to its strict dominance conditions. This concentration can lead to the premature elimination of potentially valuable solutions that might contribute to diversity. To address these limitations, we introduce the Enhanced Dominance Relationships (EDR). By incorporating a small positive value ε, which is dynamically adjusted based on the population's diversity metrics, EDR refines the dominance conditions of SDR. Specifically, ε serves as a threshold that balances the trade-off between convergence and diversity by controlling the extent to which solutions with slightly inferior convergence but significantly different diversity can still be considered non-dominated. This modification allows for a more nuanced balance between convergence and diversity in high-dimensional objective spaces. A candidate solution x dominates another y, denoted as x≺SDRy, if and only if:
included among these
Con(x) denotes the convergence value of x as the sum of the objective functions over all objectives at x. is the angular range of half a small habitat. θxy denotes the angle formed by solutions x and y, and is found using the arccos function. Specifically, EDR uses εto adjust the dominance relationship in the region outside the niche. This adjustment helps prevent the premature elimination of solutions that are slightly inferior in convergence but significantly different in terms of diversity. Consequently, EDR can maintain a more evenly distributed set of solutions across the Pareto front, enhancing the algorithm's ability to explore the objective space effectively.
It is important to clarify that EDR's relaxation of dominance conditions operates within a controlled framework. While EDR temporarily preserves solutions with valuable diversity attributes during exploration, strict Pareto dominance is systematically enforced in the final non-dominated sorting phase. This ensures that all truly dominated solutions are rigorously eliminated, maintaining the fundamental convergence guarantee while achieving better diversity balance.
The parameter ε, as a pivotal component in the EDR, is strategically designed to address the challenges of balancing convergence and diversity in multi-objective optimization. Theoretically, ε functions as a threshold to distinguish between solutions that are slightly inferior in convergence but offer significant diversity benefits and those that are genuinely inferior. This mechanism prevents the premature elimination of diverse solutions, ensuring a more even distribution of solutions across the Pareto front. The value of ε is not arbitrarily chosen but is instead determined based on a thorough analysis of the problem's characteristics, such as the complexity of the objective space and the desired distribution of solutions. A larger ε may be necessary for problems with highly complex and non-convex Pareto fronts to ensure sufficient diversity, while a smaller ε might suffice for simpler problems where convergence is the primary concern. By preventing the premature loss of diverse solutions, ε helps maintain a dynamic and evolving population of solutions that can continue to explore new regions of the search space throughout the optimization process. This enhances the algorithm's robustness and adaptability, making it more effective in locating high-quality solutions that might otherwise be overlooked.
In our experimental setup, we conducted a sensitivity analysis to determine the optimal value of ε for the specific problem instances under consideration. This involved systematically varying ε and observing its effects on key performance metrics such as the Inverted Generational Distance (IGD).
Figure 3 shows an example of domination centered on x. Since y1 lies within the niche of x () and the computed convergence is worse than x (Con(x) < Con(y1)), x clearly dominates y1. y2 lies outside the niche of x (), and the vergence is worse than that of x, so x dominates y2. This means in each minor habitat, diverse angles reduce the chance of the same angle, making it rare for all solutions to not dominate each other. Also, per Definition (9)'s second line, if potential solutions x and y are in different small habitats and y converges much worse than x, then x dominates y, ensuring the convergence of non-dominated solutions set. For niche size, when the population size is 2N, to have half solutions enter the next generation in non-dominated sort, the niche size can be set as follows:
In our future work, we intend to explore the application of CLMOAS's Enhanced Dominance Relations (EDR) module in addressing high energy consumption issues. By introducing a small positive value ε, EDR will fine-tune the dominance conditions, ensuring that solutions with slightly inferior convergence but significantly different diversity are not prematurely eliminated. This balance between convergence and diversity aims to help CLMOAS maintain a more evenly distributed set of solutions across the Pareto front, potentially leading to more efficient energy usage and cost reduction in relevant scenarios.
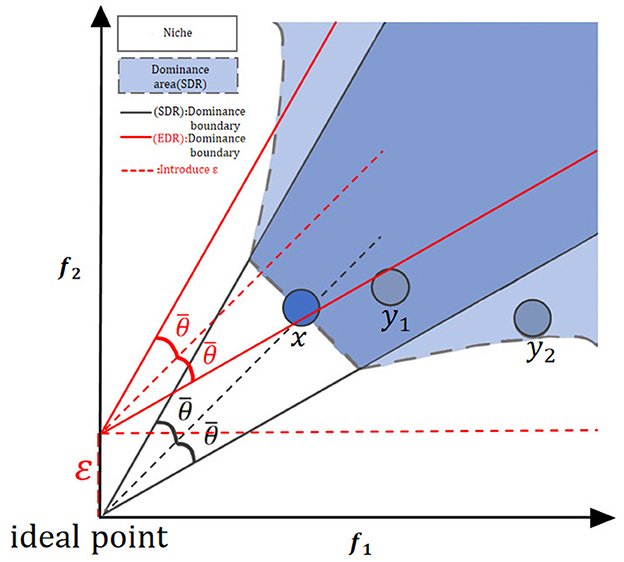
Figure 3. Dominant region under the proposed EDR. Within the niche the original SDR still works; outside, EDR loosens the criterion by a tiny self-adaptive ε, letting slightly worse yet widely spread solutions survive, so the population keeps both convergence and diversity.
3 Experiments
3.1 Selection of inverted generational distance indicator
We selected the Inverted Generational Distance (IGD) metric for performance evaluation based on its ability to provide a comprehensive assessment of solution quality. IGD simultaneously quantifies convergence performance by measuring the proximity to the true Pareto front and evaluates diversity maintenance through distribution characteristics. This balanced evaluation approach directly corresponds to CLMOAS's fundamental goal of achieving an optimal trade-off between convergence and diversity in large-scale multi-objective optimization.
IGD (Wang Z. et al., 2024; Li et al., 2022), full name Inverted Generational Distance, i.e., Inverse Generational Distance evaluation metric, is calculated as follows:
P is the set of solutions evenly distributed on the true Pareto front, serving as a reference, and |P| denotes the number of solutions in set P. Q represents the optimal Pareto solution set calculated by the algorithm. Although the current experiment is based on standard DTLZ and UF test sets, the problem dimensions (five objectives, 100–200 variables) and the conflicting characteristics between objectives are highly consistent with real micro-CDN optimization tasks. Algorithm performance is evaluated by calculating the sum of the minimum Euclidean distances between the reference solution set and the algorithm solution set: the smaller the distance, the better the algorithm performance. If the algorithm has good convergence, the d(v, Q) value is low; if the algorithm has poor diversity and individual clustering, the d(v, Q) value is high, indicating poor distribution performance. When the number of objectives is expanded to 10 (WFG1-9), CLMOAS remains leading. This cross-dimensional stability indicates that angle-based variable clustering and SDR dominance relationships remain effective, directly demonstrating its potential to provide high-quality trade-off solutions in 5G micro-CDN scenarios, ensuring the algorithm can smoothly scale to the ten-objective version of 5G optimization problems.
3.2 Comparison experiment
We configured the initial parameters for all algorithms as follows: for most algorithms, the number of objectives was configured as 5 (with exceptions of 10 for the WFG test set, two for ZDT3, and three for RMMEDA_F4), the number of decision variables was determined as 100 and 200 (with 200 chosen to simulate an increase in variable scale within equipment performance limits), the population size was uniformly set to 100, and the genetic operator used was the Simulated Binary Crossover (SBC). For the MOEA/D algorithm, the Chebyshev decomposition function was employed, the selection neighborhood size was set to 0.1N (N being the population size), and the neighborhood selection probability was 0.9. For LMEA and CLMOAS, parameters were set as nSel (number of sample solutions selected in decision variable clustering) to 4, nPer (number of perturbations applied in the clustering process) to 6, and nCor (maximum number of judgments for variable relevance in interaction analysis) to 6.
Tables 1, 2 present the IGD index values of five algorithms running independently ten times on the DTLZ and UF test sets with five objectives and 100/200 decision variables. Bold values indicate the best results in each test set. The symbols “+”, “−,” and “=” respectively show whether results are significantly superior to, inferior to, or on par with CLMOAS in comparative statistics.
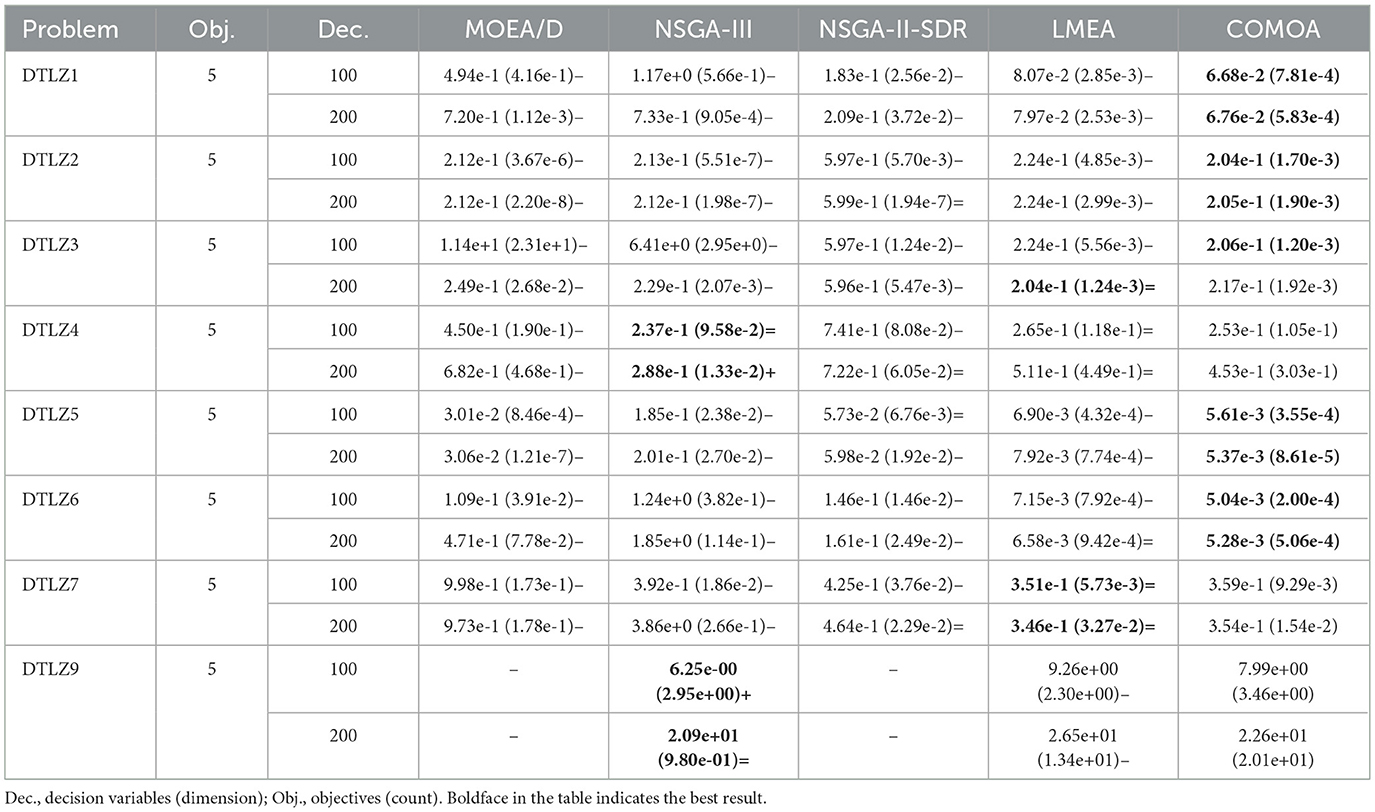
Table 1. IGD results for five algorithms such as CLMOAS on the DTLZ test set.
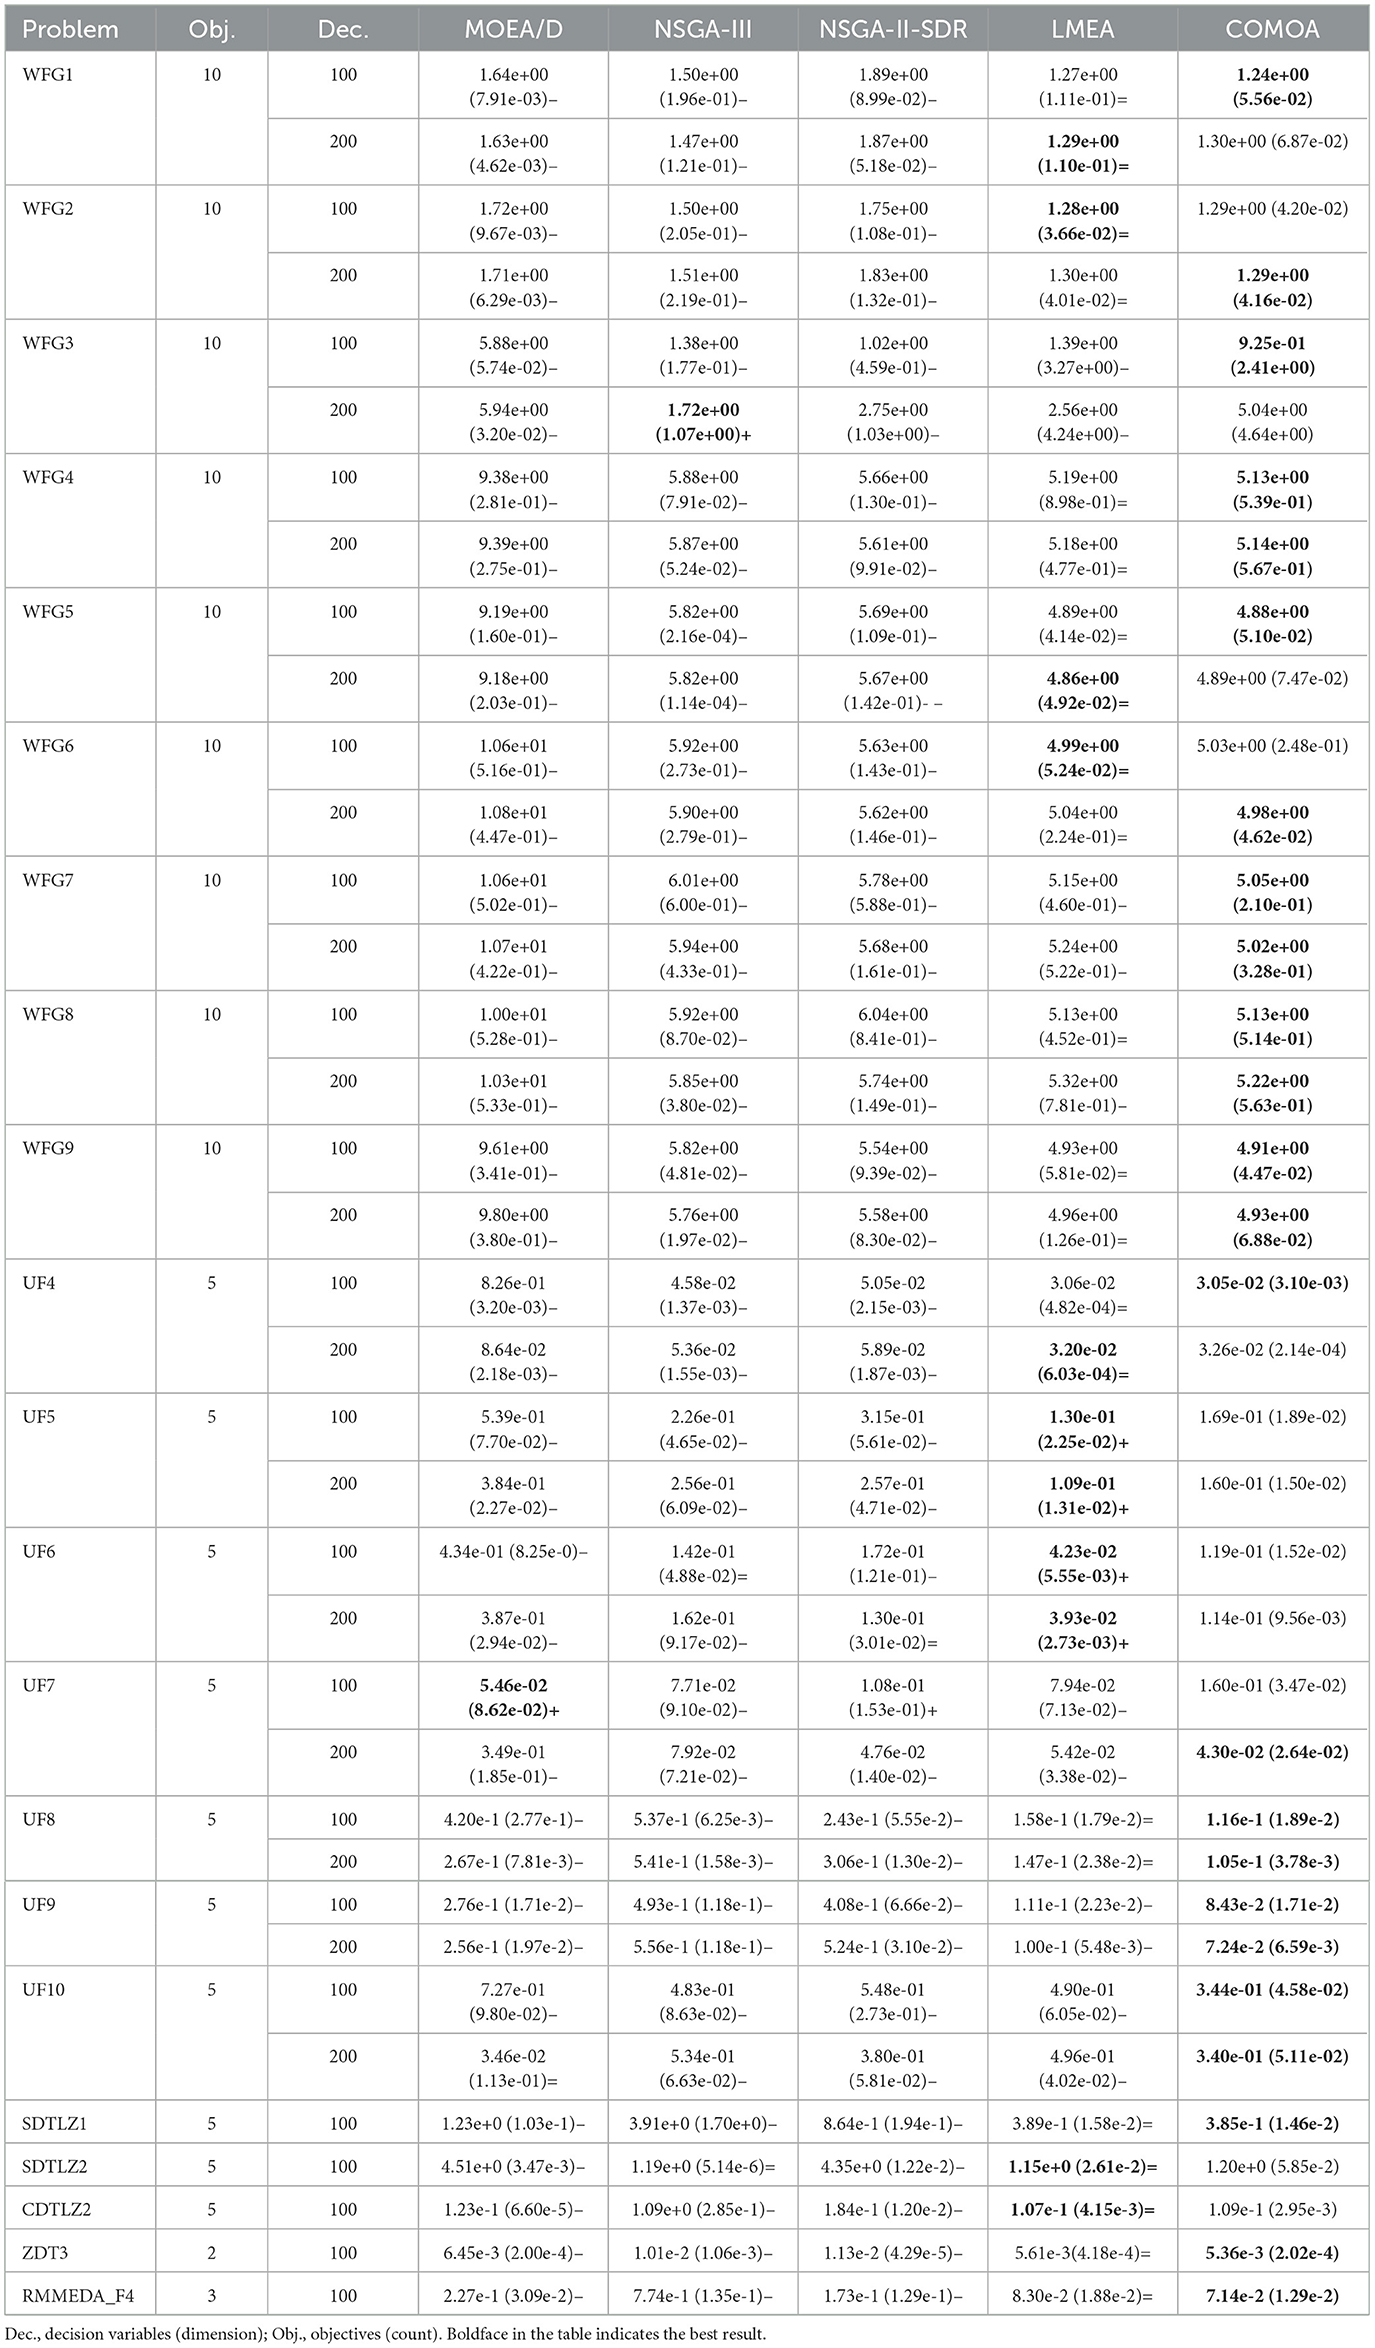
Table 2. IGD results of five algorithms such as CLMOAS on complex WFG and UF test sets.
In the DTLZ test set evaluation (Table 1), CLMOAS demonstrates marked superiority across several problems. Taking DTLZ2 as an example–under a five-objective micro-CDN scenario–CLMOAS achieves IGD values of 2.04e−1 and 2.05e−1 when the numbers of decision variables are 100 and 200, respectively, both of which are lower than those of all competing algorithms. This indicates that CLMOAS is capable of approximating the true Pareto front with remarkable accuracy. Even when the variable count rises to 200, CLMOAS retains its leading performance, confirming its stable and scalable optimization capability for real-world 5G micro-CDN deployments.
In the WFG test set evaluation (Table 2), CLMOAS efficiently managed problems with complex Pareto fronts. The WFG test set is known for its high non-convexity and discontinuities. CLMOAS's strong performance here proves its ability to explore the solution space and identify high-quality solutions. Additionally, CLMOAS achieved low IGD values in the UF test set, particularly on UF8, with an IGD value of 1.16e−1. This further confirms its broad applicability and effectiveness in solving diverse multi-objective optimization problems.
3.3 Result analysis
The evaluation of the performance of the CLMOAS algorithm is further supplemented by data from Figures 4–6. These graphs provide a visual representation of how CLMOAS stacks up against other algorithms when tackling the complex DTLZ4 test problem. They serve as a valuable tool to discern the nuanced differences in CLMOAS's performance relative to other algorithms and offer a means to visually assess its strengths on specific test problems.
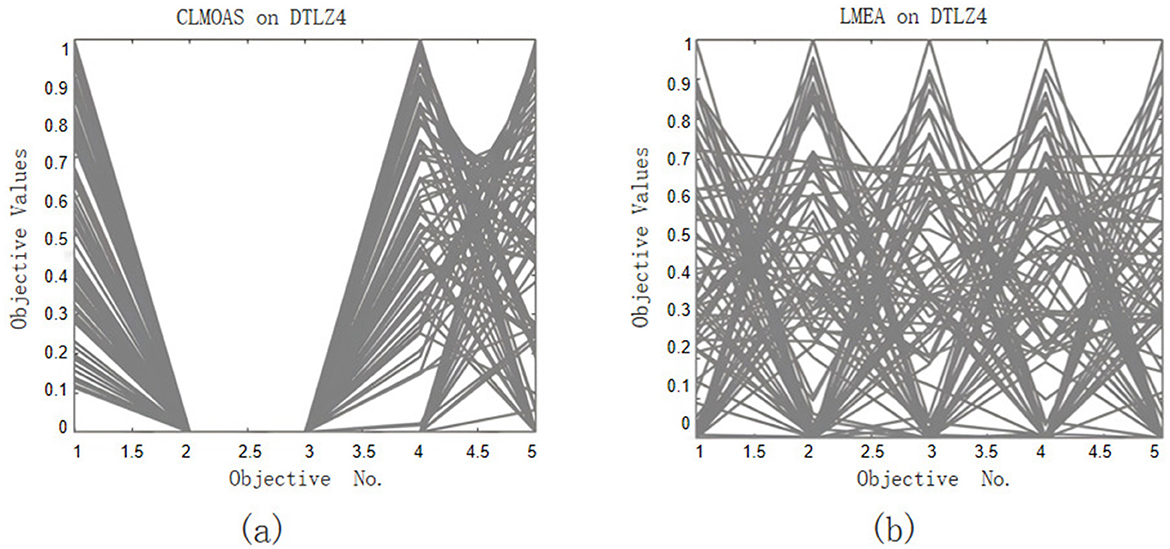
Figure 4. (a) and (b) compare our algorithm CLMOAS with LMEA: (a) CLMOAS stays lowest throughout on DTLZ4, converging fast and steadily; (b) LMEA's curve on the same problem is higher and flatter, clearly less accurate.
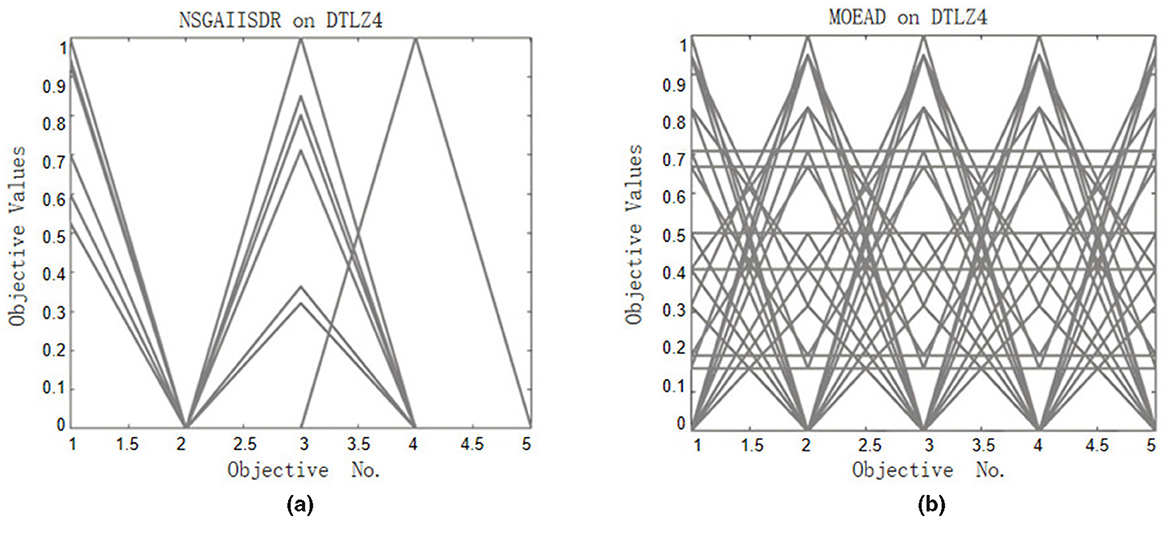
Figure 5. (a) and (b) illustrate the convergence behaviour of the comparative algorithms MOEA/D and NSGA-II-SDR on DTLZ4. In both sub-plots the obtained solution sets are sparse and irregularly scattered; their extreme ends visibly diverge from the reference Pareto front, while pronounced gaps and larger deviations demonstrate slower convergence and markedly inferior completeness relative to CLMOAS.
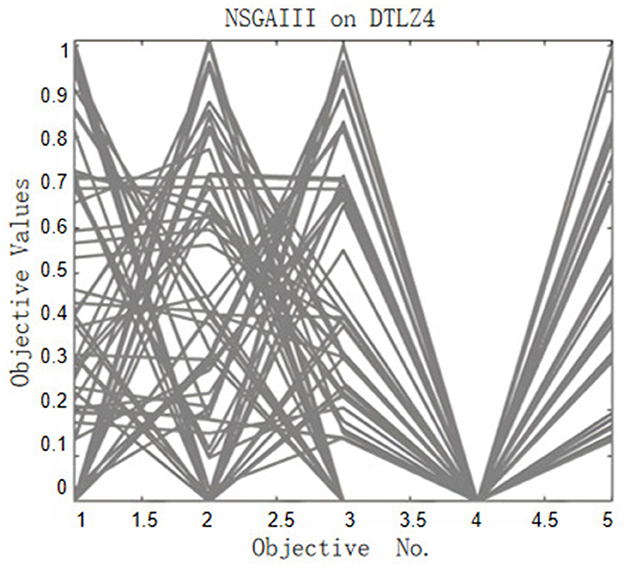
Figure 6. NSGA-III on DTLZ4. The obtained front is visibly coarser and departs from the true surface; the spread is uneven and the extreme ends bend inward, indicating that NSGA-III converges more slowly and less completely than CLMOAS.
Beyond these visual comparisons, the superior performance observed in CLMOAS finds its roots in the algorithm's core methodological innovations. The k-means based variable clustering establishes a sophisticated division of labor by accurately distinguishing between convergence-promoting and diversity-enhancing variables, thereby enabling specialized optimization strategies for each category. This strategic partitioning works in concert with the Enhanced Dominance Relationships, which maintain effective selection pressure in high-dimensional objective spaces through angular proximity assessment and dynamic ε adjustment. Together, these complementary mechanisms create a synergistic optimization framework that excels in both convergence precision and diversity preservation-advantages that become clearly evident in the subsequent comparative analysis of algorithmic performance.
Through a meticulous analysis of the tables and graphs, we can draw three significant conclusions about algorithmic performance:
MOEA/D and NSGAIII, despite achieving desirable results on certain test sets, overall underperform compared to CLMOAS. When the number of decision variables increases from 100 to 200, CLMOAS demonstrate remarkable stability in maintaining relatively consistent IGD values across various test sets, which is a strong indicator of excellent scalability.
NSGAII, equipped with its enhanced dominance relation, shows superior performance to NSGAIII on some datasets. This observation suggests that the enhanced dominance relation can confer certain advantages in specific problem-solving scenarios.
CLMOAS generally exhibits superior performance to LMEA in terms of IGD values and convergence across the majority of test sets. This finding further corroborates the effectiveness of the reinforced Pareto relationship employed in CLMOAS. It can effectively reduce domination resistance, thus improving the convergence and diversity of offspring populations following non-dominated sorting and selection. This makes CLMOAS a more robust and efficient algorithm for handling complex, large-scale multi-objective optimization problems.
4 Conclusions
The paper introduces CLMOAS, an advanced algorithmic framework that integrates k-means variable clustering with a novel Reinforced Pareto Relationship to effectively handle large-scale multi-objective optimization problems. Although the computational demands of the clustering process remain manageable in our experiments, they may increase significantly when handling extremely high-dimensional problems, affecting both computation time and memory usage. Despite this limitation, CLMOAS demonstrates remarkable performance in generating diverse, high-quality solutions by simplifying the decision space while maintaining a balance between convergence and diversity. Experimental validation confirms its superiority over state-of-the-art algorithms in both solution quality and diversity. Looking forward, we plan to explore CLMOAS's application in 5G and beyond-5G networks, particularly for micro-CDN deployment, while enhancing its efficiency through GPU-based parallelization to address complex optimization challenges in advanced network environments.
Data availability statement
The data and code are available at https://github.com/Fxmm973/CLMOAS.
Author contributions
PW: Methodology, Writing – review & editing, Supervision, Funding acquisition, Writing – original draft, Data curation, Resources, Conceptualization. YF: Writing – review & editing, Methodology, Writing – original draft, Formal analysis, Data curation. HY: Writing – review & editing, Formal analysis, Data curation. ZX: Writing – original draft, Investigation. CH: Writing – original draft, Resources. ZY: Writing – review & editing, Funding acquisition. YZ: Writing – review & editing, Funding acquisition. FZ: Writing – review & editing, Validation.
Funding
The author(s) declare that financial support was received for the research and/or publication of this article. This research was supported by the Natural Science Foundation of Fujian Province (Grant No. 2024J08372), the Natural Science Foundation of Hunan Province (Grant No. 2022JJ50084), and the Department of Education of Hunan Province (Grant Nos. 23B0572, 23B0547, and XJK25BZY003). We also gratefully acknowledge the financial and resource support provided by the Key Laboratory of 3D Scene Visualization and Intelligent Education in Hunan Province and the Research Center for Innovative Development of Teacher Education in the New Era.
Conflict of interest
The authors declare that the research was conducted in the absence of any commercial or financial relationships that could be construed as a potential conflict of interest.
Generative AI statement
The author(s) declare that no Gen AI was used in the creation of this manuscript.
Any alternative text (alt text) provided alongside figures in this article has been generated by Frontiers with the support of artificial intelligence and reasonable efforts have been made to ensure accuracy, including review by the authors wherever possible. If you identify any issues, please contact us.
Publisher's note
All claims expressed in this article are solely those of the authors and do not necessarily represent those of their affiliated organizations, or those of the publisher, the editors and the reviewers. Any product that may be evaluated in this article, or claim that may be made by its manufacturer, is not guaranteed or endorsed by the publisher.
References
Ben Said, L., Bechikh, S., and Ghedira, K. (2010). The r-dominance: a new dominance relation for interactive evolutionary multicriteria decision making. IEEE Trans. Evol. Comput. 14, 801–818. doi: 10.1109/TEVC.2010.2041060
Carles-Bou, J. L., and Galan, S. F. (2023). Self-adaptive polynomial mutation in NSGA-II. Soft Comput. 27, 17711–17727. doi: 10.1007/s00500-023-09049-0
Cheng, R., Jin, Y., Olhofer, M., and Sendhoff, B. (2017). Test problems for large-scale multiobjective and many-objective optimization. IEEE Trans. Cybern. 47, 4108–4121. doi: 10.1109/TCYB.2016.2600577
Cheng, S., Ma, L., Lu, and Xiujuan Shi, Y. (2021). Evolutionary computation for solving search-based data analytics problems. Artif. Intell. Rev. 54, 1321–1348. doi: 10.1007/s10462-020-09882-x
El-Shorbagy, M. A., and El-Refaey, A. M. (2022). A hybrid genetic-firefly algorithm for engineering design problems. J. Comput. Des. Eng. 9, 706–730. doi: 10.1093/jcde/qwac013
Fu, Y., Hou, Y., Wang, Z., Wu, X., Gao, K., Wang, L., et al. (2021). Distributed scheduling problems in intelligent manufacturing systems. Tsinghua Sci. Technol. 26, 625–645. doi: 10.26599/TST.2021.9010009
Guo, G., Wu, N., and Liu, L. (2023). Low power application specific soc chip for uncooled infrared image processing. J. Infrared Millim. Waves 42, 122–131. doi: 10.11972/j.issn.1001-9014.2023.01.015
Guo, T., Mei, Y., Tang, K., and Du, W. (2024). Cooperative co-evolution for large-scale multiobjective air traffic flow management. Trans. Evol. Comp. 28, 1644–1658. doi: 10.1109/TEVC.2023.3328886
Hu, Y., Zhang, Y., and Gong, D. (2021). Multiobjective particle swarm optimization for feature selection with fuzzy cost. IEEE Trans. Cybern. 51, 874–888. doi: 10.1109/TCYB.2020.3015756
Hua, Y., Liu, Q., Hao, K., and Jin, Y. (2021). A survey of evolutionary algorithms for multi-objective optimization problems with irregular pareto fronts. IEEE/CAA J. Autom. Sin. 8, 303–318. doi: 10.1109/JAS.2021.1003817
Ishibuchi, H., Tsukamoto, N., and Nojima, Y. (2008). “Evolutionary many-objective optimization: a short review,” in 2008 IEEE Congress on Evolutionary Computation (IEEE World Congress on Computational Intelligence) (Hong Kong: IEEE), 2419–2426. doi: 10.1109/CEC.2008.4631121
Krishna, R., Tang, C., Sullivan, K., and Ray, B. (2022). Conex: Efficient exploration of big-data system configurations for better performance. IEEE Trans. Softw. Eng. 48, 893–909. doi: 10.1109/TSE.2020.3007560
Li, F., Shang, Z., Shen, H., Liu, Y., and Huang, P. Q. (2022). Combining modified inverted generational distance indicator with reference-vector-guided selection for many-objective optimization. Appl. Intell. 53, 12149–12162. doi: 10.1007/s10489-022-04115-w
Liu, J., and Ruochen, L. (2024). Objective contribution decomposition method and multi-population optimization strategy for large-scale multi-objective optimization problems. Inf. Sci. 678:120950. doi: 10.1016/j.ins.2024.120950
Liu, Y., Li, J., Zou, J., Hou, Z., Yang, S., Zheng, J., et al. (2024a). Continuous variation operator configuration for decomposition-based evolutionary multi-objective optimization. Swarm Evol. Comput. 89:101644. doi: 10.1016/j.swevo.2024.101644
Liu, Y., Xu, L., Han, Y., Zeng, X., Yen, G. G., Ishibuchi, H., et al. (2024b). Evolutionary multimodal multiobjective optimization for traveling salesman problems. IEEE Trans. Evol. Comput. 28, 516–530. doi: 10.1109/TEVC.2023.3239546
Liu, Y., Yang, J., Ren, X., Zhang, X., Liu, Y., Song, B., et al. (2025). Multi-objective molecular design through learning latent pareto set. Proc. AAAI Conf. Artif. Intell. 39, 19006–19014. doi: 10.1609/aaai.v39i18.34092
Liu, Y., Zhang, L., Zeng, X., and Han, Y. (2024c). Evolutionary multimodal multiobjective optimization guided by growing neural gas. Swarm Evol. Comput. 86:101500. doi: 10.1016/j.swevo.2024.101500
Liu, Y., Zhang, X., Liu, Y., Su, Y., Zeng, X., Yen, G. G., et al. (2023). Evolutionary multi-objective optimization in searching for various antimicrobial peptides [feature]. IEEE Comput. Intell. Mag. 18, 31–45. doi: 10.1109/MCI.2023.3245731
Liu, Y., Zhu, N., Li, K., Li, M., Zheng, J., Li, K., et al. (2020a). An angle dominance criterion for evolutionary many-objective optimization. Inf. Sci. 509, 376–399. doi: 10.1016/j.ins.2018.12.078
Liu, Y., Zhu, N., and Li, M. (2020b). Solving many-objective optimization problems by a pareto-based evolutionary algorithm with preprocessing and a penalty mechanism. IEEE Trans. Cybern. 51, 5585–5594. doi: 10.1109/TCYB.2020.2988896
Liu, Z.-Z., Qin, Y., Song, W., Zhang, J., and Li, K. (2023). Multiobjective-based constraint-handling technique for evolutionary constrained multiobjective optimization: a new perspective. IEEE Trans. Evol. Comput. 27, 1370–1384. doi: 10.1109/TEVC.2022.3194729
Liu, Z.-Z., Wu, F., Liu, J., Qin, Y., and Li, K. (2025). Constrained multiobjective optimization with escape and expansion forces. IEEE Trans. Evol. Comput. 29, 2–15. doi: 10.1109/TEVC.2023.3270483
Pan, L., Xu, W., Li, L., He, C., and Cheng, R. (2021). Adaptive simulated binary crossover for rotated multi-objective optimization. Swarm Evol. Comput. 60:100759. doi: 10.1016/j.swevo.2020.100759
Pons, M., Valenzuela, E., Rodríguez, B., Nolazco-Flores, J. A., and Del-Valle-Soto, C. (2023). Utilization of 5g technologies in iot applications: current limitations by interference and network optimization difficulties—a review. Sensors 23:3876. doi: 10.3390/s23083876
Shang, K., Ishibuchi, H., Chen, W., Nan, Y., and Liao, W. (2022). Hypervolume-optimal μ-distributions on line/plane-based pareto fronts in three dimensions. IEEE Trans. Evol. Comput. 26, 349–363. doi: 10.1109/TEVC.2021.3093114
Sharma, S., and Kumar, V. (2022). A comprehensive review on multi-objective optimization techniques: past, present and future. Arch. Comput. Methods Eng. 29, 5605–5633. doi: 10.1007/s11831-022-09778-9
Song, X.-F., Zhang, Y., Gong, D.-W., and Gao, X.-Z. (2022). A fast hybrid feature selection based on correlation-guided clustering and particle swarm optimization for high-dimensional data. IEEE Trans. Cybern. 52, 9573–9586. doi: 10.1109/TCYB.2021.3061152
Sreedhara, S., Sorensen, T. J., Poursaee, A., and Ross, B. E. (2023). Practical application of digital image processing in measuring concrete crack widths in field studies. Pract. Period. Struct. Des. Constr. 28:05022006. doi: 10.1061/(ASCE)SC.1943-5576.0000735
Sridevi, M., Sharma, P., Kumar, M., Loganathan, D., and Ahmed, S. (2024). Optimizing efficiency and performance in 5g networks through a dynamic resource allocation algorithmic framework. ICTACT J. Commun. Technol. 15, 3112–3118. doi: 10.21917/ijct.2024.0463
Srinivas, N., and Deb, K. (1994). Muiltiobjective optimization using nondominated sorting in genetic algorithms. Evol. Comput. 2, 221–248. doi: 10.1162/evco.1994.2.3.221
Su, Z., and Xu, Q. (2015). Content distribution over content centric mobile social networks in 5g. IEEE Commun. Mag. 53, 66–72. doi: 10.1109/MCOM.2015.7120047
Tahmasebi, S., Moradi, P., Ghodsi, S., and Abdollahpouri, A. (2019). An ideal point based many-objective optimization for community detection of complex networks. Inf. Sci. 502, 125–145. doi: 10.1016/j.ins.2019.06.010
Tian, Y., Si, L., Zhang, X., Cheng, R., He, C., Tan, K. C., et al. (2021). Evolutionary large-scale multi-objective optimization: a survey. ACM Comput. Surv. 54:174. doi: 10.1145/3470971
Wang, B.-C., Qin, Y., Meng, X.-B., Wang, Y., and Liu, Z.-Z. (2024). ATM-R: an adaptive tradeoff model with reference points for constrained multiobjective evolutionary optimization. IEEE Trans. Cybern. 54, 4475–4488. doi: 10.1109/TCYB.2023.3329947
Wang, P., Li, K., Xiao, B., and Li, K. (2022). Multiobjective optimization for joint task offloading, power assignment, and resource allocation in mobile edge computing. IEEE Internet Things J. 9, 11737–11748. doi: 10.1109/JIOT.2021.3132080
Wang, Z., Pei, Y., and Li, J. (2023). A survey on search strategy of evolutionary multi-objective optimization algorithms. Appl. Sci. 13:4643. doi: 10.3390/app13074643
Wang, Z., Xiao, C., and Zhou, A. (2024). Exact calculation of inverted generational distance. IEEE Trans. Evol. Comput. 29, 1966–1975. doi: 10.1109/TEVC.2024.3442920
Xi, B., and Lei, D. (2022). Q-learning-based teaching-learning optimization for distributed two-stage hybrid flow shop scheduling with fuzzy processing time. Complex Syst. Model. Simul. 2, 113–129. doi: 10.23919/CSMS.2022.0002
Yuan, Y., Xu, H., Wang, B., and Yao, X. (2016). A new dominance relation-based evolutionary algorithm for many-objective optimization. IEEE Trans. Evol. Comput. 20, 16–37. doi: 10.1109/TEVC.2015.2420112
Zhang, Q., and Li, H. (2007). MOEA/D: a multiobjective evolutionary algorithm based on decomposition. IEEE Trans. Evol. Comput. 11, 712–731. doi: 10.1109/TEVC.2007.892759
Zhang, X., Tian, Y., and Jin, Y. (2015). A knee point-driven evolutionary algorithm for many-objective optimization. IEEE Trans. Evol. Comput. 19, 761–776. doi: 10.1109/TEVC.2014.2378512
Zhang, Y., Wang, G., and Wang, H. (2023). NSGA-II/SDR-OLS: a novel large-scale many-objective optimization method using opposition-based learning and local search. Mathematics 11:1911. doi: 10.3390/math11081911
Zhao, L., Wang, B., Jiang, X., Yicheng, L. U., and Yihua, H. U. (2022). Dip-moea:a double-grid interactive preference based multi-ob jective evolutionary algorithm for formalizing preferences of decision makers. Front. Inf. Electron. Eng. 23:19. doi: 10.1631/FITEE.2100508
Zheng, J., Du, Z., Zou, J., and Yang, S. (2023). A weight vector generation method based on normal distribution for preference-based multi-objective optimization. Swarm Evol. Comput. 77:101250. doi: 10.1016/j.swevo.2023.101250
Zheng, Y., Wang, Y., and Liu, J. (2022). Research on structure optimization and motion characteristics of wearable medical robotics based on improved particle swarm optimization algorithm. Future Gener. Comput. Syst. 129, 187–198. doi: 10.1016/j.future.2021.11.021
Zhong, R., Zhang, E., and Munetomo, M. (2024). Cooperative coevolutionary surrogate ensemble-assisted differential evolution with efficient dual differential grouping for large-scale expensive optimization problems. Complex Intell. Syst. 10, 2129–2149. doi: 10.1007/s40747-023-01262-6
Zhou, Z., and Abawajy, J. (2025). Reinforcement learning-based edge server placement in the intelligent internet of vehicles environment. IEEE Trans. Intell. Transp. Syst. 1–11. doi: 10.1109/TITS.2025.3557259
Zhou, Z., Abawajy, J., Chowdhury, M., Zhigang, H., and Li, K. (2018). Minimizing sla violation and power consumption in cloud data centers using adaptive energy-aware algorithms. Future Gener. Comput. Syst. 86, 836–850. doi: 10.1016/j.future.2017.07.048
Zhou, Z., Shojafar, M., Abawajy, J., Yin, H., and Lu, H. (2022a). ECMS: an edge intelligent energy efficient model in mobile edge computing. IEEE Trans. Green. Commun. Netw. 6, 238–247. doi: 10.1109/TGCN.2021.3121961
Zhou, Z., Shojafar, M., Alazab, M., Abawajy, J., and Li, F. (2021). AFED-EF: an energy-efficient vm allocation algorithm for iot applications in a cloud data center. IEEE Trans. Green Commun. Netw. 5, 658–669. doi: 10.1109/TGCN.2021.3067309
Zhou, Z., Shojafar, M., Alazab, M., and Li, F. (2022b). IECL: an intelligent energy consumption model for cloud manufacturing. IEEE Trans. Industr. Inform. 18, 8967–8976. doi: 10.1109/TII.2022.3165085
Zitzler, E., and Künzli, S. (2004). “Indicator-based selection in multiobjective search,” in Parallel Problem Solving from Nature - PPSN VIII (Berlin: Springer Berlin Heidelberg), 832–842. doi: 10.1007/978-3-540-30217-9_84
Keywords: evolutionary multi-objective optimization, many-objective optimization, large-scale optimization, clustering, dominance relationship
Citation: Wang P, Fu Y, Yuan H, Xiao Z, Huang C, Yang Z, Zhang Y and Zhou F (2025) CLMOAS: collaborative large-scale multi-objective optimization algorithms with adaptive strategies. Front. Comput. Sci. 7:1692784. doi: 10.3389/fcomp.2025.1692784
Received: 26 August 2025; Accepted: 16 October 2025;
Published: 06 November 2025.
Edited by:
Zhou Zhou, Changsha University, ChinaReviewed by:
Yuan Liu, Xiangtan University, ChinaShuzhi Su, Anhui University of Science & Technology, China
Copyright © 2025 Wang, Fu, Yuan, Xiao, Huang, Yang, Zhang and Zhou. This is an open-access article distributed under the terms of the Creative Commons Attribution License (CC BY). The use, distribution or reproduction in other forums is permitted, provided the original author(s) and the copyright owner(s) are credited and that the original publication in this journal is cited, in accordance with accepted academic practice. No use, distribution or reproduction is permitted which does not comply with these terms.
*Correspondence: Zhao Yang, emhhb3lhbmdAaG5mbnUuZWR1LmNu; Yijing Zhang, MTg2OTI2NjA4NjZAMTYzLmNvbQ==