 Lukas Günthermann
 Ivor Simpson
 Phil Birch
 Daniel Roggen
- 1Department of Engineering and Design, University of Sussex, Brighton, United Kingdom
- 2Department of Informatics, University of Sussex, Brighton, United Kingdom
Wearable Activity Recognition consists of recognizing actions of people from on-body sensor data using machine learning. Developing suitable machine learning models typically requires substantial amounts of annotated training data. Manually annotating large datasets is tedious and time intensive. Interactive machine learning systems can be used to support this, with the aim of reducing annotation time or improving accuracy. We contribute a new web-based annotation tool for time series signals synchronized with a video recording with integrated automated suggestions, facilitated by ML models, to assist and improve the annotation process of annotators. This is enabled by focusing user attention toward points of interest. This is particularly relevant for the annotation of long periodic activities to allow fast navigation in large datasets without skipping start and end points of activities. To evaluate the efficacy of this system, we conducted a user study with 32 participants who were tasked with annotating modes of locomotion in a dataset composed of multiple long (over 12 h) consecutive sensor recordings captured by body-worn accelerometers. We analyzed the quantitative impact on annotation performance and the qualitative impact on the user experience. The results show that the implemented annotation assistance improved the annotation quality by 11% F1 Score but reduced annotation speed by 20%, whereas the NASA Task Load Index results show that participants perceived the assistance as beneficial for annotation speed but not for annotation quality.
1 Introduction
The wide-spread usage of smartphones, fitness trackers, and interconnected devices has resulted in a significant surge in body-worn sensors. Typical sensors capture acceleration and rate of turn (Altun and Barshan, 2010), as well as physiological parameters like body temperature, heart rate, and sweat rate (Chadha et al., 2023). Human activity recognition (HAR) aims to identify the actions of people based on the time series originating from those sensors using machine learning and deep learning techniques (Bulling et al., 2014). Strong performance of these models, especially for deep learning, generally relies on a large amount of available training data (Chen et al., 2021).
In order to create a new dataset for training and evaluating activity recognition models, it is necessary to record the wearable sensor data and then annotate the sensor recordings to establish a ground truth. Typically, this annotation process involves aligning sensor data with corresponding video recordings to identify specific time intervals that capture the relevant activities. This task is labor-intensive due to the extended duration of observations—a point underscored by the Opportunity dataset, where annotating video footage took approximately 14–20 times longer than the duration of the footage itself (Roggen et al., 2010).
To streamline the process of annotating activity datasets, smart annotation techniques can be employed, which rely on the implementation of online learning, interactive learning and semi-supervised training methods, and thereby reducing the effort required for dataset annotation. In our work, smart or automated annotation assistance refers to the use of machine learning to predict potential annotations for wearable sensor data which is presented as a suggestion to the annotator, who can accept, ignore, or adjust and improve on the suggestion. The performance of various unsupervised and semi-supervised machine learning methods when predicting class labels and—theoretically—assisting manual annotation efforts, has been previously explored (Demrozi et al., 2023). However, little research has been done to evaluate the effect of these within a complete assistive systems considering also the effect on the user's accuracy, speed of work, and perception of ease of use and mental workload. One reason for the limited evaluations in real-world deployments is that there are only a limited number of tools are available suitable to investigate such assisted annotation systems (Hoelzemann and Van Laerhoven, 2024).
In order to investigate the impact of annotation assistance, we implemented the Smart Annotation Assistance Tool (SAAT), a new web-based annotation tool for time-series data synced with video footage.1 SAATuses a machine learning model [a variation of an attention-based neural network known as MFCANN (Yang et al., 2024)] to generate annotation suggestions, which are used to focus the annotator's attention toward points of interest in the sensor material. Specifically, the system indicates the start and end times of potential activity segments as well as potential activity classes. This allows playback to be sped up without missing start and end points of activities, making the assistance particularly relevant for the annotation of long periodic activities. Instead of a machine learning model, SAAT can also use annotations suggested by human annotators or even synthetically generated annotations, such as annotations generated from the ground truth with artificial variations to evaluate the system in a controlled fashion. This allows the performance of the overall system to be decoupled from the underlying machine learning model, and we use this to perform a evaluation of the system in a controlled manner. We released SAATpublicly.2
We used SAATto conduct a user study with 32 participants in total to estimate the impact of annotation assistance on the performance and experience of users. As benchmark served the Sussex-Huawei Locomotion and Transportation dataset (Gjoreski et al., 2018), which is characterized by multiple over 12 h long consecutive sensor recordings captured by multiple body-worn sensors, including accelerometers. The user study was divided into two phases. For the first phase, we incorporated synthetic annotation assistance which included misplaced suggested onsets and offsets of activity segments and incorrect suggested labels, created by manipulating the ground truth annotation. The findings gathered in this more controlled setting were used to further refine the tool. The second phase of the study focused on the real-world usage of the annotation tool. For this, MFCANNwas used to obtain suggestions from an attention-based machine learning model. Participants of the first phase were excluded from the second phase, in order to prevent their experience with the tool and task from skewing the results.
During both phases, each participant was asked to perform two annotation scenarios with our system, once with annotation assistance and once without. Each scenario required the participant to navigate roughly 12 h of continuous first person video footage and wearable accelerometer data in 20 min and to annotate the modes of locomotion and transportation performed by the dataset subjects. In order to derive objective measures of performance, annotation speed and quality was captured. For subjective measures, we used the NASA Task Load Index (NASA-TLX) (Hart and Staveland, 1988) to capture the mental workload of participants and a questionnaire to obtain further feedback.
In short, the contributions of this paper are:
1. The implementation of a new web-based tool for the annotation of time-series data, which can use ML methods (notably MFCANN) to assist the human annotator by highlighting start and end point of segments of interest in a time series of wearable sensor data, and suggests a suitable annotation label (Section 3).
2. A user study to examine the impact of the implemented automated assistance on the annotation performance and experience (Section 4). The evaluation considers the individual performances of participants, but also includes a simulated crowd-sourcing scenario.
2 Related work
Software-based activity annotation involves annotators operating on a user interface, which displays wearable sensor signals, video recordings, and other modalities to manually segment (select start and end point within the time series data) and/or label (select a class label describing a segmented activity) activity data. In this context, we refer to annotation assistance as a support mechanism which uses segmentation or label suggestions provided by machine learning or other means (e.g. other annotators), to improve annotation performance, speed, experience, and/or other factors. This section is reviewing methods to implement annotation assistance and to evaluate the performance and experience of annotators. This includes quantitative assessments such as speed and accuracy, as well as qualitative investigations into mental aspects such as frustration, stress, confidence, sense of accomplishment, or other perceptions regarding the annotation task. We focus this review particularly on the annotation of time series data recorded by inertial measurement units (IMU). However, more broader time series annotation (e.g. audio signals) or comparable scenarios such as video and image annotation are considered as well.
Manual annotation can be performed by the individual who is performing the activity or by an external observer. Since the individual is generally aware of what activity they are performing, self-annotation comes with different requirements for implementation, assistance, and evaluation (see e.g. Mairittha et al., 2021; Hoelzemann and Van Laerhoven, 2024). In this work, we will be focusing on automated assistance for external observers who annotate activity data, which was previously unseen to them.
Demrozi et al. (2023) propose a taxonomy to differentiate automated data annotation techniques in HAR, distinguishing between automated and semi-automated approaches. Semi-automated approaches refer to the combination of manual and automated annotation methods. Our approach of using automated annotations to assist manual annotation would be considered a semi-automated approach. Although automated approaches are scalable and faster than annotation with human involvement, they are generally expected to be less accurate due to the lack of guidance.
NOVA is an annotation tool for various types of time series and media data, focusing on cooperative machine learning and explainable AI (XAI) (Heimerl et al., 2019). NOVA uses machine learning to annotate data and presents the suggested annotation to human users for correction. In this case, the user is assisted in the annotation process by having pre-annotated data provided instead of starting with a blank slate. Baur et al. (2020) used NOVA for an audio annotation experiment, which aimed to detect interruptions in conversations. They used extracted audio features and a linear support vector machine (SVM) model for automatic annotation and presented low confidence annotations for manual correction. In this semi-automatic approach, the automatic annotation of time series data is supposed to speed up the manual annotation process. The evaluation was performed by simulating manual annotation: low confidence annotations were corrected by the ground truth (not a human annotator). Finally, a model trained on the manually annotated data (ground truth) was compared to one trained on the semi-automatically annotated data, which showed that the latter required 37% less manual annotation effort to achieve the same performance.
In a different approach utilizing visual indicators, Fabro et al. (2013) used pattern detection of color and motion in videos to cluster segments of coherent material. The segments are then presented to the viewer with color coding to assist video browsing. We will adopt the approach of using visual indicators for segmentation in our work.
Our review concludes that an exhaustive investigation into the impact of annotation assistance needs to be based on user studies, which include an evaluation of individual performances (e.g. speed and accuracy) as well as human factors, such as mental workload. In order to obtain reliable indicators of benefits, a baseline without the evaluated annotation assistance needs to be tested under otherwise identical conditions. As shown in this section, the majority of the considered research in the domain of semi-automated annotation has not been verified by deploying a user study with actual users. We assume that the associated costs in terms of funding, time, and human resources might have been one of the reason preventing such a real-world evaluation. Furthermore, in the user studies which were conducted, none of the work we cited covered all the relevant aspects stated above. Learning from this, our work put particular emphasis on characterizing the human factors of an annotation assistance system, by measuring baseline performance (without annotation assistance) under identical conditions to the performance with annotation assistance.
3 Smart annotation assistance tool
This section covers the implementation of Smart Annotation Assistance Tool (SAAT), a web-based annotation tool for time-series data synchronized with video footage.
SAATwas developed particularly to enable experiments with annotation assistance. It includes a mechanism to shift the annotator's attention toward points of interest in the dataset. This form of assistance is expected to be particularly useful for the annotation of long duration activities since it aims to speed up the navigation of material without missing start and end points of activities.
The back-end of SAATis developed in Python 3, in order to utilize the various available machine learning libraries to obtain annotation suggestions. The front-end consists of HTML and Bootstrap for the design and JavaScript for functionality. Flask is used to connect the front-end to the back-end, due to its flexibility and native Python support.
3.1 User interface
The front-end of SAAT(Figure 1a) includes a video stream, which shows the current frame and a preview of the previous frame and the following frame. This is a particular design choice suited for video streams with low captured frame-rates, resulting in significant visual changes between consecutive frames, such as time-lapse videos. Below the video stream is the control panel with a slider and input field for the playback-speed (displayed in frames per second), navigation buttons to jump backwards or forwards in the material and toggle playback, and buttons to zoom in or out of the sensor stream.
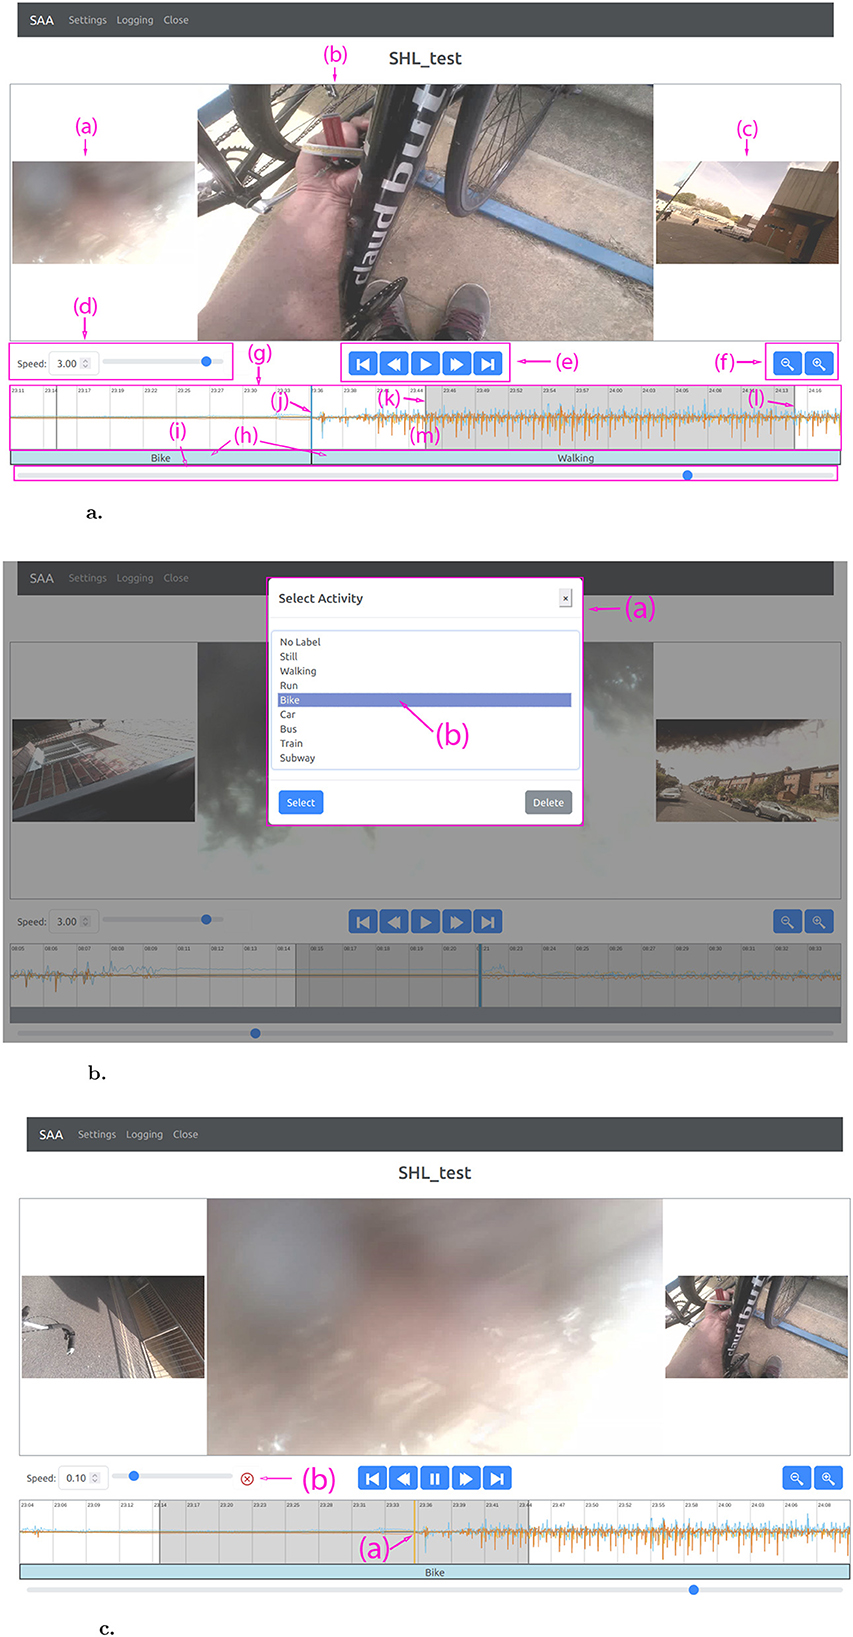
Figure 1. The user interface and its functionality. (a) The user interface of the proposed annotation tool: previous video frame (a); current video frame (b); next video frame (c); playback speed controls (d); navigation buttons (e); zoom buttons (f); sensor stream (g); user-annotations (h); navigation bar (i); start/end sample of user-annotation (j); start sample of current video frame (k); end sample of current video frame (matching timestamps between sample and current video frame) (l); center of sensor stream (m). (b) When a sample in the sensor stream is selected, a window opens in which the user can choose an annotation (a). If annotation assistance is active, the suggested annotation will be pre-selected (b). (c) When the playback is approaching a suggested start/end point of an activity, the annotation assistance will slow down the playback-speed and indicate the point of interest with an orange line in the sensor stream (a). A click-able red cross will appear which can be used to discard the annotation suggestion (b), i.e. remove the orange line and continue playback at the original speed.
The sensor stream, which displays the sensor signals, is positioned underneath. Underlying the sensor signal is a labeled time-axis displayed to improve visual guidance: the horizontal line represents the mean value of the sensor signal, vertical lines are placed every nth sample based on the zoom setting, and thick vertical lines indicate the start/end sensor samples which are spanned by the video frames. The samples which lead up to the current frame are marked with a gray background, which means the sample at the end of the gray marked box [i.e. the right side indicated by (l) in Figure 1a] was recorded the same time the video frame was captured. Once this last sample reaches the middle of the sensor stream [indicated by (m) in Figure 1a], the next video frame will be displayed and the gray sample marking updated.
Blue markers in the sensor stream indicate start/end points of user-annotated activities. Clicking on such a marker or clicking into the sensor stream to set a new marker will open the annotation menu, where a label can be selected (Figure 1b). Each annotation marker is both the start point of the next activity and the end point for the previous one. This allows to set the start point of an activity, navigate a potentially long stretch of material, and then set the end point independently. This is yet another measure favoring long periodic activities. The None (null) label can be selected for unclear activities, transition phases between two activities, or when no activity of interest takes place. The annotation markers can be moved via drag-and-drop. The currently displayed annotation labels are indicated in boxes below the sensor stream. Clicking on such a box will also open the annotation menu for the corresponding time segment.
The front-end implementation follows the well-established model-view-controller (MVC) framework (Leff and Rayfield, 2001). The central model element is implemented as JavaScript class and holds all relevant information for the project and session. This includes settings for playback speed, zoom level, and current location in the material. Most of these settings are initially loaded from the back-end and continuously synchronized back. This creates redundancy by storing settings in the front-end for quick access and in the back-end to save session details for future use. The model also buffers sensor segments and video frames. These buffers are pre-loaded with material to be displayed in order to allow smooth playback.
The view is realized using HTML elements displaying sensor signals and corresponding video frames. It includes a periodic page refresh during active playback in order to update sensor and video to the current location in the material. The default refresh rate is 24Hz to create the impression of a moving image.
The controller includes HTML elements such as buttons to control the playback, the sliding bar to navigate the material, and the annotation menu popup allowing the user to perform annotations. Some updates during playback are indirectly triggered by the user through the use of the playback function.
3.2 Annotation assistance mechanism
Annotation assistance is implemented by incorporating segmentation suggestions and label suggestions. Whenever the annotator opens the annotation menu, the most likely activity annotation will be highlighted and pre-selected. Annotators can either confirm the suggestion by pressing confirm (or the enter key on the keyboard) or select a different annotation. The idea behind this is to speed up the annotation process by saving time and effort on selecting the correct labels.
SAATvisualizes the activity start/end points suggested by the assistance system in orange [indicated by (a) in Figure 1c]. When the user confirms or corrects the suggestion, it turns blue. Whenever playback approaches one of the orange suggestion markers, the playback-speed slows down to allow the user the verification of the suggestion. Pressing the appearing discard button [indicated by (b) in Figure 1c] or the delete/escape key on the keyboard will discard the prediction, remove the orange marker, and reset the playback-speed to its previous setting. The discard button is symbolized by a red cross, which also serves as an additional visual indicator for the user to notice the current suggestion. If the annotator ignores the suggestion, the playback will speed up to the original setting after passing the suggested point.
Missing a start or end point while navigating the material at high speeds might cause a significant disruption to the user since they will have to manually scroll back and find the missed point of interest. Navigating the material at lower speeds prevents that issue but slows the annotation process down. In our system we took the best of both these approaches, by having playback at high speed which is automatically slowed down around suggested points of interest. This allows the annotator to maintain high playback speeds during long consistent activities or long times without activity (null class) while reducing the risk to miss a start or end point.
3.3 Sources of annotation suggestions
Suggested annotations can stem from various sources: machine learning can be used to predict the suggested class label or start and end point of segments of interest, the annotations of other users can be used in a crowdsourcing scenario, or engineered suggestions can be used in a controlled environment for experiments (e.g. the ground truth with introduced variations).
3.3.1 Synthetic suggestions
Automatically generated annotation suggestions are likely to contain some mistakes due to the use of the underlying ML model which is itself imperfect. In order to evaluate the impact of annotation assistance on the experience and performance of annotators, it can be beneficial to conduct experiments in controlled conditions with known variations rather than using less predictable machine learning based suggestions. This tool supports this by loading offline-generated annotation suggestions. In this work, we use this feature to create synthetic suggestions resulting from systematically modifying the ground truth of annotated datasets. Those modifications include adding change points (start or end points), removing actual change points, adding noise to offset the position of change points, and changing the suggested annotation label. The modifications applied to the change points follow trends observed in the data. Changing annotation label suggestions also aims to keep suggestions realistic, by using common misclassifications, e.g. between classes walk and run, or train and subway.
3.3.2 Machine learning based suggestions
Attention-based models have become increasingly important in activity recognition tasks due to their ability to capture spatial and temporal relationships globally unlike convolutional layers bound to a local scope. Replacing convolution layers with attention layers has shown to achieve state-of-the-art performance (Abedin et al., 2021; Zhou et al., 2022). Based on benchmark tests, which included traditional models such as DeepConvLSTM (Ordóñez and Roggen, 2016), we selected Multi-Feature Combining Attention Neural Network (MFCANN) (Yang et al., 2024) to predict annotations on the accelerometer data which can be used as suggestions.
MFCANNcombines different feature extraction and local and global feature attention mechanisms. It consists of multiple Multi-Feature Combining Attention Blocks (MFCAB) which are embedded with residual connections. The information extracted is aggregated by applying average pooling and a fully connected layer followed by a softmax layer is used to predict a class. Each MFCAB applies multiple convolutions in parallel, those include different kernel sizes, max pooling, and average pooling. After applying batch normalization and ReLU activation to the extracted features, the data is fed into both an intra-module attention block (Intra-MAB) and an inter-module attention block (Inter-MAB). Intra-MAB uses attention to weight the importance of individual channels whereas Inter-MAB allows the adjustment of convolution components to utilize global feature information.
In order to obtain annotation suggestions, MFCANNwas used to predict class labels for 5s long windows of the accelerometer data. Based on the predicted likelihood, the most probable class label is selected for each window. Consecutive windows with different class labels were considered start points of the next activity segment.
When machine learning is used to obtain suggestions for longer lasting activities, some form of smoothing should be applied. Otherwise, a suggestion may be made each time a different annotation is predicted for a consecutive timestamp, causing unnecessary disruption. We used a rolling smoothing average filter of 75s length and an offset of 5s was applied to consecutive windows to obtain the final suggestions. The offset refers to the annotation suggested 5s earlier to counteract the delay introduced by averaging. This is configurable and was selected based on the type of activity dataset we used for the evaluation of our system in this paper. Although the expected offset would be 37.5s, benchmark tests achieved better results with 5s.
4 User study
In order to estimate the impact of the proposed annotation assistance on the performance and experience of users, we utilized SAATin a user study with 32 participants in total. Participants were asked to manually annotate activities from acceleration data in a dataset with long activities in two scenarios.
The study was conducted in two phases. In Phase 1, synthetic annotation suggestions were used for annotation assistance. These synthetic annotations were used in the initial phase to perform the experiment in a controlled manner, by including known variations in the segmentation and label suggestions for this dataset. In Phase 2, the suggested annotations were predicted by MFCANNto evaluate the impact of suggestions by an actual machine learning model. This corresponds to the real-world usage of the system. The procedure for both phases was otherwise identical. Participants of Phase 1were not allowed to participate in Phase 2.
We used a counterbalanced study design to assess the impact of the annotation assistance by comparing their performance and experience using SAATwith annotation assistance and without assistance (baseline). The participants were divided into two groups. Group 1 received no assistance for the first scenario (Scenario A) and were assisted during the second scenario (Scenario B), whereas Group 2 received annotation assistance in Scenario A but not in Scenario B. Otherwise Scenario A and Scenario B were identical for both groups. Each scenario in both phases of the study uses a different sensor recording as annotation benchmark (four in total).
The Ethical Review Application ER/LG375/1 for the user study was approved on August 1st 2023 by the University of Sussex Science and Technology and Arts Cross Schools Research Ethics Committee.
4.1 Data
For this paper, we selected the Sussex-Huawei Locomotion and Transportation (SHL) dataset (Gjoreski et al., 2018) as benchmark due to its long activities. The publicly available subset “Complete User 1–Hips Phone" and in particular the three-dimensional acceleration signal captured by a phone placed in the hip pocket was selected for the annotation task. The sensor signals are normalized to fit the screen better (e.g. one acceleration channel would otherwise be significantly offset due to gravitational forces). The ‘User 1” in this dataset, who performed the recorded activities, is referred to as subject from now on. In addition to the sensor signal, the dataset provides body-cam footage which was recorded on chest level by the subject and took a snapshot every 30s. Four individual days of continuous recording were selected as test scenarios, two for each phase of the study. These recordings ranged from 12:37h to 12:54h as shown in Table 1.
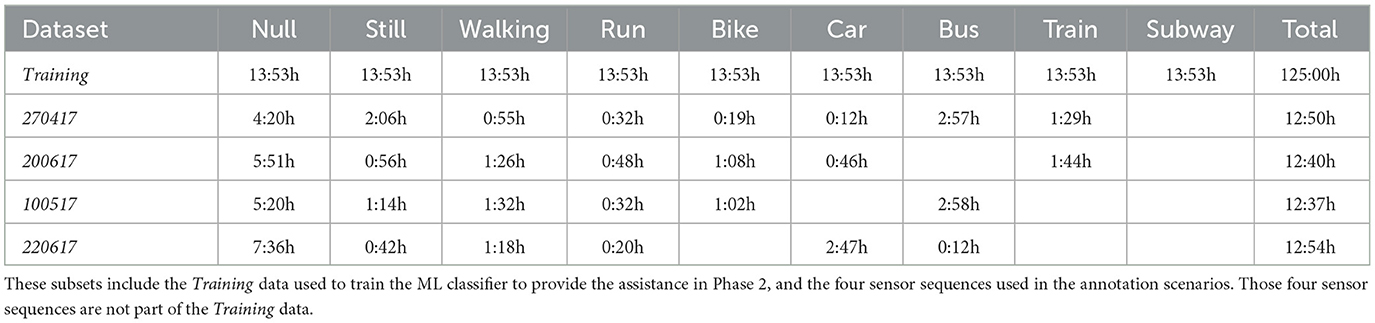
Table 1. Length of the sensor recordings per annotation label in each data subset.
Although the SHL Dataset provides labels for each recorded sample, those were considered too rough for the purposes of this study. Many smaller transition activities were not labeled to the grade of precision expected. Therefore, the annotation of the four selected scenarios was corrected by a PhD candidate under supervision of domain experts using our own SAAT(without the assistance function) and these revised annotations were used as the ground truth. Those ground truth annotations can be found in the github repository.3
The data includes a limited amount of missing sensor signals and body-cam footage due to technical issues, human errors, and privacy-preservation measures. Such issues can be expected to some degree in an annotation scenario. The impairments were deemed to be limited in scale and would not prevent a meaningful annotation of the material.
Table 1 provides an overview of the amount of sensor recordings available for different data subsets. The sensor sequences 270417, 200617, 100517, and 220617are used as material to be annotated in the two phases of the user study. Those sequences are recordings collected on individual days. We used other sensor sequences comprising the same 8 modes of locomotion and transportation for the training of the ML model MFCANN. This subset Trainingwas downsampled to 13:53h of data per activity class.
4.1.1 Phase 1
In the synthetic annotation suggestion phase, the sensor sequence 270417was utilized in Scenario A and 200617in Scenario B. 270417contains 53 changes of activity (26 changes excluding the null class), whereas 200617contains 43 changes of activity (21 changes excluding the null class).
4.1.2 Phase 2
In the ML-based annotation suggestion phase, the sensor sequence 100517was used for Scenario A and 220617for Scenario B. 100517contains 51 changes of activity (25 changes excluding the null class) and 220617contains 41 changes of activity (20 changes excluding the null class). Both sensor sequences are characterized by periods without activity, which provides an interesting aspect to investigate since the annotation assistance might be able to save a lot of time indicating them.
4.2 Procedure
Participants were led into an office with a computer. They were given the participant information sheet to read and a consent form to sign. Before engaging with the annotation tasks, basic demographic information were requested (Supplementary Figure S4) and participants were asked to report their computer literacy, experience with annotating sensor signals, and likelihood to experience health issues during long tasks in front of a screen (Supplementary Figure S5).
Initially, participants were presented a video with instructions4 how to use SAATand annotate sensor signals. Following the video, the participants were able to ask questions about the procedure of the study and were informed that the instructor would leave the room. The instructor would not answer any questions about how to perform the annotation task, but rather advise participants to perform the task “to the best of their knowledge and ability” based on the provided information.
After the instructor left the room, the participants had 10 min to familiarize themselves with the annotation tool and the integrated assistance. Afterwards they were asked to annotate Scenario A. Group 1 annotated this scenario without assistance, whereas Group 2 was provided both segmentation and label assistance. Participants had 20 min of time given to annotate the material. Afterwards they were asked to fill out a NASA Task Load Index (NASA-TLX) questionnaire(Hart and Staveland, 1988) (Supplementary Figure S6) in regards to the performed annotation task.
This process was repeated with Scenario B, but with the groups receiving assistance switched: Group 1 was provided with annotation assistance whereas Group 2 used SAATwithout assistance. Participants again had 20 min to annotate the scenario and were then asked to fill out a NASA-TLX questionnaire.
Once participants finished both scenarios and answered the corresponding NASA-TLX questionnaires, they were asked to rate the general experience with SAATand the impact of annotation assistance on multiple scales (Supplementary Figure S7). There were also additional text fields to leave optional feedback (Supplementary Figure S8).
The procedure was the same for Phase 1and Phase 2, apart from different sensor sequences to annotate (see Section 4.1.1 and Section 4.1.2) and different sources for the provided annotation suggestions (see Subsections 3.3.1 and 3.3.2).
4.3 Participants
Potential participants were screened to ensure that they are at least 18 years old and not at an alleviated risk of suffering from pain in the wrists, eyes, or the head when performing longer tasks in front of a computer screen.
Users were split in two groups in a counterbalanced design to account for potential order effects: one group first received no assistance then received assistance, while the other group first received assistance, then no assistance. The group assignment was considering the experience with annotating sensor signals to keep the groups balanced, this was particularly relevant in Phase 1which included some highly experienced individuals. In Phase 1, 15 suitable participants took part in the study. They were randomly divided into Group 1 containing seven participants and Group 2 containing eight participants. In Phase 2, 17 suitable participants took part in the study. They were also randomly divided into two groups. After omitting one participant who did not perform any annotation during the study, Group 1 and Group 2 were made of eight participants each.
Participants of Phase 1were not allowed to participate in Phase 2, since we expected their prior experience with the tool and the annotation tasks would skew the results.
The age of the five female and 10 male participants in Phase 1ranged from 23 to 50, while the age of the four female and 12 male participants in Phase 2ranged from 18 to 39. The composition of all groups can be seen in Table 2. An individual breakdown of participants can be found in Supplementary Tables S1, S2.
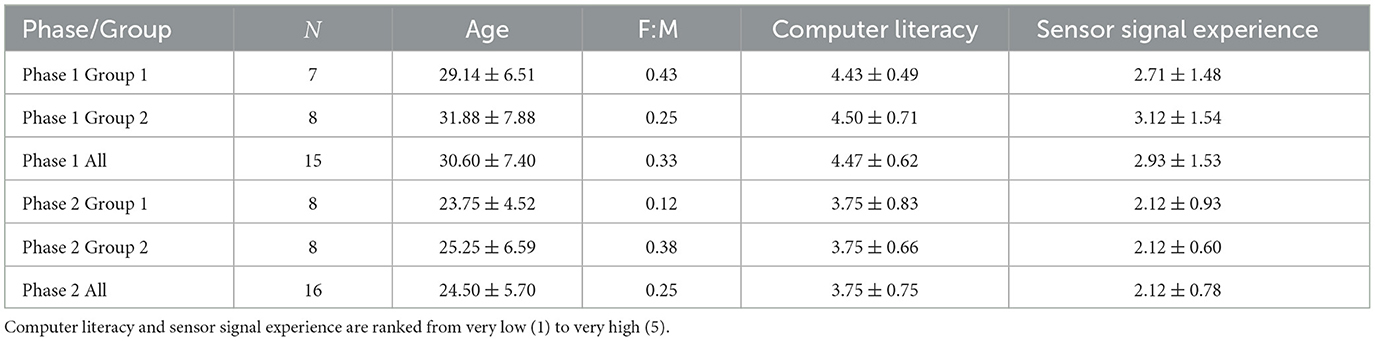
Table 2. The composition of both participant groups based on the number of participants N, average age of participants, ratio between female and male participants, and average self-reported computer literacy and experience with sensor signals.
Participants of Phase 1were on average older and more experienced with computers and sensor signals. However the inter-group differences in both phases were significantly smaller.
Phase 1included participants with very high (5) experience with sensor signals. A very high experience with identifying sensor signals will be rare to find outside of related professions. These test subjects stem from the author's research environment but are not linked to the project. Although small in numbers (within the total population), they represent a significant user group of annotation software for sensor signals.
4.4 Evaluation metrics
The impact of the annotation tool and the integrated assistance on the user experience of the study participants was evaluated in the form of quantitative performance measures and qualitative assessments via questionnaires.
The NASA-TLX questionnaire (Hart and Staveland, 1988) was used to assess the perceived workload after each scenario. It divides the workload in the categories mental, physical, temporal, performance, effort, and frustration. Participants are asked to rank their perceived workload for each category on a scale with 21 steps.
Evaluating participants' mental workload provides insight beyond what speed and quality metrics alone can capture. While performance measures capture how efficiently and accurately tasks are completed, they do not reflect the cognitive effort required. High workload can lead to fatigue, reduced engagement, and lower performance over time (Hernandez et al., 2023), even if initial results appear satisfactory. Therefore, incorporating cognitive workload measures establishes a more comprehensive understanding of user experience and system effectiveness.
The quantitative evaluation of the performance of participants in both scenarios is based on their speed and error rate. It estimates how fast they were performing the annotation task and how well their annotations fit the reference expert annotations.
Some participants completed annotating one or both scenarios in less than the available 20 min while others did not complete the annotation of the material within this time. We used the logfiles to estimate the amount of material sighted by each participant. Participants had the option to finish a scenario prematurely if they considered the task to be completed, in those cases Ta was set to the time it took them from the start until they pressed the ‘Finish' button in the scenario. We were concerned that participants might finish the material earlier but then wait for the timer to run out. However, that turned out to be unfounded. Comparing the time it took participants to reach the furthest point in material, the time until they performed the last annotation task, and Ta showed that all participants performed their last action soon before the time ran out or before they finished the scenario prematurely.
The speed factor S of each participant refers to the length of material sighted per unit of time spent annotating. For each participant we calculated S for both scenarios based on the time spent annotating Ta and the length of the material sighted Ts as shown in Equation 1. SA and SB refer to the speed factors measured in Scenario A and Scenario B respectively.
In order to measure the quality of an annotation performed by a participant on a provided scenario, two kinds of metrics were chosen:
First, the weighted F1 Score F1W was calculated (Equation 2). This provides a rough estimate of the performance. For this paper F1W is shortened to FA when referring to the results of Scenario A and FB for the results of Scenario B.
Due to domain-specific challenges, we also used the Continuous Activity Recognition Performance Metrics (CARPM) (Ward et al., 2011). Based on these, the annotated samples were divided into the following groups: true positives TP (correctly identified activities), true negatives TN (correctly identified null class), overfilled CO, underfilled CU, merged CM, fragmented CF, inserted CI, deleted CD, and substituted CS.
If a participant did not finish annotating all of the material, only the part of the material they annotated was considered for the computation of the F1 and CARPM metrics.
5 Results
First, we estimate the quality of the annotation suggestions provided to participants of the user study. Next, we look into the performance of the participants. For both phases of the user study, the quantitative results are separated into annotation speed and quality, while qualitative results are separated into NASA-TLX and general questionnaire answers. Additionally, we combine annotations of participants within the same groups to simulate and evaluate the potential performance if this approach were further used in a crowdsourcing scenario.
A breakdown of participant's individual performance results and reported workload can be found in Supplementary Tables S3, S4. One participant in Phase 2failed to perform any annotation and was therefore excluded from the evaluation of the study.
5.1 Quality of annotation suggestions
MFCANNwas trained on 5s long windows of the data subset Training(Table 1), which includes 13.9h of data sampled at 100Hz for each of the eight locomotion classes and the null class. As optimiser served AdamW with a learning rate of 0.0001.
This section reviews the baseline quality of the annotation suggestions before the users adjust or confirm the suggestions. If the annotation suggestions were 100% accurate, users could simply apply all of them and deliver perfect annotation. This is unlikely to be the case and even if it occurs would require some amount of manual checking by the users.
Accounting for every individual data point, the synthetic annotation suggestions in Phase 1are designed to have 42% FA and 32% FB. That is a significantly lower quality than the annotation suggestions predicted by MFCANNfor Phase 2, which achieved 62% FA and 70% FB. However, it is expected that the precise placement of the suggested change points would have an higher impact on the performance and experience of annotation assistance than the correct label suggestion.
The CARPM metrics in Figure 2 offer a more detailed breakdown: The synthetic suggestions consist mostly of true positives as well as insertion and substitution errors. The suggestions predicted by MFCANNshow a more varied error range and significantly more true negatives. The CARPM metrics also show that the synthetic suggestions offer a slightly higher true positive rate per scenario compared to the ML based suggestions in Phase 2, despite significantly lower weighted F1 scores.
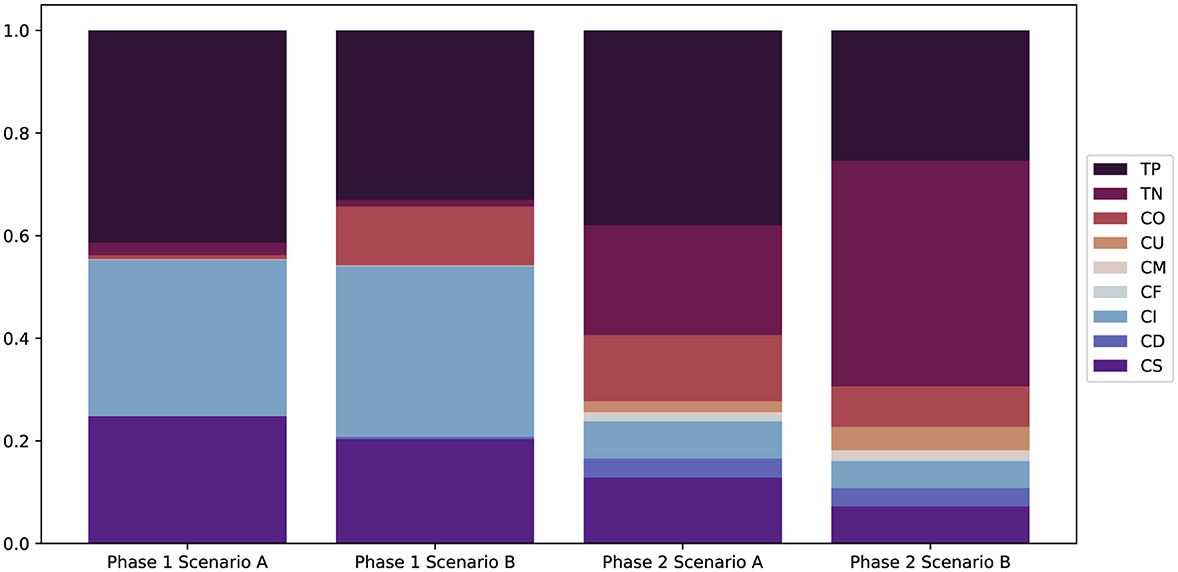
Figure 2. CARPM metrics applied to the annotation suggestions of each scenario in both phases: True Positive TP, True Negative TN, Overfill CO, Underfill CU, Merge CM, Fragmentation CF, Insertion CI, Deletion CD, and Substitution CS.
5.2 Annotation speed
In Phase 1—within the 20 min time limit—Scenario A was completed by two participants without assistance and one with assistance while Scenario B was completed by four participants without assistance and five with assistance. The results in Table 3 show that—on average—both groups were faster in Scenario B compared to the first scenario, regardless of the presence or absence of annotation assistance. In both scenarios Group 1 completed the material in less time than Group 2, also regardless of the presence or absence of annotation assistance.
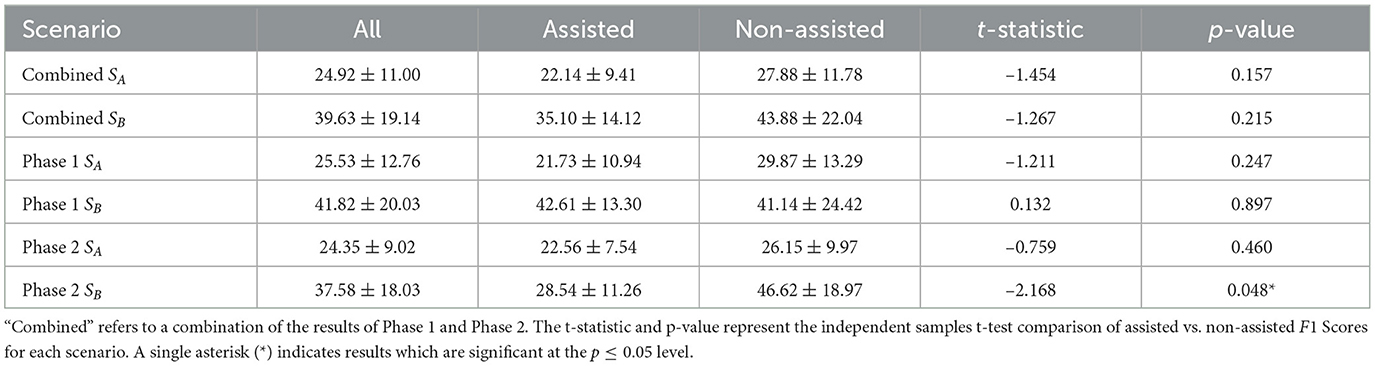
Table 3. The speed factor S indicates the length of material sighted and annotated by a participant in a unit of time: “Assisted" refers to the results of Group 2 for Scenario A and Group 1 for Scenario B, whereas “Non-Assisted" indicates Group 1 for Scenario A and Group 2 for Scenario B.
In Phase 2, Scenario A was completed by two participants without assistance and none with assistance while Scenario B was completed by six participants without assistance and three with assistance. The results in Table 3 show that—on average—both groups were faster in the second Scenario B compared to the first scenario and in both scenarios the group without annotation assistance finished the task faster. Phase 2showed a statistically significant (p < 0.05) negative correlation between annotation assistance and annotation speed.
No clear correlation between speed and reported experience with sensor signals could be observed neither in Phase 1nor Phase 2.
5.3 Annotation quality
As shown in Table 4, in both scenarios of Phase 1the group provided with annotation assistance achieved a 4%-12% higher F1 Score compared to the group without annotation assistance. The results for Phase 2show that both groups achieved similar F1 Scores in Scenario A whether they were assisted or not. However, Group 1 achieved a 17% higher F1 Score in Scenario B (i.e., with assistance) compared to Group 2 (i.e., without assistance).
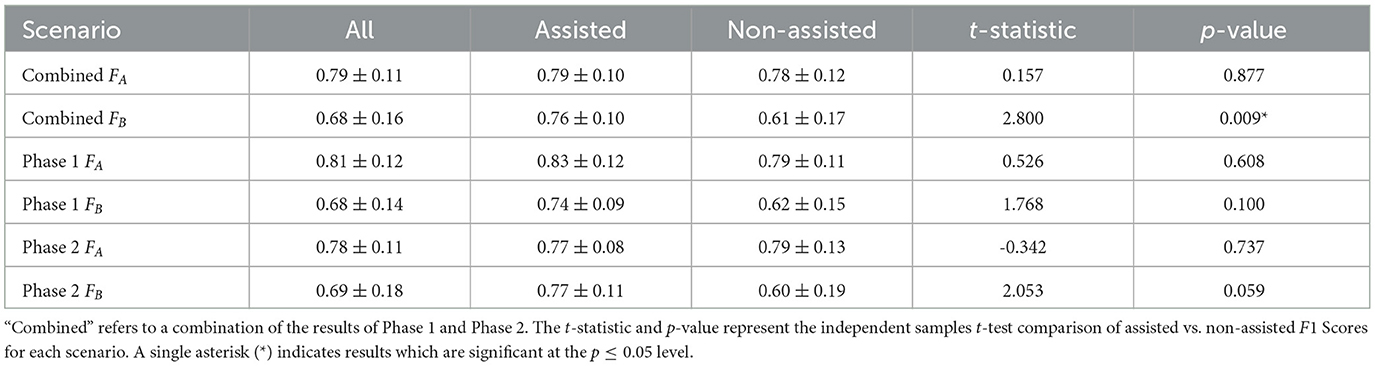
Table 4. The mean F1 scores achieved by participants on both annotation scenarios: “Assisted" refers to the results of Group 2 for Scenario A and Group 1 for Scenario B, whereas “Non-Assisted" indicates Group 1 for Scenario A and Group 2 for Scenario B.
Applying the more sophisticated CARPM evaluation to the results of Phase 1as portrayed in Figure 3a show that Merge and Fragmentation are basically not present in either scenario. In Scenario A, the group provided with annotation assistance achieved a higher rate of correctly annotated true positives TP, but less correctly identified true negatives TN. The situation is reversed for Scenario B, where the group provided with annotation assistance identified more true negatives, but less true positives. In both scenarios, the group with annotation assistance performed less insertion errors CI but more substitution errors CS.
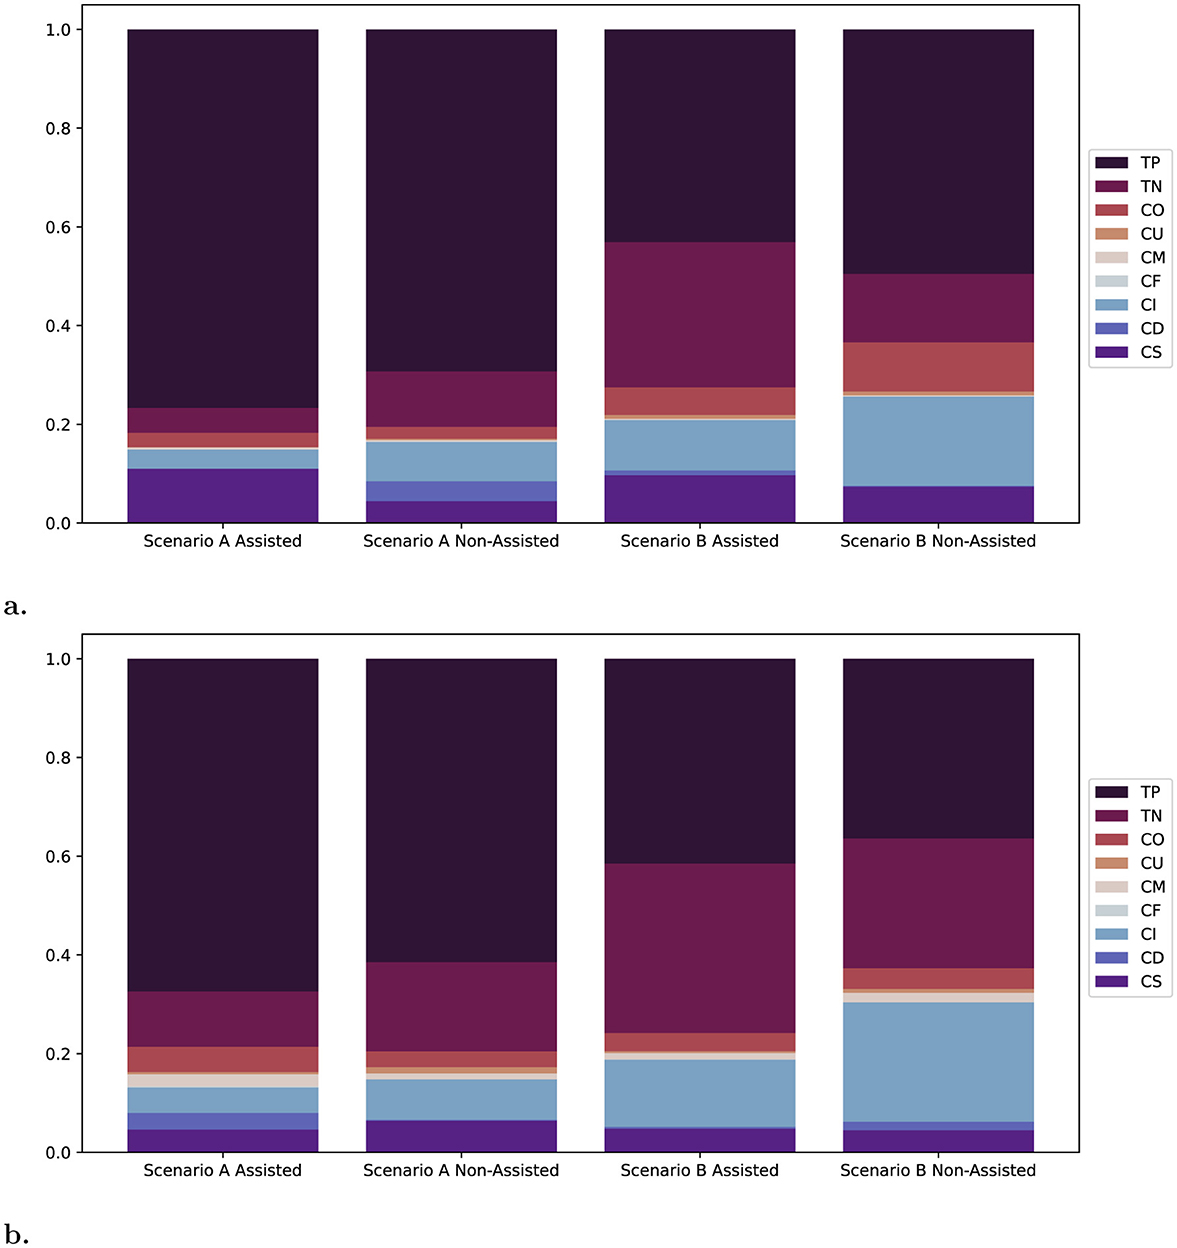
Figure 3. CARPM metrics (Ward et al., 2011) applied to the annotations of each scenario in Phase 1: True Positive TP, True Negative TN, Overfill CO, Underfill CU, Merge CM, Fragmentation CF, Insertion CI, Deletion CD, and Substitution CS. (a) Phase 1. (b) Phase 2.
The CARPM evaluation for Phase 2in Figure 3b reveals that in Scenario A the group with assistance correctly identified more true positives but less true negatives than the group without assistance. Furthermore, the group with assistance performed less insertion and substitution errors but more deletion errors. In Scenario B, the group with assistance identified more true positives and true negatives and committed less insertion and deletion errors than the group without assistance, the number of substitution errors is roughly the same between both groups.
5.4 Relationship between speed and quality
Combining the results of both phases, Figure 4 shows the achieved F1 Scores in relation to the speed of the participants. A negative correlation between quality and speed is expected since performing and correcting annotations takes time. This makes it interesting that there is a slightly positive correlation measured for assisted participants in Scenario B.
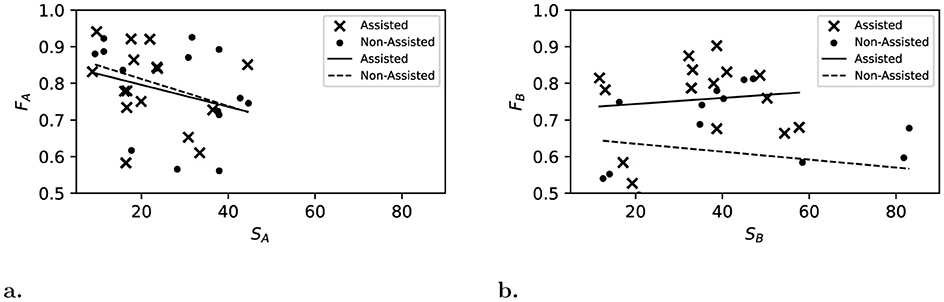
Figure 4. Annotation speed factor S plotted against annotation quality F, combining Phase 1and Phase 2. Linear regression was used to analyse the relationship between speed and quality: solid lines represent annotation assistance and dashed lines represent non-assisted annotation. (a) Scenario A. (b) Scenario B.
5.5 Mixed-effects model
To address potential confounding between learning effects, scenario difficulty differences, and treatment effects, we employed linear mixed-effects models. For each outcome variable (speed factor and F1 Score), we fitted the mixed-effects model shown in Equation 3. Where Yij represents the outcome for participant i in scenario j, β0 is the baseline performance, β1 captures the assistance effect of interest, β2 controls for scenario difficulty differences, β3 accounts for period effects (learning/fatigue), represents participant-specific random intercepts, and represents residual error. This approach distinguishes the treatment effect from scenario differences and time-related effects. The random intercept ui accounts for individual differences in baseline performance. Since Phase 1and Phase 2use different sensor recordings for both scenarios, the combined model takes the study phase (β4) into account as shown in Equation 4.
The results in tab Table 5 show that the impact of the annotation assistance on the quality of annotations is an improvement of 11% for both phases. The results for the annotation speed reveal a slow-down of 20%, which varies between 10% in Phase 1and 30% in Phase 2. This indicates a trade-off ratio of 1.8% speed reduction per 1% F1 Score gain.
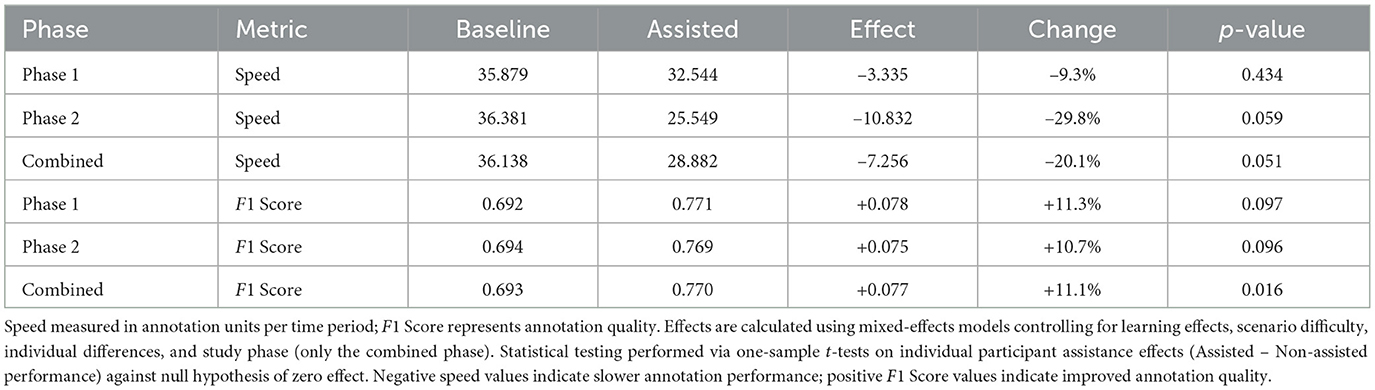
Table 5. Absolute and relative effects of the annotation assistance (β1) on speed and F1 Score across individual study phases and combined analysis.
5.6 Annotation quality in simulated crowdsourcing
Measuring the annotation quality as F1 Score as done in Table 4, showed a reduced standard deviation for the assisted results, especially in Scenarios B. This might indicate more congruence in the annotations (i.e. more similar placement of change points and selection of labels) performed by the assisted group caused by the guiding suggestions. In order to evaluate this aspect, we set up a simulated crowdsourcing usage, in which all annotations within each group were taken and for each sample a majority decision was used to establish the labeled activity. If participants did not finish the material, only their sighted material was taken into consideration. In case of a tie, we picked randomly among the most selected classes.
The results were evaluated as before: For Phase 1, Table 6 shows that the crowdsourcing evens out the differences between the assisted and non-assisted groups in both scenarios. Compared to the individual annotation qualities shown in Table 4, the overall annotation quality in the crowdsourcing approach has been increased across all constellations. The CARPM results in Figure 5a also show more aligned results between the groups.
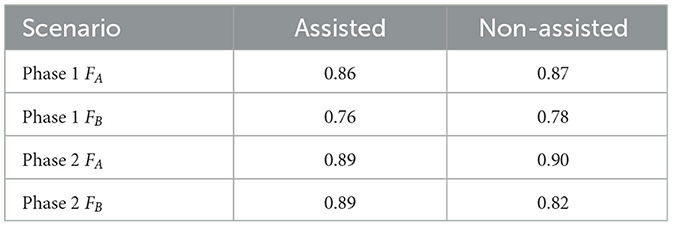
Table 6. The F1 Scores achieved by each group via crowdsourcing on both annotation scenarios: “Assisted" refers to the results of Group 2 for Scenario A and Group 1 for Scenario B, whereas “Non-Assisted" indicates Group 1 for Scenario A and Group 2 for Scenario B.
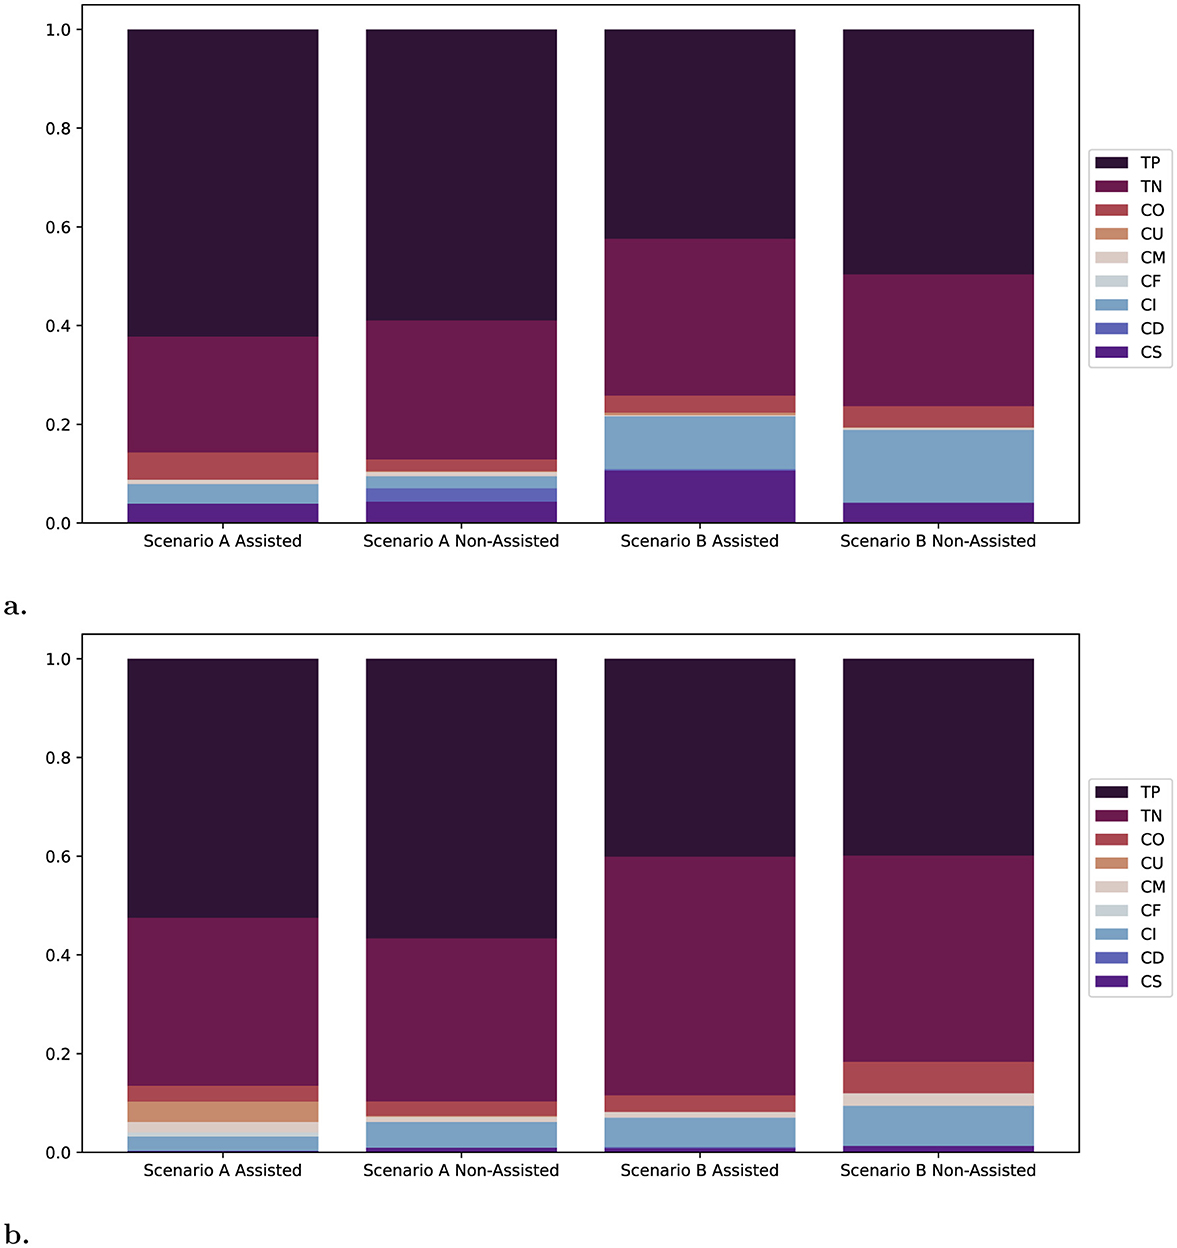
Figure 5. CARPM metrics (Ward et al., 2011) applied to the crowdsourced annotations of each scenario: True Positive TP, True Negative TN, Overfill CO, Underfill CU, Merge CM, Fragmentation CF, Insertion CI, Deletion CD, and Substitution CS. (a) Phase 1. (b) Phase 2.
Regarding Phase 2: Comparing the crowdsourcing results in Table 6 to the individual results in Table 4 shows a consistent improvement in annotation quality across scenarios and groups; no particular trend can be identified. The CARPM results in Figure 5b demonstrate an increase in true negatives TN, especially for scenario A. However, not many participants finished Scenario A which might have caused an under-representation of the null class in Figure 3b since participants annotated less of it. More interestingly, the crowdsourced results show a drastic reduction in substitution errors.
5.7 NASA-TLX results
Evaluating responses of the NASA-TLX questionnaire showed the following results: Group 1 reported a combined workload score of 52.00 ± 13.64 in Scenario A without annotation assistance as shown in Figure 6b and 39.69 ± 24.34 in Scenario B with annotation assistance as shown in Figure 6c. Group 2 reported a combined workload score of 42.19 ± 25.26 in Scenario A with annotation assistance as shown in Figure 6a and 53.33 ± 21.50 in Scenario B without annotation assistance as shown in Figure 6d.
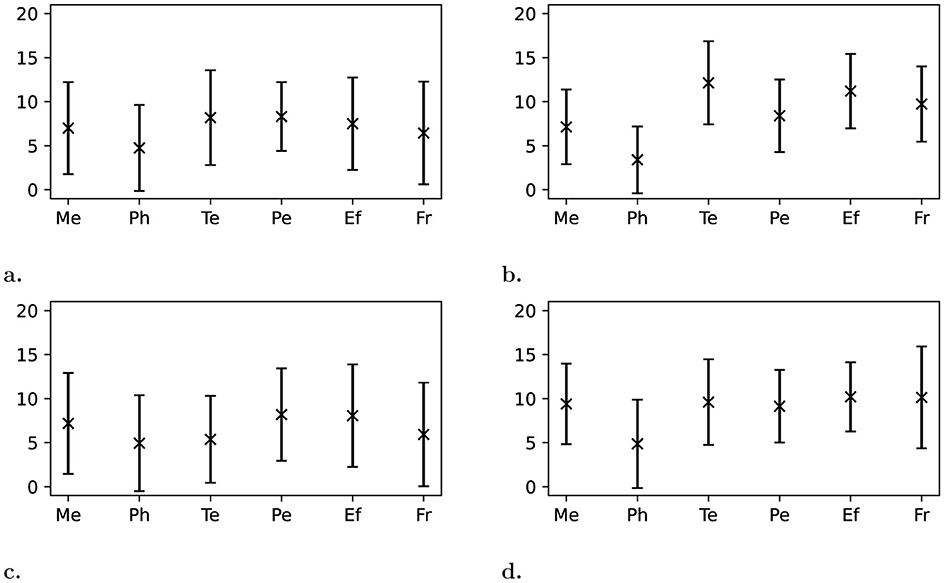
Figure 6. Reported workload of each group on each scenario. Shows the following workload categories: Mental Me, Physical Ph, Temporal Te, Performance Pe, Effort Ef , and Frustration Fr. The scale ranges from 0 (very low) to 20 (very high), except for Pe, which ranges from perfection (0) to failure (20). (a) Scenario A Group 2 (AI). (b) Scenario A Group 1 (No AI). (c) Scenario B Group 1 (AI). (d) Scenario B Group 2 (No AI).
Group 1 reported a 24% decrease in perceived workload from Scenario A without assistance to Scenario B with assistance. On the other hand, Group 2 reported a 26% increase in perceived workload from Scenario A with assistance to Scenario B without assistance.
Three workload categories in particular seemed affected by this: temporal, effort, and frustration with Group 1 reporting a 56%, 28%, and 39% decrease going from Scenario A to Scenario B, whereas Group 2 reported a 17%, 36%, and 57% increase in those categories. The only exception is the physical workload, where Group 2 reported no significant change, but Group 1 claimed a 45% increase when starting to use annotation assistance.
5.8 Questionnaire results
After finishing both scenarios, participants were asked general questions about the annotation tool and the implemented assistance. They were also given the option to provide additional feedback.
The results in Figure 7a show that participants reported that the annotation assistance both improved their general experience and the confidence in their annotation.
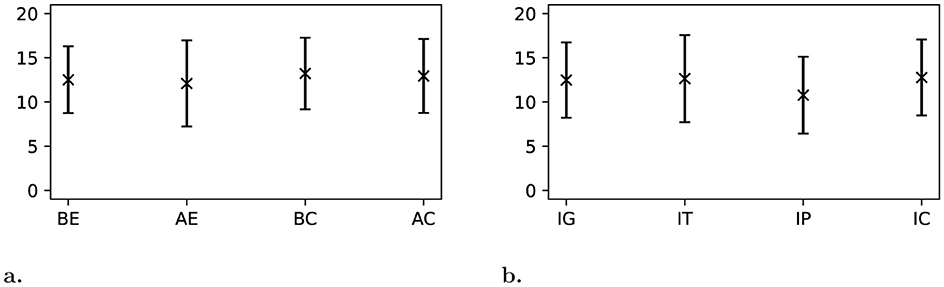
Figure 7. Participants were asked to rank their general experiences with SAATand the annotation assistance on a scale from 0 (very low) to 20 (very high). (a) General experience with the baseline tool BE; general experience with SAATwith annotation assistance AE; confidence in their performed annotations with the baseline tool BC; confidence in their performed annotations with annotation assistance AC. (b) General impact of the annotation assistance IG; impact of the annotation assistance on the time to finish a scenario IT; impact of the annotation assistance on their performance IP; impact of the annotation assistance on their comfort during the task IC.
Figure 7b demonstrates that participants consider the general impact and the impact on the comfort of the annotation assistance to be positive. Controversially they rated the impact on annotation speed positive as well, whereas they rated the impact on annotation performance as neutral.
The open feedback section allowed participants to leave comments or suggestions on different aspects of SAAT. These optional comments can be found in the supplementary material (S2). Participants were asked about general feedback and suggestions for the tool. P1/1 (Phase 1 Participant 1) found SAATto be straightforward and easy to follow. The tool was described as good-looking and helpful for speeding up the annotation process (P1/8). Criticism was aimed at the misalignment between sensor and video data (P1/2, P1/5, and P1/7). One participant suggested that the time allocated for testing the tool might have been too short, indicating a need for longer evaluation periods (P1/11). P2/16 suggested ‘the main window image could be larger to help detect clues' and P2/5 expressed the desire for enhanced functionality, like seeing more frames and faster processing speed.
Participants provided a mix of positive and negative feedback about the implemented annotation assistance. Some found it quite beneficial (P1/1, P1/2, P1/5, P1/8, P1/9, P1/10, and P1/11), particularly in speeding up the annotation process by suggesting activities, which increased comfort and efficiency (P2/3). The tool's capability to identify certain aspects of daily life and recognize movements was appreciated by P2/10. Deleting multiple closely grouped suggestions was considered helpful (P2/11). Additionally, its potential utility for those inexperienced with lengthy sensor recordings was noted, suggesting that SAATcould be valuable for teams handling extensive datasets (P2/13).
Conversely, several participants highlighted areas for improvement. They suggested slowing the playback down further or even pausing it (P1/5 and P1/8). P1/11 claimed to have been slowed down since they were required to double-check and confirm suggestions, which increased the time required. P2/7 suggested the need for better navigation features, such as the ability to jump to points of interest and improved detection of changes. There were concerns about the accuracy of annotations, as more manual corrections were required than anticipated (P2/11). An experienced participant found the frequency of false positives particularly bothersome, suggesting that further training of the model could mitigate these issues and improve the overall utility of the tool (P2/13).
Furthermore, some users expressed frustrations with general and specific aspects of both the tool and the annotation assistance: The tool was called “not very useful" and in “need to be improved a lot" (P2/1), whereas P2/9 commented that the assistance “was not useful because it kept on lowering down the speed."
6 Discussion
We divide our interpretation of findings into quantitative analysis and qualitative analysis. The quantitative analysis includes discussing the recorded results regarding annotation speed and annotation quality. Qualitative analysis is concerned with the results gathered via the NASA-TLX and other questionnaires. After that we will review the limitations of this paper and outline future work.
Table 7 provides a summary of the findings: participants annotated slower using assistance but achieved a higher quality. They saw the assistance as positive but inaccurately assessed the impact of the assistance on the speed and quality of their annotations.
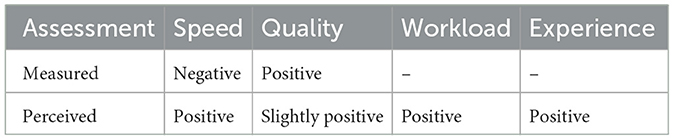
Table 7. An overview about the measured and perceived impact of annotation assistance on different factors.
6.1 Quantitative analysis
One hypothesized benefit of motivation behind implementing annotation assistance is to speed up the annotation process while maintaining the same level of quality is a desired outcome.Table 3 reveals both groups in both phases achieved a higher speed factor in the second scenario. Since both scenarios are of similar length and composition, this is most likely explained by the learning effect, which occurs when participants get more familiar with SAATas they complete the first scenario. Linear mixed-effects modeling revealed that the assistance significantly reduced annotation speed by 20% relative to baseline performance.
Another hypothesized benefit of utilizing annotation assistance would be improving the quality of annotations. Table 4 shows that both groups achieved comparable quality in Scenario A, but in Scenario B the assisted group achieved a F1 Score of 0.76 compared to 0.61 by the non-assisted group. The assistance yielded an 11% improvement in annotation accuracy as measured by F1 Score.
Collectively, these findings suggest that users without assistance tend to skip faster through the material while users with the implemented assistance are interrupted more and forced to engage with the material, leading to a slower but better annotation performance.
The CARPM evaluation for Phase 1, shown in Figure 3a, reveals trends in the participants groups: in both scenarios, Group 1 identified less true positives and more true negatives than Group 2. Both groups performed more substitution errors when provided with annotation assistance compared to the scenario without. This could suggest that users are more likely to agree with a suggestion of the assistive system, even if it is incorrect. Furthermore, both groups performed less insertion errors when provided with annotation assistance. However, neither of these effects was observed in Phase 2(Figure 3b).
The CARPM results for the crowdsourcing approach in Phase 1in Figure 5a show that the substitution error in Scenario B decreased for the non-assisted group but remained on a similar level for the assisted group compared to the individual results in Figure 3a. This could also be caused by wrong suggestions leading to multiple people agreeing on the same wrong label. This aspect should also be considered in crowdsourcing scenarios, which benefit from multiple annotators to compensate for individual mistakes. If an annotation assistance were to be introduced in a crowdsourcing scenario, it should vary its suggestions among annotators in order to prevent it from becoming a dominant decision maker when it comes to agreeing on annotations.
The crowdsourcing approach in Phase 2improved the results of assisted and non-assisted groups comparably. The risk of wrong suggestions leading to more substitution errors when crowdsourcing annotations has not manifested in this instance. However, the results also do not indicate more consistency in the assisted group compared to the non-assisted groups.
6.2 Qualitative analysis
As shown in Section 5.7, Group 1 reported a 56% decrease in temporal workload when switching from annotating without assistance to annotating with assistance. Similarly, Group 2 reported a 17% increase in temporal workload when switching from annotating with assistance to annotating without assistance. Both results indicate that participants perceive themselves to be faster when annotating with assistance.
The perceived positive impact on time to solve the task is further undermined by the general responses at the end of the study. Figure 7b shows that participants ranked the impact of the annotation assistance on time to finish the task as positive. This stands in stark contrast with the quantitative results which showed a negative impact on annotation speed.
The perceived impact on annotation quality is neutral to slightly positive, both in the general responses (Figure 7b) and in the perceived workload: Group 1 reports a 3% improvement when starting to use assistance whereas Group 2 reports a 10% decrease in quality when annotating without assistance. Although the misalignment between measured result and perception when it comes to annotation quality is not as significant as it is for the factor speed, participants still underestimated the positive impact on the quality of their annotations.
The optional comments and suggestions left in the feedback fields further emphasize that participants felt that annotation assistance helped them improve their speed, but no participant directly mentioned an impact on the quality of annotation or their confidence in their annotations.
These results suggest that participants' perception of their performance is highly skewed and unreliable. Based on the experiments performed, it cannot be said with certainty what caused them to perceive themselves as faster but not more accurate while using annotation assistance. Participants may have had preconceived ideas about automation being associated with faster outcomes. Originally, we hypothesized that participants might feel disrupted and slowed down by false positives. Although this aspect was mentioned in the open feedback, it apparently was not perceived as slowing. One the other hand, it seems plausible that participants focused more on inaccurate suggestions they corrected, while being less aware of suggestions which improved their accuracy. Furthermore, many participants had no significant domain knowledge and thus might have struggled to accurately estimate their accuracy and recognize their own shortcomings. The deviation between perceived and measured performance results undermines the importance of gathering both.
6.3 Limitations
Interpreting the results comes with multiple challenges. The results of both phases show significant inherent differences in annotation speed and quality between the two groups. Multiple measures were attempted to account for this: The self-reported experiences with computers and sensor signals showed no relevant relationship to the imbalance between the groups and could therefore not be used to normalize the results. Similarly, the performance results obtained in the initial 10 min scenario showed no or in some constellations even a negative correlation with the results from the later scenarios. Furthermore, no user had used the tool before and it became evident that participants gained more experience throughout the annotation tasks, making them better equipped to handle Scenario B than Scenario A, regardless of the presence or absence of annotation assistance. This left the performance development between scenarios, i.e. how much did each group improve between the scenarios, as only relevant metric.
The annotation scenarios carried out in this study were rather short with 20 min per scenario compared to actual annotation tasks which can last up to multiple hours at a time. This is also reflected in the results, which suggest participants took some time to familiarize themselves with the tool. It seems likely that the benefit of annotation assistance in a longer task would improve while the negative impact of users having to get used to a more complex system would diminish over time.
6.4 Future work
In order to address the mentioned limitations in future studies, we recommend recruiting more participants, allocating more time to participants to familiarize themselves with the tool, and using a baseline scenario to normalize inter-group performance imbalances.
The open feedback included a number of complaints about many interruptions due to the annotation assistance, meaning it could be beneficial to identify other ways to reduce the number of false positives.
6.4.1 Online learning
A paradigm to investigate would be an online learning framework (see e.g. Schiemer et al., 2023; Zhang et al., 2022; Mohamad et al., 2020), in which a classifier is updated while the user is annotating material. However, such an approach would require the user to perform annotations for longer periods before a meaningful change in the predictions is achieved. Furthermore, the differences in predictions would introduce variability and bias in the results and experiences of the user.
Such an online learning system can initially be either untrained or pretrained. Pretraining could be performed on few available labeled samples, i.e. much fewer than used in this paper. Alternatively, transfer learning could be used to utilize labeled data from different users, devices, or tasks (Ray and Kolekar, 2024).
If there is no training data available at all, it could be worth extending the model into an ensemble approach, e.g. with an unsupervised method providing initial suggestions and a semi-supervised or supervised classifier learning based on the input provided by the user.
6.4.2 Experimental setup
One significant constraint was users not having sufficient time to familiarize themselves with SAAT. After increasing the time for participants to explore the tool did not solve this issue, it seems as if participants need to be given an additional initial annotation scenario. However, increasing the number to three scenarios while keeping them 20 min long brings the risk of causing fatigue and skewing the results in this other way. Potentially, three scenarios with 15 min each might be a suitable compromise. As stated in Section 6.3, it seems likely that a baseline scenario is required to obtain more precise results. An initial 10 min test scenario, followed by a 15 min baseline scenario without annotation assistance, and then two 15 min scenarios with and without annotation assistance could be a viable compromise between allowing participants to familiarize themselves with the tool, obtaining a meaningful baseline, and gather enough comparable results.
Another approach would be a long experiment spanning days or even weeks, this would address both fatigue and the learning effect. However, conducting such an experiment with a large enough number of participants would be rather expensive. Deployment in a real-world use case would enable qualitative analysis, but only for limited quantitative analysis. Speed could be estimated, whereas there needs to be an established ground truth to asses accuracy.
6.4.3 Ordering of annotation suggestions
Annotation assistance was implemented by slowing down playback-speed around predicted points of interest and pre-selecting the suggested annotation label. Preliminary trials experimented with ordering the current annotation labels based on their predicted likelihood for the currently selected sample. However, for the low number of classes present in the SHL Dataset, this was generally viewed unfavorably. Changing the order of items to select from is expected to slow down and add more effort to the annotator than selecting from a fixed order they can memorize (Mitchell and Shneiderman, 1989). For an annotation scenario with more different annotations, where they cannot be all displayed at once, this could be a viable option though.
6.4.4 Other forms of assistance
More scenarios could also be used to evaluate different forms of annotation assistance: Participants could use the baseline tool without assistance in the first scenario to establish a baseline and then be divided into two groups, one starting with the annotation assistance as implemented here and the other group using the commonly used pre-annotation system (see e.g. Baur et al., 2020) as assistance first, whereas users are asked to check and modify an already annotated scenario. The annotations in this case would be identical to the suggestions provided by the assistance system used in this paper.
Although this paper only investigated one form of assistance, the source for the annotation suggestions was different for Phase 1and Phase 2. Section 5.1 shows that this led to different characteristics in the suggestions, e.g. much more suggested insertion errors in Phase 1. Between the other effects impacting annotation performance as discussed in Section 6.3, it was not possible to draw meaningful conclusions about the differences in impact of these different suggestions. Such an investigation would require further isolation of these impacts.
6.4.5 Multi-modal annotation assistance
This paper focuses on using sensor signals for annotation assistance. Suggestions could be drawn from additional domains such as computer vision to improve the quality of the assistance: Egocentric action classifiers can utilize video and sound data (Papadakis and Spyrou, 2024) or combine sensor and video data (Hao et al., 2024) to predict activities. This is suitable for datasets containing video recordings with higher frame rate than 1 frame per 30 seconds as in the SHL dataset.
6.4.6 Perceived performance
In this study we used the NASA-TLX as post-task questionnaire and a list of simple questions as post-test questionnaire. The System Usability Scale (Brooke, 1996) might have been better suited as post-test questionnaire, whereas the Single Ease Question (Sauro and Dumas, 2009) could reduce the post-task feedback demand. However, given the length of each task, the NASA-TLX seems appropriate.
The success of a collaboration between a human user and an AI system, such as our annotation suggestion system, depends partly on the user's mental model of the involved AI system (Bansal et al., 2019). As discussed in the qualitative analysis (Section 6.2), participants perception on how annotation assisted affected their performance drastically differed from the measured impacts. Those misconceptions can lead to frustration and decrease the user's motivation. Therefore, we recommend to investigate how providing individual feedback can help participants to gain a more accurate understanding of the impact of annotation assistance on their experience and performance.
7 Conclusion
This paper introduced a new web-based tool for the annotation of time-series data synced with a video stream, proposed a method to incorporate predicted annotations as assistance into the manual annotation performed by a human user, and described how to conduct a user study to investigate impact of the implemented assistance on the experience and performance of the annotators.
The participants of the user study were asked to annotate long periodic locomotion activities captured by inertial body-worn sensors synced with body-cam snapshots done every 30s. They performed two annotation scenarios, one with and one without assistance. The first phase of the study was conducted with 15 participants and included synthetic annotation assistance, while the second phase included annotation assistance based on predictions made by the model MFCANN.
The study revealed that annotation assistance had a negative impact on annotation speed (20% slow-down), whereas participants experienced the assistance as helping them to solve the annotation scenarios faster. Conversely, the measured results suggests a positive impact on annotation quality (11% higher F1 Score), although participants did not perceive it particularly positive.
Participants also reported a lower overall workload, more comfort, and less frustration using the annotation assistance. The open feedback revealed complaints about interruptions through the annotation assistance. It seems likely that false positives both lead to frustration and reduced the annotation speed. This illustrates the need to improve the precision of suggested change points in order to improve annotation speed and reduce frustration.
Due to factors like the learning effect and inter-group differences, we recommend for future studies to recruit more participants, to allocate more time to participants to familiarize themselves with the tool, and to use a baseline scenario to normalize inter-group performance imbalances.
Data availability statement
The original contributions presented in the study are included in the article/Supplementary material, further inquiries can be directed to the corresponding author.
Ethics statement
The studies involving humans were approved by University of Sussex Science and Technology and Arts Cross Schools Research Ethics Committee. The studies were conducted in accordance with the local legislation and institutional requirements. The participants provided their written informed consent to participate in this study.
Author contributions
LG: Writing – original draft, Writing – review & editing. IS: Writing – review & editing. PB: Writing – review & editing. DR: Writing – review & editing.
Funding
The author(s) declare that financial support was received for the research and/or publication of this article. This work was partially funded by the EU H2020-ICT-2019-3 project HumanE AI Net (project number 952026) and Huawei Technologies.
Conflict of interest
The authors declare that the research was conducted in the absence of any commercial or financial relationships that could be construed as a potential conflict of interest.
Generative AI statement
The author(s) declare that no Gen AI was used in the creation of this manuscript.
Any alternative text (alt text) provided alongside figures in this article has been generated by Frontiers with the support of artificial intelligence and reasonable efforts have been made to ensure accuracy, including review by the authors wherever possible. If you identify any issues, please contact us.
Publisher's note
All claims expressed in this article are solely those of the authors and do not necessarily represent those of their affiliated organizations, or those of the publisher, the editors and the reviewers. Any product that may be evaluated in this article, or claim that may be made by its manufacturer, is not guaranteed or endorsed by the publisher.
Supplementary material
The Supplementary Material for this article can be found online at: https://www.frontiersin.org/articles/10.3389/fcomp.2025.1696178/full#supplementary-material
Footnotes
1. ^Preliminary details of the tool were presented in Gunthermann (2023).
2. ^https://github.com/STRCWearlab/SAAT
3. ^https://github.com/STRCWearlab/SAAT/tree/main/ground_truth/
4. ^https://github.com/STRCWearlab/SAAT/releases/tag/intro_video_v1.0.0
References
Abedin, A., Ehsanpour, M., Shi, Q., Rezatofighi, H., and Ranasinghe, D. C. (2021). Attend and discriminate: Beyond the state-of-the-art for human activity recognition using wearable sensors. Proc. ACM Interact. Mob. Wearable Ubiquitous Technol. 5, 1–22. doi: 10.1145/3448083
Altun, K., and Barshan, B. (2010). “Human activity recognition using inertial/magnetic sensor units,” in Human Behavior Understanding, eds. A. A. Salah, T. Gevers, N. Sebe, and A. Vinciarelli (Cham: Springer Berlin Heidelberg), 38–51. doi: 10.1007/978-3-642-14715-9_5
Bansal, G., Nushi, B., Kamar, E., Lasecki, W. S., Weld, D. S., Horvitz, E., et al. (2019). Beyond accuracy: The role of mental models in human-ai team performance. Proc. AAAI Conf. Hum. Comput. Crowdsourc. 7, 2–11. doi: 10.1609/hcomp.v7i1.5285
Baur, T., Heimerl, A., Lingenfelser, F., Wagner, J., Valstar, M. F., Schuller, B., et al. (2020). explainable cooperative machine learning with nova. Künstliche Intell. 34, 143–164. doi: 10.1007/s13218-020-00632-3
Bulling, A., Blanke, U., and Schiele, B. (2014). A tutorial on human activity recognition using body-worn inertial sensors. ACM Comput. Surv. 46, 1–33. doi: 10.1145/2499621
Chadha, S., Raj, I., and Saisanthiya, D. (2023). “Human activity recognition for analysing fitness dataset using a fitness tracker,” in 2023 International Conference on Computer Communication and Informatics (ICCCI) (Coimbatore: IEEE), 1–5. doi: 10.1109/ICCCI56745.2023.10128242
Chen, K., Zhang, D., Yao, L., Guo, B., Yu, Z., Liu, Y., et al. (2021). Deep learning for sensor-based human activity recognition: Overview, challenges, and opportunities. ACM Comput. Surv. 54, 1–40. doi: 10.1145/3447744
Demrozi, F., Turetta, C., Machot, F. A., Pravadelli, G., and Kindt, P. H. (2023). A comprehensive review of automated data annotation techniques in human activity recognition. arXiv [Preprint] arXiv:2307.05988.
Diete, A., Sztyler, T., and Stuckenschmidt, H. (2018). Exploring semi-supervised methods for labeling support in multimodal datasets. Sensors 18:2639. doi: 10.3390/s18082639
Fabro, M. D., Münzer, B., and Böszörmenyi, L. (2013). “Smart video browsing with augmented navigation bars,” in Lecture Notes in Computer Science (Berlin: Springer Berlin Heidelberg), 88–98. doi: 10.1007/978-3-642-39666-3
Gjoreski, H., Ciliberto, M., Wang, L., Ordonez Morales, F. J., Mekki, S., Valentin, S., et al. (2018). The university of sussex-huawei locomotion and transportation dataset for multimodal analytics with mobile devices. IEEE Access 6, 42592–42604. doi: 10.1109/ACCESS.2018.2858933
Gunthermann, L. (2023). “Application for doctoral consortium IUI 2023,” in Companion Proceedings of the 28th International Conference on Intelligent User Interfaces, IUI '23 Companion (New York, NY: Association for Computing Machinery), 233–236. doi: 10.1145/3581754.3584112
Hao, Y., Kanezaki, A., Sato, I., Kawakami, R., and Shinoda, K. (2024). Egocentric human activities recognition with multimodal interaction sensing. IEEE Sens. J. 24, 7085–7096. doi: 10.1109/JSEN.2023.3349191
Hart, S. G., and Staveland, L. E. (1988). “Development of nasa-tlx (task load index): results of empirical and theoretical research,” in Human Mental Workload, Volume 52 of Advances in Psychology, eds. P. A. Hancock, and N. Meshkati (North-Holland), 139–183. doi: 10.1016/S0166-4115(08)62386-9
Heimerl, A., Baur, T., Lingenfelser, F., Wagner, J., and Andre, E. (2019). “NOVA - a tool for eXplainable cooperative machine learning,” in 2019 8th International Conference on Affective Computing and Intelligent Interaction (ACII) (Cambridge, MA: IEEE). doi: 10.1109/ACII.2019.8925519
Heimerl, A., Weitz, K., Baur, T., and Andre, E. (2022). Unraveling ml models of emotion with nova: multi-level explainable ai for non-experts. IEEE Trans. Affect. Comput. 13, 1155–1167. doi: 10.1109/TAFFC.2020.3043603
Hernandez, R., Jin, H., Pyatak, E. A., Roll, S. C., and Schneider, S. (2023). Workers' whole day workload and next day cognitive performance. Curr. Psychol. 43, 2005–2018. doi: 10.1007/s12144-023-04400-y
Hoelzemann, A., and Van Laerhoven, K. (2024). A matter of annotation: an empirical study on in situ and self-recall activity annotations from wearable sensors. Front. Comput. Sci. 6:1379788. doi: 10.3389/fcomp.2024.1379788
Leff, A., and Rayfield, J. T. (2001). “Web-application development using the model/view/controller design pattern,” in Proceedings Fifth IEEE International Enterprise Distributed Object Computing Conference (Seattle, WA: IEEE), 118–127. doi: 10.1109/EDOC.2001.950428
Mairittha, N., Mairittha, T., Lago, P., and Inoue, S. (2021). Crowdact: achieving high-quality crowdsourced datasets in mobile activity recognition. Proc. ACM Interact. Mob. Wearable Ubiquitous Technol. 5, 1–32. doi: 10.1145/3432222
Mitchell, J., and Shneiderman, B. (1989). Dynamic versus static menus: an exploratory comparison. ACM SIGCHI Bull. 20, 33–37. doi: 10.1145/67243.67247
Mohamad, S., Sayed-Mouchaweh, M., and Bouchachia, A. (2020). Online active learning for human activity recognition from sensory data streams. Neurocomputing 390, 341–358. doi: 10.1016/j.neucom.2019.08.092
Ordóñez, F., and Roggen, D. (2016). Deep convolutional and lstm recurrent neural networks for multimodal wearable activity recognition. Sensors 16:115. doi: 10.3390/s16010115
Palotai, Z., Lang, M., Sarkany, A., Toser, Z., Sonntag, D., Toyama, T., et al. (2014). “LabelMovie: semi-supervised machine annotation tool with quality assurance and crowd-sourcing options for videos,” in 2014 12th International Workshop on Content-Based Multimedia Indexing (CBMI) (Klagenfurt: IEEE). doi: 10.1109/CBMI.2014.6849850
Papadakis, A., and Spyrou, E. (2024). A multi-modal egocentric activity recognition approach towards video domain generalization. Sensors 24, 2491. doi: 10.3390/s24082491
Ponnada, A., Cooper, S., Thapa-Chhetry, B., Miller, J. A., John, D., Intille, S., et al. (2019). “Designing videogames to crowdsource accelerometer data annotation for activity recognition research,” in Proceedings of the Annual Symposium on Computer-Human Interaction in Play (New York, NY: ACM). doi: 10.1145/3311350.3347153
Ray, A., and Kolekar, M. H. (2024). Transfer learning and its extensive appositeness in human activity recognition: a survey. Expert Syst. Appl., 240, 122538. doi: 10.1016/j.eswa.2023.122538
Roggen, D., Calatroni, A., Rossi, M., Holleczek, T., Forster, K., Troster, G., et al. (2010). “Collecting complex activity datasets in highly rich networked sensor environments,” in 2010 Seventh International Conference on Networked Sensing Systems (INSS) (Kassel: IEEE), 233–240. doi: 10.1109/INSS.2010.5573462
Sauro, J., and Dumas, J. S. (2009). “Comparison of three one-question, post-task usability questionnaires,” in Proceedings of the SIGCHI Conference on Human Factors in Computing Systems, CHI '09 (New York, NY: ACM), 1599–1608. doi: 10.1145/1518701.1518946
Schiemer, M., Fang, L., Dobson, S., and Ye, J. (2023). Online continual learning for human activity recognition. Pervasive Mob. Comput. 93:101817. doi: 10.1016/j.pmcj.2023.101817
Ward, J. A., Lukowicz, P., and Gellersen, H. W. (2011). Performance metrics for activity recognition. ACM Trans. Intell. Syst. Technol. 2, 1–23. doi: 10.1145/1889681.1889687
Yang, Z., Li, K., and Huang, Z. (2024). MFCANN: a feature diversification framework based on local and global attention for human activity recognition. Eng. Appl. Artif. Intell. 133:108110. doi: 10.1016/j.engappai.2024.108110
Zhang, Y., Gao, B., Yang, D., Woo, W. L., and Wen, H. (2022). Online learning of wearable sensing for human activity recognition. IEEE Internet Things J. 9, 24315–24327. doi: 10.1109/JIOT.2022.3188785
Zhou, Y., Zhao, H., Huang, Y., Riedel, T., Hefenbrock, M., Beigl, M., et al. (2022). “Tinyhar: a lightweight deep learning model designed for human activity recognition,” in Proceedings of the 2022 ACM International Symposium on Wearable Computers, UbiComp/ISWC '22 (New York, NY: ACM), 89–93. doi: 10.1145/3544794.3558467
Keywords: human activity recognition, data annotation, statistical change detection, human-computer interaction, wearable computing, deep learning, attention mechanism, human factors
Citation: Günthermann L, Simpson I, Birch P and Roggen D (2025) Assisting annotators of wearable activity recognition datasets through automated sensor-based suggestions. Front. Comput. Sci. 7:1696178. doi: 10.3389/fcomp.2025.1696178
Received: 31 August 2025; Accepted: 16 October 2025;
Published: 13 November 2025.
Edited by:
Yu Guan, University of Warwick, United KingdomReviewed by:
Yaxiong Lei, University of Essex, United KingdomPreeti Agarwal, SVKM'S NMIMS University, India
Copyright © 2025 Günthermann, Simpson, Birch and Roggen. This is an open-access article distributed under the terms of the Creative Commons Attribution License (CC BY). The use, distribution or reproduction in other forums is permitted, provided the original author(s) and the copyright owner(s) are credited and that the original publication in this journal is cited, in accordance with accepted academic practice. No use, distribution or reproduction is permitted which does not comply with these terms.
*Correspondence: Lukas Günthermann, TC5HdW50aGVybWFubkBzdXNzZXguYWMudWs=