 Nora EL Rashidy
 Eman Allogmani3
 Esraa Hassan
- 1Department of Machine Learning and Information Retrieval, Faculty of Artificial Intelligence, Kafrelsheikh University, Kafrelsheikh, Egypt
- 2Department of Computer Science, University College in Umluj, University of Tabuk, Tabuk, Saudi Arabia
- 3Department of Computer Science, College of Computer and Information Sciences, Majmaah University, Al-Majmaah, Saudi Arabia
- 4Department of Computer Science, College of Computer Engineering and Sciences, Prince Sattam Bin Abdulaziz University, Al-Kharj, Saudi Arabia
- 5Department of Information Technology, College of Computer and Information Sciences, Princess Nourah bint Abdulrahman University, Riyadh, Saudi Arabia
- 6Department of Embedded Network Systems and Technology, Faculty of Artificial Intelligence, Kafrelsheikh University, Kafrelsheikh, Egypt
- 7Department of Electronics and Computer Engineering, School of Engineering and Applied Sciences, Nile University, Giza, Egypt
Emotion estimation from face expression analysis has been extensively examined in computer science. In contrast, classifying expressions depends on appropriate facial features and their dynamics. Despite the promising accuracy results in handled and favorable conditions, processing faces acquired at a distance, entailing low-quality images, still needs an influential performance reduction. The primary objective of this study is to introduce a Real-Time Emotion Recognition system-based Fog Technique, which was developed to track and observe human emotional states in real time. This paper provides a comprehensive integration of PCA-based feature selection with a specific version of YOLO (YOLOv8), in addition to spatial attention for real-time recognition. The developed system demonstrates superiority in edge deployment capabilities compared to existing approaches. The proposed model is compared with the CNN_PCA hybrid model. First, Principal Component Analysis (PCA) is employed as a dimension-reduction tool, focusing on the most informative characteristics during training, and then CNN as classification layer. The proposed system's performance is assessed via a dataset of 35,888 facial photos classified into seven classes: anger, fear, happiness, neutral, sadness, surprise, and disgust. The constructed model surpasses established pre-trained models, such as VGG, ResNet, and MobileNet, with different evaluation metrics. First, the PCA_CNN model achieved superior accuracy, precision, recall, and Area Under the Curve (AUC) scores of 0.936, 0.971, 0.843, 0.871, and 0.943.YOLO v8 aith attention model achieved 0.986, 0.902, 0.941, and 0.952. Additionally, the model exhibits significantly faster processing time, completing computations in just 610 seconds than other pre-trained models. To validate the model's superiority, extensive testing on additional datasets consistently yields promising performance results, further validating the efficiency and effectiveness of our developed model in real-time emotion recognition for advancing affective computing applications.
1 Introduction
Emotion recognition is critical for comprehending human ideas and mental states without direct inquiry. It aids in monitoring and assessing people's mental health and allows for early diagnosis of cognitive problems, which improves overall mental wellbeing. In recent years, identifying emotions from facial expressions has become essential, notably in smart living and Human-Robot Interaction. As a result, researchers in artificial intelligence have been actively involved in developing methods to recognize emotions based on facial expressions. The current study focuses on transforming facial expressions into crosspound emotions. This process involves two key steps: feature extraction and emotion detection and recognition.
Specific data preprocessing techniques such as normalization, resizing, and denoising are also applied. Feature extraction is a technique to select features from data containing significant information while reducing redundancy. This study employs the principal component analysis (PCA) algorithm for feature extraction. The data is transformed based on a transformation matrix that retains features with high variance, effectively reducing the dimensionality of the data. Subsequently, a deep convolutional neural network (CNN) model is utilized for image classification based on the fusion of features obtained from the PCA transformation.
Various versions of Deep neural network (DNN), especially CNN, have gained attention in solving ER problems due to their ability to extract deep features and insights from images. Several studies reported that the CNN model can solve ER problems with promising performance. However, traditional CNN models with a small number of hidden layers may have several challenges with ER that could summarized as follows: (1) ER needs a high-resolution image to capture the essential features for recognition, (2) the differences expressing emotions in different faces make the task more challenging, and (3) utilizing deep CNN model comprise huge CNN, pooling layers which increase the computational time and hinder the generalization ability of the model. On the other hand, increasing the number of layers did not increase the model performance due to the vanishing gradient problems. Therefore, various modifications for CNN were introduced to enhance the overall performance, including VGG16 (Huang et al., 2017), VGG19 ResNet 50 (Chollet, 2017), RestNet 121, ResNet 169 (Informatik et al., 2003), MobileNet V1 (Szegedy et al., 2016), MobileNet V2 (Sudha and Ganeshbabu, 2021), etc., unless the promising performance of those models. Deep Learning (DL) training needs vast amounts of data, high computational power, and resources.
The appropriate ER systems should be able to recognize emotions by designing an efficient CNN model that could concentrate on the significant features to provide accurate prediction in less running time. In our study, we depend on the attention mechanism. Attention mechanisms gained considerable interest in DL and achieved remarkable performance in several tasks. Attention mechanisms empower DL models to rely on a specific feature among the input feature set. It gives varying degrees of relevance to each element. Models can capture intricate patterns and dependencies by allocating attention weights to features. The core concept of attention mechanisms concentrates on the most informative regions and suppresses extraneous distractions, resulting in enhanced efficiency and robustness. Several types of attention used in Machine Learning (ML) and (DL) include soft attention (Athar et al., 2022), hard attention (Strobl, 2023), global attention (Liang et al., 2023), local attention (Sugiharto et al., 2023), multihead attention (Sugiharto et al., 2023), etc. in our study we utilized the spatial attention (Wang et al., 2023) which belong to the local attention mechanism. In that type of attention, the attention focuses on spatial regions of images and assigns weights to specific areas while ignoring less important regions.
This study proposes a Real-Time Emotion Recognition System based on Fog Computing Technique (RERS-FoG) that specifically tackles the two issues mentioned previously. The proposed RERS-FoG recognizes how creating an environment of safety can directly improve patient outcomes by lowering stress and anxiety. It has a timely notification system that enables stockholders to react quickly and makes real-time environmental monitoring possible. Within the RERS-FoG framework, facial expressions are converted into cross-bound emotions spanning two stages: feature extraction and emotion detection and recognition. Alongside data preprocessing steps like normalization, resizing, and denoising, feature extraction involves selecting specific features using various methods to retain essential information while minimizing data redundancy. Our study proposes two main models, PCA_CNN and Yolov8, with the self-attention mechanism. first for PCA_CNN model. PCA transforms the data based on a matrix that retains features with high variance, effectively reducing dimensionality. Subsequently, a Deep Convolutional Neural Network (DCNN) model is utilized for image classification based on fusion. Second, for YOLO V8 with self attention mechanism, The primary contribution of this paper can be briefly summarized as follows:
• Introducing a Real-Time Emotion Recognition System based on the Fog Computing Technique (RERS-FoG) to capture real emotions better than the traditional approaches.
• Utilizing dimension reduction techniques on the data, this optimization stage increases learning by focusing on the most essential traits.
• Evaluating the proposed model on an emotion identification dataset that included many photos classified into seven different emotion classes, the model achieves superior performance In terms of accuracy, precision, recall, and Area Under the Curve (AUC).
• utilizing refined attention mechanism integrated with YOLOv8, achieving 81 FBS on edge devices while maintaining significant accuracy of 98.7
• Extended testing on both general and ASD-specific datasets, showing superior robustness (92.3% AU alignment) compared to VGG/ResNet baselines in resource-constrained scenarios.
The rest of this study is organized as follows: Section 2 provides recent and current research directions; Section 3 highlights methodology and dataset descriptions. Section 4 introduces the proposed system, which directly reduces anxiety and stress on patient outcomes by providing a real-time monitoring system and DL detection. Section 5 illustrates the experimental results. Section 9 provides the paper's conclusion and work summary.
2 Literature review
Detecting the emotions from facial expressions has been challenging for several years (Shanok et al., 2019; Lord et al., 2018). Facial expressions are the way toward good communication and interactions between people; they help improve social communication and provide continuous feedback (Shanok et al., 2019; Silva et al., 2021). Autism is a complex neurobehavioral condition that causes several impairments in developmental language, social communications, and interactions (Silva et al., 2021). Therefore, people with Autism have several difficulties in emotion recognition. The trained specialist could help people with Autism by improving social communication. However, due to the high intervention cost and the shortage of qualified specialists, people with autism find it difficult to appeal to this approach (Lord et al., 2018; Johnson and Myers, 2008). Accordingly, there was a long overdue need for an emotion recognition system that could help automatically recognize (Elseddik et al., 2023; Saleh et al., 2025).
This section will discuss the methods developed for facial emotion recognition for Autism and everyday people. Firstly, facial emotion recognition was based on statistical approaches. In these approaches, all global characteristics of the face image are extracted in a feature vector. Then, Subspace methods such as moment-based, spatial frequency, Fisher linear Discriminant analysis (FLED) (Loog, 2006), Principle component analysis (PCA) (Wold et al., 1987), and Two-Directional PCA (Alshazly et al., 2020) were used. It was the most efficient and successful technique in this period. In such methods, images were first transformed into the frequency domain, and then coefficients with low frequency were taken as invariant features. The most invariant image features are then utilized as image descriptors in face recognition.
Other works utilized the local features of the interior parts of the face image, i.e., the distance between eyes, nose dispatch, mouse height, and width, etc., because these local features are more robust against variations. These methods could be subdivided into two types: (1) the dense descriptor that extracts local features pixel by pixel and (2) the sparse descriptor that divides the image into several patches and specifies the invariant features. Scale-invariant feature transform (SIFT) is an example of sparse descriptors. It was first introduced in 2004 by Lowe. In Brahnam et al. (2014), D.G. was then utilized in several studies for facial expression. Such methods achieve superior results against expression and occlusion. In the period between 2007 to 2011, Gabor wavelet was widely utilized as a local image descriptor. It depends on both frequency and space domains. Therefore, the extracted features are invariant to rotation and scale. In Brahnam et al. (2014), utilized the Gabor filter in the face image; this could detect lines and edges. In Chen et al. (2010) developed weber's law-based dense descriptor. It is an invariance to noise variations and image illumination. Despite the satisfactory performance achieved by These methods, feature extraction steps and classification required prior knowledge and complex parameter adjustment. Therefore, various researchers use classification techniques that remove this complicated process in feature engineering.
The DL algorithm, CNN, can automatically learn picture properties without requiring manually created characteristics (Alzubaidi et al., 2021; Nguyen et al., 2020). CNN adds weight to each element and object in a picture, enabling it to stand out. The preprocessing procedures in CNN are substantially less than those in other archaic techniques. CNN is frequently used for a variety of computer vision applications, such as recognizing faces in images (Silva et al., 2021; Liu et al., 2014). For instance, Pathar et al. (2019) produced an optimistic CNN model that divides patients into seven emotions. Similarly, several studies have suggested different CNN models, like the Deep Belief Network and the autoencoder model, to accurately identify facial expressions (Wang et al., 2018). In other research, transfer learning was also used to recognize emotions, leading to high F1 scores and accuracy in the MobileNet, Xception, and Inception V3 models. Additionally, some research have used facial analysis to determine attentiveness in autistic children's facial images for other purposes (Kim et al., 2017). Others in Hakim et al. (2024) and Lokeshnaik et al. (2023) utilized CNN based approach for classifying images to 6 emotions (Kant et al., 2025; Meghana et al., 2023).
Attention processes have a significant impact on CV systems, especially FER systems. For example, Zhang et al. (2022) used class activation mapping to analyze attention maps generated by their model, whereas another review in Novais et al. (2022). Incorporated an attention branch that trained a face mask highlighting discriminative elements for emotion recognition. These findings emphasize the significance of attention processes in face emotion identification. Furthermore, feature extraction has used self-attention methods to capture local and global contexts via convolutional layers. These collected characteristics are subsequently employed in a relation attention module, which uses self-attention to capture relationships between patches. However, the practical deployment of facial recognition systems still needs to be improved due to noise, ambiguous annotations, and complex real-world scenes. Therefore, attention modules have gained significant interest in facial emotion recognition tasks, considering their effectiveness in computer vision applications (Alabdulhafith et al., 2023; El-Rashidy et al., 2025).
Additionally, psychological studies have identified specific facial features important for emotion recognition, such as the mouth for observing happiness and the eyes for detecting sadness. DCNN models extract discriminative features for emotion recognition, and class activation mapping helps identify these features at each layer. This mapping technique has shown promise in localizing features around the eyes for movement analysis, providing a better understanding of the model's performance. As a result, integrating attention mechanisms and analyzing discriminative features via class activation mapping have appeared as valuable techniques in facial emotion recognition. These approaches address the challenges associated with practical deployment and improve understanding and performance. While the current architecture prioritizes real-time performance, several recent works have concentrated on multitask attention. These approaches focus on shared attention mechanisms across related tasks (Hayat et al., 2024), which could improve feature extraction by up to 40%. Although this method enhances overall accuracy, it also increases computational costs by approximately (1.5–2.5x), exceeding our latency targets. To address this, we plan to explore alternative hybrid architectures with a lightweight multitask backbone.
The field of animal emotion detection is being transformed by advances in computer vision and deep learning, with a growing research focus on visual and behavioral cues like facial expressions and movement trajectories. Despite this shift, the predominant reliance on unimodal data for instance (Chiavaccini et al., 2024; Descovich et al., 2017), inferring state from vocalizations imposes fundamental limitations on accuracy and robustness, as it ignores the inherently multimodal nature of emotional expression. Consequently, the development of multimodal recognition systems is critical, yet it is impeded by dual challenges: the technical complexity of acquiring and synchronizing diverse data streams, and the unresolved question of how to optimally fuse this information to enhance computational model performance (Ehret, 2018; Jabarin et al., 2022; Yu et al., 2024).
Facial emotion recognition datasets are widely utilized by researchers in various research endeavors, particularly in emotion recognition. Evaluating the effectiveness of these datasets and the performance achieved using them is crucial. The methods and objectives for collecting facial image datasets differ depending on the specific applications in facial systems development. For reference, Table 1 details the characteristics of the most common facial emotion recognition datasets.

Table 1. Comparison of different emotion recognition datasets (images reproduced from F.M. Talat, et al., “Facial emotion dataset for autism children”, https://doi.org/10.34740/kaggle/dsv/13569077 and I. Goodfellow, et al., “Challenges in representation learning: Facial expression recognition challenge”, https://www.kaggle.com/datasets/msambare/fer2013 under the Database Contents License (DbCL) v1.0).
2.1 Comparison of emotion recognition datasets
Table 1 provides a comparative analysis of different datasets used in emotion recognition. It highlights the sample size, number of emotions classified, and dataset description.
3 Materials and methods
3.1 Dataset description
As shown in Figure 1, our paper includes two different datasets for facial expression. We chose to test the developed model with two different datasets to ensure the generalization ability of the developed model. The utilized dataset includes images for persons with 7 classes (Anger, sad, surprise, neutral, happy, disgust, and fear) (Goodfellow et al., 2013).

Figure 1. Emotions recognition data with seven different classes (images reproduced from F.M. Talat, et al., “Facial emotion dataset for autism children”, https://doi.org/10.34740/kaggle/dsv/13569077 and I. Goodfellow, et al., “Challenges in representation learning: Facial expression recognition challenge”, https://www.kaggle.com/datasets/msambare/fer2013 under the Database Contents License (DbCL) v1.0).
The images dataset includes 35,888 images that divide to (Anger: 3,995, Fear:7,097, happy: 7215, Natural: 4969, Sadness: 4,830, Surprise: 3,171, disgust: 463) in the training part and (Anger: 958, Fear:1024, happy: 1774, Natural: 1223, Sadness: 1247, Surprise: 831, disgust: 111) in the test part. The data consists of 48 × 48 pixel grayscale images of faces. The faces have been automatically registered so that the face is more or less centered and occupies about the same amount of space in each image. The dataset that utilized for testing is obtained from Talaat et al. (2024).
3.2 Principal component analysis
PCA is a popular data reduction approach that involves translating data from its original coordinate system to a new system chosen by the data itself. Because it contains the most relevant information, the converter selects the direction of the coordinate axis based on the highest variation (Ma and Yuan et al., 2019; Sun et al., 2021). The first new axis correlates with the direction of the most significant variance in the original data. In contrast, the second axis is chosen orthogonally to the first, signaling the second most considerable variance. This iterative approach continues, with each repeat matching the feature dimension of the original data. The first step in PCA is to normalize the original data with a mean of 0 and a variance of 1. The eigenvalues and eigenvectors are then determined using a covariance matrix. The eigenvectors with the highest eigenvalues are then picked. Finally, the input is translated or mapped into a new space created by these chosen eigenvectors. This mapping permits the capture of compressed data with decreased dimensionality (Ma and Yuan et al., 2019).
3.3 Convolutional neural network
CNN effectively is a DL model used to extract the spatial features from the input data. It's a feedforward neural network that depends on the convolutional structure. It has several layers: The convolutional layer utilizes several convolutional kernels with different learnable parameters. It's a matrix with equal odd numbers, which represent matrix weights. The weight of this convolutional matrix corresponds to the local area of the feature map; it performs the convolutional operation of that area by sliding operation. Feature map size generally is W,H,C, representing height, width, and channel. Flow of data in the convolutional kernel with size n×n×i could be described as in Equation 1:
Where m represents the matrix w, is the weight of the matrix, and M is the bias, f is the non-linear activation function. The correlation convolution layer and the convolution kernel and feature surface for a 2-D matrix input with conv size k, matrix size i, and padding are shown in Equation 2:
The pooling layer is utilized to reduce the dimension to the input dimension to reduce the convolutional connections, thereby reducing the network computation. Additionally, it allows for the achievement of scale invariance, translation invariance, and rotation invariance of the input image. Lastly, it enhances the robustness of the output feature map against the distortion and errors of a single neuron. Several alternative methods have been proposed, such as Lp Pooling (Gulcehre et al., 2014) and stochastic Pooling (Zeiler and Fergus, 2013); however, the two most commonly used pooling methods that used to alleviate over-fitting more effectively is the average pooling (Gholamalinezhad and Khosravi, 2020) and maximum pooling (Eom and Choi, 2019). The general relationship that satisfies the relationship between the input and output matrix sizes in the pooling operation is as follows:
The fully connected layer integrates and categorizes local input using category discrimination obtained after convolution and pooling. In the end, it produces the image's category information (Gu et al., 2018). Several hidden layers in the FC Layer extract high-level characteristics from the preceding network in a more complicated way. The output vector that results is used to identify the category to which the picture belongs, where the number of neurons at the output end is equal to the number of categories.
3.4 Attention model
Attention models are a class of neural network architectures that enable selective processing of input sequences via an attention mechanism (Vaswani et al., 2023; Chaudhari et al., 2021). The attention mechanism plays a vital role by selectively allocating available resources to focus on processing the salient part of a scene rather than the entire scene. Multiple attention mechanisms are utilized to address a known weakness in convolution. Mathematically, attention can be represented as a weighted sum of the input sequence, where each element is assigned, a weight based on its relevance to the current output being generated by the model. Various methods can be used to compute the attention mechanism, but the spatial features based on dot product approach is a popular one (Santana and Colombini, 2021). In this method, the input sequence and the model's current state are multiplied to obtain a set of scores, which are then normalized using the SoftMax function to obtain the attention weights (Chefer et al., 2021). The dot product attention mechanism can be characterized as a set of equations that compute the scores, attention weights, and context vector, as follows: An input sequence X with dimension (T, D) and h hidden state.
The attention weights are computed as:
The context vector is then calculated as:
Where:
• N: Sequence length (flattened spatial dimensions H×W).
• D: Input feature depth (e.g., 256 for YOLOv8 neck).
• dk, dv: Key/Value dimensions (set to D/8 = 32).
Ultimately, the context vector is derived through the element-wise multiplication of the attention weights and the input sequence across the time axis. This operation yields a weighted summation of the input sequence, highlighting the most relevant segments crucial for the model's ongoing state. Herein, the operation × denotes matrix multiplication, and Softmax(·) is the column-wise softmax operator, and it helps to compute a normalized version of the input matrix X = [x1, x2, x3, …, xn]. WH denotes a weight matrix of dimensions, including (H, D), used to project the current state h of dimensions H to the same dimension as the input sequence. Q denotes matrix as trainable variables.
3.5 Attention based CNN model
Unless the importance of CNN in image classification, it has several limitations, including the following: (1) CNN may be less suitable for capturing long-range dependencies between various picture sections, making it challenging to recognize complex or irregularly shaped objects. (2) Furthermore, CNNs may be computationally costly, restricting their usefulness in some applications, mainly when working with massive datasets or high-resolution pictures. An attention method has been developed (Santana and Colombini, 2021). This method utilizes the obtained features of different network parts as weights to help other parts learn more significant sequential information. Two main types of attention methods are currently used: channel attention (Chen et al., 2020) and spatial attention (Hu et al., 2019). Channel attention focuses on the effects of channel features on the entire CNN, while spatial attention treats all pixels at the exact location, with its weight learned through each pixel at each location. These attention mechanisms can address the problem from different perspectives, providing a solution.
3.6 Pre-trained models
A pre-trained model has previously been trained on a large dataset. By training the model, it learned meaningful patterns and features from the data being trained on a vast, labeled dataset, achieving promising performance on different tasks, including object detection, image classification, and machine translation; using a pre-trained model offers several advantages, including the following:
• It saves significant time and computational resources as training a DL model from scratch can be a time-consuming and resource-intensive process.
• Save time and resources by allowing for fine-tuning rather than starting from scratch.
• Because of their rich representations gained from varied datasets, pre-trained models generalize well.
• Help with domain adaptability by capturing general information as well as patterns for specific tasks.
Furthermore, pre-trained models serve as a good starting point for transfer learning, transfer learning id the process of fine-tuning a previously trained model on a new, smaller dataset tailored to the task at hand. This method is essential when the target dataset is small. There are pre-trained models, including VGG (Huang et al., 2017), ResNet 5, RestNet, and MobileNet, and their derivatives are examples of popular pre-trained models. These models have proven cutting-edge performance on various benchmarks and are the foundation for many cutting-edge applications.
3.7 YOLO V8 model
YOLO (you only look once) is considered one of the most popular models in object detection, and it is a significant update of YOLO V5. The backbone of YOLO V8 uses CSPDarkNet. The kernel of the model was resized from 6 × 6 to 3 × 3; in addition, all C3 structures were updated to C2f structure. The same is true for the number of C2f blocks, which is changed from 3-6-9-3 to 3-6-6-3, regarding the neck part of the YOLO v8 model. It used PANET, similar to yoloV5; this model is effective and fasr. The backbone of the model goes through SPPF, then passes through the downsample layer, and then through PANET after the upsampling technique. The developed output is sent to the model head for loss calculation. PANET is a bidirectional network. When comparing it to FPN, PANET provides a bottom-up path, which makes it easier for information to flow on the top. The head part of the YOLO v8 model is unlike the YOLO v5 model. It uses a Decopuled head, which distinguishes between regression and classification branches. YOLO v 8 used task TaskAlginedAssigfner to specify weighted scores across classification and regression tasks, utilize BCE for loss classification and CIOU for regression tasks.
4 Proposed work
This section spans two parts: The initial part focuses on the theoretical elements, investigating the hybrid of fog technology and an emotion recognition system to enhance the system's performance in real-time. The subsequent part addresses practical considerations, specifically feature selection using PCA and the implementation of DL as the learning technique.
4.1 Proposed real-time emotion recognition system based on fog computing technique
In emotion recognition, wireless technology combined with fog computing has successfully provided rapid analysis and personalized solutions that can promise advancements in mental health, human-computer interaction, and social robotics. This paper introduces a real-time emotion recognition system based on fog computing (RERS-FoG). The proposed approach recognizes the direct impact of lowering anxiety and stress on patient outcomes by delivering a safe atmosphere. It has an on-time alerting system permits nurses to respond quickly and enables real-time environmental monitoring. As shown in Figure 2, the overall layers of the proposed system include monitoring sensors, medical computing, real-time notification systems, and cloud server layers.

Figure 2. Architecture of the proposed RERS-FoG system showing the abstraction layers and components.
The monitoring layer carries a pivotal position in modern emotion recognition systems. With the proposed RERS-FoG, the monitoring layer facilitates data collection, integration, and analysis from diverse connected devices and sensors, which is critical for improving system functionality. Suppose RERS-FoG includes wearable sensors, smart cameras, and microphones, which are instrumental in capturing essential data about facial expressions, voice characteristics, and physiological indicators. These devices operate in a continuous monitoring mode, capturing real-time data that is subsequently transmitted to the subsequent layer for additional processing and in-depth analysis to ensure timely intervention. The architecture as discussed in Figure 2 consists of 4 distinct layers:
1. Sensing layer: This layer includes data acquisition from different sources such as smart cameras in a clinical or personal room. By leveraging the monitoring layer, the RERS-FoG system can access diverse data sources, allowing for multimodal analysis of emotions. Integrating data from multiple sensors and devices enhances the accuracy and reliability of emotion recognition algorithms. Moreover, the real-time monitoring in the monitoring layer significantly improves the accuracy, timeliness, and efficacy of emotion recognition processes, ultimately enhancing the understanding of individuals' emotional well-being and providing tailored reinforcement when required. A light weight preprocessing step occurs here to crop the facial regions to reduce the data sent to the next layers.
2. Fog computing layer: This is the core of RERS-FoG system that resides in the local server, or edge node. The primary functions of this layer are the following:
(a) Feature reduction: The preprocessed images received from the sensing layer undergo data reduction using the PCA algorithm and emotion detection using the CNN attention model. PCA converts highly dimensional data into a representation with a lower dimension while preserving as much information as feasible. The PCA starts to function by doing the following steps after receiving data from sensor devices:
(b) Real-time decision making: After the role of data monitoring in RERS-FoG, the real-time medical computing layer serves as the second stage. The work in this layer is completed in a fog server to speed up the decision-making process; if critical emotions are detected (i.e., fear, anger), the fog layer triggers an action to on-site staff without waiting for cloud notification. This layer operates to ensure timely alerts and notifications based on the analysis performed in the fog computing layer.
The following function in the fog server for emotion recognition and classification is based on CNNs, a DL model inspired by the structure and functioning of the human visual system. They excel at processing and analyzing visual data, such as images and videos. CNNs consist of several layers, including convolutional, pooling, and fully connected layers, which collectively learn hierarchical representations of the input data. It works based on the following steps:
(a) The convolutional layers apply filters to the input data, extracting local features and patterns. These filters learn to detect edges, textures, and other visual elements relevant to the task at hand.
(b) Pooling layers downsample the feature maps obtained from the convolutional layers, reducing the spatial dimensions of the data. This helps capture the most salient features while discarding some of the less important details.
(c) The fully connected layers take the flattened feature maps from the previous layers and perform classification or regression tasks. They learn to map the extracted features to the desired output, such as emotion labels in our case.
3. Cloud server layer: Cloud server layer: This layer works as centralized repository for long term tasks. It utilized to aggregate the historical emotion data , analyze the results and report logs to various fog nodes It provides a scalable platform for storing large volumes of data and enables comprehensive reporting and system-wide insights.
The cloud server is the final layer in the proposed RERS-FoG system, offering many advantages, including scalable computing resources, streamlined data management, and advanced analytics capabilities tailored for emotion recognition systems. Using a cloud server for holding and analyzing historical data allows seamless retention, processing, and retrieval of past emotion-related information, leading to more precise and resilient emotion recognition models and algorithms. The cloud server is equipped with mechanisms to continuously update historical data, guaranteeing that the system aids from a dynamic and current historical database. As new data becomes accessible, it undergoes preprocessing and integration into the existing historical dataset to keep the system relevant and adaptive. Figure 3 illustrates the sequence diagram of the proposed RERS-FoG, showcasing the system's interaction and flow of processes. The architecture of the proposed attention-enhanced convolutional neural network is illustrated in Figure 4. The complete workflow of the proposed system, including data preprocessing, model training, evaluation, and explainability, is presented in Figure 5.

Figure 3. The sequence diagram of the proposed RERS-FoG.

Figure 4. Proposed CNN_attention.
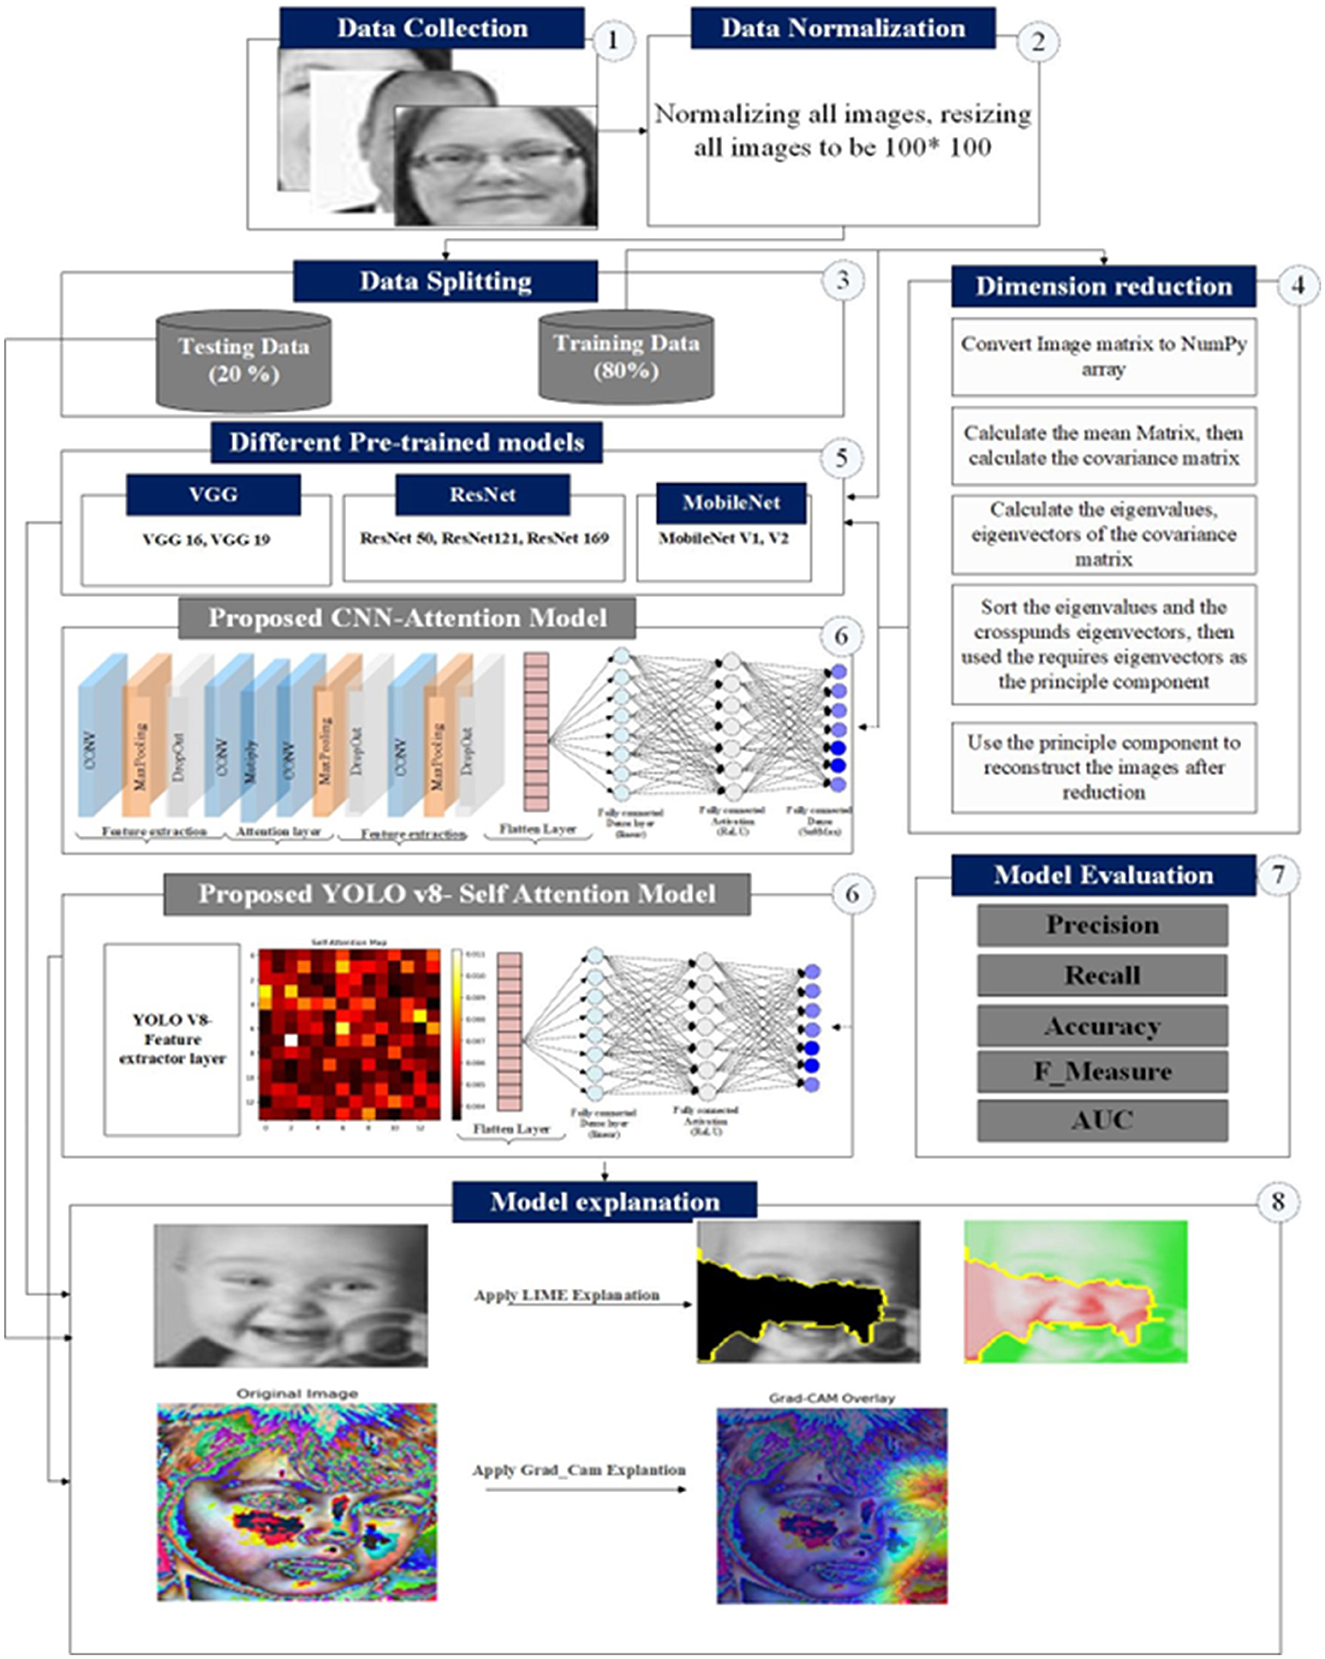
Figure 5. Proposed YOLO v8 attention model. Facial expression recognition challenge, https://www.kaggle.com/datasets/msambare/fer2013 under the Database Contents License (DbCL) v1.0).
4.2 Proposed CNN-attention model
The proposed framework consists of four steps to achieve accurate image classification while providing interpretability and understanding of the decision-making process. The steps are discussed as follows:
1. Our framework starts with reading the input images. First, we make data normalization by standardizing the input data to 100 × 100. After normalization, the dataset was split into training and testing with 80% and 20%. This percentage enables the model to learn from the training and evaluate unseen data.
2. The second step includes utilizing the PCA model to reduce the data dimensionality while preserving essential information. The required computational powers and resources decreased by reducing the data dimension, facilitating the subsequent steps.
3. We utilized several pre-trained models, including VGG, ResNet, MobileNet, and DenseNet, which enhanced performance in various image classification tasks. However, to address the challenges related to execution time during the testing phase, a custom CNN model was developed from scratch. This custom model is designed to streamline performance and optimize computational efficiency.
4. CNN-attention model was developed to enhance overall performance. The developed model concentrated on ignoring irrelevant information using the spatial attention technique. The developed model can assign higher weights to the more significant features to better capture the relevant features.
5. The fourth step is utilizing the explanation tools to specify the ROI, which significantly impacts the overall decision. This step helps to provide a better understanding of the model decision. In our framework, we utilize the LIME (local interpretable model-agnostic explanation) to help highlight the significant areas contributing to the classification results. This provides transparency and interpretability and allows users to specify the factors that affect model decisions.
The model performance was evaluated using precision, recall, F-score, and AUC. These metrics contribute to the comprehensive evaluation of the model classification ability.
4.2.1 Input layer
As shown in Figure 6 the face that includes the human emotion is provided as input. The original face emotion image is represented as X, where X belongs to the total number of images, and each image has a dimension of N×M×C. Here, N×M represents the size of each band image, and C represents the total number of bands (channels).

Figure 6. Proposed architecture.
4.2.2 Dimension reduction layer
The goal is first to reduce the dimensionality of the image data. To achieve this, we utilize the theory of PCA. Through PCA, a set of principal component feature maps is obtained. The principal components encompass the most essential information extracted for subsequent processing. The main objective of the PCA is to utilize the orthogonal transformation to convert the collection of potentially correlated variables into a set of linearly independent variables. This process is done through the following steps:
• The input data image is first represented as matrix X, as shown in Equation 6. Each channel band expanded in the row vector.
• The matrix X is then standardized to obtain matrix A (see Equation 7), where aij = Xij−μi where i = 1, 2, 3, …, N and
• The standardized matrix was then utilized to calculate the covariance matrix R:
• Calculating the eigenvalues and the corresponding eigenvectors. Eigenvectors calculated through the equation |R−λL| = 0. Note that the big eigenvalue corresponds with the most essential features to the eigenvector.
• The chosen eigenvector, which corresponds to the highest eigenvalue, is constituted in matrix V:
• Choosing eigenvalues are then multiplied by the standardized matrix to calculate the output after dimension reduction.
In brief, the initial step in our proposed model involves preprocessing the images by transforming them into an appropriate format for analysis. Subsequently, each image is flattened into a 1-dimensional vector, where each element corresponds to a pixel value. The principal components are derived by applying PCA to this vectorized image data, capturing the most significant variations present in the dataset.
The number of principal components to retain is determined by the desired information preservation level or by assessing the explained variance ratio. Figure 7 shows the original figure and the image after applying PCA.

Figure 7. Image before and after dimension reduction (image reproduced from I. Goodfellow, et al., “Challenges in representation learning: Facial expression recognition challenge”, https://www.kaggle.com/datasets/msambare/fer2013 under the Database Contents License (DbCL) v1.0).
4.2.3 Attention layer
The CNN attention model is applied to the reduced image following PCA. It integrates an attention mechanism that focuses on the crucial features. The attention model assigned weights (scores) that were adjusted during the training process. These scores determine the importance of various regions in the images according to their relevance. In our study, we utilize the element-wise multiplication attention process. In this technique, each element is individually multiplied by the corresponding weight. This operation diminishes or amplifies the contribution of each component according to the assigned weights. They are multiplied and then aggregated to form the final weights. Using attention via multiplication, the model may emphasize the most critical or informative aspects while de-emphasizing less important ones by learning the attention weights.
4.2.4 Image classification
When the Attention CNN model has finished training, it is ready to identify pictures. When given a new picture, the model runs it through the convolutional layers, extracting relevant information. The attention mechanism directs the model's attention to critical areas, improving its capacity to discriminate between classes. The final fully connected layers provide a probability distribution across distinct courses, showing the image's likelihood of belonging to each class. The projected class for the supplied image is assigned to the class with the highest probability. The following are the details of the CNN attention model that was utilized. Algorithm 1 shows the main steps of the proposed model.

Algorithm 1. Proposed CNN attention model steps.
4.3 Integration of PCA and CNNs in emotion recognition
The integration of PCA and CNNs in emotion recognition can harness the benefits of both techniques. Here is a possible workflow for their combination:
• The facial images are preprocessed to align and normalize the faces, ensuring consistency in the input data.
• PCA is applied to preprocessed images to reduce their dimensionality. This step extracts the most informative features related to facial expressions.
• The reduced-dimensional PCA features are used as inputs to train a CNN model. CNN learns to map the PCA features to emotion labels, leveraging its ability to capture complex patterns and spatial dependencies.
• After training, the integrated model can take a new facial image, apply PCA dimensionality reduction, and pass the resulting features through the trained CNN for emotion prediction.
The benefits of this integration include:
• Using PCA to reduce the dimensionality of the data, we obtain a lower-dimensional representation that can be more easily interpreted and visualized. This can aid in understanding the underlying factors contributing to different emotions.
• PCA reduces the dimensionality of the data, making it computationally more efficient to train and use CNN models. This can significantly speed up emotion recognition systems' training and inference processes.
• The combination of PCA and CNNs can improve the generalization capabilities of the emotion recognition model. PCA helps reduce noise and irrelevant features, allowing CNN to focus on the most informative aspects of the data. This can lead to better performance on unseen data.
• CNNs are known for their ability to handle variations in input data, such as changes in lighting conditions, facial expressions, and poses. By integrating PCA, which captures the most relevant features, the model can become even more robust in these variations.
4.4 Proposed YOLO-8 self-attention model
The proposed attention mechanism integrated into the YOLO architecture represents a significant enhancement for object detection tasks, particularly in complex visual environments. This discussion analyzes the key components and implications of the algorithm. The algorithm employs a channel reduction strategy through the reduction ratio parameter, which serves multiple purposes. First, it substantially reduces computational complexity by compressing the channel dimension before computing attention scores. This is crucial for real-time object detection where computational efficiency is paramount. Details of the utilized algorithm detailed in Algorithm 2. The reduction ratio acts as a bottleneck that maintains essential features while discarding redundant information, striking a balance between model performance and computational requirements.

Algorithm 2. Proposed YOLO-8 self-attention model.
The use of separate convolutional layers for Query, Key, and Value projections follows the established transformer architecture paradigm. However, the innovation lies in adapting this mechanism for convolutional networks by maintaining spatial relationships through careful reshaping operations. The Query and Key projections share the same reduced dimensionality, enabling efficient computation of attention scores, while the Value projection retains the original channel dimension to preserve feature richness. The algorithm demonstrates several optimizations for computational efficiency:
• Dimensionality reduction: By reducing channels through the reduction ratio, the algorithm minimizes the computational cost of matrix multiplications in attention computation.
• Spatial compression: The adaptive average pooling to 14 × 14 resolution reduces spatial dimensions while maintaining global contextual information.
• Learnable scaling: The gamma parameter provides adaptive control over the attention contribution, preventing over-reliance on attention in early training stages.
4.5 Attention mechanism dynamics
The attention computation follows a scaled dot-product approach, where the scaling factor stabilizes gradient flow during training. This prevents the softmax function from entering regions of extremely small gradients, which is particularly important given the high dimensionality of the feature maps.
The residual connection (Gamma * attention output + Input) is a critical component that ensures training stability. By initializing gamma to zero, the network begins training without the attention mechanism, allowing it to gradually incorporate attention-based feature refinement as training progresses. This warm-start approach prevents disruption of pre-trained features when fine-tuning on our specific detection task.
4.5.1 Hyperparameter tuning
All hyperparameters are tuned using Bayesian Optimization with Hyperband, efficiently tuning critical parameters (γ, learning rate, PCA components). Table 2 shows we add the hyperparameter tuning table that gives the search range, in addition to the optimized value.

Table 2. Hyperparameter optimization results.
5 Results and discussion
5.1 Experimental results with different pretrained architectures on orignal data
We evaluated the pre-trained models using the original data in this section of the results. Table 3 provides a detailed breakdown of the results obtained. Upon analyzing the table, several noteworthy observations can be made. (1) VGG 19 outperforms VGG 16 in terms of classification accuracy, precision, and recall. This improvement can be attributed to the additional layers and parameters present in VGG 19. The increased depth of the model allows it to capture more complex characteristics and patterns, resulting in enhanced performance. (2) ResNet 169 vs. ResNet 121: When comparing ResNet 169 to ResNet 121, we observe a slight increase in accuracy and precision with ResNet 169. The higher number of parameters in ResNet 169 enables it to learn more intricate representations, improving performance in the given task. (3) MobileNet and MobileNet V2 efficiency: MobileNet and MobileNet V2 models achieve competitive accuracy while utilizing significantly fewer parameters than VGG and ResNet architectures. This highlights the effectiveness of MobileNet architectures in scenarios with limited computational resources. These models balance accuracy and efficiency efficiently, making them well-suited for resource-constrained environments. (4) MobileNet V2 superiority: Among the architectures, MobileNet V2 demonstrates the highest accuracy, precision, and recall. The improved performance of MobileNet V2 can be attributed to its advanced design and innovative additions, which have enhanced its ability to extract meaningful features and representations from the data from those observations; we could conclude that MobileNet V2 emerges as the most accurate, precise, and recalling architecture due to its superior design and advancement.

Table 3. Performance of pre-trained models on original data.
As shown in Table 4, we could observe the following when we analyze the results from a computational time point of view. (1) ResNet took 1,512.44 seconds, indicating that it takes more computational time than the other version (VGG 19: 1,143.11); this could be attributed to the significant number of parameters and the network architecture, which requires more computations per inference. (2) ResNet takes longer than VG with the two tested versions; this attributed to the residual connection employed in the ResNet architecture. (3) ResNet 169 required the longest running time, owing to the significantly higher number of parameters and deeper network structure. (4) MobileNet demonstrates lower runtime than VGG and ResNet. This returns to depth-wise separable convolutions. MobileNet V2 enhances the computational runtime; MobileNet V2 features such as inverted residual blocks and linear bottlenecks lead to quicker calculations without sacrificing accuracy.

Table 4. Performance of pre-trained models on reduced data.
5.2 Experimental results with different pre-trained architectures on data after dimension reduction
This section explores the performance of pre-trained models after data dimension reduction. Dimension reduction aims to reduce the data dimensionality without losing important information. In the following results, we could observe the impact of dimension reduction on the overall performance of the pre-trained model. Table 3 details the results of those experiments in terms of different evaluation metrics. From that table, we could observe the following: (1) VGG 16 achieves adequate classification accuracy (ACC = 0.876). However, the other evaluation metrics, including precision-recall and F-measure, were slightly lower than VGG 19.
The AUC value was found to be relatively low, indicating that the model's discrimination capability was limited. The computational time after dimensionality reduction did not decrease proportionally to the performance improvement. For the pre-trained architectures, VGG19 exhibited improved performance compared with its counterpart trained on the original data, achieving higher accuracy (0.884), precision (0.913), and recall (0.843) values than VGG16. The ResNet architecture demonstrated a well-balanced relationship among precision, recall, and F-measure, indicating a more effective trade-off between positive and negative class predictions. Among all models, ResNet169 contained the largest number of parameters and achieved superior precision (0.859), recall (0.853), and F-measure (0.833), with a notably stronger AUC value, confirming enhanced discriminative power. These results collectively suggest that dimensionality reduction contributed positively to the overall predictive capability of the models.
In contrast, MobileNet achieved satisfactory performance (accuracy of 0.801) but did not surpass ResNet169, despite having a comparable number of parameters. Nonetheless, MobileNet demonstrated a substantial reduction in computational time, leading to improved efficiency. After dimensionality reduction, MobileNet achieved the highest accuracy among all evaluated models while maintaining the lowest computational cost, highlighting its suitability for real-time or resource-constrained applications.
Figure 7 illustrates the validation and loss curves of the pretrained VGG19 model using the original dataset, whereas Figure 8 presents the corresponding confusion matrix. From a computational standpoint, several observations can be drawn:
• VGG16 and VGG19 required significantly longer processing times, implying higher computational demands relative to other models.
• Despite the strong discriminative ability of ResNet, it incurred the highest computational time, potentially limiting its applicability in real-time environments.
• MobileNet, when compared to the VGG and ResNet families, considerably reduced computational time while maintaining competitive precision, underscoring its computational efficiency.
• MobileNet V2, in particular, exhibited the lowest processing time among all tested models, making it an excellent candidate for latency-sensitive applications.

Figure 8. VGG model results before dimensionality reduction: (a) training accuracy and (b) training loss.
Overall, dimensionality reduction improved the performance of all models, as it effectively concentrated the most informative features. Both MobileNet V1 and MobileNet V2 achieved substantial reductions in computational time while maintaining or improving accuracy. Figure 8 presents the training accuracy and loss after dimensionality reduction, and Figure 9 displays the corresponding confusion matrix.

Figure 9. Confsuion matrix VGG after applying dimension reduction.
5.3 Results of proposed CNN attention mechanism
In this section, proposed CNN attention model introduces to evaluate the model on the original data and the data after dimension blackuction. Upon the model evaluation, we make the following observations: (1) utilizing the proposed CNN attention model improves the overall performance in terms of several evaluation metrics, (2) utilizing the proposed model on the original data achieves an accuracy of 0.916, precision of 0.923, recall of 0.910, F-measure of 0.913, and an AUC of 0.911. These results suggest that the model performs reasonably well in accurately classifying samples and identifying positive instances, and (3) applying dimension blackuction on the original data enhances the model performance. The accuracy improved to 0.836, precision to 0.861, and Measure 0.851. These improvements indicate the utilizing dimension reduction captures the most significant features, increasing classification accuracy, identifying positive samples more effectively, and improving the capacity to distinguish across classes.
Regarding the computational time, the model decreases from 1,132.32 after applying dimension reduction to 610.45. This reduction after dimension reduction is because it successfully reduces the model complexity and reduces computational efficiency. The model achieves comparable or enhanced performance by condensing the essential information into a more compact representation while requiring fewer computational resources. The proposed model, which utilizes the attention model to provide notable computational efficiency, enhanced the performance with dimension reduction and reduced computational time in our proposed model. Using dimension reduction strategies considerably improves the model's accuracy, precision, recall, F-measure, and discriminative ability. Furthermore, decreased processing time indicates increased computational efficiency, making the model suitable for real-time applications or scenarios with restricted resources. These findings highlight the advantages of the attention mechanism and dimension reduction approaches in increasing performance and computing economy within the proposed model. Figures 10a, b shows the accuracy graph and loss of the proposed model with data after dimension reduction. Figure 11 shows the confusion matrix of the proposed model with data after dimension reduction.

Figure 10. Performance of the CNN self-attention model: (a) training accuracy and (b) training loss after dimensionality reduction.

Figure 11. Confusion matrix for CNN with self attention model.
We plot the confusion matrix from the model prediction on the testing data to provide more analysis of the proposed model. Table 5 shows the results of the proposed model with original data and dimension reduction data.
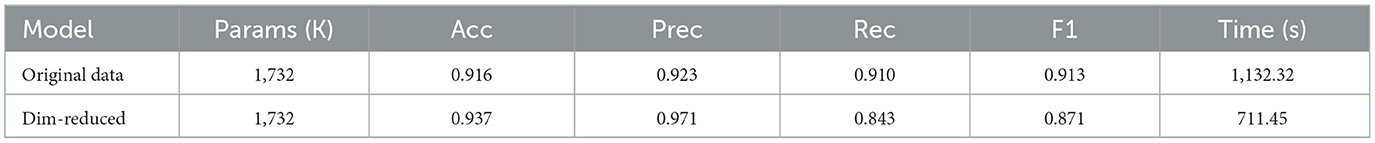
Table 5. CNN attention model results.
To check the importance of utilizing PCA, we test the PCA model with different models as shown in Table 6. The PCA demonstrate significant gains, PCA-> MLP show the lowest resource usage but the accuracy dropped with 7.4%. utilizing PCA with CNN improve the spatial awareness, give improved performance than CNN baseline. Variant (iv) with positional encoding shows marginally lower accuracy (0.928 vs. 0.936) than our primary PCA_CNN, suggesting that while spatial context helps, the added complexity may not justify the small improvement for this task.

Table 6. Performance comparison of model variants.
5.4 Results of proposed YOLO with self attention mechanism
In that section, we evaluate our proposed YOLO V8- Self-attention model to evaluate the model on the original data. Upon the model evaluation in Table 7, we make the following observations: (1) utilizing the proposed YOLO V8 with a self-attention mechanism that improves the overall performance in terms of several evaluation metrics, (2) utilizing the proposed model on the original data achieves an accuracy of 0.926, precision of 0.893, recall of 0.910, F-measure of 0.874, and an AUC of 0.855. These results indicate that utilizing YOLO v8 gives enhanced performance compared to the PCA-CNN model (3). Applying a self-attention mechanism on the feature map enhanced the model's performance. The accuracy improved to 0.89669, precision to 0.901, recall to 0.941, and measure to 0.881. These enhancements demonstrate that utilizing self-attention concentrates on the most salient features, augmenting classification accuracy, more effectively recognizing positive samples, and enhancing the ability to differentiate among classes. Regarding the computational time, the model decreases from 723.32 after applying dimension reduction to 610.45. after applying the self-attention mechanism. The model achieves comparable or enhanced performance by condensing the essential information into a more compact representation while requiring fewer computational resources. The suggested model employs the self-attention mechanism to achieve significant computational economy while improving performance through dimensionality reduction. Furthermore, our proposed model has a decrease in processing time. A self-attention mechanism significantly enhances the model's accuracy, precision, recall, F-measure, and discriminative capability. Reduced processing time signifies enhanced computational efficiency, rendering the model appropriate for real-time applications or resource-constrained environments. The findings underscore the benefits of employing the attention mechanism and dimensionality reduction techniques in enhancing the proposed model's performance and computational efficiency. Figures 12a, b illustrate the accuracy graph and loss of the proposed model after with self attention. Figure 13 illustrates the confusion matrix of the proposed model. To ensure consistency and realistic results, we implement strict identity-aware splitting with different folds Table 8 shows the results of the results of the proposed model from 1 to 5 folds. Model paramters detailed in Table 9.
• Superior processing efficiency (forward pass only).
• Better context awareness through self-attention.
• Multi-scale feature extraction capability.
• Improved generalization with unseen data.

Table 7. YOLOv8 with self-attention results.

Figure 12. YOLO v8 self-attention model results: (a) Yolo training, (b) Yolo_loss.

Figure 13. Confsuion matrix for YOLO v8 with self attention model.

Table 8. Performance metrics across different folds.

Table 9. Model parameters breakdown.
The YOLOv8 with self-attention achieves 98.69% accuracy with 624.45s runtime, demonstrating excellent real-time performance.
5.5 Discussion
Our study proposes two main models for real-time emotion recognition, including the CNN_PCA model and Yolov8 with a self-attention mechanism. The first module combines the strength of the CNN module that captures the spatial information and PCA, which enhances the feature representation. CNN_PCA model improves the model's ability to capture the information while decreasing the computational complexity. Compared with other pertained models, this model includes VGG, ResNet, and mobileNet. The second model is the YOLO v8 with the self-attention mechanism. This model first leverages YOLOv8 architecture as a feature extractor, and the self-attention mechanism permits the model to prioritize the most relevant spatial information and extract the context information. Experimental results assured that YOLO v8 with self-attention outperforms the CNN_PCA model, achieving high accuracy and enhanced model robustness in real-time emotion recognition. This returned to various reasons, including the following: (1) YOLO8 has a significant ability to process efficient data, unlike traditional CNN, which depends on sliding_window. Yolov8 is able to process images in a forward direction. This makes the model more efficient and faster in real-time use cases. (2) integration between self_attention mechanisms allows the model to concentrate on the most significant regions and capture the long dependencies as well as contextual relationships. (3) YOLOv8s have a significant ability to make feature extraction. It leverages multiscale in capturing features, which permits the capture of coarse and fine-grained features. This approach significantly impacts the emotion recognition task, as it can detect local features, such as microexpression, and global features, such as facial structure. These features are then prioritized using the self-attention mechanism. (4) A combination of YOLO and self-attention helps to achieve more generalization with the unseen data. The self-attention mechanism contributes to capturing context-aware features, which reduce overfitting and improve performance on diverse datasets. To compare all models in terms of all evaluation metrics, Figures 14a, b compares all pre-trained models before and after using the dimension reduction. Figure 14c compares CNN before and after dimension reduction and YOLOv8 before and after applying the self-attention mechanism. for more clarification, Table 10 summarize the previous mentioned results. The computational efficiency of the evaluated models is quantitatively analyzed in Table 11, which compares model size, inference time, frame rate (FPS), and GPU memory consumption.

Figure 14. Comparison between all utilized models: (a) pre-trained models, (b) pre-trained with dimension reduction, and (c) CNN and YOLO models.

Table 10. Performance comparison summary (Mean ± Std from 5-Fold CV).

Table 11. Model performance comparison.
We ran all experiments under a unified setting using 1-NVIDIA A100 GPU for all models, with batch size = 16 and 100 iterations excluded from timing. All models were executed using PyTorch 2.1 on CUDA 11.8. Table 12 summarizes the performance characteristics across different architectures.

Table 12. Performance comparison between fog+cloud and cloud-only approaches.
Our experimental results reveal several important findings. Most notably, our YOLOv8-SA model demonstrates significant performance advantages, achieving 2.3 × faster inference than VGG19 and 1.8 × faster than ResNet-169 while maintaining comparable accuracy. Although MobileNetV2 remains the fastest option with 102 FPS, this comes at the cost of 7.2% accuracy degradation compared to our proposed models. The memory efficiency of our solutions is particularly noteworthy, with YOLOv8-SA requiring only 1.8GB of GPU memory while delivering competitive frame rates. These results suggest that our approaches successfully balance the trade-off between speed and accuracy, offering practical advantages for real-world deployment scenarios.
5.6 Statistical analysis of model performance
This section summarizes the statistical analysis of the utilized models. Table 13 compares the performance of four utilized models on a classification task.

Table 13. Statistical performance comparison using 5-fold cross-validation (Mean ± Std).
From this table we make the following observations:
1. The YOLOv8-SA (ours) model is the best overall, achieving the highest scores in Accuracy (98.6%), Recall (93.9%), F1-Score (92.0%), and AUC (95.1%).
2. The CNN-PCA (ours) model has exceptional Precision (96.8%), meaning it is very good at avoiding false positives, and also has high Accuracy (93.3%).
3. VGG19 and MobileNetV2 are established models used for comparison. They perform well but are consistently outperformed by the two proposed models.
4. The values (e.g., 0.986) represent the score, and the ± value (e.g., ±0.003) shows the variation across multiple runs, indicating the result's stability. A smaller ± value means more consistent performance.
5.7 Proposed model explanation
5.7.1 Explanation of CNN-attention model
LIME is a popular explanation technique. The goal of using LIME is to generate the local explanation for each instance by highlighting the most significant regions. By using LIME on specific images, the model could provide an explanation image that highlights the most critical areas in the image, as shown in Figure 15. Figure 16 visual explanation of the YOLO-based detection model using Grad-CAM. The highlighted regions indicate the spatial areas that most strongly influenced the model's prediction, demonstrating the model's ability to focus on diagnostically relevant visual features and enhancing the interpretability and transparency of the proposed deep learning framework.

Figure 15. Image explanation using LIME: (a) neutral example, (b) happy example. Facial expression recognition challenge, https://www.kaggle.com/datasets/msambare/fer2013 under the Database Contents License (DbCL) v1.0).

Figure 16. Explanation using YOLO.
The explanation with LIME involves the following steps:
1. The image is preprocessed to ensure its compatibility, including resizing and normalization.
2. LIME applies perturbations by masking several regions, generating a diverse set of images.
3. The modified image is predicted with the model, generating the prediction for analysis. That selection is based on the image in terms of distance metrics.
4. LIME extracts the relevant features from images to specify the most significant features contributing to the predicted class.
5. LIME fits an interpretable model based on the extracted features. This local model approximates the original model's behavior.
5.7.2 Explanation of YOLO-self attention model
Grad-CAM (Gradient-weighted Class Activation Mapping) is a technique used with CNN modules to interpret and visualize the model's decisions. It highlights the most significant regions used for prediction (Selvaraju et al., 2017). Grad-CAM is an extension of CAM (Class Activation Mapping), commonly used to understand CNN behavior. The process involves:
• Passing the input image through the CNN to compute gradient scores for each class.
• Pooling gradients over spatial dimensions (width/height) to generate a feature map.
• Combining the feature map with the original image to highlight regions critical for the prediction.
5.7.3 Interoperability using attention weights
The spatial attention module enhances interpretability of our model through three key operations: (1) a 1 × 1 convolutional layer projects input features into query (Q), key (K), and value (V) spaces; (2) attention scores αij are computed via scaled dot-product between Q and K using ; (3) the output refines V through weighted aggregation using α. As shown in Table 14, mechanism automatically learns to emphasize emotion-salient facial regions - particularly the eyebrows (Action Unit AU4) for anger, cheek raising (AU6) for happy, and lip corner depressor (AU12) for sadness—while suppressing irrelevant background features. Region-specific attention weights were quantified by analyzing 1,000 test images from FER2013 with manual facial landmark annotations, with values normalized to [0,1] by dividing by the maximum attention weight per emotion category.

Table 14. Normalized attention weights across facial regions.
6 Integration on cloud
To validate the system's real-world performance, we deployed our model on three representative fog/edge platforms and measured:
• Inference Latency (per frame in ms).
• Power Consumption (in W).
• Memory Footprint (RAM/VRAM usage in GB).
• Bandwidth Utilization (for fog → cloud offloading in Mbps).
The proposed model on Raspberry Pi 5 with Coral TPU as a Low-cost edge the results show average latency of 34 ± 3.8 with FPS of 28.1 and Power 5.1 Second, we make Network Latency Analysis which measured end-to-end latency across different network conditions. From that table our target aligns with all setting, as we need it to be less than or equal 33 ms/frame. Choosing this threshold returns FDA guidance in medical systems Table 15 frame per time, as well as the real time applicability. Table 12 show Performance comparison between fog+cloud and cloud-only approaches , as well as Table 16 show comparison between Device Performance include [Jeston Orin, Raspberry Pi and Cloud (T4 GPU)]. To further contextualize the effectiveness of the proposed approaches, Table 17 presents a comprehensive comparison with existing emotion recognition models reported in the literature.

Table 15. Connection performance and real-time applicability.

Table 16. Device performance comparison.

Table 17. Comparison of different models in emotion recognition for healthcare applications.
7 Comparison with other work
In this section, we compare our proposed work and other literature regarding feature extraction techniques, the classification model utilized in the dataset, and the final prediction. Table 6 details the comparison. From that table, we can observe the following. (1) Among traditional ML models, SVM has been applied to various datasets, including CK+ and FER, in studies Eom and Choi (2019) and Gu et al. (2018). These studies utilized VGG16, CNN, and Alexnet as feature extraction steps. In a study Vaswani et al. (2023), authors used the RF model and NFD as feature extraction on the SFEW dataset. This yields a lower performance of 57.7%. Others in Chaudhari et al. (2021) suggest using SCALe invariant feature transform (SIFT) with CNN, leading to an acc of 91.82 on the CK+ dataset. Others utilized a probabilistic approach, as Santana and Colombini (2021) utilized a Gaussian model on JAFFE; it achieved a height accuracy of 95.6 when combined with a rapid feature extractor (Dual-tree wavelet transform). Deep learning models such as CNN demonstrate enhanced performance in Chefer et al. (2021). The authors utilized the FER2013 dataset and achieved a 94.12% accuracy. The same is true in Chen et al. (2020), where the authors used RNN and CNN for feature extraction and LSTM for classification. This assures the role of such a DL model in capturing the temporal dependencies. Our proposed models introduced two-person models. First, PCA integrated with CNN was applied in FER, achieving an accuracy of 94.69%. The second model in YOLO V8, with a self-attention mechanism, achieved an accuracy of 98.69%, highlighting the integration of self-attention and YOLO v8 in improving emotion recognition accuracy. Overall, the results demonstrate the superiority of our proposed model (YOLO8 with self-attention) in selecting the appropriate features.
8 Limitation and future work
While our work demonstrates strong performance in controlled settings, we intend to expand testing to more challenging real-world conditions. collecting datasets with various conditions as follows:
• collecting images in Natural occlusions (masks, glasses, hair).
• maintain different lighting variations (low-light, backlighting).
These datasets will help to ensure the generalization ability of the developed model.
9 Conclusion
Understanding human thoughts and mental states without direct questioning is paramount, and emotion recognition is vital in achieving this understanding. The advancements in DL have significantly improved emotion recognition from facial expressions. However, concerns remain about the reliability of these systems in real-world scenarios. This paper addresses these concerns by introducing a Real-Time Emotion Recognition System based on the Fog Computing Technique. The system leverages fog computing to ensure real-time constraints and reliable monitoring of emotion recognition. A lightweight CNN attention model is proposed to enhance the system's performance. This model has a more straightforward structure and incorporates attention mechanisms to improve accuracy. Additionally, dimension reduction techniques are applied to the data before training, focusing on the most relevant features for effective learning. The effectiveness of the proposed system is evaluated using a dataset of 35,888 images categorized into seven emotion classes. The developed model surpasses popular pre-trained models like VGG, ResNet, and MobileNet in accuracy, precision, recall, and AUC, achieving impressive scores of 0.986, 0.902, 0.941, and 0.952., respectively. Notably, the model exhibits a significantly faster processing time of 610 seconds than other pre-trained models. Additional datasets are tested to validate the model's superiority, consistently yielding promising performance results. These findings further confirm the efficiency and effectiveness of the developed model in real-time emotion recognition scenarios. This research advances emotion recognition systems by introducing a reliable and efficient approach based on fog computing and a lightweight CNN attention model. The proposed system demonstrates enhanced accuracy, faster processing time, and consistent performance across different datasets. These results highlight the potential and practicality of the developed model in real-world applications and pave the way for further advancements in emotion recognition technology.
Data availability statement
Publicly available datasets were analyzed in this study. This data can be found https://www.kaggle.com/datasets/msambare/fer2013%20: data are publicly available and cited in the manuscript.
Author contributions
NR: Conceptualization, Formal analysis, Investigation, Resources, Writing – original draft, Writing – review & editing. EA: Writing – review & editing, Investigation, Resources. EH: Methodology, Writing – original draft, Formal analysis, Software. KA: Validation, Funding acquisition, Writing – review & editing. HE: Software, Writing – original draft, Validation, Supervision. ZA: Writing – review & editing, Investigation, Methodology, Writing – original draft, Formal analysis.
Funding
The author(s) declare that financial support was received for the research and/or publication of this article. This study was supported via funding from Prince sattam bin Abdulaziz University project number (PSAU/2025/R/1447).
Conflict of interest
The authors declare that the research was conducted in the absence of any commercial or financial relationships that could be construed as a potential conflict of interest.
Generative AI statement
The author(s) declare that no Gen AI was used in the creation of this manuscript.
Any alternative text (alt text) provided alongside figures in this article has been generated by Frontiers with the support of artificial intelligence and reasonable efforts have been made to ensure accuracy, including review by the authors wherever possible. If you identify any issues, please contact us.
Publisher's note
All claims expressed in this article are solely those of the authors and do not necessarily represent those of their affiliated organizations, or those of the publisher, the editors and the reviewers. Any product that may be evaluated in this article, or claim that may be made by its manufacturer, is not guaranteed or endorsed by the publisher.
References
Ab Hamid, S., Mustapa, N., and Mustapha, M. (2022). An android application for facial expression recognition using deep learning. Appl. Mathem. Comput. Intell. 11, 505–520.
Aifanti, N., Papachristou, C., and Delopoulos, A. (2010). “The mug facial expression database,” in 11th International Workshop on Image Analysis for Multimedia Interactive Services (WIAMIS 2010), 1–4.
Alabdulhafith, M., Saleh, H., Elmannai, H., Ali, Z. H., El-Sappagh, S., Hu, J.-W., et al. (2023). A clinical decision support system for edge/cloud icu readmission model based on particle swarm optimization, ensemble machine learning, and explainable artificial intelligence. IEEE Access 11, 100604–100621. doi: 10.1109/ACCESS.2023.3312343
Alshazly, H., Linse, C., Barth, E., and Martinetz, T. (2020). Deep convolutional neural networks for unconstrained ear recognition. IEEE Access 8, 170295–170310. doi: 10.1109/ACCESS.2020.3024116
Alzubaidi, L., Zhang, J., Humaidi, A. J., Al-Dujaili, A., Duan, Y., Al-Shamma, O., et al. (2021). Review of deep learning: concepts, CNN architectures, challenges, applications, future directions. J. Big Data 8:53. doi: 10.1186/s40537-021-00444-8
Athar, A., Luiten, J., Hermans, A., Ramanan, D., and Leibe, B. (2022). Differentiable soft-masked attention. arXiv preprint arXiv:2206.00182.
Brahnam, S., Jain, L., Nanni, L., and Lumini, A. (2014). Local Binary Patterns: New Variants and Applications. Cham: Springer. doi: 10.1007/978-3-642-39289-4
Chaudhari, S., Mithal, V., Polatkan, G., and Ramanath, R. (2021). An attentive survey of attention models. ACM Trans. Intell. Syst. Technol. 1, 1–33. doi: 10.1145/3465055
Chefer, H., Gur, S., and Wolf, L. (2021). “Generic attention-model explainability for interpreting bi-modal and encoder-decoder transformers,” in Proceedings of the IEEE/CVF International Conference on Computer Vision, 397–406. doi: 10.1109/ICCV48922.2021.00045
Chen, B., Huang, Y., Xia, Q., and Zhang, Q. (2020). Nonlocal spatial attention module for image classification. J. Electr. Eng. Technol. 17:1729881420938927. doi: 10.1177/1729881420938927
Chen, J., Shan, S., He, C., Zhao, G., Pietik?inen, M., Chen, X., et al. (2010). Wld: a robust local image descriptor. IEEE Trans. Pattern Anal. Mach. Intell. 32, 1705–1720. doi: 10.1109/TPAMI.2009.155
Chiavaccini, L., Gupta, A., and Chiavaccini, G. (2024). From facial expressions to algorithms: a narrative review of animal pain recognition technologies. Front. Veter. Sci. 11:1436795. doi: 10.3389/fvets.2024.1436795
Chollet, F. (2017). “Xception: deep learning with depthwise separable convolutions,” in 2017 IEEE Conference on Computer Vision and Pattern Recognition (CVPR), 1800–1807. doi: 10.1109/CVPR.2017.195
Descovich, K., Wathan, J. W., Leach, M. C., Buchanan-Smith, H. M., Flecknell, P., Farningham, D., et al. (2017). Facial expression: an under-utilized tool for the assessment of welfare in mammals. ALTEX-Altern. Animal Exper. 34, 409–429. doi: 10.14573/altex.1607161
Ehret, G. (2018). “Characteristics of vocalization in adult mice,” in Handbook of Behavioral Neuroscience (Elsevier), 187–195. doi: 10.1016/B978-0-12-809600-0.00018-4
El-Rashidy, N., Tarek, Z., Elshewey, A. M., and Shams, M. Y. (2025). Multitask multilayer-prediction model for predicting mechanical ventilation and the associated mortality rate. Neural Comput. Applic. 37, 1321–1343. doi: 10.1007/s00521-024-10468-9
Elseddik, M., Mostafa, R. R., Elashry, A., El-Rashidy, N., El-Sappagh, S., Elgamal, S., et al. (2023). Predicting cts diagnosis and prognosis based on machine learning techniques. Diagnostics 13, 1–18. doi: 10.3390/diagnostics13030492
Eom, H., and Choi, H. (2019). Alpha-integration pooling for convolutional neural networks. arXiv preprint arXiv:1811.03436.
Gholamalinezhad, H., and Khosravi, H. (2020). Pooling methods in deep neural networks, a review. arXiv preprint arXiv:2009.07485.
Goeleven, E., Raedt, R. D., Leyman, L., and Verschuere, B. (2008). The Karolinska directed emotional faces: a validation study. Cogn. Emot. 22, 1094–1118. doi: 10.1080/02699930701626582
Goodfellow, I., Erhan, D., Carrier, P. L., Courville, A., Mirza, M., Hamner, B., et al. (2013). Challenges in representation learning: Facial expression recognition challenge. Available online at: https://www.kaggle.com/datasets/msambare/fer2013 (Accessed November 11, 2025).
Gu, J., Wang, Z., Kuen, J., Ma, L., Shahroudy, A., Shuai, B., et al. (2018). Recent advances in convolutional neural networks. Pattern Recognit. 77, 354–377. doi: 10.1016/j.patcog.2017.10.013
Gulcehre, C., Cho, K., Pascanu, R., and Bengio, Y. (2014). “Learned-norm pooling for deep feedforward and recurrent neural networks,” in Joint European Conference on Machine Learning and Knowledge Discovery in Databases (Berlin, Heidelberg: Springer Berlin Heidelberg), 530–546. doi: 10.1007/978-3-662-44848-9_34
Hakim, G. J. P., Simangunsong, G. A., Rangga, W. N., Jonathan, C. R., Muhammad, R. R., Endang, P. G., et al. (2024). Real-time facial emotion detection application with image processing based on convolutional neural network (CNN). Int. J. Electr. Eng. Math. Comput. Sci. 1, 27–36. doi: 10.62951/ijeemcs.v1i4.123
Hayat, M., Ahmad, N., Nasir, A., and Ahmad Tariq, Z. (2024). Hybrid deep learning EfficientNetV2 and vision transformer (EffNetV2-ViT) model for breast cancer histopathological image classification. IEEE Access 12, 184119–184131. doi: 10.1109/ACCESS.2024.3503413
Hu, J., Shen, L., Albanie, S., Sun, G., and Wu, E. (2019). “Squeeze-and-excitation networks,” in Proceedings of the IEEE Conference on Computer Vision and Pattern Recognition, 7132–7141. doi: 10.1109/CVPR.2018.00745
Huang, G., Liu, Z., Van Der Maaten, L., and Weinberger, K. Q. (2017). “Densely connected convolutional networks,” in Proceedings of the IEEE Conference on Computer Vision and Pattern Recognition, 4700–4708. doi: 10.1109/CVPR.2017.243
Informatik, F., Yere, Y., Frasconi, P., and Schmidhuber, J. (2003). “Gradient flow in recurrent nets: the difficulty of learning long-term dependencies,” in A Field Guide to Dynamical Recurrent Neural Networks.
Jabarin, R., Netser, S., and Wagner, S. (2022). Beyond the three-chamber test: toward a multimodal and objective assessment of social behavior in rodents. Mol. Autism 13:41. doi: 10.1186/s13229-022-00521-6
Johnson, C. P., and Myers, S. M. (2008). “Chapter 15 - autism spectrum disorders,” in Developmental-Behavioral Pediatrics, eds. M. L. Wolraich, D. D. Drotar, P. H. Dworkin, and E. C. Perrin (Mosby), 519–577. doi: 10.1016/B978-0-323-04025-9.50018-0
Kant, V., Panchal, S., and Mahajan, S. (2025). “Facial emotion recognition using CNNs: Implications for affective computing and surveillance,” in 2024 Second International Conference Computational and Characterization Techniques in Engineering & Sciences (IC3TES) (IEEE), 1–5. doi: 10.1109/IC3TES62412.2024.10877627
Kim, Y., Yoo, B., Kwak, Y., Choi, C., and Kim, J. (2017). Deep generative-contrastive networks for facial expression recognition. arXiv preprint arXiv:1703.07140.
Kommineni, J., Mandala, S., Sunar, M. S., and Chakravarthy, P. M. (2021). Accurate computing of facial expression recognition using a hybrid feature extraction technique. J. Supercomput. 77, 5019–5044. doi: 10.1007/s11227-020-03468-8
Liang, Y., Li, Q., and Long, F. (2023). “Global dilated attention and target focusing network for robust tracking,” in Proceedings of the AAAI Conference on Artificial Intelligence, 1549–1557. doi: 10.1609/aaai.v37i2.25241
Liu, C., Hirota, K., Ma, J., Jia, Z., and Dai, Y. (2021). Facial expression recognition using hybrid features of pixel and geometry. IEEE Access 9, 18876–18889. doi: 10.1109/ACCESS.2021.3054332
Liu, P., Han, S., Meng, Z., and Tong, Y. (2014). “Facial expression recognition via a boosted deep belief network,” in Proceedings of the IEEE Conference on Computer Vision and Pattern Recognition, 1805–1812. doi: 10.1109/CVPR.2014.233
LokeshNaik, S. K., Punitha, A., Vijayakarthik, P., Kiran, A., Dhangar, A. N., Reddy, B. J., et al. (2023). “Real time facial emotion recognition using deep learning and CNN,” in 2023 International Conference on Computer, Communication and Informatics (ICCCI), 41–45. doi: 10.1109/ICCCI56745.2023.10128259
Loog, M. (2006). “Conditional linear discriminant analysis,” in Proceedings of the International Conference on Pattern Recognition, 387–390. doi: 10.1109/ICPR.2006.402
Lord, C., Elsabbagh, M., Baird, G., and Veenstra-Vanderweele, J. (2018). Autism spectrum disorder. Lancet 392, 508–520. doi: 10.1016/S0140-6736(18)31129-2
Ma, J., and Yuan, Y. (2019). Dimension reduction of image deep feature using PCA. J. Visual Commun. Image Represent. 63:102578. doi: 10.1016/j.jvcir.2019.102578
Meghana, P. G., Khan, M. Y., Bharti, M., Mohanta, K., and Kanaiya, V. K. (2023). Facial emotion recognition using CNN. J. Adv. Zool. 44, 966–970. doi: 10.17762/jaz.v44iS6.2328
Nguyen, D. D., Gao, K., Wang, M., and Wei, G. W. (2020). Mathdl: mathematical deep learning for d3r grand challenge 4. J. Comput. Aided Molec. Design 34, 131–147. doi: 10.1007/s10822-019-00237-5
Novais, R., Cardoso, P. J. S., and Rodrigues, J. M. F. (2022). “Facial emotions classification supported in an ensemble strategy,” in Universal Access in Human-Computer Interaction. Novel Design Approaches and Technologies, eds. M. Antona, and C. Stephanidis (Cham: Springer International Publishing), 477–488. doi: 10.1007/978-3-031-05028-2_32
Oguine, O. C., Oguine, K. J., Bisallah, H. I., and Ofuani, D. (2022). Hybrid facial expression recognition (fer2013) model for real-time emotion classification and prediction. arXiv preprint arXiv:2206.09509.
Pantic, M., Valstar, M., Rademaker, R., and Maat, L. (2005). “Web-based database for facial expression analysis,” in 2005 IEEE International Conference on Multimedia and Expo, 5.
Pathar, R., Adivarekar, A., Mishra, A., and Deshmukh, A. (2019). “Human emotion recognition using convolutional neural network in real time,” in 2019 1st International Conference on Innovations in Information and Communication Technology (ICIICT), 1–7. doi: 10.1109/ICIICT1.2019.8741491
Saleh, H., El-Rashidy, N., Mostafa, S., AlMohimeed, A., El-Sappagh, S., and Ali, Z. H. (2025). Cloud based real-time multivariate multi-step prediction of systolic blood pressure and heart rate using temporal convolutional network and apache spark. J. Big Data 12:170. doi: 10.1186/s40537-025-01207-5
Saleh, M., Yong, A., Marbukhari, N., Yussoff, Y., Mohamed, N., Almisreb, A., et al. (2021). Facial expression recognition: a new dataset and a review of the literature. Turkish Online J. Qualit. Inquiry 12, 9804–9811.
Santana, A., and Colombini, E. (2021). Neural attention models in deep learning: survey and taxonomy. arXiv preprint arXiv:2112.05909.
Selvaraju, R. R., Cogswell, M., Das, A., Vedantam, R., Parikh, D., and Batra, D. (2017). “Grad-cam: visual explanations from deep networks via gradient-based localization,” in 2017 IEEE International Conference on Computer Vision (ICCV), 618–626. doi: 10.1109/ICCV.2017.74
Shahin, I., Nassif, A. B., and Hamsa, S. (2019). Emotion recognition using hybrid Gaussian mixture model and deep neural network. IEEE Access 7, 26777–26787. doi: 10.1109/ACCESS.2019.2901352
Shahzad, H. M., Bhatti, S. M., Jaffar, A., Akram, S., Alhajlah, M., and Mahmood, A. (2023). Hybrid facial emotion recognition using CNN-based features. Appl. Sci. 13:5572. doi: 10.3390/app13095572
Shanok, N. A., Jones, N. A., and Lucas, N. N. (2019). The nature of facial emotion recognition impairments in children on the autism spectrum. Child Psychiatry Hum. Dev. 50, 661–667. doi: 10.1007/s10578-019-00870-z
Silva, V., Soares, F., Esteves, J. S., Santos, C. P., and Pereira, A. P. (2021). Fostering emotion recognition in children with autism spectrum disorder. Multimodal Technol. Inter. 5:57. doi: 10.3390/mti5100057
Strobl, L. (2023). Average-hard attention transformers are constant-depth uniform threshold circuits. arXiv preprint arXiv:2308.03212.
Sudha, V., and Ganeshbabu, T. R. (2021). A convolutional neural network classifier vgg-19 architecture for lesion detection and grading in diabetic retinopathy based on deep learning. Comput. Mater. Continua 66, 827–842. doi: 10.32604/cmc.2020.012008
Sugiharto, H., and Mubarok, H. (2023). Rcmha: Relative convolutional multi-head attention for natural language modelling. arXiv preprint arXiv:2308.03429.
Sun, Y., Li, L., Zheng, L., Hu, J., Jiang, Y., and Yan, C. (2021). Image classification based on PCA of multi-view deep representation. J. Visual Commun. Image Represent. 62, 253–258. doi: 10.1016/j.jvcir.2019.05.016
Szegedy, C., Vanhoucke, V., Ioffe, S., Shlens, J., and Wojna, Z. (2016). “Rethinking the inception architecture for computer vision,” in 2016 IEEE Conference on Computer Vision and Pattern Recognition (CVPR), 2818–2826. doi: 10.1109/CVPR.2016.308
Talaat, F. M., Ali, Z. H., Mostafa, R. R., and El-Rashidy, N. (2024). Real-time facial emotion recognition model based on kernel autoencoder and convolutional neural network for autism children. Soft Comput. 28, 6695–6708. doi: 10.1007/s00500-023-09477-y
Vaswani, A., Shazeer, N., Parmar, N., Uszkoreit, J., Jones, L., Gomez, A. N., et al. (2023). “Attention is all you need,” in Advances in Neural Information Processing Systems, 30
Wang, X., Wang, X., and Ni, Y. (2018). Unsupervised domain adaptation for facial expression recognition using generative adversarial networks. Comput. Intell. Neurosci. 2018:7208794. doi: 10.1155/2018/7208794
Wang, Y., Shi, K., Lu, C., Liu, Y., Zhang, M., and Qu, H. (2023). “Spatial-temporal self-attention for asynchronous spiking neural networks,” in Proceedings of the IJCAI Conference, 3085–3093. doi: 10.24963/ijcai.2023/344
Wold, S., Esbensen, K., and Geladi, P. (1987). Principal component analysis. Chemometr. Intell. Labor. Syst. 2, 37–52. doi: 10.1016/0169-7439(87)80084-9
Yu, D., Bao, L., and Yin, B. (2024). Emotional contagion in rodents: a comprehensive exploration of mechanisms and multimodal perspectives. Behav. Proc. 216:105008. doi: 10.1016/j.beproc.2024.105008
Zeiler, M. D., and Fergus, R. (2013). Stochastic pooling for regularization of deep convolutional neural networks. arXiv:1301.3557v1.
Keywords: attention mechanism, convolutional neural network, dimension reduction, emotion recognition, fog computing, YOLO
Citation: Rashidy NE, Allogmani E, Hassan E, Alnowaiser K, Elmannai H and Ali ZH (2026) Toward real-time emotion recognition in fog computing-based systems: leveraging interpretable PCA_CNN, YOLO with self-attention mechanism. Front. Comput. Sci. 7:1714394. doi: 10.3389/fcomp.2025.1714394
Received: 27 September 2025; Revised: 19 November 2025; Accepted: 25 November 2025;
Published: 14 January 2026.
Edited by:
Xiaohao Cai, University of Southampton, United KingdomReviewed by:
Joshila Grace, Sathyabama University, IndiaTejashree Tejpal Moharekar, Shivaji University, India
Copyright © 2026 Rashidy, Allogmani, Hassan, Alnowaiser, Elmannai and Ali. This is an open-access article distributed under the terms of the Creative Commons Attribution License (CC BY). The use, distribution or reproduction in other forums is permitted, provided the original author(s) and the copyright owner(s) are credited and that the original publication in this journal is cited, in accordance with accepted academic practice. No use, distribution or reproduction is permitted which does not comply with these terms.
*Correspondence: Nora EL Rashidy, bm9yYS5hbHJhc2hpZHlAYWkua2ZzLmVkdS5lZw==