 Andrew P. Reimer
 Wei Dai3
 Nicholas K. Schiltz
- 1Frances Payne Bolton School of Nursing, Case Western Reserve University, Cleveland, OH, United States
- 2Critical Care Transport, Cleveland Clinic, Cleveland, OH, United States
- 3Department of Statistics, George Mason University, Fairfax, VA, United States
- 4Population and Quantitative Health Sciences, School of Medicine, Case Western Reserve University, Cleveland, OH, United States
Objective: To identify the factors that predict mortality post-transfer and develop a comprehensive mortality prediction model capable of supporting pre-transfer decision making.
Materials and methods: Electronic health record data from the Medical Transport Data Repository of a large health system hospital in Northeast Ohio that consists of a main campus and 11 affiliated medical centers. We retrospectively analyzed patient data from the referring hospital encounter prior to interhospital transfer. All patient data including diagnoses, laboratory results, medication, and medical and social history were analyzed to predict in-hospital mortality post-transfer. We employed a multi-method approach including logistic regression, gradient boosting, and multiple correspondence analysis to identify significant predictors of mortality as well as variables that are clinically useful to inform clinical decision support development. We identified all patients aged 21 and older that underwent critical care transfer in the health system between 2010 and 2017.
Results: We found that age, laboratory results (albumin, INR, platelets, BUN, leukocyte, hemoglobin, glucose), vital signs (temperature, respirations, pulse, systolic blood pressure, pulse oximetry), and ventilator usage are the most predictive variables of post-interhospital transfer mortality. Using structured data from the EHR we achieved the same performance as APACHE IV within our health system (0.85 vs. 0.85). Lastly, mode of transport alone was not a significant predictor for the general population in any of the outcome models.
Conclusions: Our findings provide a foundation for the development of decision support tools to guide transport referrals and identified the need for further inquiry to discern the role of mode of transport to enable future inclusion in decision support approaches. Further inquiry is needed to identify factors that differentiate patients not triaged as time-sensitive transfers but still require helicopter intervention to maintain or improve post-interhospital transfer morbidity and mortality.
1 Introduction
Rural hospital closures and health system consolidations have led to an increased reliance on interhospital transfer (IHT) for those patients requiring higher levels of care not present at their current location (1, 2). Approximately 1.6 million patients undergo IHT each year in the United States (3), with around 640,000 requiring critical care transfer by either ground or air (4). Interhospital transfers are generally categorized as time sensitive, and non-time sensitive. Time sensitive transfers include patients experiencing myocardial infarction, stroke, aortic syndromes, or trauma, and require rapid transfer usually by helicopter to a tertiary care center. Transfer for these patients has been shown to be a life-saving measure, with reductions in mortality for trauma (5–11) and myocardial infarction (12) patients, conflicting results for stroke patients (13, 14), and evidence of overuse for minimally injured trauma patients (15–19).
However, a large proportion (~70%) of IHT consist of non-time sensitive patients, often with multiple diagnoses and comorbidities (e.g., sepsis complicated by respiratory and renal failure), who are being transferred from one hospital to another. The limited research into IHT outcomes indicates that these patients experience up to 3 times higher mortality (20, 21) while also experiencing double the length of stay and twice the cost compared to non-transferred patients (3). Yet, many patients undergoing IHT without a time-sensitive condition continue to be transferred by helicopter. Helicopter transfer is expensive, costing 3–20 times more than ground transfer. Thus, discerning which IHT patients qualify as time-sensitive and require expensive helicopter transfer with a concomitant clinical benefit vs. those that require critical care transfer but can be transferred via less expensive ground critical care ambulance is necessary.
Several approaches have been developed to begin addressing the issue of IHT and allocation of transport resources. The first approach by a group in the Netherlands developed a tool that retrospectively assesses the quality of interhospital transfer. An expert panel developed a score for interhospital transport by a Mobile Intensive Care Unit entitled the QUality of Interhospital Transportation in the Euregion Meuse-Rhine (QUIT-EMR) score (22). The QUIT-EMR included monitoring and supportive treatment variables of the neurological, respiratory, and circulatory organ systems. This study demonstrated that the QUIT-EMR score validly identified clinical deterioration interventions' effectiveness during transport and thus may have the potential to identify at-risk patients before planned transfer and objectify clinical deterioration and the effectiveness of interventions during transfer.
A second approach was developed by a group in Canada to optimize flight planning for non-emergent air transfers to enable moving from an on demand model to an optimal use model (23). Prospective implementation of the optimized model resulted in decreased total flight hours, distance flown, and reduced total costs, demonstrating the utility of using a planned approach to non-urgent transfers to maximize resource use.
A third approach by a group in the United States developed the SafeNET tool—Safe Non-elective Emergent Transfers, that predicts expected mortality at the time of transfer based on a 14-variable model that bedside clinicians can complete prior to transfer (24). Currently, SafeNET is the only model that can be applied prospectively to aid the decision-making process of clinicians and families engaging in the decision to transfer.
The decision to transfer is complicated, and entails answering the primary questions of if , how, and when. If and when a patient should be moved can be straightforward, particularly in time-sensitive emergencies when the necessary care is not available at the current location. But even in time-sensitive scenarios—the if to transfer, depending on the patient's current health status and desire for further care, can be complicated. In most time-sensitive scenarios, patients are transferred via the quickest transport mode—the how, which is most often helicopter, can be ground ambulance in some situations if the time to destination is the same or faster. However, most transfer decisions are not straightforward, and many clinicians and most patients and families do not have an adequate understanding of the potential consequences of transfer decisions. Consequences of transferring include the potential to incur significant financial burden due to the cost of helicopter transfer and subsequent expenses for families who must also travel and incur additional costs for food and housing. Further, the how to transfer is also complicated because outside of time-sensitive emergencies or complex critically ill patients that are resource intensive such as extra corporal membrane oxygenation patients, there is limited evidence of the clinical benefit that helicopter transfer infers on improved morbidity and mortality. Therefore, the purpose of this study was to identify the factors that predict mortality post-transfer, including transport mode, and develop a comprehensive mortality prediction model capable of supporting pre-transfer decision making.
2 Materials and methods
2.1 Data sources
This is a retrospective cross-sectional study using existing electronic health records (EHR) from the Medical Transport Data Repository of a large health system hospital in Northeast Ohio that serves as a regional and national referral center, consisting of a main campus and 11 affiliated medical centers in the region. We developed the data repository that links all medical records across the entire encounter of care for a patient undergoing IHT. Each patient entry in the data repository contains the referring hospital encounter, the medical transport, and the receiving hospital encounter EHR data. Every patient referred for transfer to or from the health system hospitals is entered into the data repository. For each patient, all associated EHR records are identified, extracted, and normalized for secondary research purposes with the outcome of interest known (i.e., labeled data). More details can be found here on the data repository (25), associated data quality assessment (26), and data normalization procedures (27).
2.2 Study population
To ensure complete record availability, we included patients aged 21 and older that were transferred within the health system between 2010 and 2017. All patients undergoing critical care IHT by the health system critical care transport team, either by ground or air transport were included. The study was approved by the participating institutions IRBs (#14-1556 and #20180346).
2.3 Data analysis
The goal of this study is to develop a model that classifies patients using EHR data available at the time of transfer. We aim to generate a mortality risk score that will be employed within a clinical decision support system to inform the decision-making process during the decision to transfer between providers and patients and their family or surrogates. Therefore, the outcome of interest was in-hospital death categorized as a binary outcome. Due to the unbalanced nature of the data with an overall low incidence of death, similar to other comparable work (28), we combined those discharged to hospice with those that died in-hospital as both of these outcomes may represent futile IHT. All data employed in this analysis was structured EHR data and thus considered labeled data. Due to the high dimensionality and sparse nature of some of the included covariates, we employed a multi-step dimension reduction and multi-method approach to assess the influence of IHT on patient outcome. First, we employed random forest within each data subcategory for dimension reduction, then we employed logistic regression, gradient boosting, and multiple correspondence analysis to complete a comprehensive analysis of the influence of the variables of interest.
2.3.1 Variable reduction
We employed random forest (RF) to reduce the total number of variables across each category. The variable categories that were reduced via RF included medications, procedures, laboratory results and diagnosis codes. For example, the subcategory primary diagnosis contained over 2,700 unique diagnoses codes. Through bootstrapping, RF generates many individual classification trees by randomly selecting input variables during each tree building, improving overall prediction. RF then generates a list that ranks variable importance from high to low based on the Gini index value across all the individually developed trees (29). Employing RF enables filtering out the most important predictors for each sub-category. To select the final variables within each subcategory, we examined the variable importance plot to identify the fewest number of covariates most associated with the outcome while retaining over 90% of the data variation. We first screen out the variables which are collinear with other variables. If two or more variables have a 0.8 correlation coefficient, only one is kept for inclusion in the full model based on determination of clinical significance. The RF model criterion included split training/testing at 2:1 ratio, 5-fold cross validation, using grid search to find the optimal parameters in pursuit of accuracy, and a splitting based on Gini impurity criterion. A full description of identifying variables for inclusion in the final model development is provided here (30).
2.3.2 Physiologic data
To account for physiologic variability, we included the last set of vital signs prior to transfer as this represents the current physiologic state of the patient at the time of transfer. The most recent set of laboratory results prior to transfer were included in each modeling stage.
2.3.3 Demographics
Demographic data included age, biological sex, race, ethnicity, marital status, insurance type (i.e., Medicare, Medicaid, private and other), mode of transport (i.e., ambulance, helicopter), sending unit (i.e., emergency department, intensive care unit), and receiving unit (floor, intensive care unit, other). Social history variables such as smoking, and alcohol use were accounted for in the diagnosis codes subcategory history.
2.4 Machine learning algorithms
2.4.1 Logistic regression
Logistic regression is another sensible model for modeling data with a binary outcome. It provides model coefficients that are indicative of effect directions and sizes, which are not shown in some of the machine learning approaches such as the variable importance score in RF. Hence, the logistic regression results built on important variables from the RF are useful for large data. The logistic regression results provided a baseline to compare the influence of individual variables and triangulate results across the different modeling methods. We included the same variables contained in the gradient boosting model 4.
2.4.2 Gradient boosting
We also employed gradient boosting as an alternative model building method. Similar to RF, gradient boosting uses individual classification trees, but instead of averaging the results across many trees, boosting begins with a single weak model (i.e., tree), and combines it with other weak models until it generates a collectively strong model (31). To control for potential confounding we employed 3-terms matching on age, sex and transport mode resulting in a balanced sample of 2,024 patients. In an effort to build the most parsimonious model, we developed four nested models in a stepwise fashion to assess the individual contribution of each data category. Cross-validation based on a grid search is employed for the selection of hyperparameters needed in finding optimal model in each data category. Model accuracy and area under the receiver operating characteristic curve (AUROC) are used to assess model performance. Classification trees were the booster and logistic regression was used as the binary classification with 5-fold cross validation. Model 1 included only demographic and diagnosis data. Model 2 added lab results to model 1. Model 3 added vital signs to model 2. Model 4 trimmed variables identified via machine learning but deemed not clinically significant.
2.4.3 Multiple correspondence analysis
Most covariates in this dataset are categorical. Therefore, to complement the classification tree-based modeling methods and enable assessing the underlying pattern of relationships of the multiple categorical variables, we also employed multiple correspondence analysis (MCA) (32). The primary goal of employing MCA was to identify the influence of mode of transport on outcome, and particularly if mode of transport (i.e., helicopter, ambulance) was associated with the binary outcome of in-hospital death. All variables that were not categorical such as laboratory results and vital signs were recategorized as high/low/normal for inclusion in this analysis. Interpretation of MCA is based on proximity between points and is accomplished via a low-dimension map, with the proximity of different nominal variables identifying variables that appear together in the observations (32). We accomplished this via analyzing a visualization with concentric circles drawn around each mode of transport to indicate proximity and examining the distance between mode of transport and the clinical outcome of death or other.
2.5 Missingness
Due to the format of the data types for analysis, we included missing variables in the analysis as separate factors and dummy coded as “other” categorical indicator variables. For example, if we are unable to obtain a patient's medical history such as diabetes or hypertension, then each variable was coded as a separate dummy indicator as unknown and used in the analysis. This approach is useful as it enables including unknown factors in the modeling approaches, more closely aligning with clinical practice where unknown factors are common.
3 Results
3.1 Baseline characteristics
A total of 11,497 patients were included in the study sample. Total sample and subgroup demographics are presented in Table 1. Overall, in-hospital mortality or discharge to hospice for those undergoing critical care transfer was 32.9%. Patients who died were older, white, on Medicare, and more likely to be transferred from an emergency department.
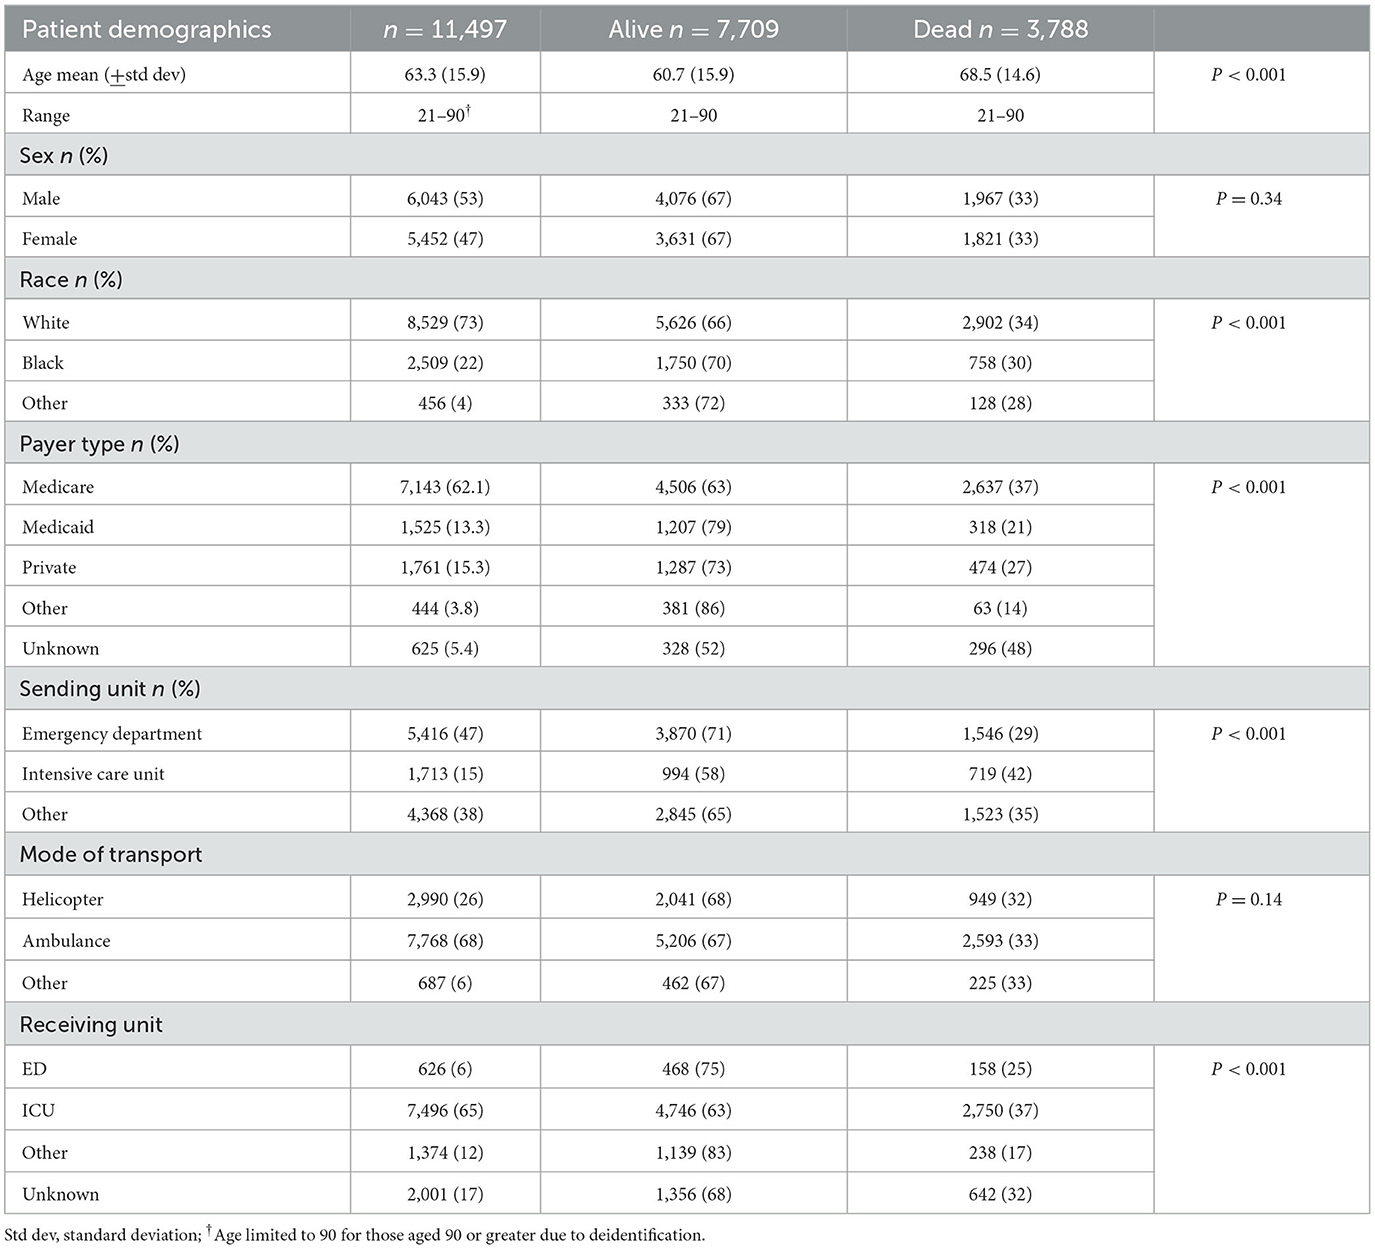
Table 1. Study sample characteristics.
3.2 Logistic regression results
The odds ratios and 95% confidence intervals are presented in Table 2. Of the 57 variables, 14 were statistically significant. Significant variables indicating lower odds of survival included: age (OR 0.95; 95% CI 0.94–0.97), being on a ventilator (OR 0.29; 95% CI 0.19–0.45), admission for cerebral hemorrhage (OR 0.37; 95% CI 0.17–0.79), problem list identification of dyspnea (OR 0.51; 95% CI 0.32–0.80), or encounter resulting in palliative care/end-of-life counseling (OR 0.17; 0.02–0.57). Alternatively, those being transferred from an emergency department (OR 1.54; 95% CI 1.02–2.34), on Medicare (OR 1.63; 95% CI 1.03–2.58), or with comorbid hypertension (OR 1.71; 95% CI 1.24–2.36) experienced increased odds of survival. The remaining significant indicators included vital signs: respirations, heart rate, systolic blood pressure, and laboratory values: albumin, international normalized ratio and platelets. Interestingly, mode of transport—or being transported by helicopter, was not associated with a significant increase in survival. Overall, the logistic regression model yielded an accuracy of 78.21.
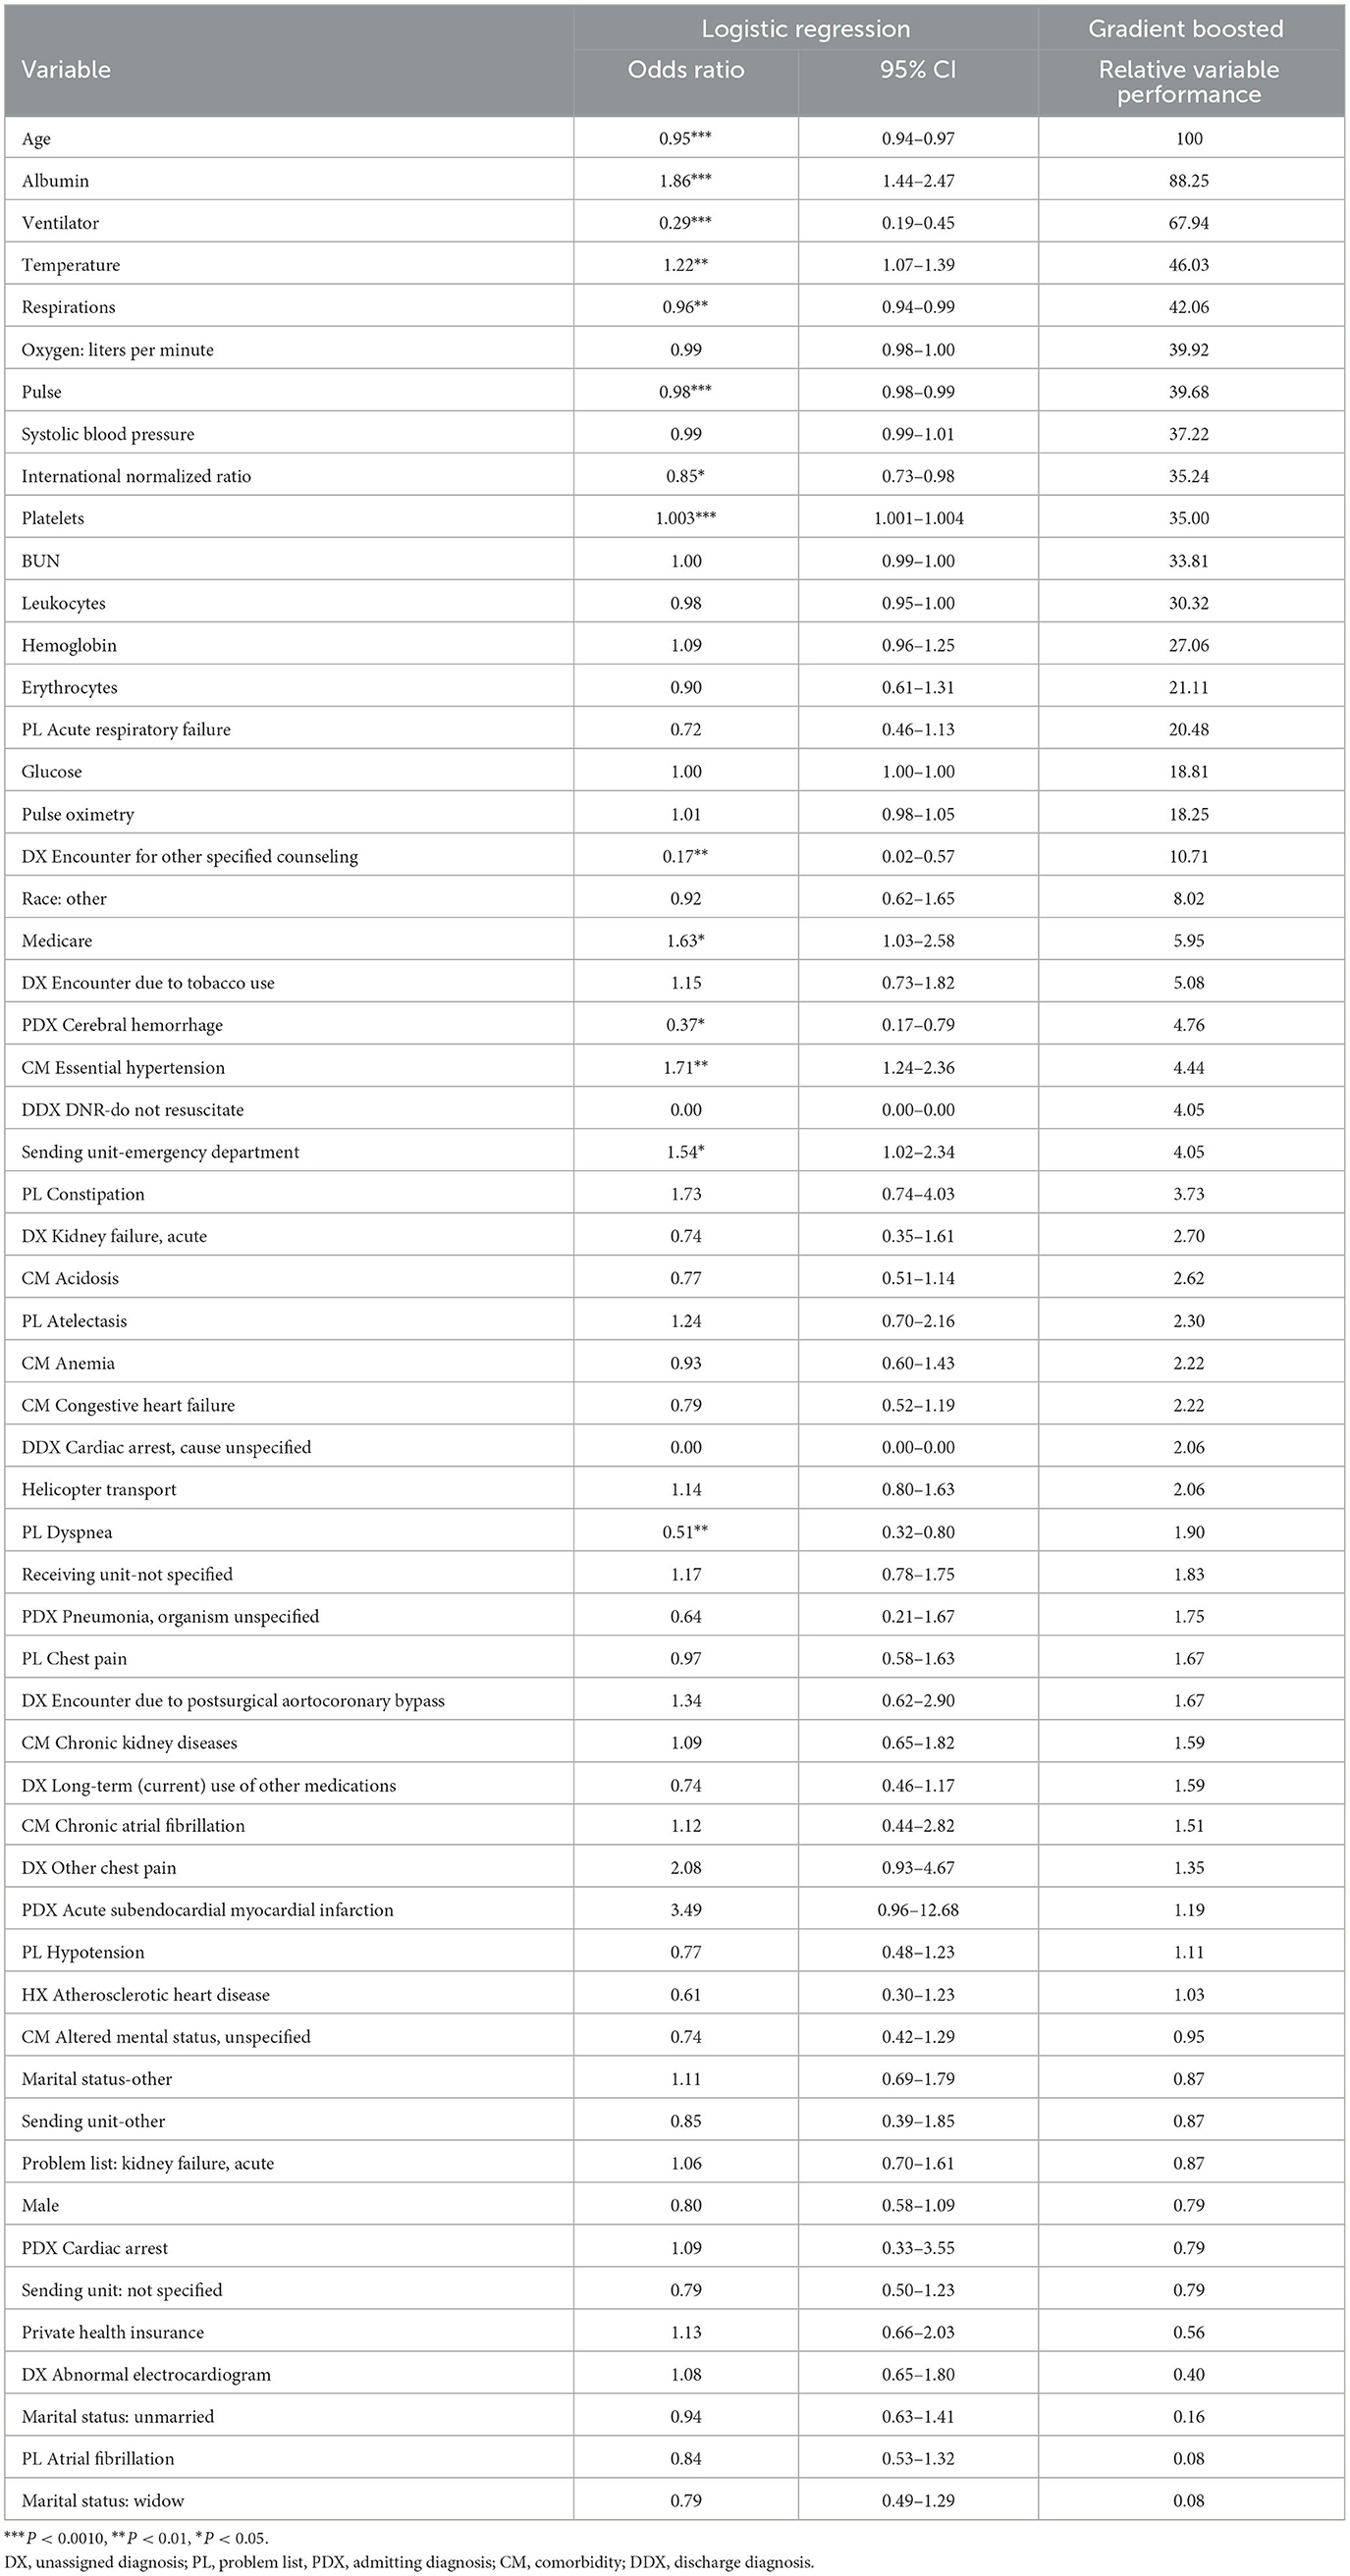
Table 2. Logistic regression odds ratios and random forest variable importance.
3.3 Gradient boosting results
The predictive performance results of each of the four gradient boosted models are shown in Table 3. Model 1 which only included demographic variables and diagnosis codes had moderate discrimination (AUC = 0.76). Model 2 which also included laboratory values improved accuracy and the AUC (AUC = 0.79). Model 3 performed the best (AUC = 0.87). Model 4 removed some variables deemed not to be clinically meaningful by experts and had only a slight drop in accuracy (78 vs. 79%) and AUC (0.85 vs. 0.87) compared to Model 3. Model 4 was therefore chosen as the final predictive model.
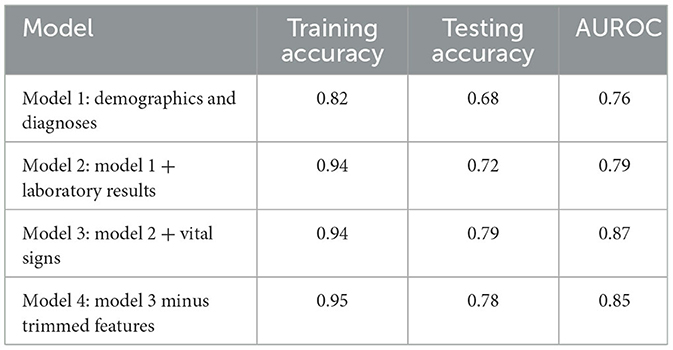
Table 3. Gradient boosting model performance results.
The variable importance from the gradient boosted Model 4 is presented alongside the logistic regression results in Table 2. The variables are presented in descending order of relative importance with 8 of the first 10 variables corresponding to statistically significant indicators in the logistic regression model. All of the statistically significant variables in logistic regression appear in the first 34 of 58 most important variables in the gradient boosted model. The gradient boosted model favored continuous variables more than logistic regression. Alternatively, gradient boosting identified several dichotomous indicators including problem list acute respiratory failure, encounter due to tobacco use and race categorized as other as more important whereas logistic regression yielded non-statistically significant results.
3.4 Multiple correspondence analysis results
Consistent with the other models, a majority of the variables clustered around the 0 point of each axis, indicating little to no correspondence with either outcome (Figure 1). The variables that most corresponded with survival include normal albumin, normal BUN, normal INR high, systolic blood pressure, subendocardial myocardial infarction, no oxygen administration, hypertension, normal respirations, and low pulse. Alternatively, the variables that correlated with death included being on a ventilator, high pulse rate, high or low respiratory rate, low systolic blood pressure, heart failure, low hemoglobin, low red blood cells, high BUN, high INR, and low albumin. Neither helicopter nor ground transport highly corresponded with either outcome. Straight line analysis reveals that helicopter is closer to the clinical outcome other and farther away from death, while ground is slightly closer to death than other clinical outcome.
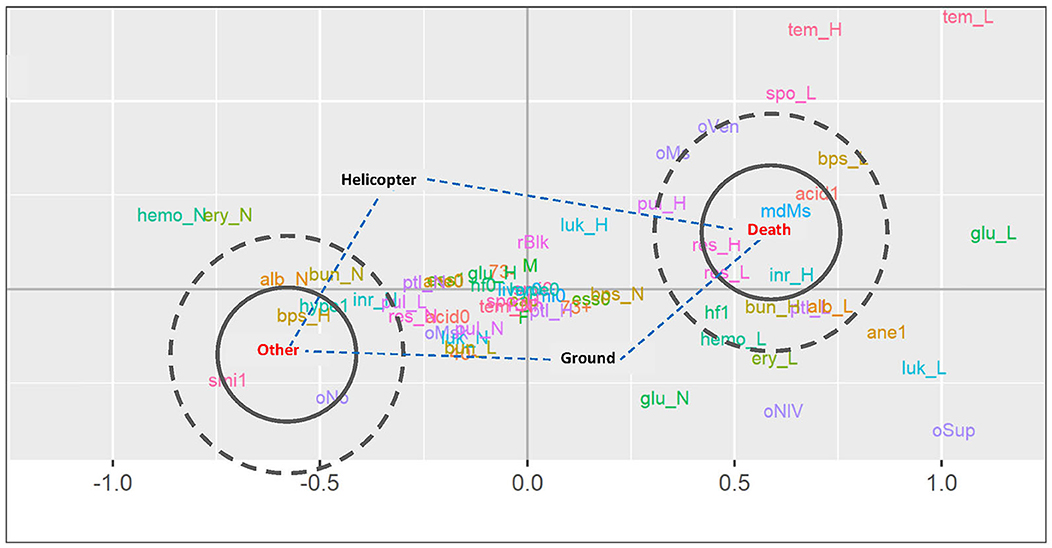
Figure 1. Multiple correspondence analysis 2-dimensional visualization.
4 Discussion
The purpose of this study was to identify the factors that predict mortality post-transfer and develop a comprehensive mortality prediction model capable of supporting pre-transfer decision making. We employed a multi-method approach and identified across all modeling approaches the most important variables for inclusion in prognostic modeling for post-IHT mortality. Our models' performance matches or surpasses the performance of APACHE IV (33) within our health system (0.85 vs. 0.85). A significant advantage of our approach was using only structured data in our models that are readily available at the time the decision to transfer is being made. This is important for ease of use and facilitates the ability to automate the model in future clinical decision support applications that can be embedded within the EHR. The final list of most important variables provides a starting point for our team, as well as others, to begin developing data driven prognostic models. A majority of the variables added minimal value and can be removed from consideration in future model building efforts.
The variables with highest importance in our model align closely with the those included in the final SafeNet model. Specifically, age, BUN, albumin, blood glucose, mechanical ventilation, temperature, platelets, systolic blood pressure, and heart rate (24). In combination, these results provide evidence of generalizability of using these variables in other settings.
Another significant finding is the insignificance of the mode of transport across all models. Mode of transport was not significant in the logistic regression model, appeared in the final variables before cutoff in the general random forest model, and not included in the final XGBoost model. MCA analysis also revealed that mode of transport did not significantly correspond to outcome post-transfer. This finding is replicated in other studies that reported an absence of an association between mortality and mode of transport, timing or priority of transport, and total time spent in transport (34–36). Further, when controlling for transport expertise, despite having faster transport times, air medical transport (AMT) offered no overall mortality benefit in the general population (37). Considering that a majority of interfacility transfers are not time sensitive (38), further work is necessary to identify which interfacility transfers require helicopter transfer. The level of critical care experience and practice capability of critical care transport teams has evolved to a high level of care, yet the process for IHT and knowledge of the capability and level of care provided during transport have lagged current practice. Potential benefits of AMT not yet investigated include assessing the impact of the arrival of an advanced care team with critical care experience particularly in low resource settings such as critical access hospitals or free-standing emergency departments in rural settings. Another potential is the transport and delivery of treatments not available in the current setting such as surfactant or Tenecteplase, bringing equipment such as high flow nasal cannula, or proficiency at managing devices that may be low volume use in certain settings such as Impella? or intra-aortic balloon pumps.
Our results provide further evidence of the role of timely transfer in outcomes, with higher odds of survival identified for those being transferred from an emergency department. This survival benefit can be due to several factors, the primary being those patients experiencing a time-sensitive emergency such as heart attack or stroke that benefit from rapid transfer and intervention at the tertiary care center. Another study identified that length of stay at the referring hospital before transfer is an independent predictor of increased ICU and hospital mortality post-transfer (39). In combination, these findings support the need to identify patients that require transfer and transfer those patients earlier in their healthcare encounter. For example, patients presenting to their local community hospital may not be severely ill upon initial presentation and meet criteria for admission to their ICU. However, when applying this or another prognostic model such as SafeNet, because the patient has conditions x, y, and/or z, they are identified as a transfer candidate that will benefit from earlier transfer to higher level care from the emergency department. Another potential benefit of early identification and transfer is the ability to transfer the patient by ground instead of air because the patient is not in a time-sensitive or critical physiologic state, thus reducing transfer burden on AMT and maintaining the resource for time-sensitive illness or injuries.
There were several limitations to this work. First, we used data from only one health system that may yield a selection bias in how the health system selects and then transfers patients that can be different from other health system transfer protocols and processes. Second, our health system critical care transport team transfers a larger proportion of patients by ground, whereas other health systems transport the same number or more patients by air. Further, a natural randomization of assignment to mode of transport exists when weather, location of the referring hospital—proximity to the receiving hospital necessitating faster transport times via ground, the lack of a helipad precluding helicopter transfer, current congestion or poor road conditions, or lack of ground transport resources, results in patients not being transferred by the initially triaged mode of transport. Therefore, a potential explanation of the non-significant impact of mode of transport on mortality could be due to this natural randomization that warrants further investigation of which we have planned. Lastly, we only controlled for a small number of demographics via 3-terms matching, thus there is potential for some unmeasured confounding. However, we did match patients by mode of transport, thus accounting for a known significant contributor to differences in outcome.
The results of this study provide several implications to guide future work. First, further work is needed to discern the intersection between the level of care provided and mode of transport. Currently, AMT is considered to deliver the highest level of care to the patient in the shortest period of time. However, it is not clear whether the quick arrival of high-level care and/or faster transfer to higher level care influences post-transfer outcome. Further, when considering time, there is a need to discern the unit of time that applies to non-time-sensitive conditions to identify which patients need to be transferred within x minutes or y hours. In addition, there is also a need to control for level of care provided prior to and during transfer, and the subsequent influence on patient outcomes post-transfer. Investigating level of care provide to the patient prior to and during transfer will require multi-site, multi-program studies that include differing team configurations to untangle the influence of time, and level of care that includes controlling for team configuration (e.g., physician, nurse practitioner, nurse, paramedic). Second, there is a need to develop new phenotypes or categories of patients requiring transfer that move beyond the time-sensitive, not time-sensitive considerations most commonly applied in current research efforts. New categories should identify both the time sensitivity, and level of care required to maintain or improve patients' clinical trajectory. Often, when a critically ill patient who requires the highest level of care is identified for transfer, they are defaulted to AMT, when in fact that transfer could be accomplished with the critical care team by ground, as the level of care during transfer is the main influence on post-transfer outcome, not how quickly the transfer is conducted. Lastly, future prognostic modeling efforts should focus on identifying patients early in the healthcare encounter that are at risk of becoming seriously ill at their current location of care. Identifying those patients for early transfer to higher levels of care can enable using lower levels of transport such as ambulances staffed with a paramedic, potentially avoiding a future transfer via AMT and critical care team, saving financial and transport resources for those patients requiring them.
We employed machine learning to identify which variables predict post-transfer mortality that resulted in prognostic models that performed the same or better than industry benchmarks. We found that age, laboratory results (albumin, INR, platelets, BUN, leukocyte, hemoglobin, glucose), vital signs (temperature, respirations, pulse, systolic blood pressure, pulse oximetry), and ventilator usage are the most predictive variables of post-interhospital transfer mortality. The benefit of our approach is that the aforementioned variables included in the final model are readily available in most EHRs and because we only used structured data, can be easily abstracted and automated into clinical decision support that does not require manual involvement. Additionally, our work sheds important insight on the lack of influence of mode of transport on patient outcomes post-IHT, highlighting the need for further investigation to identify the factors that differentiate patients not triaged as time-sensitive transfers but still require helicopter intervention to maintain or improve post-IHT morbidity and mortality. In combination, these findings provide a foundation for the development of decision support tools to guide transport referrals and identified the need for further inquiry to discern the role of mode of transport to enable future inclusion in decision support approaches.
Data availability statement
The data analyzed in this study is subject to the following licenses/restrictions: The data that support the findings of this study are available from the corresponding author, AR upon reasonable request. Requests to access these datasets should be directed to AR YXhyNjJAY3dydS5lZHU=.
Ethics statement
The studies involving humans were approved by Case Western Reserve University and Cleveland Clinic. The studies were conducted in accordance with the local legislation and institutional requirements. Written informed consent for participation was not required from the participants or the participants' legal guardians/next of kin in accordance with the national legislation and institutional requirements.
Author contributions
AR: Conceptualization, Data curation, Formal analysis, Methodology, Writing—original draft, Funding acquisition, Project administration, Writing—review & editing. WD: Conceptualization, Data curation, Formal analysis, Methodology, Writing—original draft, Writing—review & editing. NS: Conceptualization, Data curation, Formal analysis, Methodology, Writing—original draft, Writing—review & editing. JS: Conceptualization, Data curation, Formal analysis, Methodology, Writing—original draft, Writing—review & editing. SK: Conceptualization, Data curation, Formal analysis, Methodology, Writing—original draft, Writing—review & editing.
Funding
The author(s) declare financial support was received for the research, authorship, and/or publication of this article. This research was supported by the National Institute of Nursing Research, National Institutes of Health, through Grant R15NR017792.
Conflict of interest
The authors declare that the research was conducted in the absence of any commercial or financial relationships that could be construed as a potential conflict of interest.
Publisher's note
All claims expressed in this article are solely those of the authors and do not necessarily represent those of their affiliated organizations, or those of the publisher, the editors and the reviewers. Any product that may be evaluated in this article, or claim that may be made by its manufacturer, is not guaranteed or endorsed by the publisher.
Author disclaimer
The content is solely the responsibility of the authors and does not necessarily represent the official views of the NIH.
References
1. Cutler DM, Scott Morton F. Hospitals, market share, and consolidation. JAMA. (2013) 310:1964–70. doi: 10.1001/jama.2013.281675
2. Henke RM, Fingar KR, Jiang HJ, Liang L, Gibson TB. Access to obstetric, behavioral health, and surgical inpatient services after hospital mergers in rural areas. Health Aff. (2021) 40:1627–36. doi: 10.1377/hlthaff.2021.00160
3. Reimer AP, Schiltz N, Koroukian SM, Madigan E. National incidence of medical transfer: patient characteristics and regional variation. J Health Hum Serv Adm. (2015) 38:509–28. doi: 10.1016/j.ijmedinf.2016.03.006
4. Reimer AP, Hobensack M. Establishing transport statistics: results from the medevac transport statistics survey. Air Med J. (2019) 38:174–7. doi: 10.1016/j.amj.2019.03.008
5. Galvagno Jr SM, Haut ER, Zafar SN. Association between helicopter vs ground emergency medical services and survival for adults with major trauma. JAMA. (2012) 307:1602–10. doi: 10.1002/14651858.CD009228
6. Den Hartog D, Romeo J, Ringburg AN, Verhofstad MH, Van Lieshout EM. Survival benefit of physician-staffed Helicopter Emergency Medical Services (HEMS) assistance for severely injured patients. Injury. (2015) 46:1281–6. doi: 10.1016/j.injury.2015.04.013
7. Missios S, Bekelis K. Transport mode to level I and II trauma centers and survival of pediatric patients with traumatic brain injury. J Neurotrauma. (2014) 31:1321–8. doi: 10.1089/neu.2014.3325
8. Abe T, Takahashi O, Saitoh D, Tokuda Y. Association between helicopter with physician versus ground emergency medical services and survival of adults with major trauma in Japan. Crit Care. (2014) 18:R146. doi: 10.1186/cc13981
9. Hesselfeldt R, Steinmetz J, Jans H, Jacobsson M-LB, Andersen DL, Buggeskov K, et al. Impact of a physician-staffed helicopter on a regional trauma system: a prospective, controlled, observational study. Acta Anaesthesiol Scand. (2013) 57:660–8. doi: 10.1111/aas.12052
10. Thomas SH, Harrison TH, Buras WR, Ahmed W, Cheema F, Wedel SK. Helicopter transport and blunt trauma mortality: a multicenter trial. J Trauma. (2002) 52:136–45. doi: 10.1097/00005373-200201000-00023
11. Tsuchiya A, Tsutsumi Y, Yasunaga H. Outcomes after helicopter versus ground emergency medical services for major trauma–propensity score and instrumental variable analyses: a retrospective nationwide cohort study. Scand J Trauma Resusc Emerg Med. (2016) 24:140. doi: 10.1186/s13049-016-0335-z
12. Ranasinghe I, Barzi F, Brieger D, Gallagher M. Long-term mortality following interhospital transfer for acute myocardial infarction. Heart. (2015) 101:1032–40. doi: 10.1136/heartjnl-2014-306966
13. Sheth KN, Smith EE, Grau-Sepulveda MV, Kleindorfer D, Fonarow GC, Schwamm LH. Drip and ship thrombolytic therapy for acute ischemic stroke: use, temporal trends, and outcomes. Stroke. (2015) 46:732–9. doi: 10.1161/STROKEAHA.114.007506
14. Olson MD, Rabinstein AA. Does helicopter emergency medical service transfer offer benefit to patients with stroke? Stroke. (2012) 43:878–80. doi: 10.1161/STROKEAHA.111.640987
15. Bulger EM, Guffey D, Guyette FX, MacDonald RD, Brasel K, Kerby JD, et al. Impact of prehospital mode of transport after severe injury: a multicenter evaluation from the resuscitation outcomes consortium. J Trauma Acute Care Surgery. (2012) 72:567–73. doi: 10.1097/TA.0b013e31824baddf
16. Smith HL, Sidwell RA. Trauma patients over-triaged to helicopter transport in an established Midwestern state trauma system. J Rural Health. (2013) 29:132–9. doi: 10.1111/j.1748-0361.2012.00419.x
17. Vercruysse GA, Friese RS, Khalil M, Ibrahim-Zada I, Zangbar B, Hashmi A, et al. Overuse of helicopter transport in the minimally injured: a health care system problem that should be corrected. J Trauma Acute Care Surg. (2015) 78:510–5. doi: 10.1097/TA.0000000000000553
18. Horwood CR, Ricci K, Sobol CG, Evans D, Eiferman D. Stop flying the patients! evaluation of the overutilization of helicopter transport of trauma patients. J Surg Res Dec. (2020) 256:290–4. doi: 10.1016/j.jss.2020.06.033
19. Follette C, Halimeh B, Chaparro A, Shi A, Winfield R. Futile trauma transfers: an infrequent but costly component of regionalized trauma care. J Trauma Acute Care Surg. (2021) 91:72–6. doi: 10.1097/TA.0000000000003139
20. Hill AD, Vingilis E, Martin CM, Hartford K, Speechley KN. Interhospital transfer of critically ill patients: demographic and outcomes comparison with nontransferred intensive care unit patients. J Crit Care Dec. (2007) 22:290–5. doi: 10.1016/j.jcrc.2007.06.002
21. Rosenberg AL, Hofer TP, Strachan C, Watts CM, Hayward RA. Accepting critically ill transfer patients: adverse effect on a referral center's outcome and benchmark measures. Ann Intern Med. (2003) 138:882–90. doi: 10.7326/0003-4819-138-11-200306030-00009
22. Strauch U, Florack M, Jansen J, van Bussel BCT, Beckers SK, Habers J, et al. The Quality of Interhospital Transportation in the Euregion Meuse-Rhine (QUIT-EMR) score: a cross-validation study. BMJ Open. (2021) 11:e051100. doi: 10.1136/bmjopen-2021-051100
23. Macdonald RD, Ahghari M, Walker L, Carnes TA, Henderson SG, Shmoys DB, et al. A novel application to optimize utilization for nonurgent air transfers. Air Med J. (2014) 33:34–9. doi: 10.1016/j.amj.2013.09.004
24. Altieri Dunn SC, Bellon JE, Bilderback A, Borrebach JD, Hodges JC, Wisniewski MK, et al. SafeNET: initial development and validation of a real-time tool for predicting mortality risk at the time of hospital transfer to a higher level of care. PLoS ONE. (2021) 16:e0246669. doi: 10.1371/journal.pone.0246669
25. Reimer AP, Madigan E. Developing a fully integrated medical transport record to support comparative effectiveness research for patients undergoing medical transport. EGEMS. (2013) 1:1024. doi: 10.13063/2327-9214.1024
26. Reimer AP, Milinovich A, Madigan E. Data quality assessment in a longitudinal data repository. Int J Med Informat. (2016) 90:40–7.
27. Reimer AP, Milinovich A. Using UMLS for electronic health data standardization and database design. J Am Med Inform Assoc. (2020) 27:1520–8. doi: 10.1093/jamia/ocaa176
28. Major VJ, Jethani N, Aphinyanaphongs Y. Estimating real-world performance of a predictive model: a case-study in predicting mortality. JAMIA Open. (2020) 3:243–51. doi: 10.1093/jamiaopen/ooaa008
29. Hastie T, Tibshirani R, Friedman J. The Elements of Statistical Learning: Data Mining, Inference and Prediction, 2nd edn. New York, NY: Springer-Verlang. (2009).
30. Reimer AP Dai W, Smith B, Schiltz NK, Sun J, Koroukian SM. Subcategorizing EHR diagnosis codes to improve clinical application of machine learning models. Int J Med Inform. (2021) 156:104588. doi: 10.1016/j.ijmedinf.2021.104588
31. Mitchell R. Gradient Boosting, Decision Trees and XGBoost with CUDA. NVIDIA Developer. Available online at: https://developer.nvidia.com/blog/gradient-boosting-decision-trees-xgboost-cuda/ (accessed March 31, 2022).
32. Abdi H, Valentin D. Multiple correspondence analysis. In:Salkind N, editor. Encyclopedia of Measurement and Statistics. Thousand Oaks, CA: Sage (2007).
33. Reimer AP, Dalton JE. Predictive accuracy of medical transport information for in-hospital mortality. J Crit Care. (2018) 44:238–42. doi: 10.1016/j.jcrc.2017.11.020
34. Wilcox SR, Richards JB, Genthon A, Saia MS, Waden H, Gates JD, et al. Mortality and resource utilization after critical care transport of patients with hypoxemic respiratory failure. J Intensive Care Med. (2018) 33:182–8. doi: 10.1177/0885066615623202
35. Arthur KR, Kelz RR, Mills AM, Reinke CE, Robertson MP, Sims CA, et al. Interhospital transfer: an independent risk factor for mortality in the surgical intensive care unit. Am Surg. (2013) 79:909–13. doi: 10.1177/000313481307900929
36. Sundbom MF, Sandberg J, Johansson G, Brandstrom H, Nystrom H, Haney M. Total mission time and mortality in a regional interhospital critical care transport system: a retrospective observational study. Air Med J. (2021) 40:404–9. doi: 10.1016/j.amj.2021.08.005
37. Borst GM, Davies SW, Waibel BH, Leonard KL, Rinehart SM, Newell MA, et al. When birds can't fly: an analysis of interfacility ground transport using advanced life support when helicopter emergency medical service is unavailable. J Trauma Acute Care Surg. (2014) 77:331–6. doi: 10.1097/TA.0000000000000295
38. Meuli L, Zimmermann A, Menges AL, Tissi M, Becker S, Albrecht R, et al. Helicopter emergency medical service for time critical interfacility transfers of patients with cardiovascular emergencies. Scand J Trauma Resusc Emerg Med. (2021) 29:168. doi: 10.1186/s13049-021-00981-4
Keywords: electronic health records, emergency services, emergency department, transportation of patients, machine learning, emergency helicopter, helicopter ambulance
Citation: Reimer AP, Dai W, Schiltz NK, Sun J and Koroukian SM (2024) Patient factors associated with survival after critical care interhospital transfer. Front. Disaster Emerg. Med. 1:1339798. doi: 10.3389/femer.2023.1339798
Received: 16 November 2023; Accepted: 19 December 2023;
Published: 08 January 2024.
Edited by:
Muhammad Waseem, Lincoln Medical Center, United StatesReviewed by:
Samad Shams Vahdati, Tabriz University of Medical Sciences, IranAngela Cornelius, Office of the Medical Director Metropolitan Area EMS Authority, United States
Copyright © 2024 Reimer, Dai, Schiltz, Sun and Koroukian. This is an open-access article distributed under the terms of the Creative Commons Attribution License (CC BY). The use, distribution or reproduction in other forums is permitted, provided the original author(s) and the copyright owner(s) are credited and that the original publication in this journal is cited, in accordance with accepted academic practice. No use, distribution or reproduction is permitted which does not comply with these terms.
*Correspondence: Andrew P. Reimer, YXhyNjJAY3dydS5lZHU=