 Ayman M. AbuMustafa
- Department of Health Research, Human Resources Development, Ministry of Health, Gaza, Palestine
Background: There are limited data on the prevalence and risk factors for diabetic retinopathy (DR) in the Gaza Strip.
Objective: To assesses clinical and biochemical associated with DR in males with type 2 diabetes mellitus (T2DM) in the Gaza Strip.
Methods: One hundred and fifty males with T2DM from the Gaza Strip underwent a questionnaire interview, serum biochemical analysis, and assessment of their previous urine and blood results.
Results: The prevalence of DR was 24.7%. The duration of diabetes and prevalence of neuropathy, nephropathy, cardiovascular disease, and recurrent infections were significantly higher among patients with DR compared with those without DR (p < 0.05). Serum urea, creatinine, glucose, cholesterol, and low-density lipoprotein cholesterol were significantly elevated, whilst eGFR and high-density lipoprotein cholesterol were significantly lower in patients with DR compared with patients without DR (p < 0.05). Urinary albumin concentration and albumin creatinine ratio (ACR) was higher in patients with DR. ACR correlated significantly with the duration of T2DM (r = 0.311, p < 0.001), glucose (r = 0.479, p < 0.001), urea (r = 0.337, p < 0.001), creatinine (r = 0.275, p = 0.001), and GFR (r = −0.275, p < 0.001).
Conclusion: These data show a high prevalence of DR in an unselected cohort of patients with T2DM and relationships to modifiable risk factors in Gaza.
Introduction
The main form of diabetes mellitus is type 2 diabetes (T2DM) and affects more than 90% of cases (1). Type 2 diabetes is characterized by insulin resistance and eventually inadequate insulin production, leading to hyperglycemia (2). Chronic hyperglycemia is associated with long-term microvascular and macrovascular complications (3). Retinopathy, nephropathy, and neuropathy are common microvascular complications of T2DM (4, 5). Optimal control of blood pressure with an ACE inhibitor for microalbuminuria and laser photocoagulation for retinopathy can delay end stage renal failure and blindness, respectively (6). Retinopathy is characterized by damage to the blood vessels and neurones in the retina (7) and has been shown to be related to a longer duration of diabetes and hyperglycemia (8). Initially, there may be minimal alterations in vision, but as the condition progresses color vision may become impaired and eventually there may be total loss of vision (9). Whilst diabetic retinopathy (DR) is the most common cause of vision loss in people with diabetes mellitus; other causes, including glaucoma, age-related macular degeneration, and cataract must be assessed for (10).
Diabetic retinopathy can be diagnosed during a dilated retinal exam by an ophthalmologist or optometrist (11), but additional assessment can be undertaken to identify other pathology affecting vision (12, 13). The prevalence of DR varies in different countries and likely reflects different populations and control of risk factors for DR (14, 15). Early diagnosis and optimal control of risk factors can limit progression of DR (16). There are limited data on DR in the Gaza Strip with a previous study showing a relatively high prevalence of visual impairment and blindness and diabetes (17). A previous study has shown a high prevalence of DR affecting 27% of patients with T2DM in the Gaza Strip (18). Further data on the disease are lacking and restricted to annual reports emerging from the Palestinian Ministry of Health. Patients with T2DM in Gaza hospitals and clinics undergo rudimentary assessment of hyperglycemia with no formal assessment of complications, particularly DR. This study identifies the prevalence and modifiable risk factors for DR in the Gaza Strip.
Materials and Methods
Study Design and Study Population
The present study was a cross sectional study of 150 T2DM males (40–60 years old) based on current World Health Organization diagnostic criteria for diabetes (19). The patients were randomly selected from each of the five diabetes clinics in all the Governorates of the Gaza Strip: North 30 (20.0%), Gaza 50 (33.3%), Mid-zone 22 (14.7%), Khan Yunis 30 (20.0%), and Rafah 18 (12.0%). Patients with a urinary tract infection were excluded.
Questionnaire Interview
Each patient was interviewed with a questionnaire on T2DM from the Palestinian Ministry of Health with some modifications (20). Most questions were the no/yes type, which offer a dichotomous choice (21). A questionnaire was piloted with 10 patients not included in the population sample, and modified as necessary. The questionnaire included questions related to diet, family history of T2DM, age, and smoking.
Patients’ Records
Clinical data including duration of diabetes and diagnosed diabetic complications were obtained from the patients’ records. The body weight and height of each individual dressed in light clothing without shoes were measured using a carefully calibrated balance (Detecto, CAP-180 Kg, USA) for weight and vertical measuring rod for height and the BMI was calculated as Kilogram (kg) body mass/height in meter squared (22).
Urine and Blood Sampling and Processing
Fasting blood samples (about 8 ml each) and random urine samples were collected and centrifuged at 4,000 rpm/10 min using a Rotina 46 Hettich Centrifuge, Japan.
Biochemical Analysis
The glucose oxidase/glucose peroxidase (POD) method was used to measure serum glucose (Labkit Kits, Spain) (23). Creatinine and urea were determined by the urease glutamate dehydrogenase/UV method and by the Alkaline Picrate method, respectively, using the BioSystems kit, Spain (24, 25). Serum cholesterol and triglycerides were measured by the cholesterol oxidase/POD method and by the glycerol phosphate oxidase/POD method, respectively, using the BioSystems kit, Spain (26, 27). High-density lipoprotein cholesterol (HDL-C) was determined by the precipitating method using Labkit kit, Spain (28). Low-density lipoprotein cholesterol (LDL-C) was calculated using the empirical relationship of Friedewald (29).
Urine Analysis
Urinary albumin was determined by Immunoturbidometry–Latex method using BioSystems kit, Spain (30). Urinary creatinine was measured by kinetic test without deproteinization using DiaSys reagent kits (31). Albumin creatinine ratio (ACR) (mg/g) = microalbumin in urine (mg/l) × 1,000/creatinine in urine (mg/dl) × 10. eGFR was calculated by the Schwartz equation: eGFR (ml/min/1.73 m2) = 0.55 × length/serum creatinine.
Data Analysis
Data entry and statistical analyses were performed using Statistical Package for Social Sciences Inc., Chicago, IL (SPSS) computer program version 23 for windows. A simple distribution of the study variables and cross tabulation was applied. χ2 was used to identify the difference between variables. Means were compared by independent-samples t-test. Pearson’s correlation test was applied. Logistic and multiple linear regressions by backward stepwise method were also applied to build a model to predict DR. The results were accepted as statistically significant when p < 0.05. Range as minimum and maximum values was used. The percentage difference was calculated according to the formula: percentage difference equals the absolute value of the change in value, divided by the average of the two numbers, all multiplied by 100. Percent difference = (|(V1 − V2)|/((V1 + V2)/2)) × 100.
Ethical Consideration
The research was undertaken according to the Declaration of Helsinki and after the Local Research Ethics Committee had approved the study. All T2DM patients provided written informed consent prior to the study.
Results
Clinical and Demographic
The mean age of diabetic patients was 50.6 ± 6.2 years, the mean duration of diabetes was 7.0 ± 5.8 years, and the mean BMI was 30.3 ± 7.8. 50.7% of patients with diabetes had a diabetes duration ≤5 years, 28.0% had diabetes from 6 to 10 years, the remaining 21.3% had diabetes for more than 10 years. Retinopathy occurred in 37 (24.7%), nephropathy in 71 (47.3%), cardiovascular diseases (CVDs) in 15 (10.0%), and neuropathy in 5 (10.0%) patients. Thirty-two (21.3%) of patients were smokers, 90 (60%) had a family history of diabetes, and 65 (43.3%) were on a diet.
Clinical and Demographic Characteristics of Patients with and without DR
There were no significant differences between patients with and without retinopathy for age, BMI, and diet (p > 0.05) (Table 1). Significantly more patients with DR [14 (37.8%)] compared with those without retinopathy [18 (15.9%)] (χ2 = 7.972 and p = 0.005) were smokers. More patients with DR [28 (75.7%)] had a family history of diabetes compared with patients without retinopathy [62 (54.9%)] (χ2 = 5.029 and p = 0.025).
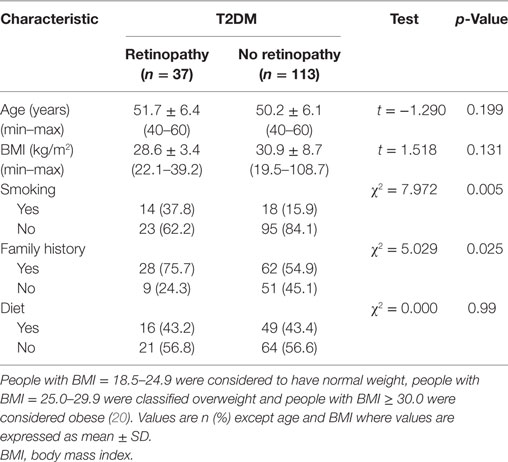
Table 1. Clinical and demographic characteristics of the study population.
Duration of Diabetes and Diabetic Complications in Patients with and without DR
The mean duration of diabetes in patients with DR was significantly longer than those without DR (p < 0.001) (Table 2). The percentage of patients with CVD (p = 0.007), neuropathy (p = 0.007), nephropathy (p = 0.037), and recurrent infections (p = 0.034) was significantly higher in patients with DR compared with patients without DR.
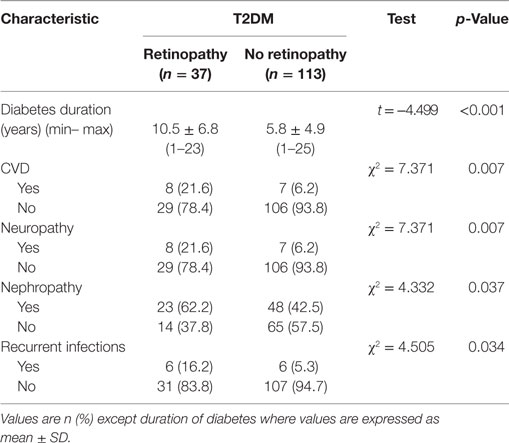
Table 2. Duration of diabetes and diabetic complications in diabetic patients with and without retinopathy.
Metabolic Profile of Patients with and without DR
Fasting serum glucose (p = 0.006), urea (p < 0.001), creatinine (p = 0.006), cholesterol (p = 0.002), and LDL-C (p < 0.001) were significantly higher and HDL-C (p = 0.004) was significantly lower with no difference in triglycerides (p = 0.111) between patients with DR compared with patients without DR (Table 3).
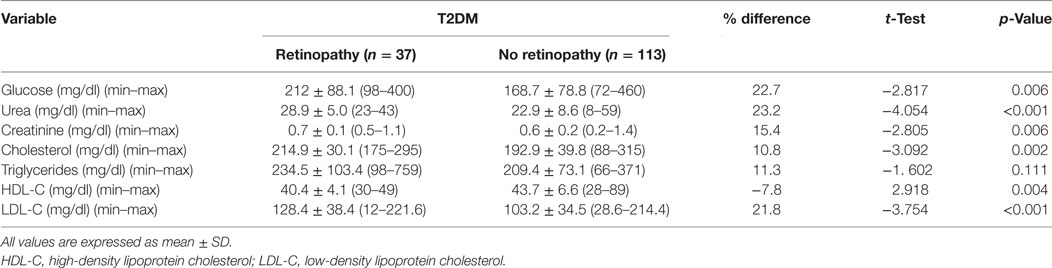
Table 3. Serum glucose, urea, creatinine, and lipid profile of diabetic patients.
Urine Albumin, Creatinine, ACR, and eGFR in Patients with and without DR
Urinary albumin concentration (p = 0.034) and ACR (p = 0.026) were significantly higher and eGFR (p = 0.003) was significantly lower in patients with DR compared with patients without DR (Table 4).
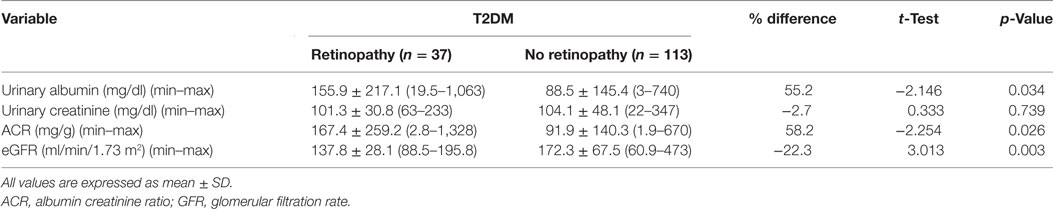
Table 4. Urinary albumin, creatinine, and eGFR of the study population.
Logistic Regression Model for Independent Variables Predicting DR
The factors predicting DR were duration of diabetes [OR = 1.143, 95% CI (1.07–1.222), p = 0.001], smoking [OR = 3.213, 95% CI (1.395–7.396), p = 0.006], family history [OR = 2.559, 95% CI (1.108–5.913), p = 0.028], CVD [OR = 4.177, 95% CI (1.398–12.479), p = 0.01], nephropathy [OR = 2.225, 95% CI (1.038–4.766), p = 0.040], neuropathy [OR = 4.177, 95% CI (1.398–12.479), p = 0.01], recurrent infections [OR = 3.452, 95% CI (1.039–11.461), p = 0.043], glucose [OR = 1.006, 95% CI (1.002–1.01), p = 0.008], urea [OR = 1.102, 95% CI (1.043–1.163), p < 0.001], creatinine [OR = 18.028, 95% CI (2.096–155.035), p = 0.008], cholesterol [OR = 1.016, 95% CI (1.005–1.026), p = 0.004], HDL-C [OR = 0.878, 95% CI (0.807–0.956), p = 0.003], LDL-C [OR = 1.02, 95% CI (1.008–1.032), p = 0.001], urinary albumin [OR = 1.002, 95% CI (1.00–1.004), p = 0.044], ACR [OR = 1.002, 95% CI (1.00–1.004), p = 0.041], and eGFR [OR = 0.986, 95% CI (0.977–0.996), p = 0.005] (Table 5). The multivariate logistic regression analysis model demonstrated an association between DR with duration of diabetes [OR = 1.114, 95% CI (1.036–1.199), p = 0.004], family history of diabetes [OR = 3.397, 95% CI (1.245–9.27), p = 0.017], recurrent infections [OR = 0.161, 95% CI (0.033–0.796), p = 0.025], and urea [OR = 1.09, 95% CI (1.027–1.157), p = 0.005] (Table 6).
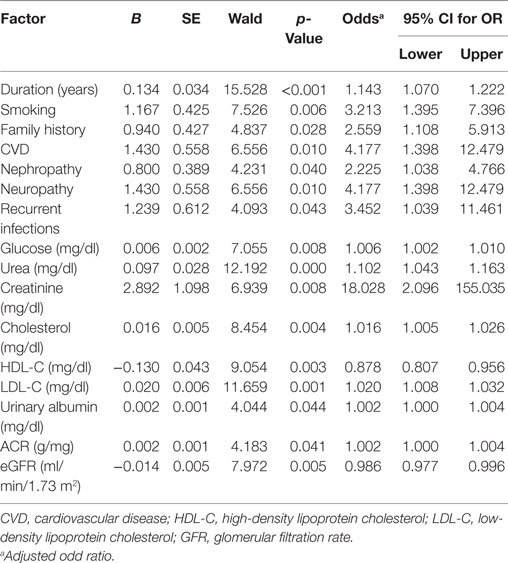
Table 5. Univariate logistic regression analysis model for independent factors associated with diabetic retinopathy.
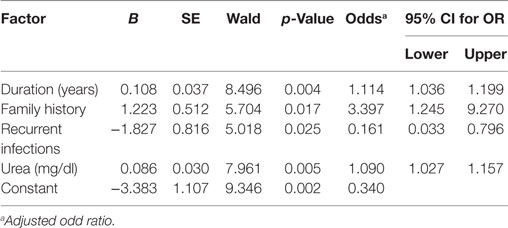
Table 6. Multivariate logistic regression analysis model for independent factors associated with diabetic retinopathy.
Multiple Linear Regression Model to Predict the Duration of Diabetes
Multiple linear regression analysis demonstrated that duration of diabetes was related to glucose (t = 6.646, p < 0.001), urea (t = 4.355, p < 0.001), creatinine (t = 3.474, p = 0.001), ACR (t = 1.981, p = 0.049), and eGFR (t = −3.519, p = 0.001) (Table 7).
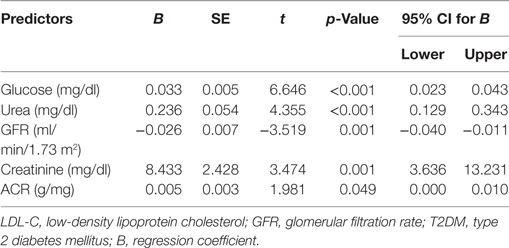
Table 7. Multiple linear regression model to predict duration of diabetes.
Discussion
To date, there has only been one published study on retinopathy in patients with type 2 diabetes in the Gaza Strip (18). The present study is the first to assess the prevalence of DR in men with T2DM in the Gaza Strip in relation to clinical and metabolic factors as well as other complications.
The prevalence of DR in our sample of 150 clinic patients with T2DM was 24.7%, which is comparable with the prevalence of DR in a large population-based retinal screening study in Wales (32). Clearly, further research is required on a larger sample size at a national level. DR was associated with smoking and a family history of diabetes and smoking and family history of diabetes are associated with the development and progression of DR (33).
Diabetic retinopathy was associated with the duration of diabetes (34, 35) and other microvascular and macrovascular complications (36–38). DR as expected was related to poorer glycemic control and lipid profile as well as worsening renal function (38–40). Dyslipidemia has been reported to be associated with CVD and DR (41) and indeed CVD was also related to DR.
The presence of DR was related to increased urinary albumin concentration and ACR as well as a reduced eGFR (18, 42) confirms the association between microvascular complications. Indeed, increased ACR and low eGFR are independently associated with DR. This is important as these tests are relatively cheaper and therefore more affordable compared with ophthalmic assessment, which is not performed routinely in the majority of people in poor areas such as the Gaza Strip. Univariate logistic regression analysis revealed that DR was predicted by duration of diabetes, smoking, family history, CVD, nephropathy, neuropathy, recurrent infections, glucose, urea, creatinine, cholesterol, LDL-C, HDL-C, ACR, and eGFR. Most of these factors have previously been identified as predictive factors in the progression of DR (43). The multivariate logistic regression model revealed that DR was predicted by the duration of diabetes, family history, recurrent infections, and urea. Multiple linear regression also demonstrated that the duration of diabetes was related to glucose, urea, eGFR, creatinine, and ACR.
Limitations of the current study include a small sample size of male patients with the diagnosis of DR being limited to direct ophthalmoscopy. However, this study provides the first set of data on the prevalence of DR among diabetic patients in the Gaza Strip. It also confirms the association of DR with a number of modifiable risk factors including glycemic control, lipids, and impaired renal function as well as a relationship to the other microvascular complications of diabetic neuropathy and nephropathy.
Ethics Statement
The study was conducted in accordance with the Declaration of Helsinki and was approved by the Local Ethics Research Committee. All subjects provided written informed consent prior to the study.
Author Contributions
AM data collection, statistical analysis, and write manuscript.
Conflict of Interest Statement
The author declares that the research was conducted in the absence of any commercial or financial relationships that could be construed as a potential conflict of interest.
The reviewer GP and handling editor declared their shared affiliation.
References
1. American Diabetes Association. Classification and diagnosis of diabetes. Diabetes Care (2015) 38:8–16. doi:10.2337/dc15-S005
2. Copeland KC, Silverstein J, Moore KR, Prazar GE, Raymer T, Shiffman RN, et al. Management of newly diagnosed type 2 diabetes mellitus (T2DM) in children and adolescents. Pediatrics (2013) 131:364–82. doi:10.1542/peds.2012-3494
3. Rahimi-Madiseh M, Malekpour-Tehrani A, Bahmani M, Rafieian-Kopaei M. The research and development on the antioxidants in prevention of diabetic complications. Asian Pac J Trop Med (2016) 30:825–31. doi:10.1016/j.apjtm.2016.07.001
4. Model CC. Standards of medical care in diabetes—2015 abridged for primary care providers. Clin Diabetes (2015) 33:97–111. doi:10.2337/diaclin.33.2.97
5. Gaede P, Oellgaard J, Carstensen B, Rossing P, Lund-Andersen H, Parving HH, et al. Years of life gained by multifactorial intervention in patients with type 2 diabetes mellitus and microalbuminuria: 21 years follow-up on the Steno-2 randomised trial. Diabetologia (2016) 59:2298–307. doi:10.1007/s00125-016-4065-6
6. Hwang CK, Hubbard GB, Hutchinson AK, Lambert SR. Outcomes after intravitreal bevacizumab versus laser photocoagulation for retinopathy of prematurity: a 5-year retrospective analysis. Ophthalmology (2015) 31:1008–15. doi:10.1016/j.ophtha.2014.12.017
7. Aghamohamadian-Sharbaf M, Pourreza HR, Banaee T. A novel curvature-based algorithm for automatic grading of retinal blood vessel tortuosity. IEEE J Biomed Health Inform (2016) 20(2):586–95. doi:10.1109/JBHI.2015.2396198
8. Stewart MW, Flynn HW Jr, Schwartz SG, Scott IU. Extended duration strategies for the pharmacologic treatment of diabetic retinopathy: current status and future prospects. Expert Opin Drug Deliv (2016) 13:1277–87. doi:10.1080/17425247.2016.1198771
9. Wang LZ, Cheung CY, Tapp RJ, Hamzah H, Tan G, Ting D, et al. Availability and variability in guidelines on diabetic retinopathy screening in Asian countries. Br J Ophthalmol (2017) 14. doi:10.1136/bjophthalmol-2016-310002
10. Khan A, Petropoulos IN, Ponirakis G, Malik RA. Visual complications in diabetes mellitus: beyond retinopathy. Diabet Med (2016) 34(4):478–84. doi:10.1111/dme.13296
11. Horner ME, Abramson AK, Warren RB, Swanson S, Menter MA. The spectrum of oculocutaneous disease: part I. Infectious, inflammatory, and genetic causes of oculocutaneous disease. J Am Acad Dermatol (2014) 70:795.e1–e25. doi:10.1016/j.jaad.2013.12.013
12. Korobelnik JF, Do DV, Schmidt-Erfurth U, Boyer DS, Holz FG, Heier JS, et al. Intravitreal aflibercept for diabetic macular edema. Ophthalmology (2014) 121:2247–54. doi:10.1016/j.ophtha.2014.05.006
13. Conlin PR, Asefzadeh B, Pasquale LR, Selvin G, Lamkin R, Cavallerano AA. Accuracy of a technology-assisted eye exam in evaluation of referable diabetic retinopathy and concomitant ocular diseases. Br J Ophthalmol (2015) 99:1622–7. doi:10.1136/bjophthalmol-2014-306536
14. Solomon SD, Chew E, Duh EJ, Sobrin L, Sun JK, VanderBeek BL, et al. Diabetic retinopathy: a position statement by the American Diabetes Association. Diabetes Care (2017) 40:412–8. doi:10.2337/dc16-2641
15. Chang LL, Lee AC, Sue W. Prevalence of diabetic retinopathy at first presentation to the retinal screening service in the greater Wellington region of New Zealand 2006–2015, and implications for models of retinal screening. N Z Med J (2017) 17:78–88.
16. Park YG, Roh YJ. New diagnostic and therapeutic approaches for preventing the progression of diabetic retinopathy. J Diabetes Res (2015) 31:2016. doi:10.1155/2016/1753584
17. Chiang F, Kuper H, Lindfield R, Keenan T, Seyam NE, Magauran D, et al. Rapid assessment of avoidable blindness in the Occupied Palestinian Territories. PLoS One (2010) 5(7):e11854. doi:10.1371/journal.pone.0011854
18. Yassin MM, Mustafa AM, Abujami SM, Jaber EA. Leptin status and biochemical parameters in type 2 diabetic males from Gaza strip. AMBS J (2017) 3:4–10.
19. World Health Organization. Definition and Diagnosis of Diabetes Mellitus and Intermediate Hyperglycemia REPORT of a WHO/IDF Consultation. Geneva: WHO (2006).
20. Palestinian Ministry of Health. Diabetic Questionnaire, Diabetic Clinic Records, Gaza Strip. Palestine: (2006).
21. Backestrom C, Hursh-Cesar G. Survey Research. Pennsylvania, USA: Literary Licensing, LLC (2012).
22. World Health Organization. Ten Facts on Obesity. (2014). Available from: http://www.who.int/features/factfiles/obesity/en/
23. Trinder P. Determination of glucose in blood using glucose oxidase. Ann Clin Biochem (1969) 6:24–33. doi:10.1177/000456326900600108
24. Bergmeyer HU. Methods of Enzymatic Analysis. 2nd ed. Weinheim, New York: Verlag Chemie, Academic Press (1974).
25. Fabiny DL, Ertingshausen G. Automated reaction-rate method for determination of serum creatinine with the Centrifi Chem. Clin Chem (1971) 17:696–700.
26. Meiattini F, Prencipe L, Bardelli F, Giannini G, Tarli P. The 4-hydroxybenzoate/4 aminophenazone chromogenic system used in the enzymic determination of serum cholesterol. Clin Chem (1978) 24:2161–5.
27. Bucolo G, David H. Quantitative determination of serum triglycerides by use of enzymes. Clin Chem (1973) 19:476–82.
28. Grove TH. Effect of reagent pH on determination of HDL cholesterol by precipitation with sodium phosphotungstate-magnesium. Clin Chem (1979) 25:560–4.
29. Friedewald WT, Levy RI, Fredrickson DS. Estimation of the concentration of LDL-C in plasma without use of the preparative ultracentrifuge. Clin Chem (1972) 18:499–502.
30. Harmoinen A, Ala-Houhala I, Vuorinen P. Rapid and sensitive immunoassay for albumin determination in urine. Clin Chim Acta (1985) 15:269–74. doi:10.1016/0009-8981(85)90341-9
31. Bartels H, Bohmer M, Heierli G. Serum creatinine determination without protein precipitation. Clin Chim Acta (1972) 37:193–7. doi:10.1016/0009-8981(72)90432-9
32. Thomas RL, Dunstan FD, Luzio SD, Chowdhury SR, North RV, Hale SL, et al. Prevalence of diabetic retinopathy within a national diabetic retinopathy screening service. Br J Ophthalmol (2015) 99:64–8. doi:10.1136/bjophthalmol-2013-304017
33. Chang SA. Smoking and type 2 diabetes mellitus. Diab Metab J (2012) 36:399–403. doi:10.4093/dmj.2012.36.6.399
34. Fathy SA, Abdel Hamid FF, Zabut BM, Jamee AF, Ali MA, Abu Mustafa AM. Diagnostic utility of BNP, corin and furin as biomarkers for cardiovascular complications in type 2 diabetes mellitus patients. Biomarkers (2015) 20:460–9. doi:10.3109/1354750X.2015.1093032
35. AbuMustafa AM, Yassin M. Clinical and biochemical aspects associated with diabetic nephropathy among type 2 diabetic males in Gaza strip. Int J Med (2017) 5:142–7. doi:10.14419/ijm.v5i1.7603
36. Elsous A, Radwan M, Al-Sharif H, Mustafa A. Medications adherence and associated factors among patients with type 2 diabetes mellitus in the Gaza Strip, Palestine. Front Endocrinol (2017) 8:100. doi:10.3389/fendo.2017.00100
37. Rodríguez-Poncelas A, Mundet-Tudurí X, Miravet-Jiménez S, Casellas A, Barrot-De la Puente JF, Franch-Nadal J, et al. Chronic kidney disease and diabetic retinopathy in patients with type 2 diabetes. PLoS One (2016) 11:e0149448. doi:10.1371/journal.pone.0149448
38. Cheng YJ, Gregg EW, Geiss LS, Imperatore G, Williams DE, Zhang X, et al. Association of A1C and fasting plasma glucose levels with diabetic retinopathy prevalence in the US population. Diabetes Care (2009) 32:2027–32. doi:10.2337/dc09-0440
39. Ursini F, Arturi F, Nicolosi K, Ammendolia A, D’Angelo S, Russo E, et al. Plantar fascia enthesopathy is highly prevalent in diabetic patients without peripheral neuropathy and correlates with retinopathy and impaired kidney function. PLoS One (2017) 12:e0174529. doi:10.1371/journal.pone.0174529
40. Ganjifrockwala FA, Joseph JT, George G. Evaluation of kidney function and risk factors of retinopathy in Type 2 diabetes mellitus people in South Africa. Diabetes Res Clin Pract (2017) 31(127):218–23. doi:10.1016/j.diabres.2017.03.022
41. Agrawal P, Sethi S, Reddy VS, Lamba S. Serum uric acid and lipid profile in diabetic retinopathy in rural Haryana, India. Int J Adv Med (2017) 3:309–12. doi:10.18203/2349-3933.ijam20161081
42. Wu J, Geng J, Liu L, Teng W, Liu L, Chen L. The relationship between estimated glomerular filtration rate and diabetic retinopathy. J Ophthalmol (2015). doi:10.1155/2015/326209
Keywords: diabetic retinopathy, biochemical, clinical, male, Gaza Strip
Citation: AbuMustafa AM (2017) Clinical and Biochemical Associations with Diabetic Retinopathy in Male Patients in the Gaza Strip. Front. Endocrinol. 8:302. doi: 10.3389/fendo.2017.00302
Received: 08 July 2017; Accepted: 16 October 2017;
Published: 10 November 2017
Edited by:
Rayaz Ahmed Malik, Weill Cornell Medical College in Qatar, QatarReviewed by:
Gulfidan Bitirgen, Necmettin Erbakan University, TurkeyGeorgios Ponirakis, Weill Cornell Medical College in Qatar, Qatar
Copyright: © 2017 AbuMustafa. This is an open-access article distributed under the terms of the Creative Commons Attribution License (CC BY). The use, distribution or reproduction in other forums is permitted, provided the original author(s) or licensor are credited and that the original publication in this journal is cited, in accordance with accepted academic practice. No use, distribution or reproduction is permitted which does not comply with these terms.
*Correspondence: Ayman M. AbuMustafa, YXltYW5heW1hbjIwMDkyMDA5QGhvdG1haWwuY29t