 Julian Berberich
 Johannes W. Dietrich
 Rudolf Hoermann
 Matthias A. Müller
- 1Institute for Systems Theory and Automatic Control, University of Stuttgart, Stuttgart, Germany
- 2Medical Department I, Endocrinology and Diabetology, Bergmannsheil University Hospitals, Ruhr University of Bochum, Bochum, Germany
- 3Ruhr Center for Rare Diseases (CeSER), Ruhr University of Bochum, Bochum, Germany
- 4Ruhr Center for Rare Diseases (CeSER), Witten/Herdecke University, Bochum, Germany
- 5Private Consultancy Research & Development, Yandina, QLD, Australia
Despite significant progress in assay technology, diagnosis of functional thyroid disorders may still be a challenge, as illustrated by the vague upper limit of the reference range for serum thyrotropin (TSH). Diagnostical problems also apply to subjects affected by syndrome T, i.e., those 10% of hypothyroid patients who continue to suffer from poor quality of life despite normal TSH concentrations under substitution therapy with levothyroxine (L-T4). In this paper, we extend a mathematical model of the pituitary–thyroid feedback loop in order to improve the understanding of thyroid hormone homeostasis. In particular, we incorporate a TSH-T3-shunt inside the thyroid, whose existence has recently been demonstrated in several clinical studies. The resulting extended model shows good accordance with various clinical observations, such as a circadian rhythm in free peripheral triiodothyronine (FT3). Furthermore, we perform a sensitivity analysis of the derived model, revealing the dependence of TSH and hormone concentrations on different system parameters. The results have implications for clinical interpretation of thyroid tests, e.g., in the differential diagnosis of subclinical hypothyroidism.
1. Introduction
In recent years, the mathematical modeling of human thyroid hormone homeostasis via the hypothalamic–pituitary–thyroid feedback loop has received an increasing amount of attention. Starting from early phenomenological models, more precise models have been developed based on molecular and pharmacokinetic data, see, e.g., Ref. (1–3, 4–6) for recent surveys on existing modeling approaches. These mathematical models can give important insight into the functionality of the hypothalamic–pituitary–thyroid axis and can be used to simulate the dynamic behavior of thyroidal hormone concentrations under different (euthyroid and non-euthyroid) conditions, and sometimes also for clinical decision-making (7). Furthermore, in Ref. (8), a method is proposed to compute personalized euthyroid setpoints that can be used for individualized diagnosis and treatment of thyroid diseases. While this static model is appealing due to its simplicity (only two parameter values have to be estimated), it does not consider any dynamic phenomena in the HPT axis, which are, however, of great importance for a deepened understanding of the HPT axis and ultimately the development of personalized optimal medication strategies. Another drawback is the absence of any consideration of T3, which has been shown to be significant not only as a key actor in the hypothalamic–pituitary–thyroid feedback loop (4, 9) but also in maintaining a good quality of life (5).
The main objective of this paper is an improved mathematical modeling of the HPT axis in order to obtain a more detailed understanding of the dynamic phenomena occurring in thyroid hormone homeostasis. In particular, as a first contribution, we extend the model originally developed in Ref. (1, 2) in order to incorporate new insights obtained through several recent clinical studies. In particular, we incorporate a direct TSH-T3 path inside the thyroid, accounting for the central T3 production by the thyroid. Existence of such a TSH-T3-shunt was hypothesized and demonstrated in several experiments and clinical observations (10–15). In Ref. (10), it was shown that L-T4-treated athyreotic patients exhibit decreased FT3 concentrations despite normal free thyroxine (FT4) levels, which would not be the case if peripheral FT3 was mainly produced by deiodination of peripheral FT4. Furthermore, the sum activity of step-up deiodinases (GD) is positively correlated with the TSH concentration (11) and with the thyroidal volume (12) and significantly decreases after thyroidectomy. These observations suggest that besides the peripheral T4/T3 conversion, also TSH-stimulated deiodinases inside the thyroid contribute to the total T3 production. In our work, we show that the extended model including such a TSH-T3-shunt is in good accordance with various clinical observations. For example, we show that the FT3 concentration shows a clear circadian pattern, as was observed in vivo in Ref. (16). Notably, this is not the case in the previous model, which did not include the TSH-T3-shunt.
As a second main contribution of this paper, we perform a sensitivity analysis of the derived model. Loosely speaking, the (first-order) sensitivities are a measure for how “sensitive” certain system states (i.e., TSH or hormone concentrations) are with respect to changes in certain parameters (such as, e.g., the thyroid’s secretory capacity GT). These sensitivities reveal structural insight into the functionality of the hypothalamic–pituitary–thyroid axis and can provide explanations for certain clinical observations. For example, we show that the sensitivity of TSH with respect to GT is much higher for low values of GT (i.e., in hypothyroidism) than for high values of GT (i.e., in hyperthyroidism). This fact can be used to explain why in clinical practice, TSH concentrations may significantly vary beyond the upper limit of the reference range despite normal thyroid function.
The remainder of this paper is structured as follows. Section 2 presents the extended mathematical model and discusses the identification of the required (additional) parameters. In Section 3, we show simulation results of the derived model and discuss the observed properties (such as the existence of a circadian rhythm in FT3 concentrations). A sensitivity analysis of TSH, FT4, and FT3 concentrations with respect to different parameters is performed in Section 4. Finally, we conclude the paper in Section 5.
2. Presentation of the Extended Model and Parameter Identification
As outlined above, several clinical observations have led to the hypothesis that a direct, TSH-stimulated path exists for T3 production inside the thyroid, which we now incorporate into the mathematical model from Ref. (1, 2). The extended model including this TSH-T3-shunt is illustrated in Figure 1, see Section S1 in the Supplementary Material for a mathematical description of the underlying differential equations. To this end, both intrathyroidal conversion of T4 into T3 via type 1 and 2 5′-deiodinases as well as a direct synthesis of T3 are modeled (see upper three blocks in the “Thyroid” block in Figure 1). Both mechanisms are stimulated by TSH and modeled via nonlinear Michaelis–Menten–Hill kinetics, see Section S1 in the Supplementary Material for further details.
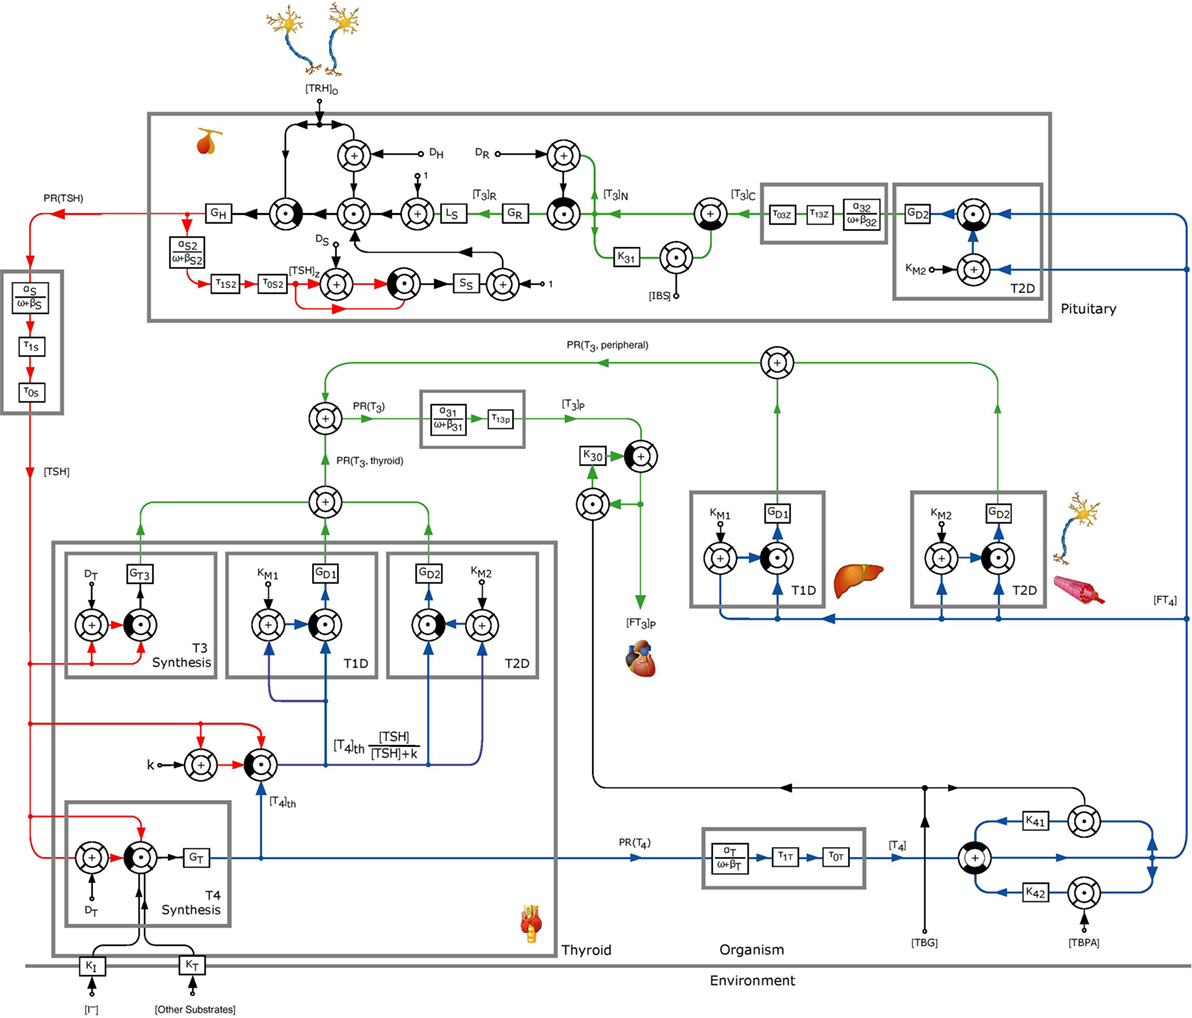
Figure 1. Block diagram of the thyrotropic feedback control loop with an additional TSH-T3-shunt, adapted from Ref. (1, 2). Except for GT3, k, and GD1, all parameters were adopted from the model in Ref. (1, 2). The parameters GD1 and GT3 were estimated to obtain an optimal (in a least squares sense) fit to measured in vivo FT3-concentrations. To this end, the value of k was normalized to 1 mU/l.
Most of the parameters of the extended model can be taken from the model in Ref. (1, 2), where the parameters have been estimated according to known physical quantities (such as the half-life period of certain substances, etc.) or have been identified using data measured in vivo. A detailed listing of these parameters can be found in the Tables S1–S3 in Supplementary Material. Some of the parameters were calibrated according to average population data, and hence the resulting model can be interpreted to be a functional model of some generic euthyroid subject. Clearly, personalized model identification would be highly valuable for individualized clinical decision-making and the development of personalized optimal medication strategies. For this, however, sufficient data such as individual dynamic trajectories of hormone concentrations would be needed to avoid overfitting. We note that, while the present report deals mainly with average population data, the observed phenomena are in good accordance with individual samples (9).
For the extended model, the new parameters GT3 and k have to be determined. Also, the sum activity of the type 1 5′-deiodinase, GD1, has to be re-estimated. This is the case since the extended model considers the additional T3 secretion inside the thyroid, while in the original model, GD1 was calibrated by only considering peripheral T3 production, and hence GD1 had been estimated too high. In order to obtain the parameters GT3 and GD1, a least squares estimation was performed, fitting the FT3-output of the presented model to FT3 measurements of a clinical study. Although there is no unique solution in case that only single FT3 measurements are available, it provides a set of optimal parameters, which could be further reduced to a unique solution if additional measurements were available (compare the detailed discussion below). In order to perform the least squares estimation, the equilibrium FT3 level predicted by the extended model, in the following denoted by FT3,eq, can be computed in dependence of the parameters by solving a cubic polynomial (see Section S1 in the Supplementary Material for a more detailed description). For this computation, we set TRH to a constant value (later, for the dynamic analysis TRH is varying in a sinusoidal fashion). This equilibrium value is then fitted in a least-squares sense to real measurement data resulting from 1,121 untreated patients of the clinical study in Ref. (11). In particular, this is achieved by minimizing the following cost function with respect to the parameters GT3, k, and GD1:
Here, FT3,i denotes the measured FT3-concentration of the i-th patient, and FT3,eq (GT3, k, GD1) is the equilibrium FT3-level predicted by the model depending on the parameters GT3, k, and GD1. The other parameters that are needed to compute FT3,eq are adopted from Ref. (1) (see Tables S1–S3 in the Supplementary Material). The optimal solution to the above optimization problem can be determined analytically and is given by , where is the mean value of the 1,121 FT3 measurements. Using the derived formula for FT3,eq(GT3, k, GD1) (see Section S1 in the Supplementary Material), this results in different (infinitely many) optimal parameter combinations for GT3, k, and GD1. For example, normalizing k to (which will be used in the following), the optimal parameter combinations for GT3 and GD1 can be seen in Figure 2.
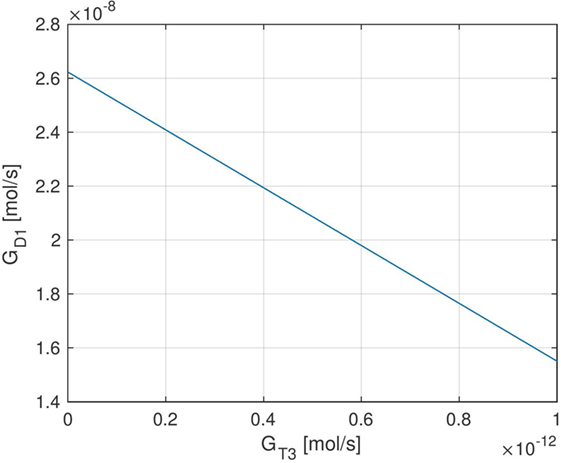
Figure 2. Set of optimal (in a least-squares sense) parameters GT3 and GD1 when normalizing the parameter k to 1 mU/l. Due to the affine dependence of FT3,eq (GT3, k, GD1) on GT3 and GD1, the set of optimal parameters is contained in a one-dimensional affine subspace of .
Different (optimal) parameter combinations for GT3 and GD1 result in different fractions of thyroidal and peripheral T3 production. For example, and approximately lead to 80% T3 production from peripheral conversion of FT4 and approximately 20% T3 production from intrathyroidal secretion, corresponding to the values suggested by Ref. (17, 18). On the other hand, also, a higher or lower fraction of intrathyroidal T3 production is possible, depending on the values of GT3 and GD1. In particular, higher values of GT3 and lower values for GD1 result in a higher fraction of intrathyroidal T3 production and vice versa. For the dynamic simulation of the model and the sensitivity analysis in the following sections, we (mostly) use the values and , and we comment when certain results qualitatively change if other parameter values for GD1 and GT3 are used.
The above discussed non-uniqueness in the optimal parameter fit is due to the fact that the model is not fully identifiable given the measured data. Namely, FT3 is the only hormone that is affected by the parameters GT3, k, and GD1, and we only have stationary measurements available. Furthermore, in the above estimation, we made the simplifying assumption that peripheral and thyroidal deiodinase activities (GD1 and GD2) are the same, which might in general not be the case. Identifying the corresponding parameters separately would result in a possibly better parameterized model, which is, however, again not possible given only the stationary FT3 measurements. On the other hand, if we had additional data such as dynamic hormone concentration trajectories or additional measurements (e.g., intrathyroidal hormone concentrations), the above described non-uniqueness in the parameter estimation could be removed and also different parameter values for thyroidal and peripheral deiodinase activity could be identified, allowing for a more exact parameterization of the model. This would be an interesting topic for future research, however, such in vivo data are difficult to obtain and are typically not available. Moreover, the presented model does not consider membrane transport processes between thyroidal and peripheral tissue. Incorporating such processes by means of a compartment model would further increase the quality of our model, yet, this would yield additional parameters, which had to be identified. Nevertheless, as we will show in the following sections, the extended model with the parameters as identified in this section is a clear improvement compared to the previous model, allowing for a better reproduction and interpretation of various clinically observed phenomena.
3. Dynamic Properties of the Extended Model
In the following, we simulate the extended model and analyze and interpret the obtained results. First, some simulation runs are carried out to illustrate the role of the TSH-T3-shunt in obtaining a circadian rhythm in the FT3-concentration. Afterwards, we investigate the delay between TSH and FT3, which has been observed in several clinical studies [e.g., Ref. (16, 19)].
3.1. Dynamic Simulation
As detailed in the previous section, the intrathyroidal T3 secretion is composed of two mechanisms, namely intrathyroidal conversion of T4 into T3 via type 1 and 2 5′-deiodinases (upper middle and right block inside the thyroid in Figure 1) as well as a direct synthesis of T3 (upper left block inside the thyroid in Figure 1). In the dynamic simulation using the parameters as identified in Section 2, the intrathyroidal contribution to the total T3 secretion rate was composed as follows:
Hence, with the parameters identified in Section 2, the main thyroidal source to T3-production is direct T3-synthesis via Michaelis–Menten–Hill kinetics, represented by the block “T3 Synthesis” in Figure 1. On the other hand, deiodination by type 2 5′-deiodinases has a negligible effect only, since the sum activity of type 2 5′-deiodinases is much smaller compared to that of type 1 5′-deiodinases. In case that a different optimal combination of parameters GT3 and GD1 is used (compare Section 2), the above results change accordingly, i.e., a higher value of GD1 yields a higher contribution of the deiodination by type 1 5′-deiodinases to the thyroidal T3-production. However, this also causes a change in the ratio between thyroidal and peripheral T3 production, as discussed in Section 2.
Figure 3 shows simulated FT3-plots, where we further investigated the effect of the TSH-T3-shunt on the dynamic behavior of FT3.1 In particular, Figure 3A shows simulation results using the previous model from Ref. (1) without the TSH-T3-shunt whereas in Figure 3B, the full TSH-T3-shunt as described in the previous section is included. For each of the two scenarios (i.e., for the corresponding models), we separately identified the (in a least-squares-sense) optimal parameter(s): GD1 for the model corresponding to Figure 3A and GD1 as well as GT3 for the model corresponding to Figure 3B. The exact values of these parameters for the different model configurations can be seen in Table S4 in Supplementary Material.
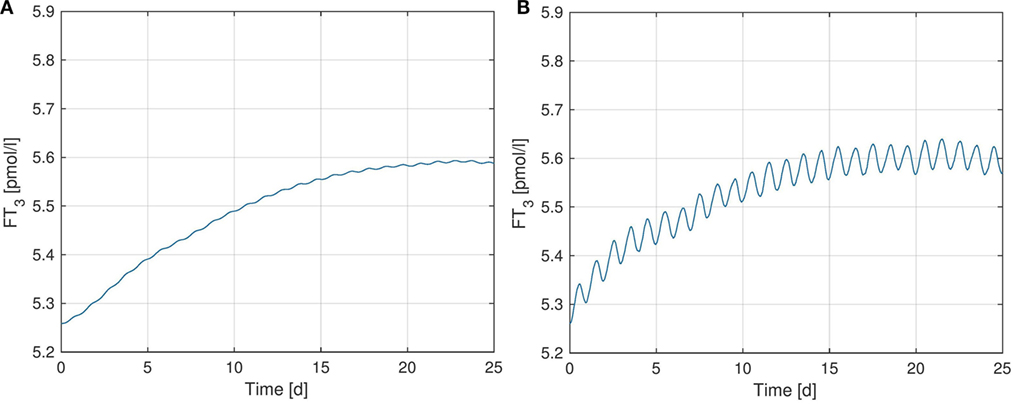
Figure 3. FT3-plots over a simulation horizon of 25 days for several configurations of the TSH-T3-Shunt. The parameters GT3 and GD1 are identified via least squares optimization, separately for each model configuration. (A) No shunt included. (B) Full TSH-T3-shunt.
We observe that the TSH-T3-shunt causes a clear circadian oscillation in the FT3 concentration, which is not (or only very weakly) present without considering intrathyroidal T3 secretion. Such a circadian rhythm in FT3 concentration has been observed in vivo in several clinical studies [see, e.g., Ref. (16, 19)], and hence our simulation results again support existence of the TSH-T3-shunt.
Quantitatively, the oscillation amplitude of the measured in vivo FT3 concentration in Ref. (16) is approximately six times as big as the amplitude observed in the simulated model (see Figure 3B). This difference might be due to the assumptions we made for the identification in Section 2 (same values for GD1, GD2, KM1, and KM2 inside the thyroid and the peripheral tissue). Namely, if thyroidal deiodination activity and/or GT3 were higher than computed in Section 2, without increasing the peripheral deiodination activity as well, we would obtain a larger oscillation amplitude in FT3 concentration. Nevertheless, the fact that a clear circadian pattern arises in the simulations when including the TSH-T3-shunt into the model is a clear indicator supporting both its existence as well as the fact that thyroidal T3 secretion is stimulated by TSH.
3.2. Delay of FT3 w.r.t. TSH
The authors in Ref. (16) make the observation that in vivo FT3-measurements follow a clear circadian pattern, which is approximately 90 min delayed w.r.t. TSH; this number can also vary between different individuals (19). As already mentioned in the previous section, the FT3-level obtained by the model in Figure 1 including intrathyroidal T3-secretion shows a clear circadian pattern. In this section, we investigate how the delay between TSH and FT3 in the presented model is influenced by this newly incorporated mechanism.
A dynamic simulation with the same setup as in Section 3.1 yields the following: when incorporating the TSH-T3-shunt into the model, FT3 is delayed w.r.t. TSH by approximately 6 h, whereas the delay amounts to 13 h in the previous model, which did not incorporate this mechanism. These observed values can be explained as follows. The phase shift between FT3 and TSH in our model mainly results from the first order lag elements modeling peripheral T3 and T4 secretion (i.e., the ones with parameters α31, β31, and α T, βT, respectively in Figure 1). The phase shift of the output signal of such a first order lag element for a given sinusoidal input signal with frequency ω depends on the parameter β and is given as follows:
In our case, where T = 86,400 s is the circadian period of 1 day. The delay between the output and input signal is now computed by simply relating the phase shift to the period length . For the given parameter values α31, β31, and αT, βT of T3- and T4-generation, respectively, we obtain a delay of approximately 5.5 and 6 h, respectively.
The above observed delay of FT3 w.r.t. TSH can now be explained as follows. In the previous model not including the TSH-T3-shunt, the circadian oscillation has to pass through both first order lag elements for peripheral T4 and T3 production, resulting in a high delay w.r.t. TSH. On the other hand, the fraction of T3 secreted inside the thyroid does not exhibit the delay caused by peripheral T4 production and hence exhibits a much shorter delay w.r.t. TSH. Interestingly, the observed delay of total T3 (approximately 6 h) mainly seems to be determined by the shorter one resulting from intrathyroidal T3 production, although approximately 80% of the total T3-production results from peripheral FT4-deiodination and only 20% from intrathyroidal secretion. The reason for this is that as explained above, the circadian rhythm of FT3 is mainly induced by intrathyroidal T3 secretion. Namely, the ratio of the amplitude and the mean value equals 0.3% for the peripheral T3 production rate PR(T3, peripheral) and 23% for the thyroidal T3 production rate PR(T3, thyroid). Thus, the phase of FT3 is almost solely characterized by the phase of thyroidal T3-production, and hence the delay of FT3 w.r.t. TSH is determined by the phase shift of only one first order lag element when the shunt is included, compared to two without the shunt. To conclude, the inclusion of the TSH-T3-shunt into the model significantly reduces the delay of FT3 w.r.t. TSH. While the absolute numbers are still too high compared to the observed in vivo delays (16, 19), this is again a clear indicator for the existence of the TSH-T3-shunt.
4. Sensitivity Analysis and Stationary Dependencies
In this section, we perform a sensitivity analysis of the previously presented mathematical model of the hypothalamic–pituitary–thyroid feedback loop (see Figure 1). Sensitivity analysis is a tool for determining how a certain parameter influences the trajectories resulting from simulation of the model, i.e., from the solution of the underlying system of differential equations, and in particular, how “sensitive” these trajectories are with respect to certain parameter changes. In the following, we give a brief non-formal introduction to sensitivity analysis and refer to the Section S2 in Supplementary Material for a more complete and formal description.
To define sensitivities, consider the following vector-valued ordinary differential equation with parameter vector p:
The first-order sensitivity function2 is now defined as , where p0 is some nominal (constant) parameter value. The sensitivity function S(t) is a time-dependent matrix with as many rows as the dimension of x and as many columns as the dimension of p. Under some assumptions (smoothness, existence of solutions, …), it can be shown that S satisfies the following differential equation, which is solved simultaneously with the state equation (3), see Ref. (20).
The initial sensitivity, i.e., S(t0), is set to zero since the states’ initial values are independent of the parameters. The above presented mathematical model of the hypothalamic–pituitary–thyroid feedback loop (see Figure 1) includes 36 parameters. With 5 states (pituitary TSH and T3 as well as peripheral TSH, T4, and T3 concentrations), this makes a total of 180 different sensitivity curves - for one specific nominal parameter configuration p0. In the following, we only analyze a few interesting curves to obtain some new insights. Of course, if desired, one could analogously analyze further sensitivities of other state and parameter pairs. In order to be able to employ the standard sensitivity analysis tools described above, the time delays in the hypothalamic–pituitary–thyroid (HPT) axis model are neglected.
4.1. Sensitivity of T4 w.r.t. GT
We start by examining the sensitivity of peripheral T4 with respect to the thyroid’s secretory capacity GT. In Figure 4, several plots of the sensitivity are shown with different GT-values, corresponding to different parameter values p0 in equation (4).3 Note that the sensitivity curves do not exhibit large variations over the day, i.e., only show a small circadian oscillation. It can be seen that different values of GT result in different sensitivities of T4 with respect to GT. For example, a low value of GT (which can be seen as a simple modeling of hypothyroidism) causes an increase of the sensitivity, whereas a high GT value (which can be seen as a simple modeling of hyperthyroidism) causes a decrease of the sensitivity. This means that larger fluctuations in T4 can be expected at the lower end of its euthyroid reference range (compare Section 4.3). This observation can compactly be expressed for a wide range of GT-values by investigating the stationary sensitivity (i.e., ). Figure 5 shows it as a function of the parameter GT. A comparison between Figures 4 and 5 shows that the stationary sensitivity, indeed, is the limit of the sensitivity curve for t → ∞.
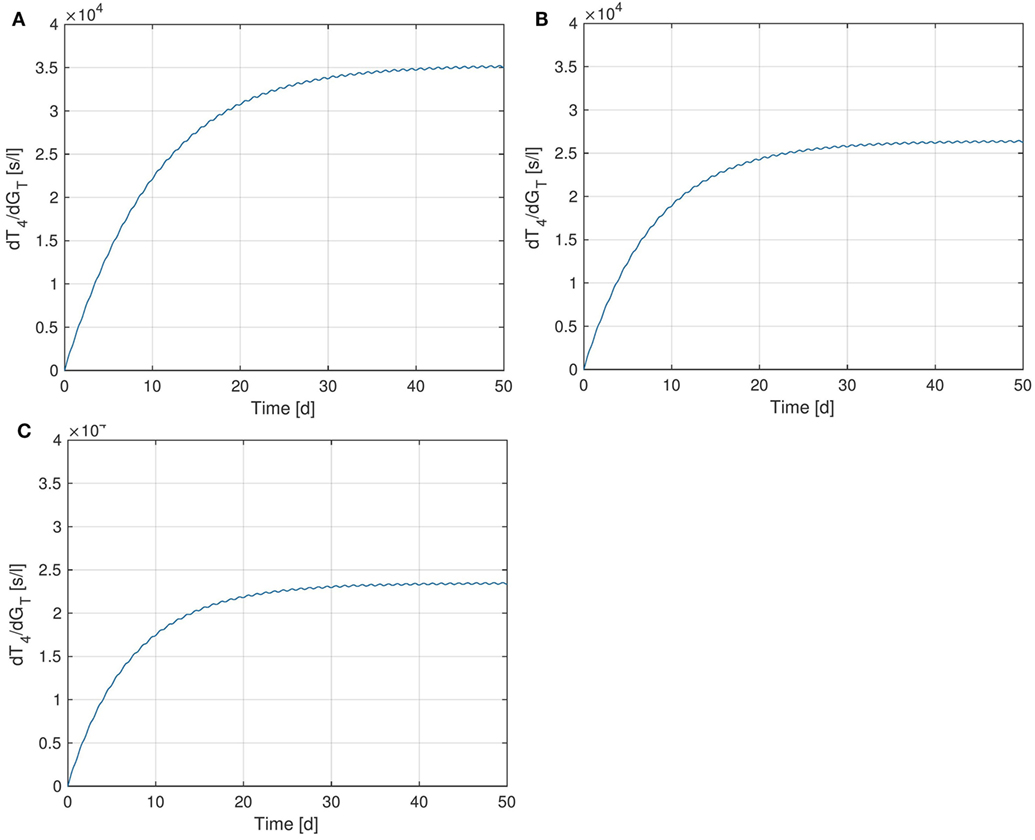
Figure 4. Sensitivity of T4 w.r.t. GT for different values of GT. (A) , (B) - nominal value, (C) .
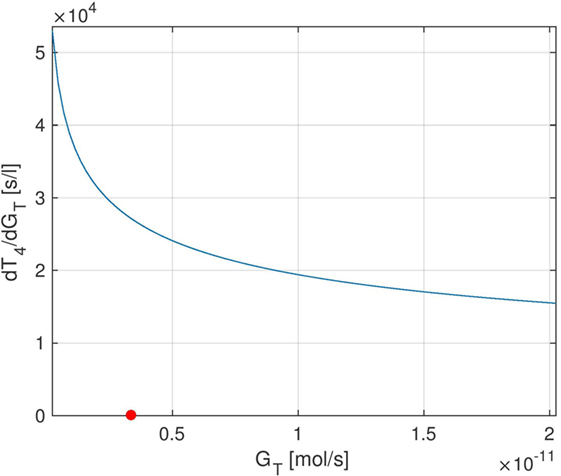
Figure 5. Stationary sensitivity of T4 w.r.t. GT as a GT-dependent function. The red point indicates the nominal GT-value from Ref. (1).
4.2. Sensitivity of TSH w.r.t. TRH
It is interesting to observe that the Ultra-Short-Feedback loop (i.e., the lower left part inside the pituitary in Figure 1, compare Ref. (2)) has a significant influence on the sensitivity of TSH w.r.t. TRH. Figure 6 shows the curves of this sensitivity for different values of Ss. It can be seen that an increase in Ss causes a decrease in the sensitivity.
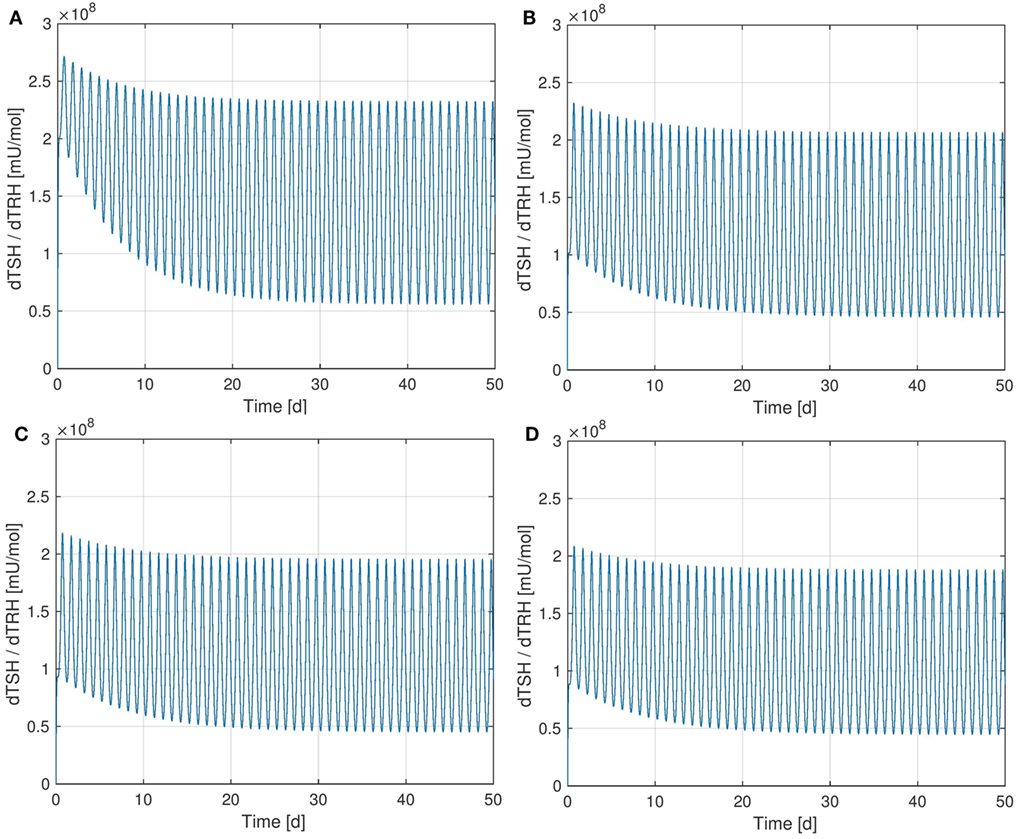
Figure 6. Sensitivity of TSH w.r.t. TRH for different values of SS. (A) , (B) , (C) - nominal value, (D) .
In the considered HPT axis model, TRH is treated as a time-dependent input that comes from the hypothalamus. A disturbance in the system could lead to a change in the TRH concentration arriving at the pituitary. Apparently, the Ultra-Short-Feedback increases the robustness of the TSH production w.r.t. changes in portal TRH. If the additional feedback is absent (i.e., Ss = 0), the sensitivity is significantly higher than in the nominal case .
4.3. Stationary Dependencies of TSH and T4 on GT
In the following, the influence of the thyroid’s secretory capacity GT on the equilibrium concentrations of TSH and T4 is analyzed. To this end, we solve the system’s stationary equations (i.e., for t → ∞) for the different hormones and plot the resulting equilibrium hormone levels as functions of GT. The slopes of these functions are exactly the entries of the stationary sensitivity matrix limt → ∞ S(t). For example, the stationary sensitivity for a given value of GT is equal to the derivative of the curve T4(GT) w.r.t. GT, which we treat in the following.
The curves of T4 and TSH depending on GT are shown in Figure 7. One can see that the parameter GT can be used as a measure of hypo- or hyperthyroidism (1). The equilibrium T4-concentration increases almost linearly with GT. Furthermore, we have high TSH-levels for low values of GT, i.e., in hypothyroidism, and vice versa. This is a well-known fact, which is usually used in clinical decision-making for the determination of subclinical thyroid diseases. Another interesting fact is that the magnitude of the sensitivity of TSH w.r.t. GT (which is the slope of Figure 7B) is high for low values of GT and vice versa. This means that TSH is much more sensitive to fluctuations in the thyroid’s secretory capacity if GT is low. This fact can be used to interpret the following clinical observation. In practice, TSH concentrations may be misleading, especially, if located slightly above the vague upper limit of the reference range. A reason for this could be that as discussed above, TSH is much more sensitive to fluctuations in the thyroid’s secretory capacity (e.g., due to different iodine supply and other influences) at the upper limit of its (euthyroid) reference range than at its lower limit.
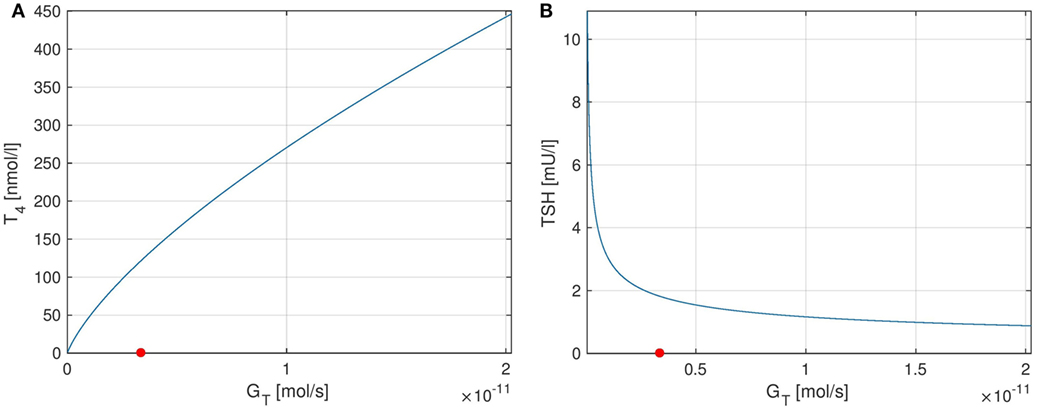
Figure 7. Plots of equilibrium T4 and TSH levels depending on the thyroid’s secretory capacity GT. The red point in the figures indicates the nominal GT-value from Ref. (1). (A) Equilibrium T4, (B) equilibrium TSH.
4.4. Sensitivity of FT3 w.r.t. GT
Finally, we perform a sensitivity analysis for FT3 w.r.t. the parameter GT. Figure 8 shows the sensitivity curve, where in Figure 8A, the extended model including the TSH-T3-shunt was used, whereas Figure 8B uses the previous model without the shunt. It can be seen that the sensitivity of FT3 w.r.t. GT decreases when the shunt is included. This is to be expected since in the extended model, a direct synthesis of T3 (upper left block inside the thyroid in Figure 1) is included, which is independent of GT, i.e., from the thyroid’s secretory capacity for T4. Another interesting fact is that we can observe a small circadian rhythm in Figure 8A whereas the plot (Figure 8B) seems not to be affected by this. This confirms the observations we made in Section 3.1, namely that incorporating intrathyroidal T3-secretion causes a circadian rhythm in FT3 and hence also in the sensitivity w.r.t. GT.
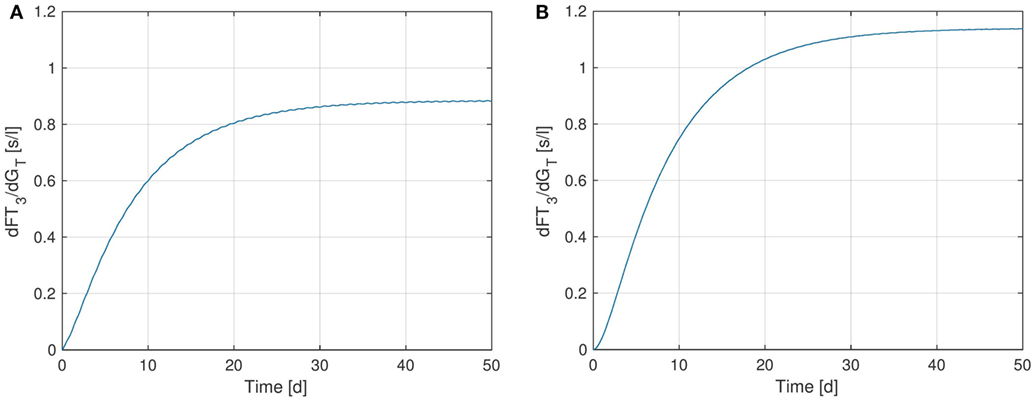
Figure 8. Sensitivity of FT3 w.r.t. GT for two versions of the HPT axis model: one incorporating the TSH-T3-shunt and one without this extension. (A) Full TSH-T3-shunt, (B) no shunt included.
As for T4 and GT, we can also analyze the stationary sensitivity for different values of GT. In Ref. (10), the outcomes of a clinical study lead to the observation that the dependency of T3-generation on GT is lower than that predicted by a model, which does not include a TSH-T3-shunt. Indeed, comparing Figures 9A,B, one can see that the sensitivity of FT3 w.r.t. GT significantly decreases when the shunt is incorporated into the model, i.e., T3 production is less sensitive to fluctuations in the thyroid’s secretory capacity if the shunt is included. As already mentioned above, this seems plausible since we now have a completely GT-independent path from TSH to FT3 (upper left block inside the thyroid in Figure 1).
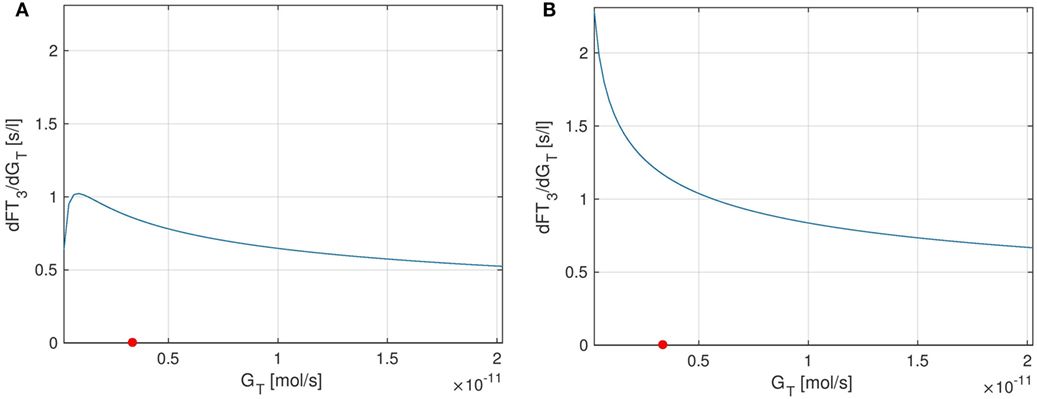
Figure 9. Plots of the stationary sensitivity of FT3 w.r.t. the parameter GT as a function of the thyroid’s secretory capacity GT. Two configurations of the model are shown: one including the TSH-T3-shunt and one without the shunt. The red point in the Figures indicates the nominal GT-value from Ref. (1). (A) Full TSH-T3-shunt, (B) no shunt included.
5. Conclusion and Outlook
In this work, a mathematical model of the hypothalamic–pituitary–thyroid feedback loop was extended to include TSH-stimulated intrathyroidal T3-secretion. The hypothesis of the existence of such a TSH-T3-shunt has been brought forward in various recent clinical studies. Our results show that the hypothesized mechanism can indeed explain various clinical findings. In particular, we have shown that intrathyroidal T3-secretion results in a clear circadian pattern of peripheral FT3, which has been observed in vivo in, e.g., Ref. (16, 19), and which is not the case without the incorporation of such a TSH-T3-shunt. Also, a sensitivity analysis revealed that the sensitivity of peripheral FT3 with respect to the thyroid’s secretory capacity for T4 is indeed lower when including intrathyroidal T3-secretion into the model, in accordance with the clinical study of Ref. (10).
While the present report deals primarily with technical aspects of the thyroid pituitary feedback regulation, a better understanding of the underlying control system is of high clinical interest and relevance. Currently, clinical diagnosis and treatment of thyroid disease heavily relies on an indirect approach assessing the pituitary TSH response rather than circulating free thyroid hormones, FT3 and FT4 (21). The application is based on the underlying assumption that pituitary TSH in equilibrium at all times provides an accurate mirror image of the peripheral hormones. However, recent evidence has challenged this simplistic tenet suggesting that the HPT axis is a much more dynamic system than has been previously thought (5, 22). In particular, the interrelationships between FT3, FT4, and TSH are less constantly fixed, rather conditional and contextualy adaptive (5, 22). Mathematical modeling presented in this study confirms and advances the theoretical framework that is emerging from recent clinical studies. Given the high prevalence of subclinical thyroid disorders in the population, being as high as 10% in middle aged women, the epidemiological and therapeutic implications are substantial. From the performed sensitivity analysis in the present study, important insights into the functionality of the HPT axis have been obtained. These include the robustification of TSH production through the ultrashort feedback loop in the pituitary, as well as a possible explanation why in clinical practice, diagnosis of wrong subclinical hypothyroidism is much more common than diagnosis of wrong subclinical hyperthyroidism.
In particular, the upper reference limit for TSH has been a matter of fierce debate for a decade (23). According to our models, the issue appears to be more fundamentally rooted. This relates to a substantial error rate, depending on the statistical analytical technique used, in the conventional disease classification based solely on statistical TSH abnormality (24). The relative variability in TSH rises even further with higher TSH concentrations in subclinical hypothyroidism (25). Recent guidelines have raised the clinical threshold for therapeutic intervention in subclinical hypothyroidism to a TSH level of 10 mU/l, whereas the laboratory-based disease definition continues to rely on the upper reference limit of approx. 4 mU/l (21). A better understanding and refined mathematical expression of hypothalamic–pituitary regulation in allostatic reactions (22), in thyrotropic insufficiency (26), and in situations of imminent thyroid failure (9, 27) as well as in their interactions may help reconcile this discrepancy that poses a considerable challenge to clinical decision-making.
Future work should focus on the further extension of the model to include currently unmodeled phenomena and mechanisms, such as, e.g., non-classical thyroid hormone signaling (28) and compartment models for the incorporation of membrane transport processes, which are increasingly understood as a regulatory element in their own right (29, 30). We would also aim to define the steady-state more narrowly and precisely for individual subjects under different conditions in an attempt to reduce the high uncertainty surrounding TSH measurements at the upper limit of its reference range. In general, obtaining further insight into the overall functionality of the hypothalamic–pituitary–thyroid feedback loop and developing suitable and detailed enough mathematical models might eventually pave the way for designing optimal medication strategies for various non-euthyroid states of human hormone homeostasis.
Author Contributions
JB and MM drafted the manuscript. JB performed the simulations using Matlab/Simulink. Figure 1 was designed by JD and modified by JB, all other figures were created by JB. The deidentified data used for the parameter identification was provided by RH. All authors read and approved the manuscript.
Conflict of Interest Statement
JD received funding and personal fees by Sanofi-Henning, Hexal AG, Bristol-Myers Squibb, and Pfizer and is co-owner of the intellectual property rights for the patent “System and Method for Deriving Parameters for Homeostatic Feedback Control of an Individual” (Singapore Institute for Clinical Sciences, Biomedical Sciences Institutes, Application Number 201208940-5, WIPO number WO/2014/088516). All other authors declare that the research was conducted in the absence of any commercial or financial relationships that could be construed as a potential conflict of interest.
Acknowledgments
We wish to thank Professor Rolf Larisch, Director of the Department of Nuclear Medicine, Klinikum Lüdenscheid, Germany for supporting this project and supplying data.
Funding
MM is indebted to the Baden-Württemberg Stiftung for the financial support of this research project by the Eliteprogramme for Postdocs. The open-access publication fees were paid by the Open-Access-Publikationsfonds of the University of Stuttgart.
Supplementary Material
The Supplementary Material for this article can be found online at https://www.frontiersin.org/articles/10.3389/fendo.2018.00091/full#supplementary-material.
Footnotes
- ^The initial hormone values for the simulations shown in Figure 3 (and for all subsequent simulation runs) were chosen as the stationary mean values of the model, i.e. as the hormone values the model yields for a constant TRH input. Note, however, that the choice of initial values is not particularly important for the simulation, as long as they lie somewhere in the euthyroid range.
- ^The definition of S is such that it measures the sensitivity locally around a given nominal parameter value p0 along a solution trajectory of system (3), which is why it is typically called first-order sensitivity. In the following, for brevity, we just use the term sensitivity.
- ^For the simulation runs shown in Figure 4 and in all subsequent dynamic sensitivity curves, the initial sensitivity is set to zero [cf. also the initial condition S(t0)=0 in (4)]
References
1. Dietrich JW. Der Hypophysen-Schilddrüsen-Regelkreis: Entwicklung und klinische Anwendung eines nichtlinearen Modells. In: Schardt F, editor. Spektrum medizinischer Forschung (Vol. 2), Berlin: Logos-Verlag (2002).
2. Dietrich JW, Tesche A, Pickardt CR, Mitzdorf U. Thyrotropic feedback control: evidence for an additional ultrashort feedback loop from fractal analysis. Cybern Syst (2004) 35(4):315–31. doi:10.1080/01969720490443354
3. Eisenberg M, Samuels M, DiStefano JJ III. Extensions, validation, and clinical applications of a feedback control system simulator of the hypothalamo-pituitary-thyroid axis. Thyroid (2008) 18(10):1071–85. doi:10.1089/thy.2007.0388
4. Dietrich JW, Landgrafe G, Fotiadou EH. TSH and thyrotropic agonists: key actors in thyroid homeostasis. J Thyroid Res (2012) 2012:29. doi:10.1155/2012/351864
5. Hoermann R, Midgley JE, Larisch R, Dietrich JW. Homeostatic control of the thyroid-pituitary axis: perspectives for diagnosis and treatment. Front Endocrinol (2015) 6:177. doi:10.3389/fendo.2015.00177
6. Hoermann R, Midgley JEM, Larisch R, Dietrich JW. Relational stability in the expression of normality, variation, and control of thyroid function. Front Endocrinol (2016) 7:142. doi:10.3389/fendo.2016.00142
7. Dietrich JW, Landgrafe-Mende G, Wiora E, Chatzitomaris A, Klein HH, Midgley JE, et al. Calculated parameters of thyroid homeostasis: emerging tools for differential diagnosis and clinical research. Front Endocrinol (2016) 7:57. doi:10.3389/fendo.2016.00057
8. Leow MK-S, Goede SL. The homeostatic set point of the hypothalamus-pituitary-thyroid axis – maximum curvature theory for personalized euthyroid targets. Theor Biol Med Model (2014) 11:35. doi:10.1186/1742-4682-11-35
9. Hoermann R, Midgley J, Dietrich J, Larisch R. Dual control of pituitary thyroid stimulating hormone secretion by thyroxine and triiodothyronine in athyreotic patients. Ther Adv Endocrinol Metab (2017) 8(6):83–95. doi:10.1177/2042018817716401
10. Hoermann R, Midgley JEM, Larisch R, Dietrich JW. Integration of peripheral and glandular regulation of triiodothyronine production by thyrotropin in untreated and thyroxine-treated subjects. Horm Metab Res (2015) 47(9):674–80. doi:10.1055/s-0034-1398616
11. Hoermann R, Midgley JEM, Larisch R, Dietrich JW. Is pituitary TSH an adequate measure of thyroid hormone-controlled homoeostasis during thyroxine treatment? Eur J Endocrinol (2013) 168:271–80. doi:10.1530/EJE-12-0819
12. Hoermann R, Midgley JEM, Giacobino A, Eckl WA, Wahl HG, Dietrich JW, et al. Homeostatic equilibria between free thyroid hormones and pituitary thyrotropin are modulated by various influences including age, body mass index and treatment. Clin Endocrinol (2014) 81:907–15. doi:10.1111/cen.12527
13. Ishii H, Inada M, Tanaka K, Mashio Y, Naito K, Nishikawa M, et al. Induction of outer and inner ring monodeiodinases in human thyroid gland by thyrotropin. J Clin Endocrinol Metab (1983) 57:500–5. doi:10.1210/jcem-57-3-500
14. Beech SG, Walker SW, Arthur JR, Lee D, Beckett GJ. Differential control of type-I iodothyronine deiodinase expression by the activation of the cyclic AMP and phosphoinositol signalling pathways in cultured human thyrocytes. J Mol Endocrinol (1995) 14:171–7. doi:10.1677/jme.0.0140171
15. Morimura T, Tsunekawa K, Kasahara T, Seki K, Ogiwara T, Mori M, et al. Expression of type 2 iodothyronine deiodinase in human osteoblast is stimulated by thyrotropin. Endocrinology (2005) 146:2077–84. doi:10.1210/en.2004-1432
16. Russell W, Harrison RF, Smith N, Darzy K, Shalet S, Weetman AP, et al. Free triiodothyronine has a distinct circadian rhythm that is delayed but parallels thyrotropin levels. J Clin Endocrinol Metab (2008) 93(6):2300–6. doi:10.1210/jc.2007-2674
17. Pilo A, Iervasi G, Vitek F, Ferdeghini M, Cazzuola F, Bianchi R. Thyroidal and peripheral production of 3,5,3’-triiodothyronine in humans by multicompartmental analysis. Am J Physiol (1990) 258(4 Pt 1):E715–26.
18. Bianco AC, Salvatore D, Gereben B, Berry MJ, Larsen PR. Biochemistry, cellular and molecular biology, and physiological roles of the iodothyronine selenodeiodinases. Endocr Rev (2002) 23:38–89. doi:10.1210/edrv.23.1.0455
19. Jansen SW, Roelfsema F, van der Spoel E, Akintola AA, Postmus I, Ballieux BE, et al. Familial longevity is associated with higher TSH secretion and strong TSH-FT3 relationship. J Clin Endocrinol Metab (2015) 100(10):3806–13. doi:10.1210/jc.2015-2624
21. Jonklaas J, Bianco AC, Bauer AJ, Burman KD, Cappola AR, Celi FS, et al. Guidelines for the treatment of hypothyroidism: prepared by the American thyroid association task force on thyroid hormone replacement. Thyroid (2014) 24(12):1670–751. doi:10.1089/thy.2014.0028
22. Chatzitomaris A, Hoermann R, Midgley JE, Hering S, Urban A, Dietrich B, et al. Thyroid allostasis-adaptive responses of thyrotropic feedback control to conditions of strain, stress and developmental programming. Front Endocrinol (2017) 8:163. doi:10.3389/fendo.2017.00163
23. Laurberg P, Andersen S, Carlé A, Karmisholt J, Knudsen N, Pedersen IB. The TSH upper reference limit: where are we at? Nat Rev Endocrinol (2011) 7(4):232–9. doi:10.1038/nrendo.2011.13
24. Hoermann R, Larisch R, Dietrich JW, Midgley JEM. Derivation of a multivariate reference range for pituitary thyrotropin and thyroid hormones: diagnostic efficiency compared with conventional single-reference method. Eur J Endocrinol (2016) 174:735–43. doi:10.1530/EJE-16-0031
25. Karmisholt J, Andersen S, Laurberg P. Variation in thyroid function tests in patients with stable untreated subclinical hypothyroidism. Thyroid (2008) 18(3):303–8. doi:10.1089/thy.2007.0241
26. Eisenberg MC, Santini F, Marsili A, Pinchera A, DiStefano JJ III. TSH regulation dynamics in central and extreme primary hypothyroidism. Thyroid (2010) 20(11):1215–28. doi:10.1089/thy.2009.0349
27. Falaschi P, Martocchia A, Proietti A, D’Urso R, Gargano S, Culasso F, et al. The hypothalamic-pituitary-thyroid axis in subjects with subclinical thyroid diseases: the impact of the negative feedback mechanism. Neuro Endocrinol Lett (2004) 25(4):292–6.
28. Flamant F, Cheng SY, Hollenberg AN, Moeller LC, Samarut J, Wondisford FE, et al. Thyroid hormone signaling pathways: time for a more precise nomenclature. Endocrinology (2017) 158(7):2052–7. doi:10.1210/en.2017-00250
29. Alkemade A, Friesema EC, Kalsbeek A, Swaab DF, Visser TJ, Fliers E. Expression of thyroid hormone transporters in the human hypothalamus. J Clin Endocrinol Metab (2011) 96(6):967–71. doi:10.1210/jc.2010-2750
Keywords: thyroid hormones, pituitary–thyroid feedback loop, mathematical modeling, diagnosis, TSH-T3-shunt, sensitivity analysis
Citation: Berberich J, Dietrich JW, Hoermann R and Müller MA (2018) Mathematical Modeling of the Pituitary–Thyroid Feedback Loop: Role of a TSH-T3-Shunt and Sensitivity Analysis. Front. Endocrinol. 9:91. doi: 10.3389/fendo.2018.00091
Received: 11 September 2017; Accepted: 26 February 2018;
Published: 21 March 2018
Edited by:
Francesco S. Celi, Virginia Commonwealth University, United StatesReviewed by:
Stephen Merrill, Marquette University, United StatesRiccardo Zucchi, University of Pisa, Italy
Copyright: © 2018 Berberich, Dietrich, Hoermann and Müller. This is an open-access article distributed under the terms of the Creative Commons Attribution License (CC BY). The use, distribution or reproduction in other forums is permitted, provided the original author(s) and the copyright owner are credited and that the original publication in this journal is cited, in accordance with accepted academic practice. No use, distribution or reproduction is permitted which does not comply with these terms.
*Correspondence: Matthias A. Müller, bWF0dGhpYXMubXVlbGxlckBpc3QudW5pLXN0dXR0Z2FydC5kZQ==