 Martina Musutova1
 Moustafa Elkalaf2
 Natalie Klubickova1Michal Koc1
 Stanislav Povysil1
 Jan Rambousek1Beatriz Volckaert1Frantisek Duska3
 Minh Duc Trinh1Martin Kalous4Jan Trnka2Kamila Balusikova5Jan Kovar5
 Jan Polak1*
- 1Department for the Study of Obesity and Diabetes, Third Faculty of Medicine, Charles University, Prague, Czechia
- 2Department of Biochemistry, Cell and Molecular Biology, Third Faculty of Medicine, Charles University, Prague, Czechia
- 3Department of Anesthesiology and Intensive Care, Third Faculty of Medicine, Charles University, Prague, Czechia
- 4Department of Cell Biology, Faculty of Science, Charles University, Prague, Czechia
- 5Division of Cell and Molecular Biology, Third Faculty of Medicine, Department of Biochemistry, Cell and Molecular Biology & Center for Research of Diabetes, Metabolism and Nutrition, Charles University, Prague, Czechia
Metabolic impairments associated with obstructive sleep apnea syndrome (OSA) are linked to tissue hypoxia, however, the explanatory molecular and endocrine mechanisms remain unknown. Using gas-permeable cultureware, we studied the chronic effects of mild and severe hypoxia on free fatty acid (FFA) uptake, storage, and oxidation in L6 myotubes under 20, 4, or 1% O2. Additionally, the impact of metformin and the peroxisome proliferator-activated receptor (PPAR) β/δ agonist, called GW501516, were investigated. Exposure to mild and severe hypoxia reduced FFA uptake by 37 and 32%, respectively, while metformin treatment increased FFA uptake by 39% under mild hypoxia. GW501516 reduced FFA uptake under all conditions. Protein expressions of CD36 (cluster of differentiation 36) and SCL27A4 (solute carrier family 27 fatty acid transporter, member 4) were reduced by 17 and 23% under severe hypoxia. Gene expression of UCP2 (uncoupling protein 2) was reduced by severe hypoxia by 81%. Metformin increased CD36 protein levels by 28% under control conditions and SCL27A4 levels by 56% under mild hypoxia. Intracellular lipids were reduced by mild hypoxia by 18%, while in controls only, metformin administration further reduced intracellular lipids (20% O2) by 36%. Finally, palmitate oxidation was reduced by severe hypoxia, while metformin treatment reduced non-mitochondrial O2 consumption, palmitate oxidation, and proton leak at all O2 levels. Hypoxia directly reduced FFA uptake and intracellular lipids uptake in myotubes, at least partially, due to the reduction in CD36 transporters. Metformin, but not GW501516, can increase FFA uptake and SCL27A4 expression under mild hypoxia. Described effects might contribute to elevated plasma FFA levels and metabolic derangements in OSA.
Introduction
Obstructive sleep apnea syndrome (OSA) is a chronic disorder characterized by periodic upper airway narrowing or complete occlusion during sleep followed by blood hemoglobin desaturation (tissue hypoxemia) and sleep fragmentation. With a prevalence of 5–15% in the general population (1), OSA represents a significant health burden. Several independent studies have identified OSA as a risk factor for hypertension, cardiovascular disease, as well as all-cause mortality, which is independent of other risk factors (2, 3). More recently, studies have indicated that OSA represents a strong risk factor for glucose intolerance, insulin resistance, and type 2 diabetes mellitus (T2DM) when adjusted for confounding variables (e.g., obesity, age, and sex) (4, 5).
Even though cross-sectional as well as prospective studies documented association between OSA and impaired glucose metabolism, the mechanisms mediating this link remain only partially understood (4). Mimicking hemoglobin desaturation observed in OSA patients by exposing humans or rodents to intermittent hypoxia (IH) demonstrated that IH is sufficient to impair fasting and post-challenge glucose levels, diminish insulin sensitivity in muscle tissue and the liver, and reduce pancreatic insulin production (6–10). Among the explanatory molecular mechanisms suggested, activation of the sympathetic nervous system, oxidative stress, stimulation of pro-inflammatory pathways together with increased corticosteroid levels or endothelin-1 signaling have been suggested (4, 11). More recently, interest has focused on the role of circulating free fatty acids (FFA) as a possible mediator of OSA-associated impairments in glucose homeostasis as researchers reported increased FFA levels after intermittent hypoxic exposure in humans and mice (12–14). Importantly, prolonged exposure to elevated plasma FFA levels was shown to induce insulin resistance in muscle and liver tissue (15) as well as impair insulin secretion (16), thus causally contributing to the development of T2DM (17).
Plasma FFA levels are determined by the balance between FFA release from adipose tissue (predominantly through lipolysis) and FFA uptake/oxidation by liver and muscle tissue (18). Although the cause of FFA elevation in the context of OSA and intermittent hypoxia remains to be determined, recent studies have reported that hypoxia stimulates lipolysis in both adipocytes in vitro as well as in mouse epididymal adipose tissue (13, 19). Direct measurements of tissue oxygen levels performed during IH (a model of OSA) suggest that skeletal muscle experiences profound hypoxia reaching O2 levels of ≈ 26 mmHg (20). The specific effects of hypoxic exposure on FFA uptake and oxidation still remain unclear even though a detailed understanding of FFA turnover in OSA is of significant clinical importance, since lipolysis, as well as FFA oxidation, represent proven pharmacological targets (21). It could be hypothesized, that decreased FFA uptake and/or oxidation in skeletal muscle during hypoxia might contribute to elevated circulating FFA or directly alter intracellular insulin signaling in myocytes.
The aim of this study was to assess the direct effects of mild (4% O2) and severe (1% O2) hypoxia on FFA uptake, storage, and oxidation in differentiated L6 myotubes. We also investigated, whether pharmacological treatment with metformin or PPAR β/δ agonist could alleviate hypoxia-induced changes in FFA metabolism as metformin was showed previously to reduce intramyocellular lipid accumulation as well to reduce expression of fatty acid transporters and fatty acid oxidation genes in skeletal muscle and liver (22, 23). Similarly, PPAR β/δ activation promotes fatty acid oxidation in skeletal muscle (24). To address these questions, a novel approach utilizing gas-permeable cultureware with a membrane-bottom was employed. This system enables rapid exchange of gases through the membrane, which allows for prolonged exposure of cultured cells to predictable levels of pericellular O2 (25, 26).
Materials and Methods
Cell Culture, Exposure to Hypoxia, and Treatment With Chemicals
Rat L6-C11 skeletal muscle cells (European Collection of Cell Cultures, Cat. No. 92102119) were expanded up to passage number 10, and subsequently plated in a 24-well fluorocarbon-bottom dishes (Cat. No. 94.6000.014, Sarstedt AG & Co, Nümbrecht, Germany) at a density of 4,000 cells/cm2 and cultured in a CO2 incubator at 37°C in Dulbecco's Modified Eagle's Medium (DMEM, Cat. No. D6429) supplemented with 10% v/v Fetal bovine serum (FBS, Cat. No. F6178), 1% v/v Penicillin-Streptomycin (Cat. No. P4333), and 1% v/v HEPES (Cat. No. H0887), which was replaced every 48 h until cells reached confluence (7 days). After reaching confluence, concentration of FBS was reduced to 2% to accelerate spontaneous differentiation into myotubes (successful differentiation was evaluated by visual inspection confirming a change in phenotype from individual spindle-like cells to multinucleated tubular structures). Cells were incubated with or without pharmacological treatments and dishes were placed in modular hypoxic incubators (Billups-Rothenberg Inc., Del Mar, CA, USA). Mild and severe hypoxic exposures were achieved by flushing the respective modular incubators with calibration-quality gas mixtures of 4% O2 + 5% CO2 or 1% O2 + 5% CO2 (Linde Gas a.s., Prague, Czech Republic). Control exposures were performed in a standard CO2 incubator (20% O2 + 5% CO2). Cells were subsequently cultured for an additional 7 days, with the media being changed every 48 h; the cells were then used for lipid uptake and oxidation assays described below.
The effect of the following drugs during control and hypoxic exposures was investigated: 2 mM metformin (Cat. No. PHR1064), and 100, 500 nM, and 1 μM GW501516 (Cat. No. SML1491). Cells and chemicals were purchased from Sigma-Aldrich (St. Louis, MO, USA).
Control experiments were performed with appropriate vehicles: water for metformin and DMSO (dimethylsulfoxide) for GW501516. Concentrations of GW501516 studied in this paper are reflecting the range of plasma concentrations observed in humans after GW501516 administration (27), although higher (5, 1 μM), as well as lower (100, 10 nM) concentrations were also reported for muscle cells in vitro in the published literature (28–31). Similarly, metformin concentration used in this paper are reflecting concentrations typically used in published studies to maximize cellular responses (32–34), while not deviating too far from plasma levels observed in humans treated with metformin, reaching 700 μM (35).
Determination of Fatty Acid Uptake
Lipid uptake was measured using fluorescently-labeled palmitate (BODIPY® FL C16, Cat. No. D3821 Thermo Fischer Scientific, Waltham, MA, USA). Differentiated cells were starved for 4 h in FBS-free medium. Subsequently, cells were washed and incubated for 3 h under normoxic or hypoxic conditions with or without the previously mentioned pharmacological compounds, in PBS (Dulbecco's Phosphate Buffered Saline, Cat. No. D8662, Sigma-Aldrich, St. Louis, MO, USA) with 1 μM of fluorescently-labeled palmitate (BODIPY FL® C16, stock prepared in DMSO) and 0.1% fatty acid free BSA (bovine serum albumin, Cat. No. A7030 Sigma-Aldrich, St. Louis, MO, USA). After incubation, cells were washed twice with 1 mL PBS and lysed in 150 μL of T-PER (Tissue-Protein Extraction Reagent, Cat. No. RL243205 Thermo Fischer Scientific, Waltham, MA, USA). Fluorescence of intracellular BODIPY-labeled palmitate was measured with an Infinite® 200 PRO (Tecan Trading AG, Switzerland) microplate reader with excitation/emission wavelengths of 470/503 nm. Data were normalized to protein concentration in each well, which was measured using a BCA assay (bicinchoninic acid assay, Cat. No. 23225 Thermo Fischer Scientific, Waltham, MA, USA).
Determination of Intracellular Lipid Stores
Intracellular lipid stores were quantified using the fluorescence lipid staining method. Cells were fixed for 1 h in 10% formalin, washed twice with 1 mL PBS, and stained with a working solution of 1 μg/mL BODIPY 493/503 (Cat. No D3922, Thermo Fischer Scientific, Waltham, MA, USA) for 30 min. Subsequently, cells were washed, lysed with T-PER and fluorescence entrapped by the cells was determined using an Infinite®200 PRO microplate reader with excitation/emission wavelengths 493/503 nm. Data are expressed as relative values compared to control conditions.
Determination of Fatty Acid Oxidation
Cells were homogenized in 10% sucrose using a motor-driven homogenizer at 800 rpm. Oxygen uptake in homogenized samples was measured using a High-Resolution Oxygraph-2K instrument (Oroboros, Innsbruck, Austria). Measurements were performed at 30°C in 2 mL of incubation medium containing 1 mM EDTA, 75 mM KCl, 5 mM KH2PO4, 3 mM MgCl2 6 H2O, and 8 mM Tris HCl, at pH 7.4. The sequence of substrate/drug additions to the measuring chamber was as follows: 1 mM malate, 1.5 mM ADP (adenosine triphosphate), 5 μM carnitine palmitoyl followed by 0.1 mM etomoxir (inhibiting FFA mitochondrial transport), 1 μM oligomycin (inhibiting ATP-synthase), and last, 4 μM antimycin A (an electron transport chain inhibitor). At each step, oxygen uptake was measured until it reached a plateau. The rate of oxygen uptake was expressed as pmol/s/mg protein determined using a BCA assay (Cat. No. 23225 Thermo Fischer Scientific, Waltham, MA, USA).
Co-localization Analysis
Cells were fixed in 4% formaldehyde for 15 min and washed with PBS. Subsequently, the nuclei were stained with Hoechst (1:300 in PBS for 15 min), lipids were stained for 2 h in 1 μg/mL BODIPY 493/503 (Prod. No. D3922, Thermo Fisher Scientific, Waltham, MA, USA) and cells were washed 3 times with PBS. Lastly, cells were permeabilized for 5 min using 0.2% Triton X (Prod. No. X100, Sigma Aldrich, St. Louis, MO, USA) and (1) incubated for 15 min with 5 μg/mL of Lectin HPA Alexa Fluor® 647 conjugate (Prod. No. L32454, Thermo Fisher Scientific, Waltham, MA, USA) to visualize the Golgi apparatus or (2) blocked with 1% BSA (bovine serum albumin, Prod. No. A7030, Sigma Aldrich, St. Louis, MO, US) for 1 h and incubated overnight with 1:100 anti-PMP70 (The 70-kDa peroxisomal membrane protein) rabbit monoclonal antibody conjugated with Alexa Fluor® 647 (ab199019, Abcam, Cambridge, UK) to visualize peroxisomes. Nuclei counterstaining was performed using Hoechst 33258 (Prod. No. H1398, Thermo Fisher Scientific, Waltham, MA, USA). Images were captured using a Leica TCS SP5 confocal microscope (Leica Microsystems, Wetzlar, Germany) and digitally processed using Leica Software. Co-localization analysis was performed and expressed as an overlap coefficient.
Gene and Protein Expression Analysis
Isolated RNA was treated with DNAse (Roche Diagnostics, Mannheim, Germany) and gene expression of cluster of differentiation 36 (CD36), solute carrier family 27 fatty acid transporter, member 4 (SCL27A4), carnitine palmitoyltransferase I (CPT1), peroxisome proliferator-activated receptor gamma coactivator 1-alpha (PGC1α), uncoupling protein 2 (UCP2) glucuronidase beta (GUSB), and TATA box binding protein (TBP) was assessed using quantitative PCR (qPCR) (Applied Biosystems, Carlsbad, CA) using TaqMan probes (Product ID: Rn00580728_m1, Rn01438951_m1, Rn00682395_m1, Rn00580241_m1, Rn01754856_m1, Rn00566655_m1, Rn01455646_m1). Differences in relative gene expression was assessed using the REST software (Qiagen, Hilden, Germany) incorporating the Pfaffl's bootstrapping algorithm.
Western blotting: Protein expression of SLC27A4, CD36, and GAPDH (Glyceraldehyde 3-phosphate dehydrogenase—a loading control) was performed by western blot analysis using rabbit polyclonal antibodies (Anti-SLC27A4 antibody: ab199718, Anti-CD36 antibody: ab133625, and Anti-GAPDH antibody: ab9485, all from Abcam, Cambridge, UK). Goat anti-rabbit IgG antibody conjugated with a horseradish peroxidase (sc-2004, Santa Cruz Biotechnology (Dallas, Texas, USA) was used as a secondary antibody. Denatured proteins were separated electrophoretically on an SDS/12% polyacrylamide gel at 125 V using a Criterion Cell (Bio-Rad, Hercules, CA, USA) and then blotted onto a 0.2 μm nitrocellulose membrane for 1.5 h at 100 V, using a Criterion Wire Blotter System (Bio-Rad, Hercules, CA, USA). The membranes for SLC27A4 and GAPDH quantification were blocked with 5% BSA in TBS (100 mM Tris-HCl, 150 mM NaCl, pH = 7.5) for 30 min, the membrane for CD36 was blocked with 5% non-fat milk in TBS for 30 min. After washing with TBST (TBS + 0.1% Tween-20), the membranes were incubated with the relevant primary antibody and incubated for 2 h with the corresponding secondary antibody. After washing, detection was performed using enhanced chemiluminescence method with SuperSignal West Pico PLUS Chemiluminescent Substrate (Pierce, Rockford, IL, USA) and a Gel Logic 4000 PRO Imaging System (Carestream Health, New Haven, CT, USA). Band intensities were quantified using Image J software (National Institutes of Health, Bethesda, USA). Band intensities of CD36 and SLC27A4 were normalized to GAPDH signal.
Statistical Analysis and Calculations
The effect of hypoxia on the outcome variables was analyzed using the ANOVA test with Tukey's post-hoc analysis using GraphPad (GraphPad Software, Inc., La Jolla, CA, USA). The effect of the pharmacological substances on the outcome variables under various O2 levels was analyzed using the 2-way ANOVA and interactions between pharmacological treatment and O2 levels was determined. Data are presented as mean ± SEM. A value of p < 0.05 was considered significant.
Results
The Effect of Hypoxia, Metformin, and PPAR β/δ Agonist on FFA Uptake in L6 Myotubes
Exposure to pericellular O2 levels of 4 and 1% for 7 days decreased FFA uptake in differentiated L6 myotubes by 37% (36718 ± 3585 vs. 23249 ± 1810 AU/mg protein, p < 0.001) and 32%, respectively (36718 ± 3585 vs. 24922 ± 1822 AU/mg protein, p < 0.001). There was no additive effect associated with severe (1%) compared to moderate (4%) hypoxia on FFA uptake (Figure 1A). Acute treatment with 2 mM metformin had no effect on FFA uptake at 20% O2, however 7-h metformin administration increased FFA uptake at 4% O2 and 1% O2 by 31 and 26% (Figure 1B). Similarly, 7-day metformin treatment increased FFA uptake by 39 and 17% respectively; however, a significant interaction between hypoxia and metformin treatment was only achieved after 7-days of metformin treatment (2-way ANOVA, p < 0.05 for interaction), Figure 1C. As a result, 7-day treatment was further investigated in subsequent analyses. Treatment with 100, 500 nM, and 1 μM GW501516 (PPAR β/δ agonist) reduced FFA uptake under control and hypoxic conditions (Figure 1D).
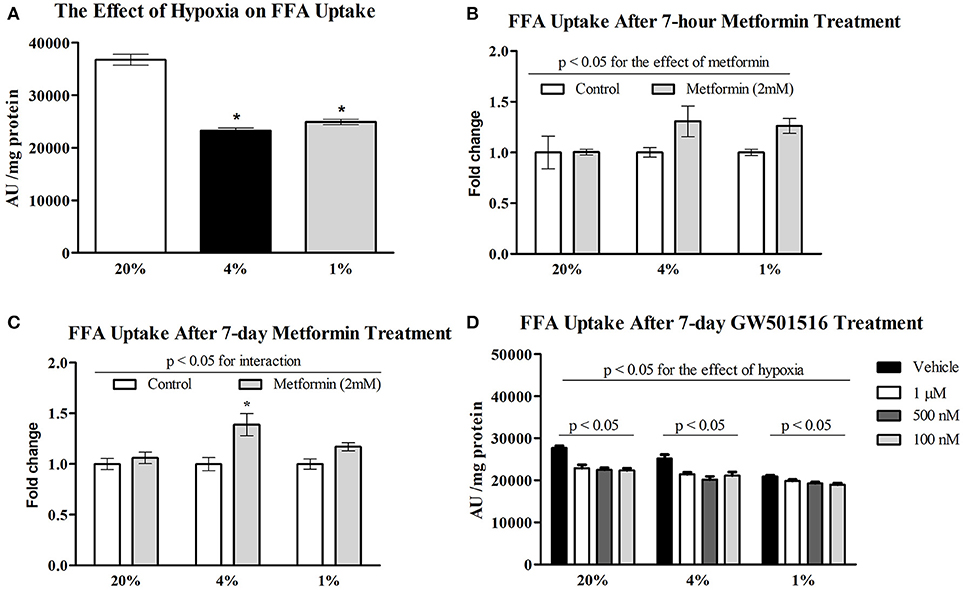
Figure 1. Effect of hypoxia on FFA uptake relative to metformin and GW501516 treatment. The effect of 4% O2 and 1% O2 hypoxia on FFA uptake (A) the impact of acute (B) and prolonged (C) 2 mM metformin administration on FFA uptake; and the effect of various concentrations of GW501516 (a PPAR β/δ agonist) on FFA uptake (D). *p < 0.05 for comparison with control exposures (20% O2, ANOVA), n = 12 (A,C), n = 6 (B,D). Two-way ANOVA was used to explore interaction between exposure to hypoxia and metformin treatment.
The Effect of Hypoxia and Metformin on Gene and Protein Expression of FFA Transporters
Protein expression of CD36 transporter was not affected by mild hypoxia (0.63 ± 0.04 vs. 0.61 ± 0.13, p > 0.05), but dropped by 17% under severely hypoxic (1% O2) conditions (0.63 ± 0.04 vs. 0.52 ± 0.03, p < 0.05), Figure 2A. Identical pattern was observed for SCL27A4 protein expression, remaining unchanged after mild hypoxia (1.08 ± 0.09 vs. 1.08 ± 0.12, p > 0.05) but decreasing with severe hypoxic exposure (1.08 ± 0.09 vs. 0.82 ± 0.06, p < 0.05), Figure 2B. Gene expression of fatty acid transporters was differentially modulated by hypoxia in L6 myotubes, while expression of CD36 decreased by 61% and 50% (both p < 0.05) after exposure to 4 and 1% O2, expression of SCL27A4 increased by 30 and 17% (both p < 0.05) in 4 and 1% O2, respectively, Figure 3A. Exposure to 1% O2 (but not 4% O2) also decreased expression of mitochondrial uncoupling protein UCP2 by 81% (p < 0.05), Figure 3A. Data are summarized in Supplementary Material Table 1.
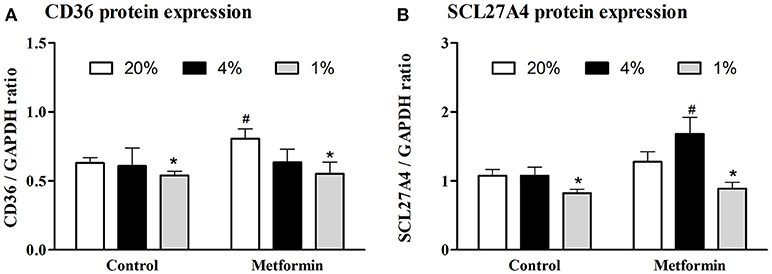
Figure 2. Protein expression of FFA protein transporters. The effect of mild (4% O2) and severe (1% O2) hypoxia (A) and metformin administration (B) on CD36 and SCL27A4 protein expression. *p < 0.05 for comparison with control exposures (20% O2, unpaired T-test), #p < 0.05 for comparison with vehicle-treated group (unpaired T-test), n = 6–9.
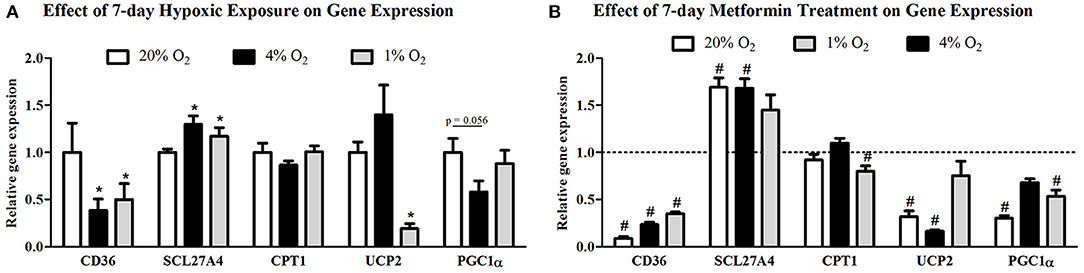
Figure 3. Gene expression of FFA protein transporters and key regulators of mitochondria metabolism. The effect of mild (4% O2) and severe (1% O2) hypoxia (A) and metformin administration (B) on CD36, SCL27A4, CPT1, UCP2, and PGC1α gene expression. *p < 0.05 for comparison with control exposures (20% O2), #p < 0.05 for comparison with vehicle-treated group, n = 6. Gene expression data were analyzed using the REST Software (Qiagen, Hilden, Germany) based on the Pfaffl's method.
Metformin treatment increased FFA transporter SCL27A4 protein expression by 55% (1.08 ± 0.12 vs. 1.68 ± 0.24, p < 0.05) (Figure 2B) as well as its gene expression by 30% (p < 0.05) (Figure 3B) under control conditions and mild hypoxia, while gene expression of CD36 was reduced by 91, 75, and 65% (all p < 0.05) with metformin treatment under 20, 4, and 1% O2, respectively (Figure 3B). Protein expression of CD36 was moderately elevated by 28% with metformin administration under control conditions only (0.63 ± 0.04 vs. 0.81 ± 0.07, p < 0.05) (Figure 2A). Metformin administration also reduced gene expression of PGC1α and UCP2 under control conditions and under 4% O2 (UCP2) and 1% O2 (PGC1α). Gene expression of the key regulator of FFA oxidation (CPT1) remained unaffected by hypoxia or metformin treatment (Figures 3A,B). Data and Western blot pictures are provided in Supplemental Data Sheet 1.
The Effect of Hypoxia and Metformin on FFA Oxidation
The influence of hypoxia on mitochondrial and non-mitochondrial O2 consumption was investigated in L6 myotube lysates. As summarized in Figure 4, severe hypoxia (1% O2) reduced palmitate oxidation (27.5 ± 8.3 vs. 12.5 ± 4.2 pmol/s/mg protein, p = 0.05, Figure 4B), however, other parameters were not affected by pericellular O2 levels. In contrast, metformin treatment reduced non-mitochondrial O2 consumption, palmitate oxidation as well as proton leak under at all tested O2 levels, Figures 4A,C.
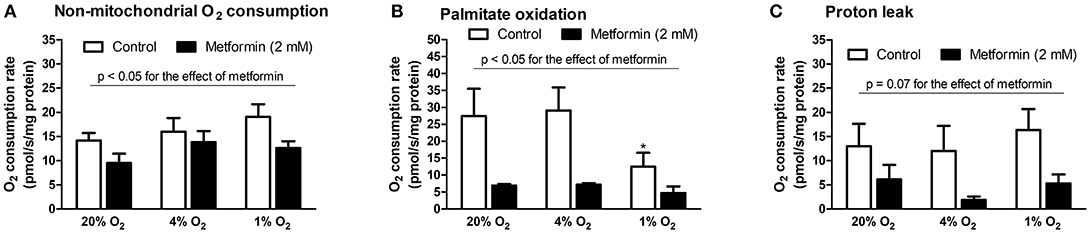
Figure 4. Mitochondrial respiration analysis during hypoxia with metformin administration. (A) Non-mitochondrial respiration (residual O2 consumption rate after addition of oligomycin), (B) palmitate oxidation (O2 consumption rate after addition of palmitoyl-carnitine subtracted from O2 consumption rate after addition of etomoxir), (C) mitochondrial proton leak (O2 consumption rate after addition of antimycin A subtracted from O2 consumption rate after addition of oligomycin). *p < 0.05 for comparison with control exposures (20% O2), n = 8 (control conditions), n = 4 (metformin administration). Two-way ANOVA was used to explore interaction between exposure to hypoxia and metformin treatment.
The Effect of Hypoxia and Metformin on Intracellular Lipid Stores
Intracellular lipids were localized in two forms within L6 myotubes, as shown in Figure 5A: (1) as diffusely spread throughout the cytoplasm and (2) concentrated inside cytoplasmic vesicles positively staining for PMP70 (a 70-kDa peroxisomal membrane protein). Exposure to 4% O2 reduced total intracellular lipid stores by 18% (AU: 638 ± 27.5 vs. 520.3 ± 26.4, p < 0.05). Metformin administration decreased total lipid content under control conditions (20% O2) by 36% (AU: 638 ± 27.5 vs. 406.6 ± 28.2, p < 0.05); however, no effect of metformin was observed under hypoxic conditions (AU: 520.3 ± 26.4 vs. 570.8 ± 46.4, p > 0.05), Figure 5B. Less lipids were localized in peroxisomes under 1% O2 and 4% O2 hypoxia compared to control conditions (overlap coefficient: 0.66 ± 0.02 and 0.68 ± 0.03 vs. 0.74 ± 0.01, respectively, p < 0.05), while co-localization of lipids with the Golgi apparatus remained unchanged (overlap coefficient: 0.58 ± 0.03, 0.46 ± 0.08, and 0.54 ± 0.04 for 20, 4, and 1% O2, respectively, p > 0.05).
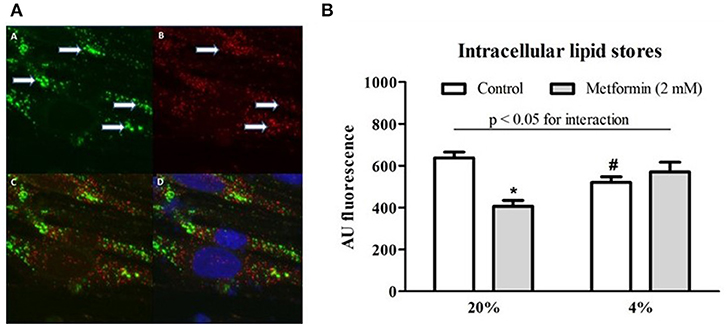
Figure 5. Lipid co-localization imaging and total intracellular lipid content. (A) A representative example of a microscope image of lipids stained with BODIPY 493/503 (green) forming distinct vesicular structures marked by arrows (A), staining (red) for peroxisome-specific protein PMP70 (B), merged image of lipid and PMP70 staining (C) and merged image of lipid, PMP70, and nuclei staining (blue) with Hoechst 33258 (D). (B) Total lipid content during hypoxia and after metformin treatment The effect of hypoxic exposure (4% O2) and 7-day metformin administration on total lipid content in differentiated L6 myotubes. *p < 0.05 for comparison with vehicle-treated cells, #p < 0.05 for comparison with control exposures (20% O2), n = 6. Two-way ANOVA was used to explore interaction between exposure to hypoxia and metformin treatment.
Discussion
The present study utilized a validated membrane-bottom cultureware technology (25), enabling long-term exposure of adherent cells to desired oxygen levels in the pericellular space, to assess the effects of moderate (4% O2) and severe (1% O2) hypoxia on lipid uptake and metabolism in differentiated L6 myotubes. We observed that both moderate and severe hypoxia reduced FFA uptake and intracellular lipid stores in peroxisomes, which was probably due the inability to oxidize FFA under hypoxic conditions together with mild reduction in FFA transporter proteins (in severe hypoxia). Metformin administration for 7 days increased FFA uptake, increased gene expression of the FFA transport protein, SCL27A4, and reduced palmitate oxidation, which prevented a hypoxia-induced decline in intracellular lipid stores.
The overarching goal of this study was to assess the role of modified FFA metabolism in skeletal muscle as a possible causative mechanism mediating the established link between obstructive sleep apnea syndrome (OSA) and the development of type 2 diabetes (4, 36, 37). The present study provided two potential mechanisms for hypoxia-induced metabolic derangements: first, decreased FFA uptake in myotubes exposed to hypoxia might, together with increased lipolysis in adipose tissue (19, 13), contribute to elevated levels of FFA in OSA patients (38) and lead to development of pancreatic β-cell dysfunction and insulin resistance in liver and muscle (17, 39, 40). Second, reduced FFA oxidation, which was observed under severe hypoxia, represents a feature typically observed in obese and type 2 diabetes subjects causally associated with increased intracellular lipid content, impaired insulin signaling, and reduced glucose uptake (41–44). In-vitro studies of cultured cells have proved useful in OSA research since they allow for investigation of the direct effects of hypoxia separated from the interference of other factors typically observed in OSA, e.g., sleep fragmentation, endocrine adaptations, and autonomic nervous system contributions (4). Direct tissue oxygen levels recordings in mice revealed that under conditions equivalent to severe OSA with 60 hypoxic episodes per hour, skeletal muscles becomes profoundly and nearly continually hypoxic with tissue O2 levels ranging from ≈ 2 to 5% O2 (20). The levels of mild and severe hypoxia (4 and 1% O2), as defined in the present study, not only reflect tissue O2 levels expected in severe OSA, but also allow for assessment of mechanisms associated with hypoxia-inducible factor 1 (HIF-1) activation, which starts at O2 levels of 4–5% and reaches a maximum at 0.5% O2 (45, 46).
Uptake of FFA across the sarcolemma membrane happens partially through passive diffusion, however, its facilitation by protein transporters (e.g., CD36, FABPpm, and SCL27A4) has been demonstrated in various cell types including heart and muscle, together with their regulation by physiological stimuli (47–50). As oxygen availability significantly modulates energy metabolism (51), several groups investigated the effect of hypoxia on expression and localization of FFA transporters. In fact, it has been shown that acute hypoxic exposure increased CD36 expression, plasma membrane localization and FFA uptake in cardiomyocytes (52) and decreased expression of SCL27A4 in placenta (53). Furthermore, it has been shown that CD36 levels are acutely regulated by HIF-1 dependent mechanisms (54). In contrast, human experiments documented that acute hypoxia increased circulating FFA levels (55, 56). Although our observations contradict some of these reports, it needs to be emphasized that our study (employing a gas-permeable cultureware) investigated the response of cells to a prolonged, 7-day, hypoxic exposure (as compared to minutes or hours of hypoxia in the mentioned studies). It is plausible to hypothesize, that acute hypoxia-induced changes differ markedly from adaptive, long-term, effects of hypoxia. In fact, up-regulation of HIF-1 by hypoxia shows a transient pattern with a peak activation detected few hours after the hypoxic exposure followed by a long-term decline (57–59). Additionally, reduced FFA uptake in hypoxic myotubes is congruent with reports demonstrating a significant reduction in skeletal muscle FFA uptake and oxidation in humans under hypoxic conditions (60, 61). These effects have been associated with reduced mitochondrial mass, CPT-1 (carnitine-palmitoyl transferase-1), PPARα and various tricarboxylic acid cycle enzymes activity or expression in hypoxic skeletal muscle (62–65), and reflect the metabolic feature of FFA, which is that they can only be oxidized by aerobic phosphorylation. Based on our observations, hypoxia did not reduce expression of key mitochondrial FFA transporter (CPT1) nor did it significantly reduce expression of mitochondrial biogenesis and metabolism regulator (PGC1α), suggesting that limited O2 availability per se might reduce FFA oxidation. Shift toward glycolytic energy metabolism in severe hypoxia is further supported by observed reduction of UCP2 gene expression which was previously shown to limit aerobic phosphorylation and increase dependence on glucose as energy substrate (66, 67). Similarly to data previously reported in hypoxic adipocytes (68), we also observed that severe hypoxia reduced protein expression of CD36 which might further contribute to decreased FFA uptake and extended this finding to another important FFA transporter SCL27A4. However, as we did not quantify the membrane localization of both transporters, relevant for the FFA transport (69), it is possible that their contribution was underestimated due to their possible reduced localization in the plasma membrane. Importantly, differential response of both FFA transporters was observed after metformin administration which increased SCL27A4 protein expression under mild hypoxia, while both transporters were reduced by metformin in severe (1% O2) hypoxia.
Impaired glucose homeostasis observed in OSA subjects was subsequently reproduced in mice exposed to intermittent hypoxia, suggesting the key role of hypoxia. However, mice studies, as well as a recent randomized clinical trial in diabetic OSA patients, reported only limited reversibility of hypoxia-induced metabolic impairments by cessation of hypoxic exposure or OSA treatment (7, 70). These observations, combined with unsatisfactory compliance with continuous positive airway pressure (CPAP) treatment in OSA patients (71), warrants the search for possible pharmacological treatments. In the present study, the ability of metformin and GW501516 (a selective PPARβ/δ receptor agonist) to alleviate hypoxia-induced derangements in FFA metabolism was assessed. From the tested chemicals, metformin increased, while GW501516 reduced FFA uptake, even though previous reports showed the ability of GW501516 to stimulate FFA oxidation in muscle cells (29). As FFA uptake and oxidation represent two distinct processes, it can be hypothesized that GW501516 might increase FFA oxidation and, at the same time, reduce FFA uptake—this would reduce intracellular lipid stores and possibly improve cellular insulin sensitivity. In the subsequent studies, we considered GW501516 to be a suboptimal pharmacological candidate for the treatment of reduced FFA uptake (as it further reduced FFA uptake) and thus subsequently evaluated the mechanistic consequences behind the metformin effect. The results showed that metformin administration increased FFA uptake under hypoxic conditions, partially through the up-regulation of SCL27A4, however, other mechanisms, e.g., increased FFA uptake mediated by activation of AMP-activated protein kinase (AMPK) (72–74), are probably also involved. Besides the AMPK-mediated effects, metformin was identified as a potent inhibitor of mitochondrial respiratory chain complex I activity, which reduces mitochondrial capacity to oxidize substrates, e.g., malate and glutamate (75, 76). Similarly, we observed reduced palmitate oxidation and less proton leak after chronic (7 days) metformin administration, which is congruent with the limited ability to oxidize acetyl-CoA when complex I is inhibited by metformin. Although a reduction in FFA oxidation might contribute to increased intracellular lipid stores and potentially impair glucose uptake in muscles, the opposite effects have been repeatedly and independently described. For example, reduction of FFA oxidation with etomoxir increased intracellular lipid stores but at the same time enhanced insulin sensitivity, GLUT4 membrane translocation and glucose uptake in various models including humans, mice, and in-vitro experiments (76–78). Indeed, hypoxia in humans has been associated with a nearly doubled glucose uptake by muscles despite lowered FFA oxidation (55). Further investigation of the effects of prolonged hypoxia on insulin sensitivity in myotubes (e.g., insulin-stimulated glucose uptake, quantification of pAKT/AKT, or detection of insulin responsiveness genes) is needed to elucidate metabolic status of myocytes under hypoxia. Although these important variables were not measured in our study, previous reports showed that exposure of L6 myotubes to 1% O2 increased expression of GLUT1 by ~30% together with a 5-fold induction of insulin-independent glucose uptake. Surprisingly, glucose uptake under hypoxia was not stimulated by insulin administration, even though levels of IRβ (Insulin receptor-β) and IRS-1 (insulin receptor substrate-1) proteins remained unchanged (79). Additionally, protein levels, phosphorylation status and activity of AKT/pAKT were lowered by 24 h exposure to 1% O2 (80).
Intracellular localization of lipids was also investigated in the present paper to better understand intracellular lipid handling and the impact of hypoxia. We showed that intramyocellular lipids were distributed diffusely in the cytoplasm but also formed distinct vesicular structures that stained for peroxisome-specific protein PMP70. Although peroxisomes exert multiple functions, FFA β-oxidation ranks among the most preserved functions of peroxisomes across species (81). Hypoxia reduced intracellular lipid stores as well as reduced lipid localization into peroxisomes suggesting a reduction in peroxisome lipid content. These observations are in line with previous reports of inhibited peroxisome biogenesis and increased degradation of peroxisomes as a result of hypoxic exposure and hypoxia inducible factor 2α (HIF-2α) activation (82, 83). We speculate that reduction in peroxisome lipids might explain the observation of reduced total intracellular lipid content, however, further investigation involving quantitative analysis of total peroxisome abundance is warranted.
In summary, this study showed that exposure to hypoxia reduced FFA uptake in L6 differentiated myotubes, partially due to a reduction in the CD36 and SCL27A4 FFA transporters, which might contribute to elevated circulating FFA and subsequently to the development of T2DM associated with OSA. We also demonstrated the potential of metformin to alleviate hypoxia-induced impairments through increasing FFA uptake and by reducing FFA oxidation in mitochondria, thus enabling higher glucose uptake and oxidation. The present study provides a mechanistic background that partially elucidated the links between OSA and associated metabolic impairments including type 2 diabetes mellitus.
Author Contributions
MM experiments investigating FFA uptake in normoxic and hypoxic conditions, Oxygraph measurements of palmitate oxidation, sample collection for gene expression analysis, manuscript preparation. NK, SP, and BV experiments investigating the effect of metformin and GW501516 on FFA uptake. MiK gene expression analysis of all samples. ME design and performance of FFA uptake and oxidation experiments, data interpretation. JR confocal microscopy imaging, co-localization analysis, metformin effect on FFA uptake. FD, MaK, supervision and design of Oxygraph measurements, data interpretation. MT cell culture and passaging, lipid content analysis under all experimental conditions. JT and JP design, supervision and coordination of the project, data analysis and manuscript preparation. KB performed western blotting analyses in all experiments. All authors have participated in the manuscript preparation and approved its final form.
Conflict of Interest Statement
The authors declare that the research was conducted in the absence of any commercial or financial relationships that could be construed as a potential conflict of interest.
Acknowledgments
Authors would like to thank Sarka Fleischerova for technical assistance. The project was supported by a grant from the Czech Ministry of Health (AZV 15-30155A) and grants from Charles University (GAUK 2017/18217 and Progres Q36).
Supplementary Material
The Supplementary Material for this article can be found online at: https://www.frontiersin.org/articles/10.3389/fendo.2018.00616/full#supplementary-material
Abbreviations
ADP, Adenosine diphosphate; AKT, Protein kinase B; BCA, Bicinchoninic acid assay; BSA, Bovine serum albumin; CD36, Cluster of differentiation protein 36; CPAP, Continuous positive airway pressure; CPT-1, Carnitine-palmitoyl transferase-1; DMSO, Dimethylsulfoxide; FBS, Fetal bovine serum; FFA, Free fatty acids; GLUT1, Glucose transporter 1; IRβ, Insulin receptor-β; IRS-1, Insulin receptor substrate-1; OSA, Obstructive sleep apnea; PBS, Phosphate-buffered saline; PGC1α, Peroxisome proliferator-activated receptor gamma coactivator 1-alpha; PMP70, Peroxisome-specific protein 70; PPAR, Peroxisome proliferator-activated receptors; SLC27A4, Solute carrier family 27 (fatty acid transporter), Member 4; T-PER, Tissue-protein extraction reagent; T2DM, Type 2 diabetes mellitus; UCP2, Uncoupling protein 2.
References
1. Punjabi NM. The epidemiology of adult obstructive sleep apnea. Proc Am Thorac Soc. (2008) 5:136–43. doi: 10.1513/pats.200709-155MG
2. Sánchez-de-la-Torre M, Campos-Rodriguez F, Barbé F. Obstructive sleep apnoea and cardiovascular disease. Lancet Respir Med. (2013) 1:61–72. doi: 10.1016/S2213-2600(12)70051-6
3. Punjabi NM, Caffo BS, Goodwin JL, Gottlieb DJ, Newman AB, O'Connor GT, et al. Sleep-disordered breathing and mortality: a prospective cohort study. PLoS Med. (2009) 6:e1000132. doi: 10.1371/journal.pmed.1000132
4. Briançon-Marjollet A, Weiszenstein M, Henri M, Thomas A, Godin-Ribuot D, Polak J. The impact of sleep disorders on glucose metabolism: endocrine and molecular mechanisms. Diabetol Metab Syndr. (2015) 7:25. doi: 10.1186/s13098-015-0018-3
5. Tasali E, Mokhlesi B, Van Cauter E. Obstructive sleep apnea and type 2 diabetes. Chest (2008) 133:496–506. doi: 10.1378/chest.07-0828
6. Polotsky VY, Li J, Punjabi NM, Rubin AE, Smith PL, Schwartz AR, et al. Intermittent hypoxia increases insulin resistance in genetically obese mice. J Physiol. (2003) 552:253–64. doi: 10.1113/jphysiol.2003.048173
7. Polak J, Shimoda LA, Drager LF, Undem C, McHugh H, Polotsky VY, et al. Intermittent hypoxia impairs glucose homeostasis in C57BL6/J mice: partial improvement with cessation of the exposure. Sleep (2013) 36:1483–90. doi: 10.5665/sleep.3040
8. Xu J, Long Y-S, Gozal D, Epstein PN. Beta-cell death and proliferation after intermittent hypoxia: role of oxidative stress. Free Radic Biol Med. (2009) 46:783–90. doi: 10.1016/j.freeradbiomed.2008.11.026
9. Louis M, Punjabi NM. Effects of acute intermittent hypoxia on glucose metabolism in awake healthy volunteers. J Appl Physiol. (2009) 106:1538–44. doi: 10.1152/japplphysiol.91523.2008
10. Yokoe T, Alonso LC, Romano LC, Rosa TC, O'Doherty RM, Garcia-Ocana A, et al. Intermittent hypoxia reverses the diurnal glucose rhythm and causes pancreatic β-cell replication in mice. J Physiol. (2008) 586:899–911. doi: 10.1113/jphysiol.2007.143586
11. Polak J, Punjabi NM, Shimoda LA. Blockade of endothelin-1 receptor type B ameliorates glucose intolerance in a mouse model of sleep apnea. Front Endocrinol (Lausanne). (2018) 29:280. doi: 10.3389/fendo.2018.00280
12. Chopra S, Rathore A, Younas H, Pham LV, Gu C, Beselman A, et al. Obstructive Sleep apnea dynamically increases nocturnal plasma free fatty acids, glucose, and cortisol during sleep. J Clin Endocrinol Metab. (2017) 102:3172–81. doi: 10.1210/jc.2017-00619
13. Weiszenstein M, Shimoda LA, Koc M, Seda O, Polak J. Inhibition of lipolysis ameliorates diabetic phenotype in a mouse model of obstructive sleep apnea. Am J Respir Cell Mol Biol. (2016) 55:299–307. doi: 10.1165/rcmb.2015-0315OC
14. Jun JC, Drager LF, Najjar SS, Gottlieb SS, Brown CD, Smith PL, et al. Effects of sleep apnea on nocturnal free fatty acids in subjects with heart failure. Sleep (2011) 34:1207–13.
15. Frayn KN, Tan GD, Karpe F. Adipose tissue: a key target for diabetes pathophysiology and treatment? Horm Metab Res. (2007) 39:739–42. doi: 10.1055/s-2007-990270
16. Prentki M, Madiraju SRM. Glycerolipid/free fatty acid cycle and islet β-cell function in health, obesity and diabetes. Mol Cell Endocrinol. (2012) 353:88–100. doi: 10.1016/j.mce.2011.11.004
17. Boden G. Obesity and free fatty acids. Endocrinol Metab Clin North Am. (2008) 37:635–46. doi: 10.1016/j.ecl.2008.06.007
18. Boden G. Obesity, insulin resistance and free fatty acids. Curr Opin Endocrinol Diabetes Obes. (2011) 18:139–43. doi: 10.1097/MED.0b013e3283444b09
19. Weiszenstein M, Musutova M, Plihalova A, Westlake K, Elkalaf M, Koc M, et al. Adipogenesis, lipogenesis and lipolysis is stimulated by mild but not severe hypoxia in 3T3-L1 cells. Biochem Biophys Res Commun. (2016) 478:727–32. doi: 10.1016/j.bbrc.2016.08.015
20. Reinke C, Bevans-Fonti S, Drager LF, Shin M-K, Polotsky VY. Effects of different acute hypoxic regimens on tissue oxygen profiles and metabolic outcomes. J Appl Physiol. (2011) 111:881–90. doi: 10.1152/japplphysiol.00492.2011
21. Wakil SJ, Abu-Elheiga LA. Fatty acid metabolism: target for metabolic syndrome. J Lipid Res. (2009) 50:S138–43. doi: 10.1194/jlr.R800079-JLR200
22. Smith AC, Mullen KL, Junkin KA, Nickerson J, Chabowski A, Bonen A, et al. Metformin and exercise reduce muscle FAT/CD36 and lipid accumulation and blunt the progression of high-fat diet-induced hyperglycemia. Am J Physiol Endocrinol Metab. (2007) 293:E172–81. doi: 10.1152/ajpendo.00677.2006
23. Fulgencio JP, Kohl C, Girard J, Pégorier JP. Effect of metformin on fatty acid and glucose metabolism in freshly isolated hepatocytes and on specific gene expression in cultured hepatocytes. Biochem Pharmacol. (2001) 62:439–46. doi: 10.1016/S0006-2952(01)00679-7
24. Wang Y-X, Lee C-H, Tiep S, Yu RT, Ham J, Kang H, et al. Peroxisome-proliferator-activated receptor delta activates fat metabolism to prevent obesity. Cell (2003) 113:159–70. doi: 10.1016/S0092-8674(03)00269-1
25. Polak J, Studer-Rabeler K, McHugh H, Hussain MA, Shimoda LA. System for exposing cultured cells to intermittent hypoxia utilizing gas permeable cultureware. Gen Physiol Biophys. (2015) 34:235–47. doi: 10.4149/gpb_2014043
26. Pavlikova N, Weiszenstein M, Pala J, Halada P, Seda O, Elkalaf M, et al. The effect of cultureware surfaces on functional and structural components of differentiated 3T3-L1 preadipocytes. Cell Mol Biol Lett. (2015) 20:919–36. doi: 10.1515/cmble-2015-0054
27. Sprecher DL, Massien C, Pearce G, Billin AN, Perlstein I, Willson TM, et al. Triglyceride: high-density lipoprotein cholesterol effects in healthy subjects administered a peroxisome proliferator activated receptor δ agonist. Arterioscler Thromb Vasc Biol. (2007) 27:359–65. doi: 10.1161/01.ATV.0000252790.70572.0c
28. Coll T, Álvarez-Guardia D, Barroso E, Gómez-Foix AM, Palomer X, Laguna JC, et al. Activation of peroxisome proliferator-activated receptor-?? by GW501516 prevents fatty acid-induced nuclear factor-??B activation and insulin resistance in skeletal muscle cells. Endocrinology (2010) 151:1560–9. doi: 10.1210/en.2009-1211
29. Dimopoulos N, Watson M, Green C, Hundal HS. The PPARδ agonist, GW501516, promotes fatty acid oxidation but has no direct effect on glucose utilisation or insulin sensitivity in rat L6 skeletal muscle cells. FEBS Lett. (2007) 581:4743–8. doi: 10.1016/j.febslet.2007.08.072
30. Krämer DK, Al-Khalili L, Guigas B, Leng Y, Garcia-Roves PM, Krook A. Role of AMP kinase and PPARδ in the regulation of lipid and glucose metabolism in human skeletal muscle. J Biol Chem. (2007) 282:19313–20. doi: 10.1074/jbc.M702329200
31. Brunmair B, Staniek K, Dörig J, Szöcs Z, Stadlbauer K, Marian V, et al. Activation of PPAR-delta in isolated rat skeletal muscle switches fuel preference from glucose to fatty acids. Diabetologia (2006) 49:2713–22. doi: 10.1007/s00125-006-0357-6
32. Samuel SM, Ghosh S, Majeed Y, Arunachalam G, Emara MM, Ding H, et al. Metformin represses glucose starvation induced autophagic response in microvascular endothelial cells and promotes cell death. Biochem Pharmacol. (2017) 132:118–32. doi: 10.1016/j.bcp.2017.03.001
33. Kim JH, Lee KJ, Seo Y, Kwon J-H, Yoon JP, Kang JY, et al. Effects of metformin on colorectal cancer stem cells depend on alterations in glutamine metabolism. Sci Rep. (2018) 8:409. doi: 10.1038/s41598-017-18762-4
34. Hundal HS, Ramlal T, Reyes R, Leiter LA, Klip A. Cellular mechanism of metformin action involves glucose transporter translocation from an intracellular pool to the plasma membrane in l6 muscle cells. Endocrinology (1992) 131:1165–73. doi: 10.1210/endo.131.3.1505458
35. Kajbaf F, De Broe ME, Lalau JD. Therapeutic concentrations of metformin: a systematic review. Clin Pharmacokinet. (2016) 55:439–59. doi: 10.1007/s40262-015-0323-x
36. Polak J, Beamer BA, Punjabi NM. Obstructive sleep apnea and glucose metabolism. In: Pack AI, editor. Sleep Apnea: Pathogenesis, Diagnosis and Treatment. New York, NY: Informa Healthcare (2002). p. 300–17.
37. Gottlieb DJ, Punjabi NM, Newman AB, Resnick HE, Redline S, Baldwin CM, et al. Association of sleep time with diabetes mellitus and impaired glucose tolerance. Arch Intern Med. (2005) 165:863–7. doi: 10.1001/archinte.165.8.863
38. Jun JC, Polotsky VY. Are we waking up to the effects of NEFA? Diabetologia (2015) 58:651–3. doi: 10.1007/s00125-014-3489-0
39. Wilding JPH. The importance of free fatty acids in the development of Type 2 diabetes. Diabet Med. (2007) 24:934–45. doi: 10.1111/j.1464-5491.2007.02186.x
40. Barceló A, Piérola J, de la Peña M, Esquinas C, Fuster A, Sanchez-de-la-Torre M, et al. Free fatty acids and the metabolic syndrome in patients with obstructive sleep apnoea. Eur Respir J. (2011) 37:1418–23. doi: 10.1183/09031936.00050410
41. Falholt K, Jensen I, Lindkaer Jensen S, Mortensen H, Vølund A, Heding LG, et al. Carbohydrate and lipid metabolism of skeletal muscle in type 2 diabetic patients. Diabet Med. (1988) 5:27–31. doi: 10.1111/j.1464-5491.1988.tb00936.x
42. Standl E, Lotz N, Dexel T, Janka HU, Kolb HJ. Muscle triglycerides in diabetic subjects. Effect of insulin deficiency and exercise. Diabetologia (1980) 18:463–9.
43. Colberg SR, Simoneau JA, Thaete FL, Kelley DE. Skeletal muscle utilization of free fatty acids in women with visceral obesity. J Clin Invest. (1995) 95:1846–53. doi: 10.1172/JCI117864
44. He J, Watkins S, Kelley DE. Skeletal muscle lipid content and oxidative enzyme activity in relation to muscle fiber type in type 2 diabetes and obesity. Diabetes (2001) 50:817–23. doi: 10.2337/diabetes.50.4.817
45. Wang GL, Jiang BH, Rue EA, Semenza GL. Hypoxia-inducible factor 1 is a basic-helix-loop-helix-PAS heterodimer regulated by cellular O2 tension. Proc Natl Acad Sci USA. (1995) 92:5510–4. doi: 10.1073/pnas.92.12.5510
46. Jiang BH, Semenza GL, Bauer C, Marti HH. Hypoxia-inducible factor 1 levels vary exponentially over a physiologically relevant range of O2 tension. Am J Physiol. (1996) 271:C1172–80. doi: 10.1152/ajpcell.1996.271.4.C1172
47. Chabowski A, Coort SLM, Calles-Escandon J, Tandon NN, Glatz JFC, Luiken JJFP, et al. Insulin stimulates fatty acid transport by regulating expression of FAT/CD36 but not FABPpm. Am J Physiol Endocrinol Metab. (2004) 287:E781–9. doi: 10.1152/ajpendo.00573.2003
48. Luiken JJFP, Coort SLM, Willems J, Coumans WA, Bonen A, van der Vusse GJ, et al. Contraction-induced fatty acid translocase/CD36 translocation in rat cardiac myocytes is mediated through AMP-activated protein kinase signaling. Diabetes (2003) 52:1627–34. doi: 10.2337/diabetes.52.7.1627
49. McFarlan JT, Yoshida Y, Jain SS, Han X-X, Snook LA, Lally J, et al. In vivo, fatty acid translocase (CD36) critically regulates skeletal muscle fuel selection, exercise performance, and training-induced adaptation of fatty acid oxidation. J Biol Chem. (2012) 287:23502–16. doi: 10.1074/jbc.M111.315358
50. Doege H, Stahl A. Protein-mediated fatty acid uptake: novel insights from in vivo models. Physiology (2006) 21:259–68. doi: 10.1152/physiol.00014.2006
51. Semenza GL. Regulation of metabolism by hypoxia-inducible factor 1. Cold Spring Harb Symp Quant Biol. (2011) 76:347–53. doi: 10.1101/sqb.2011.76.010678
52. Chabowski A, Górski J, Calles-Escandon J, Tandon NN, Bonen A. Hypoxia-induced fatty acid transporter translocation increases fatty acid transport and contributes to lipid accumulation in the heart. FEBS Lett. (2006) 580:3617–23. doi: 10.1016/j.febslet.2006.05.045
53. Mishima T, Miner JH, Morizane M, Stahl A, Sadovsky Y. The expression and function of fatty acid transport protein-2 and−4 in the murine placenta. PLoS ONE (2011) 6:e25865. doi: 10.1371/journal.pone.0025865
54. Mwaikambo BR, Yang C, Chemtob S, Hardy P. Hypoxia up-regulates CD36 expression and function via hypoxia-inducible factor-1- and phosphatidylinositol 3-kinase-dependent mechanisms. J Biol Chem. (2009) 284:26695–707. doi: 10.1074/jbc.M109.033480
55. Heinonen I, Kemppainen J, Kaskinoro K, Peltonen JE, Sipilä HT, Nuutila P, et al. Effects of adenosine, exercise, and moderate acute hypoxia on energy substrate utilization of human skeletal muscle. Am J Physiol Integr Comp Physiol. (2012) 302:R385–90. doi: 10.1152/ajpregu.00245.2011
56. Jun JC, Drager LF, Najjar SS, Gottlieb SS, Brown CD, Smith PL, et al. Effects of sleep apnea on nocturnal free fatty acids in subjects with heart failure. Sleep (2011) 34:1207–13.
57. Belaiba RS, Bonello S, Zahringer C, Schmidt S, Hess J, Kietzmann T, et al. Hypoxia up-regulates hypoxia-inducible factor-1alpha transcription by involving phosphatidylinositol 3-kinase and nuclear factor kappaB in pulmonary artery smooth muscle cells. Mol Biol Cell (2007) 18:4691–7. doi: 10.1091/mbc.e07-04-0391
58. Bagnall J, Leedale J, Taylor SE, Spiller DG, White MRH, Sharkey KJ, et al. Tight control of hypoxia-inducible factor-α transient dynamics is essential for cell survival in hypoxia. J Biol Chem. (2014) 289:5549–64. doi: 10.1074/jbc.M113.500405
59. Horscroft JA, Murray AJ. Skeletal muscle energy metabolism in environmental hypoxia: climbing towards consensus. Extrem Med. (2014) 3:19. doi: 10.1186/2046-7648-3-19
60. Roberts AC, Butterfield GE, Cymerman A, Reeves JT, Wolfel EE, Brooks GA. Acclimatization to 4,300-m altitude decreases reliance on fat as a substrate. J Appl Physiol. (1996) 81:1762–71. doi: 10.1152/jappl.1996.81.4.1762
61. Horscroft JA, Burgess SL, Hu Y, Murray AJ. Altered oxygen utilisation in rat left ventricle and soleus after 14 days, but not 2 days, of environmental hypoxia. PLoS ONE (2015) 10:e0138564. doi: 10.1371/journal.pone.0138564
62. Morash AJ, Kotwica AO, Murray AJ. Tissue-specific changes in fatty acid oxidation in hypoxic heart and skeletal muscle. Am J Physiol Integr Comp Physiol. (2013) 305:R534–41. doi: 10.1152/ajpregu.00510.2012
63. Viganò A, Ripamonti M, De Palma S, Capitanio D, Vasso M, Wait R, et al. Proteins modulation in human skeletal muscle in the early phase of adaptation to hypobaric hypoxia. Proteomics (2008) 8:4668–79. doi: 10.1002/pmic.200800232
64. Green HJ, Sutton JR, Cymerman A, Young PM, Houston CS. Operation everest II: adaptations in human skeletal muscle. J Appl Physiol. (1989) 66:2454–61. doi: 10.1152/jappl.1989.66.5.2454
65. Levett DZ, Radford EJ, Menassa DA, Graber EF, Morash AJ, Hoppeler H, et al. Acclimatization of skeletal muscle mitochondria to high-altitude hypoxia during an ascent of Everest. FASEB J. (2012) 26:1431–41. doi: 10.1096/fj.11-197772
66. Esteves P, Pecqueur C, Ransy C, Esnous C, Lenoir V, Bouillaud F, et al. Mitochondrial retrograde signaling mediated by UCP2 inhibits cancer cell proliferation and tumorigenesis. Cancer Res. (2014) 74:3971–82. doi: 10.1158/0008-5472.CAN-13-3383
67. Pecqueur C, Bui T, Gelly C, Hauchard J, Barbot C, Bouillaud F, et al. Uncoupling protein-2 controls proliferation by promoting fatty acid oxidation and limiting glycolysis-derived pyruvate utilization. FASEB J. (2008) 22:9–18. doi: 10.1096/fj.07-8945com
68. Jun JC, Shin M-K, Yao Q, Bevans-Fonti S, Poole J, Drager LF, et al. Acute hypoxia induces hypertriglyceridemia by decreasing plasma triglyceride clearance in mice. AJP Endocrinol Metab. (2012) 303:E377–88. doi: 10.1152/ajpendo.00641.2011
69. Pepino MY, Kuda O, Samovski D, Abumrad NA. Structure-function of CD36 and importance of fatty acid signal transduction in fat metabolism. Annu Rev Nutr. (2014) 34:281–303. doi: 10.1146/annurev-nutr-071812-161220
70. Shaw JE, Punjabi NM, Naughton MT, Willes L, Bergenstal RM, Cistulli PA, et al. The effect of treatment of obstructive sleep apnea on glycemic control in type 2 diabetes. Am J Respir Crit Care Med. (2016) 194:486–92. doi: 10.1164/rccm.201511-2260OC
71. Lindberg E, Berne C, Elmasry A, Hedner J, Janson C. CPAP treatment of a population-based sample-what are the benefits and the treatment compliance? Sleep Med. (2006) 7:553–60. doi: 10.1016/j.sleep.2005.12.010
72. Aguer C, Foretz M, Lantier L, Hebrard S, Viollet B, Mercier J, et al. Increased FAT/CD36 cycling and lipid accumulation in myotubes derived from obese type 2 diabetic patients. PLoS ONE (2011) 6:e28981. doi: 10.1371/journal.pone.0028981
73. Musi N, Hirshman MF, Nygren J, Svanfeldt M, Bavenholm P, Rooyackers O, et al. Metformin increases AMP-activated protein kinase activity in skeletal muscle of subjects with type 2 diabetes. Diabetes (2002) 51:2074–81. doi: 10.2337/diabetes.51.7.2074
74. Zhou G, Myers R, Li Y, Chen Y, Shen X, Fenyk-Melody J, et al. Role of AMP-activated protein kinase in mechanism of metformin action. J Clin Invest. (2001) 108:1167–74. doi: 10.1172/JCI13505
75. Owen MR, Doran E, Halestrap AP. Evidence that metformin exerts its anti-diabetic effects through inhibition of complex 1 of the mitochondrial respiratory chain. Biochem J. (2000) 348 Pt 3:607–14.
76. El-Mir MY, Nogueira V, Fontaine E, Avéret N, Rigoulet M, Leverve X. Dimethylbiguanide inhibits cell respiration via an indirect effect targeted on the respiratory chain complex I. J Biol Chem. (2000) 275:223–8. doi: 10.1074/jbc.275.1.223
77. Hübinger A, Weikert G, Wolf HP, Gries FA. The effect of etomoxir on insulin sensitivity in type 2 diabetic patients. Horm Metab Res. (1992) 24:115–8. doi: 10.1055/s-2007-1003271
78. Hübinger A, Knode O, Susanto F, Reinauer H, Gries FA. Effects of the carnitine-acyltransferase inhibitor etomoxir on insulin sensitivity, energy expenditure and substrate oxidation in NIDDM. Horm Metab Res. (1997) 29:436–9. doi: 10.1055/s-2007-979072
79. Yin J, Gao Z, He Q, Zhou D, Guo Z, Ye J. Role of hypoxia in obesity-induced disorders of glucose and lipid metabolism in adipose tissue. Am J Physiol Endocrinol Metab. (2009) 296:E333–42. doi: 10.1152/ajpendo.90760.2008
80. Caron M-A, Thériault M-E, Paré M-È, Maltais F, Debigaré R. Hypoxia alters contractile protein homeostasis in L6 myotubes. FEBS Lett. (2009) 583:1528–34. doi: 10.1016/j.febslet.2009.04.006
81. Wanders RJA, Waterham HR. Biochemistry of mammalian peroxisomes revisited. Annu Rev Biochem. (2006) 75:295–332. doi: 10.1146/annurev.biochem.74.082803.133329
82. Walter KM, Schönenberger MJ, Trötzmüller M, Horn M, Elsässer H-P, Moser AB, et al. Hif-2α promotes degradation of mammalian peroxisomes by selective autophagy. Cell Metab. (2014) 20:882–97. doi: 10.1016/j.cmet.2014.09.017
Keywords: hypoxia, myotubes, free fatty acids, FFA oxidation, FFA uptake, metformin, GW501516, CD36 receptor
Citation: Musutova M, Elkalaf M, Klubickova N, Koc M, Povysil S, Rambousek J, Volckaert B, Duska F, Trinh MD, Kalous M, Trnka J, Balusikova K, Kovar J and Polak J (2018) The Effect of Hypoxia and Metformin on Fatty Acid Uptake, Storage, and Oxidation in L6 Differentiated Myotubes. Front. Endocrinol. 9:616. doi: 10.3389/fendo.2018.00616
Received: 13 March 2018; Accepted: 27 September 2018;
Published: 17 October 2018.
Edited by:
Anca Dana Dobrian, Eastern Virginia Medical School, United StatesReviewed by:
Penghua Fang, Nanjing University of Chinese Medicine, ChinaMichaela Tencerova, University of Southern Denmark Odense, Denmark
Copyright © 2018 Musutova, Elkalaf, Klubickova, Koc, Povysil, Rambousek, Volckaert, Duska, Trinh, Kalous, Trnka, Balusikova, Kovar and Polak. This is an open-access article distributed under the terms of the Creative Commons Attribution License (CC BY). The use, distribution or reproduction in other forums is permitted, provided the original author(s) and the copyright owner(s) are credited and that the original publication in this journal is cited, in accordance with accepted academic practice. No use, distribution or reproduction is permitted which does not comply with these terms.
*Correspondence: Jan Polak, amFuLnBvbGFrQGxmMy5jdW5pLmN6